

Abstract
Background
Genes encoding proteins underlying host-pathogen co-evolution and which are selected for new resistance specificities frequently are under positive selection, a process that maintains diversity. Here, we tested the contribution of natural selection, recombination and transcriptional divergence to the evolutionary diversification of the plant defensins superfamily in three Arabidopsis species. The intracellular NOD-like receptor (NLR) family was used for comparison because positive selection has been well documented in its members. Similar to defensins, NLRs are encoded by a large and polymorphic gene family and many of their members are involved in the immune response.
Results
Gene trees of Arabidopsis defensins (DEFLs) show a high prevalence of clades containing orthologs. This indicates that their diversity dates back to a common ancestor and species-specific duplications did not significantly contribute to gene family expansion. DEFLs are characterized by a pervasive pattern of neutral evolution with infrequent positive and negative selection as well as recombination. In comparison, most NLR alignment groups are characterized by frequent occurrence of positive selection and recombination in their leucine-rich repeat (LRR) domain as well negative selection in their nucleotide-binding (NB-ARC) domain. While major NLR subgroups are expressed in pistils and leaves both in presence or absence of pathogen infection, the members of DEFL alignment groups are predominantly transcribed in pistils. Furthermore, conserved groups of NLRs and DEFLs are differentially expressed in response to Fusarium graminearum regardless of whether these genes are under positive selection or not.
Conclusions
The present analyses of NLRs expands previous studies in Arabidopsis thaliana and highlights contrasting patterns of purifying and diversifying selection affecting different gene regions. DEFL genes show a different evolutionary trend, with fewer recombination events and significantly fewer instances of natural selection. Their heterogeneous expression pattern suggests that transcriptional divergence probably made the major contribution to functional diversification. In comparison to smaller families encoding pathogenesis-related (PR) proteins under positive selection, DEFLs are involved in a wide variety of processes that altogether might pose structural and functional trade-offs to their family-wide pattern of evolution.
Electronic supplementary material
The online version of this article (10.1186/s12862-017-1099-4) contains supplementary material, which is available to authorized users.
Keywords: NLR, NBS-LRR, Cysteine-rich peptide, Defensin, Natural selection, Gene recombination, Molecular evolution, Arabidopsis, Fusarium, RNA-seq
Background
Disease resistance in plants results from antagonistic cycles of selection involving pathogen effectors and host targets. Therefore, determining how this co-evolutionary interplay may affect large gene families involved in defense responses is essential to understand their role in the evolution or abrogation of resistance. This insight might then be used to guide the development of resistant crop varieties and strategies to counteract pathogen infection.
Molecular evolution analyses of genes involved in pattern triggered immunity (PTI) and effector triggered immunity (ETI) have shown that those encoding proteins involved in host-pathogen interactions frequently have a higher proportion of non-synonymous to synonymous substitutions. This pattern is known as positive selection and is indicative of host-pathogen co-evolution and selection for new resistance specificities [1]. PTI is based on recognition of conserved molecular patterns like flagellin or chitin from the pathogen by receptor-like kinases (RLKs) from the host. Upon infection, pathogens suppress PTI by secreting effectors to modulate the plant defenses and establish infection. ETI is based on intracellular detection of these effector molecules by NOD-like receptors (NLRs) (Fig. 1). Signatures of positive selection identified in NLRs and RLKs, suggest that the frequent amino acid replacements favor detection of a changing variety of pathogen molecules [2, 3]. In comparison, molecules mediating the signaling pathways triggered by these receptors show little evidence of diversifying evolution, indicating that pathogen effectors generally do not target them or their evolution is functionally constrained [4], for exceptions see [5, 6]. Subsequent immune responses involves among other processes, the transcription of pathogenesis-related (PR) genes encoding a diverse group of inhibitors of pathogen growth and fitness (Fig. 1). Among them, there are several families where positive selection has been consistently detected, namely chitinases [7, 8], β-1,3-endoglucanases [9], polygalacturonase inhibitor proteins (PGIPs) [10] and thaumatin-like proteins [11]. Defensins and defensin-like genes (collectively named DEFLs) are one of the largest and most diverse PR-gene family [12]. The prevalence of positive selection in animal defensins and initial studies of some groups of plant DEFLs [13] implied a high level of polymorphism of plant DEFLs, which is also driven by co-evolution with diverse pathogen targets. However more recent studies in monocots did not find evidences of diversifying evolution [14, 15].
Fig. 1.
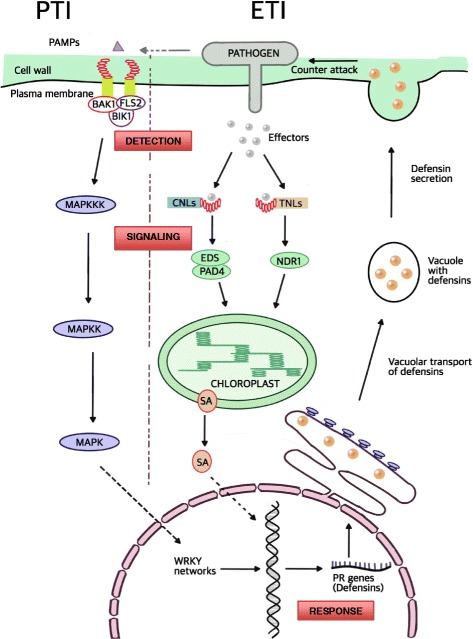
Outline of the major phases of plant immune responses. Pathogen detection can take place through direct interactions between pathogen-associated molecular patterns (PAMPs) and transmembrane receptor-like kinases RLKs or pathogen effectors and intracellular NLRs (CNLs and TNLs). After detection CNLs and TNLs trigger different signaling pathways: the pathway activated by PAMP binding involves a cascade of mitogen-activated protein kinases (MAPKs) and activation of WRKY transcription factors. A second pathway is activated by cytoplasmic proteins EDS1, PAD4, NDR1 and salicylic acid (SA). Both pattern triggered immunity (PTI) and effector triggered immunity (ETI) pathways result in a response where pathogenesis-related (PR) genes are upregulated. These include genes encoding defensins, chitinases, β-1,3-glucanases, protease inhibitors and lipid transfer proteins. As an example, transportation and secretion of defensins, which like other PR proteins have pathogen-killing activity, is indicated
DEFLs are particularly intriguing because in addition to their involvement in the innate immune responses, many members of this family play key roles in reproduction, response to stress and heavy metal tolerance (reviewed in [16]). However the evolutionary mechanisms leading to this so-called functional promiscuity are not yet clear [17]. For example, DEFL SCRs are involved in self-incompatibility [18], while LUREs, another DEFL subgroup, are secreted by ovules to attract competent pollen tubes of their own species during pollination [19]. Many DEFLs of these and other subgroups are differentially expressed also in the immune responses to Fusarium graminearum [20]. Similarly, the Capsicum annum defensin CADEF1 is expressed in response to both biotic and abiotic stresses [21] while antimicrobial PDF1s form Arabidopsis thaliana more closely related to DEFLs that confer heavy metal tolerance in Arabidopsis halleri [22].
In this study, we compare the evolutionary dynamics of DEFLs with those of NLRs with the aim of determining the relative contribution of positive natural selection, recombination and transcriptional divergence to the evolution of both families. The rationale underlying this comparison is that diversifying evolution is well documented in NLRs in Arabidopsis [2, 23], thus making this family an informative control and point of reference for investigating the molecular evolution of DEFLs. Both families comprise between 100 to more than 300 highly polymorphic members, many of which form clusters of tandemly duplicated genes [24, 25]. Moreover, the recently improved annotation methods for NLRs and DEFLs as well as the availability of completely sequenced genomes of several Arabidopsis species facilitates the comparative analyses of their molecular evolution and transcriptional divergence [12, 26, 27]. The latter process is particularly relevant to understand the diversification of both families because their members frequently transposed (moved from one position in the genome to another) frequently in the aftermath of two whole genome duplication events [28]. After transposition paralogs lost some of their cis-regulatory elements, which eventually might facilitate gene sub- or neofunctionalzation by transcriptional divergence.
Apart from the fact that NLRs and DEFLs are encoded by large polymorphic gene families and play key role in immune responses, they are otherwise very different. NLRs encode cytoplasmic proteins with a molecular weight over 100 kDa, they contain a nucleotide-binding domain, one or more leucine-rich repeats (LRRs) and are divided in two subclasses according to their N-terminal domain: CNLs have a coil-coil domain and TNLs possess a TIR domain. In contrast, DEFLs are small, secreted peptides with an N-terminal signal peptide and a charged or polar mature cysteine-rich domain of about 5 kDa. Three to four conserved disulfide bridges are essential to stabilize a tertiary structure comprised of an α-helix and several antiparallel β-sheets. Given the significant sequence variation of DEFLs, they have been divided in several subgroups based on their pattern of cysteines as well as other motifs [12].
Our approach to investigate the molecular evolution of DEFLs differs from previous studies in that the members of the family are further divided in subgroups of reliably aligned sequences with an identity of at least 50%. These alignment groups were tested to exclude third codon position saturation and recombination because they interfere with the detection of positive selection. We tested the contribution of transcriptional divergence to the evolution of both families by characterizing their expression in pistils and leaves infected with Fusarium graminearum, a heterotrophic flower-infecting fungus responsible for cereal head blight. This approach was based on the finding that DEFLs are predominantly expressed in reproductive tissues [29] as well as in response to pathogens and pollination [20].
Results
Annotation and phylogeny of NLRs in three Arabidopsis species
Among the proteins with a nucleotide-binding site (NBS), NLRs form a distinct subgroup characterized by containing a C-terminal region of leucine-rich repeats (LRRs) [30, 31]. Based on the presence of either a Toll-Interleukin-1 Receptor (TIR) homology region or a coil-coil (CC) motif in the N-terminal region, NLRs are further subdivided in two major groups known as TNLs or CNLs, respectively [32]. The presence and order of these characteristic domains guided previous annotations of NLR genes in a large number of plant species including Arabidopsis spp. (e.g. [25, 33, 34]). Because differences in annotation approaches hamper proper interspecific comparison of the members of a gene family, we used NLR-Parser [27] with identical settings to consistently re-annotate the set of NLRs from Arabidopsis thaliana, Arabidopsis lyrata and Arabidopsis halleri. NLR-Parser is based on Hidden Markov Models and has been tested for A. thaliana and successfully applied to other plant species [35, 36]. We repeated NLR identification in A. thaliana and confirmed the presence of 265 NLRs, of which 124 appear to be complete as defined by NLR-Parser, e.g. having at least a NBS, and either a CC/TIR as well as more than one LRR. It should be noted that also “partial” NLRs have been shown to be potentially functional [37] in defense signaling and therefore were included in the analysis. In A. lyrata we identified a total of 247 putative NLRs, which is an increase of 62 over the latest annotation [23, 38], and is closer to the number of NLRs identified in A. thaliana. In A. halleri our approach identified 208 putative NLRs. In all species, the majority of complete NLRs identified belong to the TNL class: 66% in A. thaliana, 63% in A. lyrata and 52% in A. halleri, respectively. Note that previous studies classified all genes with one or more LRR and/or one of the other domains as putative NLR and used percentage coverage as a measure of completeness, whereas NLR-Parser searches for genes with multiple domains in the right order. Genes with less than two LRR domains are annotated as partial, thus lowering the number of total genes and putative complete genes. Sequence IDs for all putative NLR in A. lyrata, A. halleri and A. thaliana are listed in Additional file 1: Data 1.
To assess the selective pressures on closely related NLRs, we generated so-called sequence groups using several iterative rounds of phylogenetic reconstruction as previously described [2]. In total 115 CNLs and 245 TNLs were aligned, excluding sequences that introduced gaps spanning over 25% of the length of the alignment. The resulting multiple sequence alignments were employed to infer the ML gene tree of each NLR subfamily (Fig. 2, Additional file 2: Figure S1, Additional file 3: Data 2 and Additional file 4: Data 3). As indicated in the figures, the trees inferred for both CNLs and TNLs based on alignments of members from all three species provide high statistic support to major phylogenetic clades identified by previous analyses of A. thaliana NLRs [25].
Fig. 2.
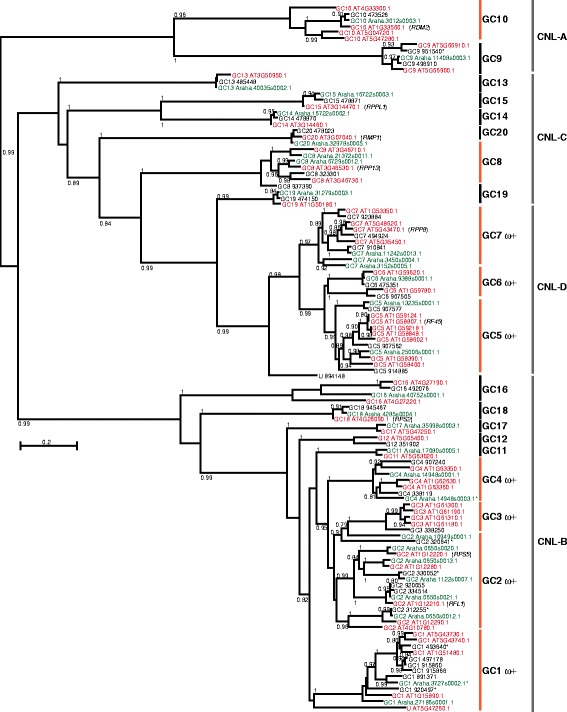
Maximum likelihood gene tree of re-annotated complete and partial CNL genes from three Arabidopsis species. This gene tree was inferred from the alignment of coding sequences obtained with MAFFT, where only those reliably aligned columns with a GUIDANCE2 confidence score > 0.93 were employed. The most appropriate nucleotide substitution model was selected with program SMS and the maximum likelihood phylogenies was inferred with PhyML 3.0. The numbers on every node indicate posterior probabilities >0.70 supporting the phylogenetic relationships inferred. The clades employed for defining alignment groups (GC1 to GC20) are outlined with the first column of bars on the right of the gene tree. After evaluation of similarity levels and third codon position saturation, only sequences from groups indicated with orange bars where further investigated. Among them, clades indicated with ω + reported significant evidences of positive selection. This gene tree recovered the clades CNL-A to CNL-D identified in the first published phylogeny of A. thaliana CNLs [25], here they are indicated with a second column of bars on the right of the gene tree. Color-coding of sequence IDs indicates Arabidopsis halleri in green, Arabidopsis lyrata in black and Arabidopsis thaliana in red. The names of defense genes reported in the literature are indicated in parenthesis
The overall evolutionary trend in both subfamilies consists of clades with representatives from each taxon, most of them following the phylogenetic relationships of the species: A. lyrata and A. halleri are closer to each other and A. thaliana is their sister group [39]. However, we identified some sequence subgroups with species-specific duplications, like GC3 and GC5 (Fig. 2) or GT5, GT6 and GT11 (Additional file 2: Figure S1).
The best-supported clades of each subfamily tree were the basis to distinguish 20 CNL and 46 TNL groups of closely related genes to investigate the molecular evolution of the family using the complete coding sequences (Table 1, Fig. 2, Additional file 2: Figure S1). In these groups, we determined that the third codon position was not saturated, the pairwise p-distance was ≤0.5 and sequences with large gaps were eliminated. The threshold value for phylogenetic distance is based on the observation that at higher values multiple substitutions often cause sequences to resemble each other by chance, thus negatively affecting the correct inference of molecular phylogenies and rates of evolution [40]. This evaluation yielded 10 CNL and 15 TNL groups with five or more sequences that were suitable for follow-up analyses (Tables 1, 2 and Additional file 5: Data 4). Of all sequence groups, 11 contain NLRs described in the literature for their role in immunity.
Table 1.
Total number of members per gene family and species
| DEFLs | CNLs | TNLs | |
|---|---|---|---|
| Members | 821 | 115 | 245 |
| A. thaliana | 285 | 50 | 89 |
| A. lyrata | 315 | 36 | 100 |
| A. halleri | 222 | 29 | 56 |
| Groups | 156 | 20 | 46 |
| Groups analyzeda | 47 (47%) | 9 (62%) | 15 (58%) |
| Singletons | 31 | 2 | 20 |
In parenthesis is the percentage of the total number of sequences comprised by these groups
aOnly DEFL groups ≥6 sequences or CNLs and TNLs ≥5 sequences were analyzed
Table 2.
Groups of NLRs analyzed for natural selection
| Groupa | Sequences | Lengthb | Known R-genes |
|---|---|---|---|
| GC1 | 9 | 2580 | |
| GC2 | 13 | 2697 | RFL1, RPS5 |
| GC3 | 5 | 2757 | |
| GC4 | 6 | 3213 | |
| GC5 | 12 | 2784 | RF45, RDL5 |
| GC6 | 5 | 2808 | |
| GC7 | 10 | 2871 | RPP8, RPP8L2, RPP8L3, RPP8L4 |
| GC8 | 7 | 2643 | RPP13, RPP13L2, RPP13L3 |
| GC10 | 5 | 2962 | ADR1, RDM2 |
| 8 (±3.12)c | 2812.78 (±189.14) | ||
| GT1 | 21 | 3616 | ADR2, RML1A, RML1B |
| GT2 | 8 | 3171 | |
| GT3 | 13 | 4608 | |
| GT5 | 6 | 3957 | |
| GT6 | 11 | 3363 | |
| GT7 | 5 | 2754 | |
| GT10 | 21 | 2487 | VICTR |
| GT11 | 9 | 5031 | RPP4, RPP5, SNC1 |
| GT12 | 5 | 3168 | |
| GT14 | 8 | 3633 | TTR1, RRS1 |
| GT15 | 7 | 3972 | |
| GT19 | 11 | 3558 | RPS4 |
| GT21 | 6 | 3825 | |
| GT22 | 6 | 3495 | RPP1 |
| GT32 | 5 | 3444 | |
| 9.47 (± 5.27)c | 3605.46 (±643.62) |
aOnly groups with five or more sequences were analyzed. Group designation is arbitrary
bTotal length of multiple sequence nucleotide alignment including positions with indels
cAverage and sample standard deviation
Grouping of DEFLs based on CRP classification
Cysteine-rich peptides (CRPs) are up to 170 amino acid residues in length including an N-terminal signal peptide for localization to the secretory pathway followed by a small, divergent charged or polar mature peptide domain with at an even number of conserved cysteine residues. Previously CRPs of Arabidopsis thaliana have been divided in groups according to sequence motif models involving distinct patterns of cysteine motifs [12]. Defensins and defensin-like peptides (DEFLs) are a class of CRPs common in all eukaryotes. Plant immature DEFL consist of about 70 amino acid residues including an N-terminal signal peptide and a charged or polar mature cysteine-rich domain. DEFLs are further characterized by four conserved disulfide bridges that stabilize a conserved tertiary structure comprised of an α-helix and several antiparallel β-sheets. Given the significant sequence variation of DEFLs, they have been divided in several CRP groups based on their pattern of cysteine residues as well as other conserved motifs [12]. In this study, we identified DEFLs of A. lyrata and A. halleri based on a previously published CRP annotation which assigned the highly diverse A. thaliana DEFLs to 46 CRP groups (CRP0000 to CRP1520), each of them having a specific cysteine motif [26, 29]. This approach to classify DEFLs was helpful to identify further members from A. thaliana, A. lyrata and A. halleri (see Methods for details). However interspecific sequence alignments comprising genes of a given CRP group includes highly diverse sequences, such that their pairwise p-distances are above the cutoff 0.5 and their third codon positions are saturated. Because these factors have negative effects on analyses of molecular evolution, we further divided the 46 CRP groups including sequences from all three Arabidopsis species, into smaller alignments where pairwise p-distance ≤0.5 and third codon positions are not significantly saturated (Additional file 5: Data 4). Sequence regrouping generated 46 alignments with at least six sequences each and an average length of 282 bp (Tables 1, 3 and Additional file 5: Data 4). Alignments with fewer sequences (Additional file 1: Data 1), were not considered for analyses of molecular evolution because initial runs in codeml and FUBAR showed that they rarely yielded statistically significant signals of natural selection. However, assessment of gene trees for 112 alignment groups with three or more members showed a high prevalence of clades containing sequences of the three species. Among them there were only five groups with clades comprised of species-specific duplications, most of them involving A. lyrata sequences. The only alignment groups with clades exclusively formed of A. thaliana or A. lyrata sequences are S1, S26 and S57 (Additional file 6: Figure S2A), which contain LUREs, well-characterized genes encoding peptides involved in species-preferential pollen tube attraction during fertilization [19]. Although some A. halleri sequences are part of these alignment groups, they are not part of species-specific duplications. Among other groups containing known functionally divergent genes are S119 and S120 encoding A. thaliana PDF1 antimicrobial defensins and heavy-metal tolerance factor AhDEF1.3 (also known as AhDEF1.2b) and AhDEF1.4 respectively. Notably, despite documented differences of gene functions, at the sequence level they are very similar and belong in clades where all three species are represented (Additional file 6: Figure S2B).
Table 3.
Groups of DEFLs analyzed for natural selection
| Groupa | Sequences | Lengthb | CRP groups includedc | Known DEFL-genesd |
|---|---|---|---|---|
| S117 | 9 | 267 | CRP0000 | LCR76, LCR75 |
| S116 | 13 | 249 | CRP0000 | PDF2.4, PDF2.2, PDF2.1, PDF2.3,PDF2.6 |
| S44 | 8 | 279 | CRP0220 | |
| S19 | 9 | 267 | CRP0220 | |
| S114 | 10 | 249 | CRP0240 | |
| S125 | 6 | 300 | CRP0260 | |
| S107 | 6 | 249 | CRP0300 | |
| S94 | 8 | 243 | CRP0300 | |
| S89 | 9 | 285 | CRP0300 | |
| S95 | 9 | 249 | CRP0300 | |
| S100 | 9 | 273 | CRP0300 | |
| S43 | 7 | 294 | CRP0340 | LCR85 |
| S78 | 8 | 255 | CRP0360 | |
| S87 | 8 | 327 | CRP0360 | |
| S81 | 9 | 282 | CRP0360 | |
| S6 | 7 | 228 | CRP0500 | |
| S8 | 10 | 240 | CRP0500 | LCR52, LCR53, LCR55, LCR56 |
| S132 | 7 | 240 | CRP0500, CRP0560 | LCR3, LCR6, LCR20 |
| S130 | 7 | 315 | CRP0570 | LCR11, LCR17 |
| S12 | 6 | 237 | CRP0580 | LCR24, LCR37, LCR38 |
| S13 | 9 | 231 | CRP0580 | LCR25, LCR26, LCR27 |
| S65 | 17 | 264 | CRP0580 | LCR21, LCR22, LCR23, LCR35, LCR36 |
| S25 | 11 | 273 | CRP0660 | LCR60, LCR61, LCR62, LCR63 |
| S17 | 10 | 396 | CRP0670 | PDF3.1, PDF3.2, LCR57, LCR58 |
| S9 | 12 | 261 | CRP0680 | LCR18, LCR39, LCR40, LCR41, LCR42 |
| S124 | 15 | 318 | CRP0700 | ATTI1, ATTI2, ATTI3, ATTI4 |
| S126 | 6 | 240 | CRP0770 | |
| S42 | 7 | 261 | CRP0770 | |
| S57 | 7 | 294 | CRP0810 | |
| S1 | 8 | 357 | CRP0810 | |
| S26 | 9 | 288 | CRP0810 | LURE1.2, LURE1.3, LURE1.4, LURE1.5 |
| S54 | 6 | 270 | CRP0830 | SCRL24, SCRL25 |
| S63 | 7 | 315 | CRP0830 | SCRL17, SCRL18, SCRL19 |
| S56 | 8 | 282 | CRP0830 | SCRL1, SCRL2 |
| S62 | 6 | 291 | CRP0860 | SCRL12, SCRL13 |
| S28 | 10 | 390 | CRP0860 | SCRL4, SCRL5, SCRL6, SCRL7, SCRL8 |
| S122 | 8 | 270 | CRP0920 | |
| S2 | 6 | 312 | CRP0940 | |
| S70 | 9 | 276 | CRP0940 | |
| S82 | 6 | 252 | CRP0960 | |
| S73 | 9 | 264 | CRP0960 | |
| S109 | 6 | 255 | CRP0980 | |
| S71 | 9 | 309 | CRP1050 | |
| S74 | 6 | 363 | CRP1100 | |
| S68 | 6 | 294 | CRP1110 | |
| S66 | 7 | 321 | CRP1120 | |
| S119 | 12 | 258 | CRP0090 | PDF1.1, PDF1.2a, PDF1.2.b, PDF1.2c, PDF1.3, AhPDF1.3 |
| 8.37 (±2.37)e | 282.06 (±39.41) |
aOnly groups with six or more sequences were analyzed. Group designation is arbitrary
bTotal length of multiple sequence nucleotide alignment including positions with indels
cGroups of CRPs represented in each alignment, as defined for A. thaliana in [29]
d ATTI Arabidopsis thaliana trypsin inhibitor, CRP Cysteine-Rich-Peptide, LCR Low molecular weight Cysteine-Rich Peptide, PDF Plant Defensin, PR Pathogenesis-Related
eAverage and sample standard deviation
Gene recombination is more frequent among NLRs compared with DEFLs
Recombination significantly contributes to the diversification of gene families. Because of their misleading effects on the detection of natural selection [41–43] we employed Geneconv and GARD (Genetic Algorithm Recombination Detection), two complementary approaches to evaluate the extent of recombination in NLR and DEFL genes [44, 45]. Geneconv identifies and scores aligned segments for which two sequences are sufficiently similar, thus indicating in the past a gene conversion or recombination event that took place in the past [44]. The highest-scoring fragments globally identified in the entire alignment are evaluated in a way similar to the BLAST method to find sequence matches in DNA or protein databases [46]. Next, these highest-scoring fragments are assigned p-values based on comparison with all possible fragments for the entire alignment by the method of Karlin and Altschul [47]. Subsequently, these so-called Karlin-Altschul p-values are Bonferroni-corrected for the number of possible sequence pair comparisons. The GARD approach is based on the premise that evolution of homologous sequences affected by recombination cannot be explained by a single phylogenetic tree, but by several - each one corresponding to every nonrecombinant fragment in the alignment [45]. GARD searches a multiple sequence alignment for segment-specific phylogenies and establishes the location of putative recombination or conversion breakpoints. These breakpoints indicate the limits of segments in an alignment that support different phylogenies. The program further assesses goodness of fit using the Akaike Information Criterion (AIC) based on a maximum likelihood model fit to [45]. Geneconv and GARD analyses provide complementary evidence on the occurrence of recombination between specific sequences and how these events globally affect the phylogenetic relationships of the sequences investigated. We collectively designate the regions identified by both methods as recombination events because we did not further evaluate whether they originated from unidirectional (gene conversion) or reciprocal recombination events.
Altogether Geneconv detected a higher number of statistically significant recombination events within NLR alignments than those detected within DEFLs (Fig. 3a and b). The largest number of events took place between CNLs and TNLs of A. thaliana and A. lyrata, frequently involving the residues encoding NB-ARC (nucleotide-binding adaptor shared by Apaf1, R genes and CED4) and LRR domains (Fig. 3c). Overall the length of these recombination tracks is not significantly different between A. thaliana and A. lyrata, the species with a higher number of events (Fig. 3a). Similarly, NLR alignments reported the largest number of statistically significant recombination breakpoints identified by GARD (Table 4, Additional file 7: Data 5), most of them also took place in the NB-ARC and LRR domains, although a larger number were also detected in-between domain regions (Fig. 3d).
Fig. 3.
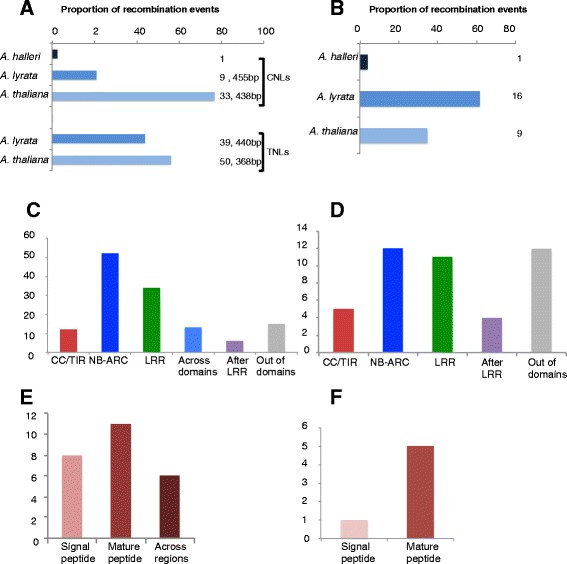
Statistically significant recombination tracks and breakpoints detected in NLRs and DEFLs. a Proportion of recombination tracks per species as percentage of the total number of recombination events detected with Geneconv. Numbers besides each bar indicate the actual number of recombination tracks identified in each species and their average length in each subfamily of NLRs. b Proportion of recombination tracks per species as percentage of the total number of recombination events detected with Geneconv in the DEFL family. Numbers besides each bar indicate the actual number of recombination tracks identified in each species in all DEFL genes analyzed. c Number of recombination tracks identified with Geneconv along the residues encoding three major NLR protein domains. Tracks designed as “out of domain” were identified between the boundaries of CC/TIR and NB-ARC or between NB-ARC and the LRR domain. “After LRR” indicates the amino acid residues after the last identified LRR repeat. d Number of breakpoints identified with GARD in the regions coding major NLR protein domains. A breakpoint indicates the beginning of a region in the multiple sequence alignment that yields a phylogeny significantly different from those based on other nucleotide positions. This phylogenetic incongruence might be due to recombination events or to significant differences in the rates of nucleotide substitution across coding sequences. e Number of recombination tracks identified with Geneconv along the residues encoding the signal peptide, the mature peptide or both regions encoding DEFLs. f Number of breakpoints identified with GARD in the regions encoding the signal or the mature peptides of DEFLs
Table 4.
Statistically significant results of analysis of natural selection with codeml site models and FUBAR as well as recombination breakpoints detected with GARD for groups of NLR subfamilies CNL and TNL
| Group | na | LRT M1:M2 | P b | LRT M7:M8 | P b | Estimates for M8c | M8 BEB sitesd | FUBAR positivee | FUBAR positive partitionsf | FUBAR negativee | FUBAR negative partitionsf | GARD break pointsg |
|---|---|---|---|---|---|---|---|---|---|---|---|---|
| CNL | ||||||||||||
| GC1 | 9 | 147.05 | <0.001 | 165.85 | <0.001 | ω = 5.77; p1 = 0.05 | 16 | 26 | 28 | 72 | 65 | 2 (7) |
| GC2 | 13 | 22.85 | <0.001 | 45.72 | <0.001 | ω = 2.00; p1 = 0.07 | 4 | 2 | 1 | 280 | 266 | 2 (7) |
| GC3 | 5 | 127.18 | <0.001 | 129.00 | <0.001 | ω = 8.65; p1 = 0.08 | 36 | 32 | 30 | 26 | 22 | 2 (9) |
| GC4 | 6 | 87.78 | <0.001 | 111.74 | <0.001 | ω = 4.06; p1 = 0.09 | 17 | 13 | 16 | 20 | 44 | 1 (8) |
| GC5 | 12 | 125.11 | <0.001 | 152.85 | <0.001 | ω = 3.44; p1 = 0.08 | 19 | 22 | 14 | 145 | 122 | 5 (6) |
| GC6 | 5 | 50.57 | <0.001 | 57.46 | <0.001 | ω = 5.17; p1 = 0.07 | 7 | 13 | 4 | 31 | 28 | 0 (7) |
| GC7 | 10 | 64.06 | <0.001 | 108.68 | <0.001 | ω = 2.51; p1 = 0.10 | 19 | 13 | 13 | 183 | 170 | 1 (7) |
| TNL | ||||||||||||
| GT1 | 21 | 174.03 | <0.001 | 209.33 | <0.001 | ω = 2.73; p1 = 0.07 | 21 | 3 | 12 | 316 | 302 | 1(3) |
| GT2 | 8 | 22.84 | <0.001 | 44.70 | <0.001 | ω = 2.19; p1 = 0.1 | 3 | 11 | 4 | 137 | 110 | 1 (8) |
| GT3 | 13 | 218.48 | <0.001 | 259.31 | <0.001 | ω = 3.10; p1 = 0.1 | 43 | 10 | 23 | 214 | 189 | 3 (5) |
| GT5 | 6 | 77.90 | <0.001 | 90.03 | <0.001 | ω = 5.72; p1 = 0.05 | 17 | 15 | 13 | 118 | 83 | 2 (7) |
| GT6 | 11 | 24.74 | <0.001 | 52.40 | <0.001 | ω = 1.82; p1 = 0.17 | 14 | 9 | 14 | 237 | 221 | 2 (6) |
| GT11 | 9 | 113.42 | <0.001 | 126.25 | <0.001 | ω = 4.17; p1 = 0.07 | 15 | 5 | 10 | 79 | 42 | 1 (7) |
| GT14 | 8 | 34.66 | <0.001 | 44.31 | <0.001 | ω = 3.09; p1 = 0.07 | 7 | 4 | 3 | 65 | 58 | 4 (7) |
| GT15 | 7 | 71.62 | <0.001 | 82.99 | <0.001 | ω = 3.13; p1 = 0.09 | 21 | 19 | 4 | 96 | 63 | 4 (7) |
| GT21 | 6 | 25.63 | <0.001 | 39.91 | <0.001 | ω = 2.83; p1 = 0.09 | 5 | 1 | 3 | 93 | 81 | 0 (7) |
| GT22 | 6 | 95.80 | <0.001 | 106.74 | <0.001 | ω = 4.76; p1 = 0.07 | 11 | 32 | 21 | 71 | 43 | 5 (8) |
aNumber of sequences in the group
b P-values are corrected for multiple comparisons with the Benjamini-Hochberg procedure employing a False Discovery Rate of 0.10. Values in bold represent significant tests in which ω is inferred to be >1.0
cω is dN:dS estimated under M8; p1 is the inferred proportion of positively selected sites. Positions under positive selection are provided in Additional file 13: Data 8
dNumber of codon position under positive selection with P > 0.9
eAccording to FUBAR analysis this is the number of codon positions under positive or negative selection with P > 0.9
fResults obtained with FUBAR analysis based on the partitions of all breakpoints detected with GARD regardless of their statistical significance
gNumber of breakpoints with significant phylogenetic topological incongruence at p ≤ 0.1, between parentheses is the total number of breakpoints detected
N.E. means no evidence for recombination was detected. For such groups a second FUBAR analysis was not performed
Most of the few recombination events detected in DEFLs involved A. lyrata sequences and almost equally affected the regions encoding the N-terminal signal sequence and the mature peptide (Fig. 3e). In DEFLs, GARD detected altogether six significant recombination breakpoints (Additional file 7: Data 5), mainly in the region encoding the mature peptide (Fig. 3f).
Differential contribution of natural selection to the diversification of NLRs and DEFLs
The programs codeml [48] and FUBAR [49] were employed to investigate the patterns of natural selection in both gene families. With codeml we compared via likelihood-ratio tests (LRTs) two pairs of so-called “site models” M1 with M2 and M7 with M8. The first model considers neutral evolution, while the second assumes a proportion of sites under positive natural selection. After FDR correction of the resulting p-values the evolution of most of the CNLs and TNL groups is significantly better described by both models considering codon sites under positive selection (ω > 1) (Table 4). Because the codeml approach categorizes sites into a small number of classes, which can result in misleading inference of natural selection, all datasets were also analyzed with FUBAR. This method averages over a large number of predefined site classes resulting in a practically unconstrained distribution of selection parameters and allows for the rapid identification of sites experiencing positive and negative selection. In all CNL and TNL groups where both codeml M2 and M8 were significant, FUBAR often detected a similar number of sites under positive selection (Table 4).
Because the detection of natural selection can be hampered by phylogenetic incongruence resulting from conversion or recombination between NLR genes, we ran FUBAR again with the corresponding phylogenies inferred for all partitions corresponding to the breakpoints detected by GARD (between parenthesis in Table 4). This approach also detected positive and negative selected codons in the same NLR groups where they were initially inferred, although the number of sites in both categories was slightly smaller (Table 4). The combined GARD-FUBAR approach showed that sites under positive natural selection are most frequently localized in the region encoding the LRR domain of TNLs and negative selected sites occur more often in the NB-ARC domain of CNLs (Fig. 4a). Because most of the groups analyzed contain known disease resistance genes (Table 2, Fig. 2 and Additional file 2: Figure S1), a reliable correlation cannot be drawn between the occurrence of positive selection and the actual involvement in the immune response of genes in those groups. Most TNL and CNL groups under positive selection belong to few, closely related and often well-supported clades (indicated in Fig. 2 and Additional file 2: Figure S1). Overall the results of gene conversion and selection analyses suggest a scenario of opposite evolutionary trends driving the evolution of NLRs: while the regions encoding the NB-ARC domain are conserved via gene conversion and/or negative selection, gene conversion and positive selection diversify the LRR domain and the region afterwards (Fig. 4a and b).
Fig. 4.
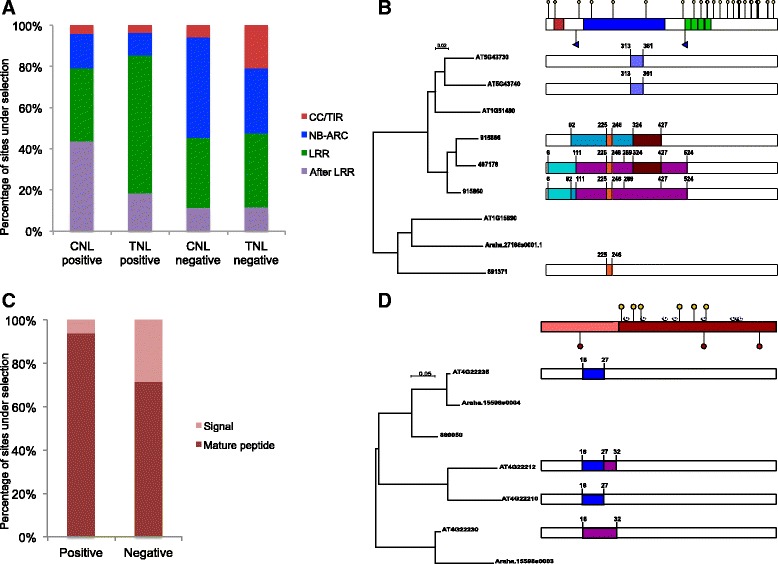
Distribution of sites under natural selection and gene conversion in domains of NLR and DEFL proteins. a Proportion of sites under positive or negative selection detected with FUBAR along the residues encoding the major NLR protein domains. In both CNLs and TNLs the LRR and subsequent residues are more often target of diversifying evolution, while in CNLs the NB-ARC domain reported a larger proportion of sites under negative selection. b Example of the distribution of statistically significant recombination tracks (Geneconv), recombination breakpoints (GARD) and sites under positive selection (FUBAR applied on partitions), in the regions encoding the coil-coil domain (red), NB-ARC (blue) and LRR domain (green) on CNL group GC1. Yellow pins indicate 28 codon positions under positive selection and purple flags identify recombination breakpoints. For the sake of clarity the 65 positions under negative selection are not indicated nor genes where conversion was not detected. Recombination tracks between two or more genes are represented with blocks of the same color. For scaling purposes recombination tracks are represented three times smaller than originally identified in nucleotide alignments. c Proportion of sites under positive or negative selection detected with FUBAR analyses regarding gene recombination, along the residues encoding the signal and mature peptides of DEFL genes. d Example of the distribution of statistically significant recombination tracks and sites under positive or negative selection on the regions encoding the signal (pink) and mature peptides (red) of DEFL group S43. Red pins indicate three codon sites under negative natural selection, yellow pins indicate six codon positions under positive selection and purple diamonds indicate positions encoding conserved cysteine residues. Recombination tracks and scaling are represented as in B
Analyses with both codeml and FUBAR show that neutral evolution prevails throughout the DEFL family. Specifically, only in eight of 48 alignments analyzed there are evidences of natural selection detected both by codeml and FUBAR (Table 5, Additional file 7: Data 5). Alignments with evidences of positive selection belong to diverse CRP groups, including three with known LCRs (Low-molecular weight, Cysteine-Rich genes) and SCRLs (S locus cysteine-rich-like genes), however they do not consistently contain experimentally characterized genes. In these groups the number of codon sites under positive selection detected by both codeml and FUBAR is relatively small and more frequent in the region encoding the mature peptide (Fig. 4c and d). Because of the lower occurrence of gene conversion and recombination in this family, there were few groups with GARD recombination breakpoints reanalyzed for positive and negative selection with FUBAR (Additional file 7: Data 5). In this case, the number of sites detected did not change significantly from those initially reported (Table 5).
Table 5.
Significant results of analysis of natural selection with codeml site models and FUBAR as well as recombination breakpoints detected with GARD for groups of DEFL genes
| CRP groupsa | Group | LRT M1:M2 | P b | LRT M7:M8 | P b | Estimates for M8c | M8 BEB sitesd | FUBAR positivee | FUBAR positive partitionsf | FUBAR negativee | FUBAR negative partitionsf | GARD break pointsg | |
|---|---|---|---|---|---|---|---|---|---|---|---|---|---|
| CRP0260 | S125 | 12.03 | 0.03 | 12.08 | 0.04 | ω = 4.92 | p1 = 0.2 | 5 | 4 | 3 | 2 | 2 | 0 (3) |
| CRP0340 | S43 | 44.01 | 0.01 | 24.85 | 0.01 | ω = 5.42 | p1 = 0.22 | 8 | 6 | 6 | 3 | 3 | 0 (1) |
| CRP0360 | S81 | 16.99 | 0.01 | 19.27 | 0.01 | ω = 5.66 | p1 = 0.16 | 3 | 2 | 3 | 3 | 2 | 0 (2) |
| CRP0360 | S87 | 38.60 | 0.01 | 44.39 | 0.01 | ω = 5.25 | p1 = 0.28 | 14 | 4 | 6 | 2 | 2 | 0 (2) |
| CRP0560 | S14 | 22.32 | 0.01 | 10.52 | 0.05 | ω = 3.25 | p1 = 0.53 | 7 | 3 | 3 | 2 | 2 | 0 (4) |
| CRP0580 | S65 | 7.64 | 0.03 | 9.57 | 0.06 | ω = 3.66 | p1 = 0.08 | 2 | 2 | N.A. | 3 | N.A. | N.E. |
| CRP0830 | S63 | 9.30 | 0.10 | 9.52 | 0.06 | ω = 9.65 | p1 = 0.04 | 3 | 7 | 8 | 3 | 4 | 0 (2) |
| CRP1110 | S68 | 16.57 | 0.01 | 16.68 | 0.01 | ω = 5.45 | p1 = 0.16 | 7 | 5 | 5 | 2 | 4 | 0 (1) |
aCysteine Rich Peptide groups (CRPs) of defensin and defensin-like genes (DEFLs) as defined for A. thaliana in [29]
b P-values are corrected for multiple comparisons with the Benjamini-Hochberg procedure employing a False Discovery Rate of 0.10. Values in bold represent significant tests in which ω is inferred to be >1.0
cω is dN:dS estimated under M8; p1 is the inferred proportion of positively selected sites. Positions under positive selection are provided in Additional file 13: Data 8
dNumber of codon position under positive selection with M8 inferred with Bayes Empirical Bayes analysis with P > 0.9
eAccording to the FUBAR procedure this is the number of codon positions under positive or negative selection with P > 0.9
fResults obtained with FUBAR analysis based on the partitions of all breakpoints detected with GARD regardless of their statistical significance
gNumber of breakpoints with significant phylogenetic topological incongruence at p ≤ 0.1, between parentheses is the total number of breakpoints detected. N.E. means no evidence for recombination was detected. For such groups a second FUBAR analysis was not performed (N.A.)
Generation and quality of RNA-seq data from pistils and leaves of Arabidopsis species infected with Fusarium graminearum
All experimental and control treatments of pistil samples were performed 24 h after flower emasculation (Additional file 8: Figure S3). Specifically, pistils and cauline leaves of A. halleri, A. thaliana and A. lyrata were inoculated by dipping and spraying with F. graminearum conidia solution and incubated for 3 days in a moist chamber under long day conditions. This inoculation approach ensured effective Fusarium infection and avoided artifactual responses (e.g. through incubation in the dark or leaf infiltration with a syringe). As a control, pistils collected 24 h after emasculation, but otherwise untreated, were used for comparison with infected pistils. The surface of infected pistils and leaves collected 3 days after infection (3 DAI) showed profuse hyphal growth in A. lyrata (Additional file 8: Figure S3) as well as in A. thaliana and A. halleri [20]. For both control and treatments, pistils or leaves from three biological replicates were collected, each replicate containing equivalent amounts of material from 4 individual plants.
Total RNA from pistils infected with Fusarium was employed to compare the dynamics of gene expression patterns with that of untreated pistils. RNA sequencing yielded reads with a mean Q quality score ≥ 36 for over 94% of the reads in all biological replicates (Table 6), indicating that the base call accuracy of sequencing was well above 99.9% [50]. After quality control and trimming, reads were mapped to the re-annotated version of the A. lyrata genome. Table 6 summarizes the most important aspects of RNA sequencing and mapping for A. lyrata. The results corresponding to A. thaliana and A. halleri have been published recently [20] and are presented in Additional file 9: Data 6. Reproducibility of RNA-seq results was confirmed with qPCR assays on a set of fourteen candidate DEFL genes (Figure S2 and Figure S3 in [20]). Correlation analysis of this data showed a R2 = 0.83 between the log2 fold changes detected by RNA-seq and qPCR [20].
Table 6.
Characteristics of the A. lyrata transcriptomes sequenced
| Conditions compared | Total reads | Percent of ≥ Q30 Bases | Mean Quality Score | Mapped reads | Genes expresseda |
|---|---|---|---|---|---|
| A. lyrata pistils untreated | 96,737,148 | 94.88 | 36.69 | 82,058,723 | 67.49 |
| A. lyrata pistils infected | 117,134,804 | 94.09 | 36.40 | 89,328,582 | 62.79 |
| A. lyrata leaf untreated | 123,196,130 | 95.34 | 36.81 | 104,112,543 | 58.43 |
| A. lyrata leaf infected | 92,065,932 | 94.89 | 36.65 | 77,815,224 | 58.74 |
Genes expressed are those with a RPKM ≥ 1
a As percentage of the 29,675 genes included in the reannotated genomes of A. lyrata V 2.1, [77]
To maintain similar levels of variation between the biological replicates investigated, principal component analysis (PCA) and box plots were employed to select the two most similar of three biological replicates initially obtained for each experimental and control condition. Differential gene expression analysis was based on read counts from infected pistils and leaves compared to those obtained from untreated tissues, respectively. Differentially expressed genes (DEGs) were those with a false discovery rate-corrected p-value below 0.0005 and an expression fold change ≥2 (upregulation) or ≤ − 2 (downregulation), and which are expressed with at least one read per kilobase of transcript per million mapped reads (RPKM). The lists of DEGs in each comparison as well as their corresponding fold change and RPKM values are provided in Additional file 10: Data 7. Pistil and leaf infection resulted in a similar percentage of expressed genes (Table 6). The proportion of DEGs was in the same ranges as previously obtained for A. halleri and A. thaliana (Additional file 9: Data 6). In this study, we compare the patterns of expression and differential gene expression of NLRs and DEFLs in the context of their phylogenies and molecular evolution.
Contrasting expression patterns of NLRs and DEFLs in response to Fusarium graminearum pistil and leaf infection
The pattern of RNA-seq expression of NLRs and DEFLs in control and Fusarium graminearum infected pistils and leaves contrasts with the above described patterns of recombination and molecular evolution. About 62% of CNLs and 44% of all TNLs from the three species are expressed (with at least one read per kilobase of transcript per million mapped reads - RPKM) at all four conditions studied.
Visualization of the patterns of expression shows that although closely related NLR sequences from the same group might be expressed at all conditions, the actual number of reads can vary widely within and between species (Fig. 5a and Additional file 11: Figure S4, Additional file 10: Data 7). However, in both TNL and CNL classes several of the groups with highest average expression in infected pistils are also among those most highly expressed in infected leaves. Although several of the highest expressed TNL and CNL groups also display significant positive selection and might include known disease resistance genes, this trend was also detected in groups with intermediate and lower expression levels suggesting that there is no correlation between positive selection and higher levels of expression during Fusarium infection (Additional file 10: Data 7).
Fig. 5.
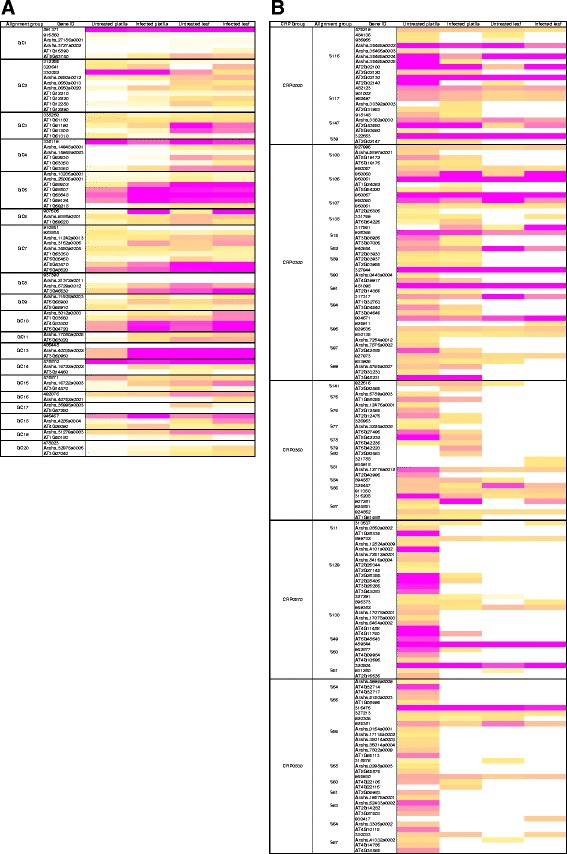
Heat map of CNLs and DEFL gene expression in untreated and Fusarium infected pistils and leaves in Arabidopsis species. a CNLs. b DEFLs. All genes with average expression signals >1 RPKM in at least one condition are shown. Gene expression was scaled based on the distribution of all expression values for each gene family. White color denotes no expression, yellow means expression values in the 50th percentile (intermediate) and magenta denotes expression values in the 90th percentile (high). Due to space limitation, we present here only the largest five CRP groups of DEFL genes. In Additional file 12: Figure S5 all expressed members of this family are shown
In contrast, fewer DEFLs are expressed at examined conditions and generally display lower transcript levels compared with NLRs (Fig. 5b, Additional file 12: Figure S5, Additional file 10: Data 7). Only 15% of DEFLs from all three species are expressed at all conditions studied, while 43% are not expressed above the 1 RPKM threshold. In this context, most DEFL groups are characterized by genes with widely divergent patterns and levels of gene expression, regardless of their pattern of molecular evolution or recombination (Fig. 5b, Additional file 12: Figure S5). The transcriptional divergence between closely related DEFLs is particularly clear when considering the distribution and frequency of expression in the conditions tested (Fig. 6). DEFL gene expression was detected predominantly in one or two conditions (Fig. 6a), most frequently in pistils untreated or infected (Fig. 6b). In contrast, the consistent expression of NLRs in all four conditions tested suggests their family-wide patterns of regulation did not strongly diverge in the course of Arabidopsis evolution.
Fig. 6.
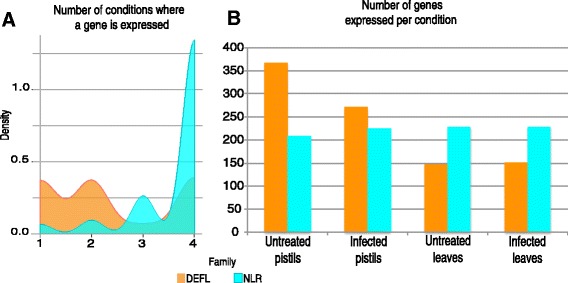
Distribution and frequency of DEFL and NLR gene expression in the conditions tested. a The density plot illustrates the distribution of genes expressed on different numbers of conditions here investigated. The peaks indicate that most genes of the DEFL family are expressed in one or two conditions, while NLR genes are predominantly expressed in all four conditions. These trends suggest that in the course of evolution the members of the DEFL family significantly diverged at the regulatory level in comparison to NLRs. b The bar chart represents the number of members from the DEFL or NLR family that are expressed in pistils or leaves under different conditions. While DEFLs are predominantly expressed in pistils, a similar number of NLRs are consistently expressed in all four conditions. These different patterns highlight the regulatory divergence among the members of the DEFL family
Differential gene expression
Analysis of differential gene expression between Fusarium infected tissues and untreated samples showed that 19% and 22% of CNLs and TNLs from all three species were significantly upregulated both in pistils and leaves, respectively (Fig. 7a and Additional file 10: Data 7), while almost none of them were downregulated. Over half of the upregulated TNLs belong to three closely related gene groups GT1, GT3 and GT10, the first two reported significant positive selection. These results illustrate well the high degree of transcriptional divergence even between closely related members from each family (Fig. 7a).
Fig. 7.
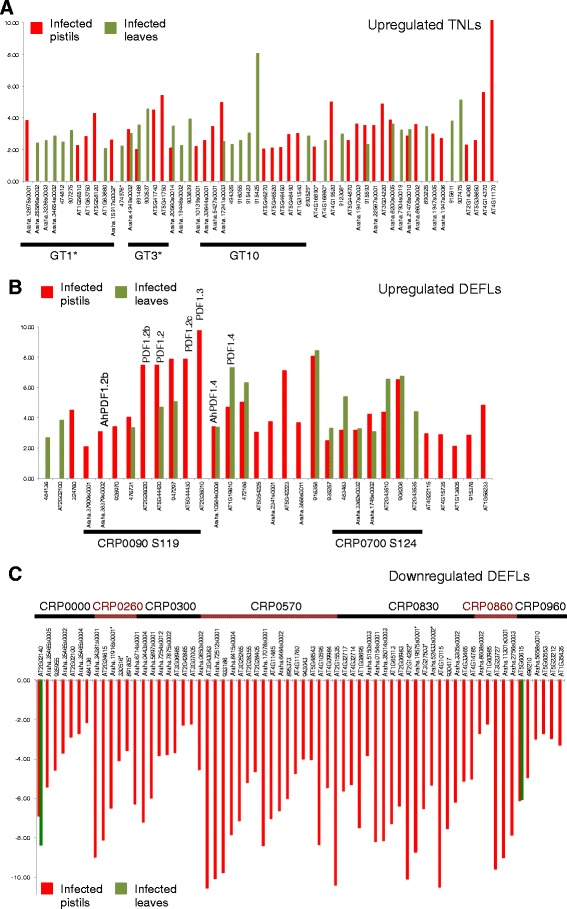
Divergence and conservation of differential gene expression of TNLs and DEFLs in Arabidopsis pistils and leaves infected by Fusarium graminearum. a Most differentially expressed TNLs in the species analyzed are significantly upregulated in infected leaves or pistils of the Arabidopsis species investigated. A large proportion of the genes upregulated belong to three top largest subgroups of genes in this family: GT1, GT3 and GT10. Asterisks indicate groups with significant positive selection. Additional file 10: Data 7 provides further details of other genes under selection and upregulated during Fusarium infection. b DEFLs differentially expressed in response to Fusarium graminearum are often upregulated in both pistils and leaves. A large proportion belongs to S119 and S124, two relatively large groups with representatives from all species investigated. On top of the corresponding columns the names of DEFL genes from A. thaliana and A. halleri are indicated, which are discussed in the text due to their involvement in pathogen killing and heavy metal resistance. c The largest group of differentially expressed DEFLs in Arabidopsis involves those downregulated during pistil infection. Although these genes belong to a variety of different groups, a large proportion of them are members of CRP0570 and CRP0830
Similar to NLRs, about 16% of all DEFLs are differentially expressed in response to Fusarium infection. Upregulation occurs in pistils and leaves, predominantly involving genes from groups S119 and S124 (CRP00090 and CRP0700), some with increased expression levels in both tissues tested (Fig. 7b). In contrast, significant DEFL downregulation of many DEFL groups takes places in Fusarium infected pistils and involves the largest proportion of differentially expressed DEFLs (Fig. 7c). Although members of diverse CRP groups from all three species are involved, the largest number of genes belongs to CRP0570 and CRP0830 (Fig. 7c). This result corroborates and broadens previous results on F. graminearum infected pistils of A. thaliana and A. halleri [20].
Discussion
Re-evaluating positive and negative selection in NLRs
We re-annotated NLR genes in three Arabidopsis spp. and detected significantly more NLR candidate genes compared to a previous study (265 and 247 against 159 and 185 in A thaliana and A. lyrata, respectively) [38]. This study applied the same annotation method on all three species and thus allowed better comparisons. We found slightly lower numbers of NLR in A. halleri compared to the other two species. However, this could be the outcome of the more recent annotation of this genome. In addition, the repetitiveness of regions encoding LRRs are more difficult to assemble than other, more regular genetic loci. Similarly as [38] observed in their A. thaliana / A. lyrata phylogenies, our sequence groups contain in most cases, members from all three species. This allowed us to reexamine codon-based selective pressure as well as recombination events and thus expanding on previously performed evolutionary analyses [2, 38]. The gene trees obtained with the re-annotated sequences do not significantly differ from the first studies of A. thaliana, suggesting that despite major differences in genome size, habitat and life cycle of these three species, major taxon-specific clades have not evolved.
When comparing all members of the NLR family within A. thaliana, positive selection has been shown to be a major force shaping their diversity. About 50% of the analyzed NLRs, divided over 10 sequence groups, showed sites under positive selection. 70% of these sites occur in the LRR region of the genes [2]. Expansion of these analyses by including A. lyrata showed that still about 50% of R genes showed positive selection. In addition, presence/absence polymorphisms of a large number of gene orthologs are evident between both species [23]. Such findings backed up the consensus that NLR genes are likely to evolve rapidly and show a clear “birth and death” pattern where alleles rapidly appear and disappear [51].
We extended these analyses to other well-known members of the genus and included additional quality controls of the alignments employed. Highly divergent gene families are prone to codon saturation, which can mislead the detection of positive selection. Specifically, we checked for third codon position saturation, levels of sequence divergence as well as more detailed analysis of possible recombination events. For this purpose, we employed the phylogenies for all partitions detected by GARD to investigate the occurrence of selection with FUBAR. Interestingly, comparing the results of FUBAR with those yielded by the combined GARD-FUBAR approach, shows that considering possible recombination events did not greatly change the outcome of the selection analyses.
Overall the analysis of NLRs showed that recombination and negative selection preserve the sequence and integrity of the NB-ARC domain, while recombination in the presence of prevailing positive selection re-assorts variation in the LRR domain and post LRR region. These distinct patterns of evolution reflect recent findings on the structural basis of NLR function. A model based on the properties of the different domains proposes that in absence of pathogen effectors the interaction of the NB-ARC domain with the N-terminal part of the LRR maintains the closed conformation of the protein [52]. Thus the prevalence of purifying selection and recombination or gene conversion in the NB-ARC domain, but also in part of the LRR domain reflect the role of these regions in preserving the stability of NLR protein folding and autoinhibition. In contrast, the C-terminal end of the LRR domain, encoded by the region were positive selection prevails, is exposed, senses charge changes in its environment and releases autoinhibition upon pathogen perception. The conformational changes triggered by the LRR allow the NB-ARC domain to exchange ADP for ATP necessary for downstream signaling [52].
Evolution of DEFLs
Early studies on mammalian α-defensin evolution showed evidences of positive selection in the sequence regions encoding mature peptides [53]. These observations suggested that gene duplications in the defensin family were often followed by a rapid burst of positively selected amino acid changes leading to functional differentiation of paralogs [53]. This scenario received further support from comprehensive studies based on ML models that demonstrated the occurrence of positive selection in specific residues of the mature peptide of α-defensin [54–56]. Although many plant DEFLs are also involved in pathogen inhibition and killing they are not evolutionarily related to animal α-defensins [57]. Plant DEFL families have more members compared with vertebrates and these are on average longer and more diverse. Although both groups have similar amino acid biases they generate different tertiary structures and pattern of conserved disulfide bridges [57].
Although ratios of the counts of non-synonymous to synonymous substitutions in Arabidopsis DEFLs suggested that positive selection diversifies specific regions encoding the mature peptide [13], a more recent analysis of grass DEFLs suggests otherwise. Specifically, analysis of the ratio of synonymous to nonsynonymous substitution Ka/Ks between genes residing in duplicated grass genomic regions showed that the family is subject to purifying selection, while a sliding window analyses detected some regions evolve under positive selection [15]. However, the latter approach has been shown to produce artifactual trends of synonymous and nonsynonymous rate variation and is invalid because it does not correct for multiple testing [58]. More recently, a study on the evolution of CRPs in six closely related Oryza genomes reported a dN/dS ratio < 1 for all pairwise combinations of concatenated defensin coding sequences concluding that positive selection did not occur within CRPs [14]. In comparison, the approach we employed was based on reliable alignments of moderately divergent coding sequences, thus avoiding third codon position saturation, one of the major caveats preventing reliable evolutionary analysis of this family. Moreover, in contrast to previous work, both codeml and FUBAR yield detailed information regarding the occurrence of positive and negative selection as well as the codon sites affected by such trends. The fact that our results were corrected for multiple comparisons and consistent between methods adds further support to our analysis strategy. In the present analysis, a series of codon-based ML tests showed that although eight DEFL groups reported statistically significant evidences of positive and negative selection, a substantial proportion of the family in the genus Arabidopsis is subject to neutral evolution. While these results do not exclude that diversifying evolution takes place in some gene lineages for a short period of time, it is obvious that in terms of their molecular evolution, plant defensins are not under a prevalent regime of diversifying selection like animal α-defensins. This observation further supports the notion that they are not evolutionarily related and their roles in the immune response are different although their overall structures converged during evolution [57].
In plants and animals high immune gene diversity can confer a selective advantage to hosts facing rapidly evolving and diverse pathogens. In the case of plant defensins gene and genome duplication generated a large and polymorphic reservoir of antimicrobial factors that undergo rapid turnover in number and structure [12, 14, 24]. Arabidopsis DEFLs are characterized by a high proportion of gene family variation in length and pattern of conserved cysteines [12]. This information in conjunction with our results suggests that ancient events of gene duplication in their common ancestor as well as insertions and deletions played a more important role in their diversification as a family, compared to diversifying selection.
A major aspect playing a role in the evolution of DEFLs is their diversification of expression pattern. RNA-seq analyses revealed that even closely related genes show different levels and patterns of expression during fungal infection. The collective downregulation of DEFL genes observed in pistils might be a conserved mechanism employed by Fusarium to inhibit the immune responses.
Species-specific divergence of DEFLs and emergence of novel functions
Our analyses further showed that Arabidopsis DEFLs form a very large and divergent gene family formed by small groups of similar sequences detected in all three Arabidopsis species and thus possibly existed already in their common ancestor. This large number of very different ortholog groups has been retained at least since the divergence of the Arabidopsis species occurred some 7–10 MYA [28] and contains few species-specific duplications and singletons. Assuming pathogen growth inhibition and killing is the ancestral role of DEFLs, we hypothesize that this large number of diverse DEFL genes was initially preserved because they provided a selective advantage to counteract pathogens. Subsequently, the functional divergence of this family has been facilitated by ancient and recent transposition events following WGD events that possibly diversified the regulatory properties of DEFLs and led to their preservation [28].
Two examples that illustrate the widely different ways in which DEFLs diverge functionally are LUREs and PDFs. LUREs are rather exceptional DEFLs, because they consistently formed groups of highly similar, species-specific duplicates (Additional file 6: Figure S2A). LURE genes encode peptides that are essential in the species-preferential attraction of pollen tubes towards ovules during double fertilization [19]. While their interspecific divergence might have involved episodic diversifying evolution, their current role as messengers between gametophytes acting at multiple redundant RLKs [59, 60] probably constrains their inter-specific divergence as suggested by their short branch lengths (Additional file 6: Figure S2A). However, functional divergence in DEFLs might evolve without the occurrence of species-specific duplications and/or positive selection. Specifically, while closely related PDF1s of A. thaliana are important for pathogen killing, their A. halleri orthologs AhDEF1.3 (S119), AhPDF1.4 (S120) and AhPDF1.5 are involved in heavy metal tolerance and have antifungal in vitro activity against Fusarium oxysporum [22]. Their high level of similarity and the fact that both A. thaliana and A. halleri PDF1 genes are also differentially expressed during Fusarium pistil infection (Fig. 7b) supports the notion that these peptides adopted different and sometimes even simultaneous multiple roles during evolution [22]. The hypothesis that during evolution transcriptional divergence in location and levels of expression has been more important in the functional diversification of DEFLs compared to natural selection is well exemplified by A. thaliana and A. halleri PDFs. The fundamental difference between these groups of DEFLs is that there is a higher constitutive accumulation of PDF1s in A. halleri in both shoots and roots in comparison with A. thaliana, where these genes are not expressed in roots [22, 61]. The high degree of conservation and the significant occurrence of purifying selection in group S119 suggest the evolution of PDF1s and AhDEF1s might be constrained by their multiple roles. Further functional characterization of the DEFL family will elucidate the extent of functional promiscuity.
Conclusions
The analysis of NLRs and DEFLs allowed comparing the selective pressure of genes with different functional properties in detection and response to ETI and PTI (Fig. 1). The present analyses of NLRs confirms previous studies in Arabidopsis thaliana and highlights contrasting patterns of purifying and diversifying selection affecting the NB-ARC and LRR/post-LRR regions, which might be explained by the different structural properties of these domains. Although positive selection has been detected in gene families encoding inhibitors of pathogen growth and fitness, like chitinases [7, 8], β-1,3-endoglucanases [9], polygalacturonase inhibitor proteins (PGIPs) [10] and thaumatin-like proteins [11], we detected significant evidences of positive selection only in a relatively small fraction of Arabidopsis DEFLs. Their expression pattern, however, suggests that, compared with positive selection, transcriptional divergence probably made a more important contribution to DEFL diversification. This regulatory divergence was possibly the outcome of frequent genomic transposition [28]. In comparison with smaller families of pathogenesis-related genes under positive selection, DEFLs and other CRPs appear to be involved in diverse biological processes besides defense and act, for example, as signaling ligands during fertilization processes, development of reproductive structures, heavy metal resistance. These heterogeneous functions and interactions with cell surface receptors and channels might altogether pose different structural and functional constraints to frequent substitutions, thus resulting in a family-wide pattern of neutral evolution.
Methods
NLR re-annotation
To assure consistent comparison we re-annotated all NLR genes in A. thaliana, and additionally in A. lyrata and A. halleri using NLR-Parser [27]. We obtained genome sequences for Arabidopsis thaliana (TAIR10) from arabidopsis.org, used Arabidopsis lyrata v.1.07 and A. halleri v.1.1 from Phytozome (https://phytozome.jgi.doe.gov/). MEME-suite [62] and NLR-Parser [27] were employed to re-annotate NLR genes in Arabidopsis species by identifying presumed NB-ARC domains of each protein. MEME-suite [62] was run with high p-value cut off of 10 using training sets on the predicted proteins to identify all NLR motifs in the three genomes. All motif-containing sequences and used NLR-Parser (default settings, e-value cut off 1 × 10⁻⁶) were extracted to annotate putative NLRs and their subdomains. The longest ORF was selected when multiple splice variants were identified; if they had equal length, the first variant was taken.
NLR phylogeny reconstruction and grouping
To reconstruct a reliable alignment for inferring the NLR phylogeny, we employed only sequences that contained a N-terminal domain (coiled-coil or TIR) and at least one NB-ARC and LRR domains. Coding sequences of all CNLs and TNLs were identified and separately aligned as codon sequences with MAFFT [63] implemented in the GUIDANCE2 server [64] with a maximum of 50 iterations and 100 alternative guide trees and the 6mer pairwise alignment approach (Additional file 3: Data 2a and Additional file 4: Data 3a). The reliability of the resulting alignments was subsequently evaluated with the GUIDANCE2 algorithm [65]. In both alignments of CNLs and TNLs, all columns with a GUIDANCE2 confidence score > 0.93 were employed as they are considered reliably aligned (Additional file 3: Data 2b and Additional file 4: Data 3b). The most appropriate nucleotide substitution model for each multiple sequence alignment was selected with program SMS implemented in PhyML 3.0 [66]. Models were selected based on the Akaike Information Criterion (AIC). Subsequently maximum likelihood phylogenies were inferred with PhyML 3.0 [67] starting from ten random trees and taking the best tree obtained by Subtree-Pruning-Regrafting (SPR) search. The approximate likelihood ratio test (aLRT) was computed to perform a Shimodaira Hasegawa-like statistic to support every bifurcation. Based on the best-supported clades of these phylogenies, CNLs and TNLs were further divided into 20 and 46 homologous sequence groups (Additional file 1: Data 1), respectively. In the individual alignments for each of these sequence groups, the following aspects were checked: a) pairwise p-distances <0.5; b) third codon positions were not saturated and c) sequences that introduced gaps spanning over 25% of the length of the alignment were eliminated, as previously described [2]. Third codon position saturation was tested on fully resolved sites using DAMBE 5 [68]. These assessments yielded 9 CNL and 15 TNL groups with more than 5 sequences each, which were further used for analysis of molecular evolution, gene conversion and recombination (Table 1).
DEFL sequences grouping and alignment
Our analyses of Arabidopsis DEFL sequences were based on those identified in the TAIR10 protein database by [29] and grouped in cysteine-rich peptide (CRP) groups [12]. In brief, CRPs were defined as proteins where the immature propeptide contains an N-terminal signal peptide for secretion (predicted by SignalP4.0 software), generally less than 170 amino acid residues in length and no less than 4 cysteine residues in its predicted mature sequence [69, 70]. From a previous CRP listing [17] we employed the complete coding sequences of DEFLs of A. thaliana assigned to 46 CRP groups CRP0000 to CRP1520 [29]. Sequences representing each of these DEFL groups and the criteria of length and number of cysteine residues previously mentioned were employed to identify further members from A. thaliana and those corresponding to A. lyrata and A. halleri using BLAST searches in Phytozome versions 10 and 11, between September 2015 and October 2016. Multiple sequence alignments with data from all three species were based on amino acid sequences with default settings in MUSCLE [71] implementation in SeaView 4.5.3 [72] and then manually corrected. Because alignments based on the CRP classification and including sequences from all three Arabidopsis species often reported pairwise p-distances >0.5 and third codon positions were saturated, they were further divided so the resulting alignments would be consistent with the previously described specifications employed for NLRs. Sequence group assessment generated a total of 156 alignment groups. From them, 47 with at least six sequences (Additional file 1: Data 1) were further employed for analysis of molecular evolution and gene recombination (Tables 1 and 3).
Identifying genetic recombination
Geneconv [44], was used to detect recombination events between genes from the same species in the nucleotide alignments of the previously described groups of DEFLs, TNLs and CNLs. Global inner fragments were detected using a mismatch penalty (gscale = 2). The locations of significant global internal fragments with a Bonferroni-corrected Karlin-Altschul p-value ≤0.05 were parsed out, scaled to amino-acid residues and mapped on the protein domain structure of the longest or best characterized member from each sequence group using coordinates obtained from Uniprot (uniprot.org) or InterPro (ebi.ac.uk/interpro/protein).
GARD implemented in the Adaptive Evolution Server (datamonkey.org) was run as an alternative approach to detect recombination breakpoints in the alignment groups investigated with Geneconv. Program GARD searched each multiple sequence alignment for segment-specific phylogenies using an appropriate nucleotide substitution model identified with the Model Selection tool and default settings (no site-to-site rate variation and two rate classes) [35]. For alignment groups with evidences of recombination, GARD generates a list of significant breakpoints supported with a p-value ≤0.1.
Graphic representation of the results of Geneconv and GARD in Fig. 4 were drawn with the program IBS [73]. A scale based in codon/amino acid positions was employed to represent protein domains (amino acids), recombination events (nucleotides) and sites under selection (codons) in Fig. 4b and d.
Analysis of molecular evolution
The ratio (ω) of the rate of nonsynonymous substitutions at nonsynonymous sites (dN) to synonymous (dS) substitutions at synonymous sites was estimated to figure out whether the coding region of a gene is under negative (purifying) selection (ω < 1), positive selection (ω > 1) or evolves neutrally (ω = 1). We analyzed the heterogeneity of selective pressures per codon sites in alignment groups of DEFLs, CNL and TNL genes with the program codeml from the PAML 4.8 package [48], running in the Athene1 computer cluster of the University of Regensburg. Based on the codon alignment and unrooted gene tree for each group, the models employed estimate ω and other parameters describing the pattern of codon substitution along sites. We investigated the occurrence of positive selection along codon sites by comparing nested model M2 with M1 and M8 with model M7. By comparing the likelihood of the model estimates with a Likelihood Ratio Test (LRT), codeml determines whether a model that considers positive selection fits the data better than one assuming neutral selection. The LRT statistics are assumed to be χ2 distributed with degrees of freedom equal to the difference in the number of parameters between models. The p-values of the likelihood ration test are corrected for multiple comparisons with the Benjamini-Hochberg procedure employing a False Discovery Rate of 0.10. M2 and M8 include a Bayes Empirical Bayes (BEB) analysis that detects codon sites under positive selection. We considered those with a posterior probability ≥0.9.
The second method to investigate the patterns of natural selection was FUBAR (Fast Unconstrained Bayesian AppRoximation) [49] implemented in the Adaptive Evolution Server (datamonkey.org). FUBAR takes the Neighbor-Joining tree or the trees inferred by GARD in the analysis of recombination (see previous section) and the alignment of a sequence group and determines the means of posterior distribution of synonymous (α) and non-synonymous (β) substitution rates over sites, as well as the mean posterior probability for ω > 1 or ω < 1 at a site. We reported the sites with evidence of pervasive positive (diversifying) or negative (purifying) at a posterior probability ≥0.9.
Plant material and growth conditions
Seeds of Arabidopsis lyrata MN47 were surface sterilized, kept in sterile H2O at 4 °C for about 3 weeks in a horizontally placed Falcon vial. Seedlings were transferred to soil and grown under long-day conditions for two months. Plants at rosette stage were vernalized for 10 weeks at 4 °C. Subsequently flowering was induced by long-day conditions. Growth conditions of A. thaliana and A. halleri were described in [20].
Infection with Fusarium graminearum
F. graminearum strain SG005/Fg005, an isolate from spring barley grain [74], was propagated and employed to infect Arabidopsis pistils as previously reported [20]. Inoculation medium for infection contains 1% Tween and conidia resuspended in sterile distilled water (final concentration of 8–9 × 10⁵ spores/ml). As described for A. thaliana and A. halleri [20], flowers of Arabidopsis lyrata were emasculated and allowed to recover for 24 h. Flowers and cauline leaves were inoculated by dipping them into conidial suspension for 20 min and then spraying with conidial solution. In order to favor development of Fusarium infection, inoculated plants were covered with a plastic bag sprayed with water and kept for 72 h under long-day conditions. After the period of infection, pistils and cauline leaves were collected in liquid nitrogen and stored at −80 °C. Fusarium infection was detected by staining pistils and leaves samples with wheat germ agglutinine-tetramethylrhodamine (WGA-TMR) following the protocol in [75]. Samples were analyzed using a confocal laser scanning microscope (LSM 510), excited by a 561 nm laser line, emission detected at 571 to 610 nm, respectively. Non-infected leaves and pistils collected 24 h after flower emasculation were employed in as control.
RNA extraction, preparation of cDNA libraries and sequencing
As previously described for the analysis of A. thaliana and A. halleri samples [20], total RNA from infected and control A. lyrata pistil and leaf samples was extracted with the RNeasy Mini Plant Kit (Qiagen). After removal of residual genomic DNA, total RNA integrity and concentration were measured with a Bioanalyzer 2100 using the RNA 6000 Nano assay chip (Agilent Technologies). Library preparation and sequencing were carried out by the Center for Fluorescent Bioanalytics (KFB) at the University of Regensburg. Specifically, for cDNA library preparation the TruSeq RNA sample preparation kit (Illumina) was employed, starting from 500 ng of total RNA. Quantification of libraries was performed with the KAPA SYBR FAST ABI Prism Library Quantification Kit (Kapa Biosystems). Cluster generation with cBot (TruSeq PE Cluster Kit v3) was based on pooled equimolar amounts of each cDNA library. Sequencing was performed in a HiSeq 1000 instrument, using TruSeq SBS v3 reagents and the indexed paired-end (PE) protocol with 2 × 100 cycles. Image analyses and base calling, were converted into .fastq files with CASAVA 1.8.2. Library multiplexing was employed to obtain between 50 to 60 million reads per biological replicate, with a mean quality score of at least 37.
RNA-seq analysis
Based on quality assessment with FastQC [76], reads were trimmed in the first and last 15 residues and subsequently mapped with CLC Genomics Workbench 7 (Qiagen) to the re-annotated A. lyrata reference genome v. 1 [77]. The following parameters were employed: mapping to genic and inter-genic regions, 10 maximum number of hits for a read, both strands, count paired reads as two, expression value as total counts, no global alignment, similarity fraction = 0.8, length fraction = 0.8, mismatch cost = 2, insertion cost = 3, deletion cost = 3. Identical settings were employed in the previously reported analysis of RNA-seq data from A. thaliana and A. halleri pistils [20].
Box-plots and Principal Component Analysis (PCA) were employed to assess variations in levels of expression between three biological replicates of each infected and non-infected pistil and leaf samples (data not shown). Results from the two most similar biological replicates were employed for further analyses of gene expression. The analysis was based on comparing read counts from infected tissue treatments with those of untreated samples, using the exact test for two-group comparisons from EdgeR [78] in the CLC Workbench. We classified as differentially expressed genes (DEGs) those with a false discovery rate-corrected p-value <0.0005, an expression fold change ≥2 for upregulation or ≤ −2 for downregulation. Only genes expressed with a RPKM ≥1 were considered.
Additional files
Sheet 1. Overview of NLRs annotated in A. thaliana, A. lyrata and A. halleri and those aligned and included in gene trees to distinguish clades of CNLs and TNLs for further analyses of molecular evolution. Sheet 2. Lists of proteins annotated as NLRs in A. thaliana, A. lyrata and A. halleri. Note that in A. lyrata protein names and locus/gene names sometimes involve different IDs. Sheet 3. Groups of CNLs and TNLs of A. thaliana, A. lyrata and A. halleri identified in family gene trees. Sheet 4. Groups of Arabidopsis DEFLs. Those of A. lyrata and A. halleri were identified based on their similarity with those of A. thaliana previously annotated and assigned to specific CRP groups [12, 29] (XLSX 67 kb)
Maximum likelihood gene tree of re-annotated complete and partial TNL genes from three Arabidopsis species. This gene tree was inferred from the alignment of coding sequences obtained with MAFFT, where only those reliably aligned columns with a GUIDANCE2 confidence score > 0.93 were employed. The most appropriate nucleotide substitution model was selected with program SMS and the maximum likelihood phylogenies was inferred with PhyML 3.0. The numbers on every node indicate posterior probabilities >0.70 supporting the phylogenetic relationships inferred. The clades employed for defining alignment groups (GT1 to GT46) are outlined with the first column of bars on the right of the gene tree. After evaluation of similarity levels and third codon position saturation, only sequences from groups indicated with orange bars where further investigated. Among them, clades indicated with ω + reported significant evidences of positive selection. This gene tree recovered the clades TNL-A to TNL-H identified in the first published phylogeny of A. thaliana TNLs [25], here they are indicated with a second column of bars on the right of the gene tree. Color-coding of sequence IDs indicates Arabidopsis halleri in green, Arabidopsis lyrata in black and Arabidopsis thaliana in red. The names of defense genes reported in the literature are indicated in parenthesis. (PDF 399 kb)
Data 2a. Complete MAFFT alignment of CNLs. Data 2b. MAFFT alignment of CNLs containing only columns with a GUIDANCE2 confidence score > 0.93. (ZIP 103 kb)
Data 3a. Complete MAFFT Alignment of TNLs. Data 3b. Complete MAFFT Alignment of TNLs containing only columns with a GUIDANCE2 confidence score > 0.93. (ZIP 393 kb)
Sequence statistics of groups analyzed for recombination and selection. (XLSX 52 kb)
Gene trees of DEFLs with known species-specific or functional divergence. A Maximum Likelihood gene trees of LUREs in groups S1, S26 and S57. B Maximum Likelihood gene trees of PDF1s genes in groups S119 and S120. (DOCX 416 kb)
Results for all LRTs of NLR and DEFL families. (XLSX 52 kb)
Study design and morphology of Arabidopsis pistils during infection with Fusarium graminearum. A Diagram describing the timeline for treatment and collection of Arabidopsis pistils and leaves employed for transcriptome profiling Fusarium graminearum infection. B Wheat germ agglutinine-tetramethylrhodamine (WGA-TMR) staining of A. lyrata mock-treated pistil showing that fungal hyphae are lacking inside the pistil. C WGA-TMR staining 3 days after infection (3DAI) of A. lyrata infected pistil showing F. graminearum hyphae. D WGA-TMR staining 3DAI of A. lyrata infected leaf showing F. graminearum hyphae growing on the epidermis of the leaf. Scale bars: 50 μm. (PPTX 888 kb)
Characteristics of the Arabidopsis transcriptomes compared. (XLSX 54 kb)
Differentially expressed genes in the transcriptome of A. lyrata pistils and leaves infected with F. graminearum. Expression data in RPKM units was employed to draw heat maps. (XLSX 761 kb)
Heat map of TNL gene expression in untreated and Fusarium infected pistils and leaves in Arabidopsis species. All genes with average expression signals >1 RPKM in at least one condition are shown. Gene expression was scaled based on the distribution of all expression values for each gene family. White color denotes no expression, yellow means expression values in the 50th percentile (intermediate) and magenta denotes expression values in the 90th percentile (high). (PDF 238 kb)
Heat map of DEFL gene expression in untreated and Fusarium infected pistils and leaves in Arabidopsis species. All genes with average expression signals >1 RPKM in at least one condition are shown. Gene expression was scaled based on the distribution of all expression values for each gene family. White color denotes no expression, yellow means expression values in the 50th percentile (intermediate) and magenta denotes expression values in the 90th percentile (high). (PDF 417 kb)
Sites under positive selection detected by M8 from codeml. Statistically significant are only those with a probabilitw ω>1= *: P>95%; **: P>99% Numbering is given according to a reference sequence and does not consider positions with indels. (XLS 166 kb)
Acknowledgments
We thank Nina Lantzouni and Claus Schwechheimer for support and access to the CLC Genomics Workbench at Technical University of Munich. Andrea Linkmeyer and Ralph Hückelhoven are acknowledged for F. graminearum strain SG005 and Carolin Delker for seeds of A. lyrata. We thank Vimal Rawat and Korbinian Schneeberger for pre-publication access to their re-annotation of the A. lyrata genome as well as Niveditha Katyayini, Anna Teresa Dandekar and Maximilian Hauck for their contributions to initial analyses of the molecular evolution of defensins.
Funding
This project was funded by the German Research Council DFG through the collaborative research project EVOREP (grant DR334/8–1) to T.D. The Bavarian Program for realization of equal opportunities for women in research and teaching is acknowledged to fund M.M.P. R.S. has been in part supported by the Alexander von Humboldt Foundation.
Availability of data and materials
Raw RNA-seq data is available from NCBI Sequence Read Archive (SRA) is available under Bioproject PRJNA408031 for A. lyrata and for A. thaliana and A. halleri under PRJNA384934, as previously indicated in [20]. All other materials are provided as supplements to this publication or are available from the authors upon reasonable request.
Abbreviations
- AIC
Akaike information criterion
- aLRT
Approximate likelihood ratio test
- BEB
Bayes empirical Bayes analysis
- CC
Coil-coil domain
- CNL
Coil-coil-type NLR
- CRP
Cysteine-rich peptide
- DEFL
Defensin-like
- DEGs
Differentially expressed genes
- FUBAR
Fast unconstrained Bayesian approximation
- GARD
Genetic algorithm for recombination detection
- LCRs
Low-molecular weight, cysteine-rich
- LRR
Leucine-rich repeat
- LRT
Likelihood ratio test
- ML
Maximum likelihood
- NB-ARC
Nucleotide-binding adaptor shared by Apaf1, R genes and CED4
- NLR
Nucleotide-binding domain and leucine-rich repeat containing protein also named as nucleotide-binding and oligomerization domain (NOD)-like receptor
- PGIP
Polygalacturonase inhibitor proteins
- PR
Pathogenesis-related gene or protein
- RPKM
Reads per kilobase of transcript per million mapped reads
- SCRLs
S-locus cysteine-rich-like
- SPR
Subtree-prunning-regrafting
- TIR
TOLL/interleukin1-receptor
- TNL
TIR-type NLR
Authors’ contributions
MMP set the concept and design of the study; MMP and RS performed bioinformatic analyses; AJA performed experimental work; MMP and TD supervised experimental work; MMP and RS wrote the manuscript; TD edited the manuscript. All authors have read and approved the manuscript.
Ethics approval and consent to participate
Not applicable
Consent for publication
Not applicable.
Competing interests
The authors declare that they have no competing interests.
Publisher’s Note
Springer Nature remains neutral with regard to jurisdictional claims in published maps and institutional affiliations.
Footnotes
Electronic supplementary material
The online version of this article (10.1186/s12862-017-1099-4) contains supplementary material, which is available to authorized users.
Contributor Information
Mariana Mondragón-Palomino, Phone: (49) 941-943-3043, Phone: (49) 941-943-3020, Email: mariana.mondragon@biologie.uni-regensburg.de.
Remco Stam, Email: stam@wzw.tum.de.
Ajay John-Arputharaj, Email: ajay.john-arputharaj@biologie.uni-regensburg.de.
Thomas Dresselhaus, Email: thomas.dresselhaus@biologie.uni-regensburg.de.
References
- 1.Endo T, Ikeo K, Gojobori T. Large-scale search for genes on which positive selection may operate. Mol Biol Evol. 1996;13:685–690. doi: 10.1093/oxfordjournals.molbev.a025629. [DOI] [PubMed] [Google Scholar]
- 2.Mondragón-Palomino M, Meyers BC, Michelmore RW, Gaut BS. Patterns of positive selection in the complete NBS-LRR gene family of Arabidopsis thaliana. Genome Res. 2002;12:1305–1315. doi: 10.1101/gr.159402. [DOI] [PMC free article] [PubMed] [Google Scholar]
- 3.Zhang XS, Choi JH, Heinz J, Chetty CS. Domain-specific positive selection contributes to the evolution of Arabidopsis Leucine-rich repeat receptor-like Kinase (LRR RLK) genes. J Mol Evol. 2006;63:612–621. doi: 10.1007/s00239-005-0187-z. [DOI] [PubMed] [Google Scholar]
- 4.Bakker EG, Traw MB, Toomajian C, Kreitman M, Bergelson J. Low levels of polymorphism in genes that control the activation of defense response in Arabidopsis thaliana. Genetics. 2008;178:2031–2043. doi: 10.1534/genetics.107.083279. [DOI] [PMC free article] [PubMed] [Google Scholar]
- 5.Beth MM. New insights to the function of phytopathogenic bacterial type III effectors in plants. Ann Rev Plant Biol. 2005;56:509–531. doi: 10.1146/annurev.arplant.56.032604.144218. [DOI] [PubMed] [Google Scholar]
- 6.Caldwell KS, Michelmore RW. Arabidopsis thaliana genes encoding defense signaling and recognition proteins exhibit contrasting evolutionary dynamics. Genetics. 2008;181:671–684. doi: 10.1534/genetics.108.097279. [DOI] [PMC free article] [PubMed] [Google Scholar]
- 7.Bishop JG, Dean AM, Mitchell-Olds T. Rapid evolution in plant chitinases: molecular targets of selection in plant-pathogen coevolution. Proc Natl Acad Sci. 2000;97:5322–5327. doi: 10.1073/pnas.97.10.5322. [DOI] [PMC free article] [PubMed] [Google Scholar]
- 8.Tiffin P, Hacker R, Gaut BS. Population genetic evidence for rapid changes in intraspecific diversity and allelic cycling of a specialist defense gene in Zea. Genetics. 2004;168:425–434. doi: 10.1534/genetics.103.023028. [DOI] [PMC free article] [PubMed] [Google Scholar]
- 9.Bishop JG, Ripoll DR, Bashir S, Damasceno CMB, Seeds JD, Rose JKC. Selection on glycine β-1,3-endoglucanase genes differentially inhibited by a Phytophthora Glucanase inhibitor protein. Genetics. 2005;169:1009–1019. doi: 10.1534/genetics.103.025098. [DOI] [PMC free article] [PubMed] [Google Scholar]
- 10.Bishop JG. Directed mutagenesis confirms the functional importance of positively selected sites in Polygalacturonase inhibitor protein. Mol Biol Evol. 2005;22:1531–1534. doi: 10.1093/molbev/msi146. [DOI] [PubMed] [Google Scholar]
- 11.Zhao JP, Su XH. Patterns of molecular evolution and predicted function in thaumatin-like proteins of Populus trichocarpa. Planta. 2010;232:949–962. doi: 10.1007/s00425-010-1218-6. [DOI] [PubMed] [Google Scholar]
- 12.Silverstein KAT, Moskal WA, Wu HC, Underwood BA, Graham MA, Town CD, et al. Small cysteine-rich peptides resembling antimicrobial peptides have been under-predicted in plants. Plant J. 2007;51:262–280. doi: 10.1111/j.1365-313X.2007.03136.x. [DOI] [PubMed] [Google Scholar]
- 13.Vanoosthuyse V, Miege C, Dumas C, Cock JM. Two large Arabidopsis thaliana gene families are homologous to the Brassica gene superfamily that encodes pollen coat proteins and the male component of the self-incompatibility response. Plant Mol Biol. 2001;46:17–34. doi: 10.1023/A:1010664704926. [DOI] [PubMed] [Google Scholar]
- 14.Shenton MR, Ohyanagi H, Wang Z-X, Toyoda A, Fujiyama A, Nagata T, et al. Rapid turnover of antimicrobial-type cysteine-rich protein genes in closely related Oryza genomes. Mol Gen Genomics. 2015;290:1753–1770. doi: 10.1007/s00438-015-1028-4. [DOI] [PubMed] [Google Scholar]
- 15.Wu J, Jin X, Zhao Y, Dong Q, Jiang H, Ma Q. Evolution of the defensin-like gene family in grass genomes. J Genet. 2016;95:53–62. doi: 10.1007/s12041-015-0601-2. [DOI] [PubMed] [Google Scholar]
- 16.Bircheneder S, Dresselhaus T. Why cellular communication during plant reproduction is particularly mediated by CRP signaling. J Exp Bot. 2016;67:4849–4861. doi: 10.1093/jxb/erw271. [DOI] [PubMed] [Google Scholar]
- 17.Franco OL. Peptide promiscuity: an evolutionary concept for plant defense. FEBS Lett. 2011;585:995–1000. doi: 10.1016/j.febslet.2011.03.008. [DOI] [PubMed] [Google Scholar]
- 18.Schopfer CR, Nasrallah ME, Nasrallah JB. The male determinant of self-incompatibility in Brassica. Science. 1999;286:1697–1700. doi: 10.1126/science.286.5445.1697. [DOI] [PubMed] [Google Scholar]
- 19.Takeuchi H, Higashiyama T. A species-specific cluster of defensin-like genes encodes diffusible pollen tube attractants in Arabidopsis. PLoS Biol. 2012;10:e1001449. doi: 10.1371/journal.pbio.1001449. [DOI] [PMC free article] [PubMed] [Google Scholar]
- 20.Mondragón-Palomino M, John-Arputharaj A, Pallmann M, Dresselhaus T. Similarities between reproductive and immune pistil transcriptomes of Arabidopsis species. Plant Physiol. 2017;174:1559–1575. doi: 10.1104/pp.17.00390. [DOI] [PMC free article] [PubMed] [Google Scholar]
- 21.Mee Do H, Chul Lee S, Won Jung H, Hoon Sohn K, Kook HB. Differential expression and in situ localization of a pepper defensin (CADEF1) gene in response to pathogen infection, abiotic elicitors and environmental stresses in Capsicum annuum. Plant Sci. 2004;166:1297–1305. doi: 10.1016/j.plantsci.2004.01.008. [DOI] [Google Scholar]
- 22.Shahzad Z, Ranwez V, Fizames C, Marquès L, Le Martret B, Alassimone J, et al. Plant Defensin type 1 protein promiscuity and expression variation within the Arabidopsis genus shed light on zinc tolerance acquisition in Arabidopsis halleri. New Phytol. 2013;200:820–833. doi: 10.1111/nph.12396. [DOI] [PubMed] [Google Scholar]
- 23.Chen Q, Han Z, Jiang H, Tian D, Yang S. Strong positive selection drives rapid diversification of R-genes in Arabidopsis relatives. J Mol Evol. 2010;70:137–148. doi: 10.1007/s00239-009-9316-4. [DOI] [PubMed] [Google Scholar]
- 24.Silverstein KAT. Genome organization of more than 300 defensin-like genes in Arabidopsis. Plant Physiol. 2005;138:600–610. doi: 10.1104/pp.105.060079. [DOI] [PMC free article] [PubMed] [Google Scholar]
- 25.Meyers BC, Kozik A, Griego A, Kuang H, Michelmore RW. Genome-wide analysis of NBS-LRR-encoding genes in Arabidopsis. Plant Cell. 2003;15:809–834. doi: 10.1105/tpc.009308. [DOI] [PMC free article] [PubMed] [Google Scholar]
- 26.Zhou P, Silverstein KA, Gao L, Walton JD, Nallu S, Guhlin J, et al. Detecting small plant peptides using SPADA. BMC Bioinformatics. 2013;14:335. doi: 10.1186/1471-2105-14-335. [DOI] [PMC free article] [PubMed] [Google Scholar]
- 27.Steuernagel B, Jupe F, Witek K, Jones JDG, Wulff BBH. NLR-parser: rapid annotation of plant NLR complements. Bioinformatics. 2015;31:1665–1667. doi: 10.1093/bioinformatics/btv005. [DOI] [PMC free article] [PubMed] [Google Scholar]
- 28.Woodhouse MR, Tang H, Freeling M. Different gene families in Arabidopsis thaliana transposed in different epochs and at different frequencies throughout the Rosids. Plant Cell. 2011;23:4241–4253. doi: 10.1105/tpc.111.093567. [DOI] [PMC free article] [PubMed] [Google Scholar]
- 29.Huang Q, Dresselhaus T, Gu H, Qu L-J. Active role of small peptides in Arabidopsis reproduction: expression evidence. J Integr Plant Biol. 2015;57:518–521. doi: 10.1111/jipb.12356. [DOI] [PubMed] [Google Scholar]
- 30.Hammond-Kosack KE, Jones JDG. Resistance gene-dependent plant defense responses. Plant Cell. 1996;8:1773–91. [DOI] [PMC free article] [PubMed]
- 31.Meyers BC, Dickerman AW, Michelmore RW, Sivaramakrishnan S, Sobral BW, Young ND. Plant disease resistance genes encode members of an ancient and diverse protein family within the nucleotide-binding superfamily. Plant J. 1999;20:317–332. doi: 10.1046/j.1365-313X.1999.t01-1-00606.x. [DOI] [PubMed] [Google Scholar]
- 32.Pan Q, Wendel J, Fluhr R. Divergent evolution of plant NBS-LRR resistance gene homologues in dicot and cereal genomes. J Mol Evol. 2000;50:203–213. doi: 10.1007/s002399910023. [DOI] [PubMed] [Google Scholar]
- 33.Mun J-H, Yu H-J, Park S, Park B-S. Genome-wide identification of NBS-encoding resistance genes in Brassica rapa. Mol Gen Genomics. 2009;282:617–631. doi: 10.1007/s00438-009-0492-0. [DOI] [PMC free article] [PubMed] [Google Scholar]
- 34.Li J, Ding J, Zhang W, Zhang Y, Tang P, Chen J-Q, et al. Unique evolutionary pattern of numbers of gramineous NBS–LRR genes. Mol Gen Genomics. 2010;283:427–438. doi: 10.1007/s00438-010-0527-6. [DOI] [PubMed] [Google Scholar]
- 35.Stam R, Scheikl D, Tellier A. Pooled enrichment sequencing identifies diversity and evolutionary pressures at NLR resistance genes within a wild tomato population. Genome Biol Evol. 2016;8:1501–1515. doi: 10.1093/gbe/evw094. [DOI] [PMC free article] [PubMed] [Google Scholar]
- 36.Vining KJ, Johnson SR, Ahkami A, Lange I, Parrish AN, Trapp SC, et al. Draft genome sequence of Mentha longifolia and development of resources for mint cultivar improvement. Mol Plant. 2017;10:323–339. doi: 10.1016/j.molp.2016.10.018. [DOI] [PubMed] [Google Scholar]
- 37.Nishimura MT, Anderson RG, Cherkis KA, Law TF, Liu QL, Machius M, et al. TIR-only protein RBA1 recognizes a pathogen effector to regulate cell death in Arabidopsis. Proc Natl Acad Sci. 2017;114:E2053–E2062. doi: 10.1073/pnas.1620973114. [DOI] [PMC free article] [PubMed] [Google Scholar]
- 38.Guo YL, Fitz J, Schneeberger K, Ossowski S, Cao J, Weigel D. Genome-wide comparison of nucleotide-binding site-leucine-rich repeat-encoding genes in Arabidopsis. Plant Physiol. 2011;157:757–769. doi: 10.1104/pp.111.181990. [DOI] [PMC free article] [PubMed] [Google Scholar]
- 39.Guo X, Liu J, Hao G, Zhang L, Mao K, Wang X, et al. Plastome phylogeny and early diversification of Brassicaceae. BMC Genomics. 2017;18:176. doi: 10.1186/s12864-017-3555-3. [DOI] [PMC free article] [PubMed] [Google Scholar]
- 40.Salemi M, Vandamme A-M. The phylogenetic handbook: a practical approach to DNA and protein phylogeny. Cambridge: Cambridge University Press; 2003.
- 41.Anisimova M, Nielsen R, Yang Z. Effect of recombination on the accuracy of the likelihood method for detecting positive selection at amino acid sites. Genetics. 2003;164:1229–1236. doi: 10.1093/genetics/164.3.1229. [DOI] [PMC free article] [PubMed] [Google Scholar]
- 42.Shriner D, Nickle DC, Jensen MA, Mullins JI. Potential impact of recombination on sitewise approaches for detecting positive natural selection. Genet Res. 2003;81:115–121. doi: 10.1017/S0016672303006128. [DOI] [PubMed] [Google Scholar]
- 43.Mondragon-Palomino M, Gaut BS. Gene conversion and the evolution of three leucine-rich repeat gene families in Arabidopsis thaliana. Mol Biol Evol. 2005;22:2444–2456. doi: 10.1093/molbev/msi241. [DOI] [PubMed] [Google Scholar]
- 44.Sawyer SA. Geneconv: a computer package for the statistical detection of gene conversion. 1989. [Google Scholar]
- 45.Kosakovsky Pond SL. Automated phylogenetic detection of recombination using a genetic algorithm. Mol Biol Evol. 2006;23:1891–1901. doi: 10.1093/molbev/msl051. [DOI] [PubMed] [Google Scholar]
- 46.Altschul SF, Gish W, Miller W, Myers EW, Lipman DJ, W M, et al. Basic local alignment search tool. J Mol Biol. 1990;215:403–410. doi: 10.1016/S0022-2836(05)80360-2. [DOI] [PubMed] [Google Scholar]
- 47.Altschul SF. A protein alignment scoring system sensitive at all evolutionary distances. J Mol Evol. 1993;36:290–300. doi: 10.1007/BF00160485. [DOI] [PubMed] [Google Scholar]
- 48.Yang Z. PAML 4: Phylogenetic analysis by maximum likelihood. Mol Biol Evol. 2007;24:1586–1591. doi: 10.1093/molbev/msm088. [DOI] [PubMed] [Google Scholar]
- 49.Murrell B, Moola S, Mabona A, Weighill T, Sheward D, Kosakovsky Pond SL, et al. FUBAR: a Fast, unconstrained Bayesian AppRoximation for inferring selection. Mol Biol Evol. 2013;30:1196–1205. doi: 10.1093/molbev/mst030. [DOI] [PMC free article] [PubMed] [Google Scholar]
- 50.Ewing B, Green P. Base-calling of automated sequencer traces using phred. II. Error probabilities. Genome Res. 1998;8:186–194. doi: 10.1101/gr.8.3.186. [DOI] [PubMed] [Google Scholar]
- 51.Michelmore RW, Meyers BC. Clusters of resistance genes in plants evolve by divergent selection and a birth-and-death process. Genome Res. 1998;8:1113–1130. doi: 10.1101/gr.8.11.1113. [DOI] [PubMed] [Google Scholar]
- 52.Takken FL, Goverse A. How to build a pathogen detector: structural basis of NB-LRR function. Curr Opin Plant Biol. 2012;15:375–384. doi: 10.1016/j.pbi.2012.05.001. [DOI] [PubMed] [Google Scholar]
- 53.Hughes AL, Yeager M. Coordinated amino acid changes in the evolution of mammalian defensins. J Mol Evol. 1997;44:675–682. doi: 10.1007/PL00006191. [DOI] [PubMed] [Google Scholar]
- 54.Lynn DJ, Lloyd AT, Fares MA, O’Farrelly C. Evidence of positively selected sites in mammalian α-defensins. Mol Biol Evol. 2004;21:819–827. doi: 10.1093/molbev/msh084. [DOI] [PubMed] [Google Scholar]
- 55.Das S, Nikolaidis N, Goto H, McCallister C, Li J, Hirano M, et al. Comparative genomics and evolution of the alpha-defensin multigene family in primates. Mol Biol Evol. 2010;27:2333–2343. doi: 10.1093/molbev/msq118. [DOI] [PMC free article] [PubMed] [Google Scholar]
- 56.Chapman JR, Hellgren O, Helin AS, Kraus RHS, Cromie RL, Waldenström J. The evolution of innate immune genes: purifying and balancing selection on β-defensins in waterfowl. Mol Biol Evol. 2016;33:3075–3087. doi: 10.1093/molbev/msw167. [DOI] [PubMed] [Google Scholar]
- 57.Shafee TMA, Lay FT, Hulett MD, Anderson MA. The defensins consist of two independent, convergent protein superfamilies. Mol Biol Evol. 2016;33:2345–2356. doi: 10.1093/molbev/msw106. [DOI] [PubMed] [Google Scholar]
- 58.Schmid K, Yang Z. The trouble with sliding windows and the selective pressure in BRCA1. PLoS One. 2008;3:e3746. doi: 10.1371/journal.pone.0003746. [DOI] [PMC free article] [PubMed] [Google Scholar]
- 59.Wang T, Liang L, Xue Y, Jia P-F, Chen W, Zhang M-X, et al. A receptor heteromer mediates the male perception of female attractants in plants. Nature. 2016;531:241–244. doi: 10.1038/nature16975. [DOI] [PubMed] [Google Scholar]
- 60.Takeuchi H, Higashiyama T. Tip-localized receptors control pollen tube growth and LURE sensing in Arabidopsis. Nature. 2016;531:245–248. doi: 10.1038/nature17413. [DOI] [PubMed] [Google Scholar]
- 61.Talke IN, Hanikenne M, Krämer U. Zinc-dependent global transcriptional control, transcriptional deregulation, and higher gene copy number for genes in metal homeostasis of the hyperaccumulator Arabidopsis Halleri. Plant Physiol. 2006;142:148–167. doi: 10.1104/pp.105.076232. [DOI] [PMC free article] [PubMed] [Google Scholar]
- 62.Bailey TL, Boden M, Buske F a, Frith M, Grant CE, Clementi L, et al. MEME-suite: tools for motif discovery and searching. Nucleic Acids Res. 2009;37:W202–W208. doi: 10.1093/nar/gkp335. [DOI] [PMC free article] [PubMed] [Google Scholar]
- 63.Katoh K, Standley DM. MAFFT multiple sequence alignment software version 7: improvements in performance and usability. Mol Biol Evol. 2013;30:772–780. doi: 10.1093/molbev/mst010. [DOI] [PMC free article] [PubMed] [Google Scholar]
- 64.Penn O, Privman E, Ashkenazy H, Landan G, Graur D, Pupko T. GUIDANCE: a web server for assessing alignment confidence scores. Nucleic Acids Res. 2010;38:W23–W28. doi: 10.1093/nar/gkq443. [DOI] [PMC free article] [PubMed] [Google Scholar]
- 65.Sela I, Ashkenazy H, Katoh K, Pupko T. GUIDANCE2: accurate detection of unreliable alignment regions accounting for the uncertainty of multiple parameters. Nucleic Acids Res. 2015;43:W7–14. doi: 10.1093/nar/gkv318. [DOI] [PMC free article] [PubMed] [Google Scholar]
- 66.Lefort V, Longueville J-E, Gascuel O. SMS: smart model selection in PhyML. Mol Biol Evol. 2017;34:2422–2424. doi: 10.1093/molbev/msx149. [DOI] [PMC free article] [PubMed] [Google Scholar]
- 67.Guindon S, Dufayard J-F, Lefort V, Anisimova M, Hordijk W, Gascuel O. New algorithms and methods to estimate maximum-likelihood phylogenies: assessing the performance of PhyML 3.0. Syst Biol. 2010;59:307–321. doi: 10.1093/sysbio/syq010. [DOI] [PubMed] [Google Scholar]
- 68.Xia X. DAMBE5: a comprehensive software package for data analysis in molecular biology and evolution. Mol Biol Evol. 2013;30:1720–1728. doi: 10.1093/molbev/mst064. [DOI] [PMC free article] [PubMed] [Google Scholar]
- 69.Petersen TN, Brunak S, von Heijne G, Nielsen H. SignalP 4.0: discriminating signal peptides from transmembrane regions. Nat Methods. 2011;8:785–786. doi: 10.1038/nmeth.1701. [DOI] [PubMed] [Google Scholar]
- 70.Matsubayashi Y. Posttranslationally modified small-peptide signals in plants. Annu Rev Plant Biol. 2014;65:385–413. doi: 10.1146/annurev-arplant-050312-120122. [DOI] [PubMed] [Google Scholar]
- 71.Edgar RC. MUSCLE: multiple sequence alignment with high accuracy and high throughput. Nucleic Acids Res. 2004;32:1792–1797. doi: 10.1093/nar/gkh340. [DOI] [PMC free article] [PubMed] [Google Scholar]
- 72.Gouy M, Guindon S, Gascuel O. SeaView version 4: a multiplatform graphical user interface for sequence alignment and phylogenetic tree building. Mol Biol Evol. 2010;27:221–224. doi: 10.1093/molbev/msp259. [DOI] [PubMed] [Google Scholar]
- 73.Liu W, Xie Y, Ma J, Luo X, Nie P, Zuo Z, et al. IBS: an illustrator for the presentation and visualization of biological sequences. Bioinformatics. 2015;31:3359–3361. doi: 10.1093/bioinformatics/btv362. [DOI] [PMC free article] [PubMed] [Google Scholar]
- 74.Linkmeyer AMH. Fusarium head blight of barley: epidemiology and host-pathogen interaction Technische Universität München. 2012. [Google Scholar]
- 75.Hoefle C, Huesmann C, Schultheiss H, Börnke F, Hensel G, Kumlehn J, et al. A barley ROP GTPase activating protein associates with microtubules and regulates entry of the barley powdery mildew fungus into leaf epidermal cells. Plant Cell. 2011;23:2422–2439. doi: 10.1105/tpc.110.082131. [DOI] [PMC free article] [PubMed] [Google Scholar]
- 76.Andrews S. FastQC: a quality control tool for high throughput sequence data. 2010. [Google Scholar]
- 77.Rawat V, Abdelsamad A, Pietzenuk B, Seymour DK, Koenig D, Weigel D, et al. Improving the annotation of Arabidopsis lyrata using RNA-Seq data. PLoS One. 2015;10:e0137391. doi: 10.1371/journal.pone.0137391. [DOI] [PMC free article] [PubMed] [Google Scholar]
- 78.Robinson MD, McCarthy DJ, Smyth GK. EdgeR: a bioconductor package for differential expression analysis of digital gene expression data. Bioinformatics. 2010;26:139–140. doi: 10.1093/bioinformatics/btp616. [DOI] [PMC free article] [PubMed] [Google Scholar]
Associated Data
This section collects any data citations, data availability statements, or supplementary materials included in this article.
Supplementary Materials
Sheet 1. Overview of NLRs annotated in A. thaliana, A. lyrata and A. halleri and those aligned and included in gene trees to distinguish clades of CNLs and TNLs for further analyses of molecular evolution. Sheet 2. Lists of proteins annotated as NLRs in A. thaliana, A. lyrata and A. halleri. Note that in A. lyrata protein names and locus/gene names sometimes involve different IDs. Sheet 3. Groups of CNLs and TNLs of A. thaliana, A. lyrata and A. halleri identified in family gene trees. Sheet 4. Groups of Arabidopsis DEFLs. Those of A. lyrata and A. halleri were identified based on their similarity with those of A. thaliana previously annotated and assigned to specific CRP groups [12, 29] (XLSX 67 kb)
Maximum likelihood gene tree of re-annotated complete and partial TNL genes from three Arabidopsis species. This gene tree was inferred from the alignment of coding sequences obtained with MAFFT, where only those reliably aligned columns with a GUIDANCE2 confidence score > 0.93 were employed. The most appropriate nucleotide substitution model was selected with program SMS and the maximum likelihood phylogenies was inferred with PhyML 3.0. The numbers on every node indicate posterior probabilities >0.70 supporting the phylogenetic relationships inferred. The clades employed for defining alignment groups (GT1 to GT46) are outlined with the first column of bars on the right of the gene tree. After evaluation of similarity levels and third codon position saturation, only sequences from groups indicated with orange bars where further investigated. Among them, clades indicated with ω + reported significant evidences of positive selection. This gene tree recovered the clades TNL-A to TNL-H identified in the first published phylogeny of A. thaliana TNLs [25], here they are indicated with a second column of bars on the right of the gene tree. Color-coding of sequence IDs indicates Arabidopsis halleri in green, Arabidopsis lyrata in black and Arabidopsis thaliana in red. The names of defense genes reported in the literature are indicated in parenthesis. (PDF 399 kb)
Data 2a. Complete MAFFT alignment of CNLs. Data 2b. MAFFT alignment of CNLs containing only columns with a GUIDANCE2 confidence score > 0.93. (ZIP 103 kb)
Data 3a. Complete MAFFT Alignment of TNLs. Data 3b. Complete MAFFT Alignment of TNLs containing only columns with a GUIDANCE2 confidence score > 0.93. (ZIP 393 kb)
Sequence statistics of groups analyzed for recombination and selection. (XLSX 52 kb)
Gene trees of DEFLs with known species-specific or functional divergence. A Maximum Likelihood gene trees of LUREs in groups S1, S26 and S57. B Maximum Likelihood gene trees of PDF1s genes in groups S119 and S120. (DOCX 416 kb)
Results for all LRTs of NLR and DEFL families. (XLSX 52 kb)
Study design and morphology of Arabidopsis pistils during infection with Fusarium graminearum. A Diagram describing the timeline for treatment and collection of Arabidopsis pistils and leaves employed for transcriptome profiling Fusarium graminearum infection. B Wheat germ agglutinine-tetramethylrhodamine (WGA-TMR) staining of A. lyrata mock-treated pistil showing that fungal hyphae are lacking inside the pistil. C WGA-TMR staining 3 days after infection (3DAI) of A. lyrata infected pistil showing F. graminearum hyphae. D WGA-TMR staining 3DAI of A. lyrata infected leaf showing F. graminearum hyphae growing on the epidermis of the leaf. Scale bars: 50 μm. (PPTX 888 kb)
Characteristics of the Arabidopsis transcriptomes compared. (XLSX 54 kb)
Differentially expressed genes in the transcriptome of A. lyrata pistils and leaves infected with F. graminearum. Expression data in RPKM units was employed to draw heat maps. (XLSX 761 kb)
Heat map of TNL gene expression in untreated and Fusarium infected pistils and leaves in Arabidopsis species. All genes with average expression signals >1 RPKM in at least one condition are shown. Gene expression was scaled based on the distribution of all expression values for each gene family. White color denotes no expression, yellow means expression values in the 50th percentile (intermediate) and magenta denotes expression values in the 90th percentile (high). (PDF 238 kb)
Heat map of DEFL gene expression in untreated and Fusarium infected pistils and leaves in Arabidopsis species. All genes with average expression signals >1 RPKM in at least one condition are shown. Gene expression was scaled based on the distribution of all expression values for each gene family. White color denotes no expression, yellow means expression values in the 50th percentile (intermediate) and magenta denotes expression values in the 90th percentile (high). (PDF 417 kb)
Sites under positive selection detected by M8 from codeml. Statistically significant are only those with a probabilitw ω>1= *: P>95%; **: P>99% Numbering is given according to a reference sequence and does not consider positions with indels. (XLS 166 kb)
Data Availability Statement
Raw RNA-seq data is available from NCBI Sequence Read Archive (SRA) is available under Bioproject PRJNA408031 for A. lyrata and for A. thaliana and A. halleri under PRJNA384934, as previously indicated in [20]. All other materials are provided as supplements to this publication or are available from the authors upon reasonable request.