Abstract
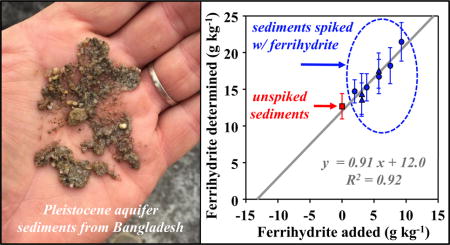
The presence of ferrihydrite in sediments/soils is critical to the cycling of iron (Fe) and many other elements but difficult to quantify. Extended X-ray absorption fine structure (EXAFS) spectroscopy has been used to speciate Fe in the solid phase, but this method is thought to have difficulties in distinguishing ferrihydrite from goethite and other minerals. In this study, both conventional EXAFS linear combination fitting (LCF) and the method of standard-additions are applied to the same samples in attempt to quantify ferrihydrite and goethite more rigorously. Natural aquifer sediments from Bangladesh and the United States were spiked with known quantities of ferrihydrite, goethite and magnetite, and analyzed by EXAFS. Known mineral mixtures were also analyzed. Evaluations of EXAFS spectra of mineral references and EXAFS-LCF fits on various samples indicate that ferrihydrite and microcrystalline goethite can be distinguished and quantified by EXAFS-LCF but that the choice of mineral references is critical to yield consistent results. Conventional EXAFS-LCF and the method of standard-additions both identified appreciable amount of ferrihydrite in Bangladesh sediments that were obtained from a low-arsenic Pleistocene aquifer. Ferrihydrite was also independently detected by sequential extraction and 57Fe Mӧssbauer spectroscopy. These observations confirm the accuracy of conventional EXAFS-LCF and demonstrate that combining EXAFS with additions of reference materials provides a more robust means of quantifying short-range-ordered minerals in complex samples.
Keywords: ferrihydrite, goethite, EXAFS linear combination fitting, standard-additions, Pleistocene sediments
Graphical abstract
1. INTRODUCTION
Ferrihydrite is a nanocrystalline/amorphous Fe(III) oxyhydroxide common in the natural environment, a critical adsorbent, and particularly susceptible to changes in redox conditions (Childs, 1992; Cornell and Schwertmann, 2003; Drits et al., 1993; Hiemstra, 2013; Michel et al., 2007; Willett et al., 1988). Ferrihydrite has a very large surface area up to 800 m2 g−1, meaning that if present in sediments and soils, it is often a key carrier for various metal(loid)s and nutrients, such as arsenic and phosphorus, and affects the turnover of organic carbon (Childs, 1992; Hiemstra, 2013; Johannesson et al., 2013; Michel et al., 2007; Sun and Bostick, 2015; Torn et al., 1997; Willett et al., 1988; Zhu et al., 2013). Ferrihydrite is also the most bioavailable Fe(III) mineral for dissimilatory Fe(III)-reducing bacteria (Hansel et al., 2005; Postma et al., 2010). The transformation of ferrihydrite, even to its more crystalline analogue, goethite, can significantly decrease surface area and liberate adsorbed species (Postma et al., 2010; Robinson et al., 2011; Willett et al., 1988). Differentiating ferrihydrite from other Fe minerals is therefore necessary to understand the biogeochemical cycles of Fe and numerous other elements associated in the environment.
Quantifying Fe mineral composition in complex sediments and soils remains an analytical challenge. Bulk X-ray diffraction (XRD) is insensitive to poorly crystalline minerals such as ferrihydrite or to any trace constituent (Houben and Kaufhold, 2011; Johnston and Lewis, 1983). Scanning and transmission electron microscopy can characterize ferrihydrite, but they are qualitative and not suited to quantify ferrihydrite at low concentrations (Akai et al., 2004; Childs, 1992; Johnston and Lewis, 1983). Mӧssbauer spectroscopy can detect low concentrations of Fe minerals including ferrihydrite, but responds to magnetic domains, which can contain multiple phases for intergrown and highly-substituted structures (Ginn et al., 2017; Johnston and Lewis, 1983; Postma et al., 2010). Other common and easily available methods for studying ferrihydrite include Brunauer–Emmett–Teller (BET) surface area analysis, infrared analysis, differential thermal analysis, cation exchange capacity analysis, and chemical extraction (Houben and Kaufhold, 2011; Poulton and Canfield, 2005). However, these methods are often not sufficiently quantitative to interpret Fe mineral composition in sediments and soils.
Extended X-ray absorption fine structure (EXAFS) spectroscopy measures backscattering photoelectrons with energies above the absorption edge of an element of interest and allows characterization of the atomic number, near-neighbor distances, coordination number, and less directly, bond angles (Bertagnolli and Ertel, 1994; O’Day et al., 2004). It is element-specific, sensitive to diluted phases, and provides direct measures of structure even in non-crystalline phases. EXAFS, therefore, has been used to speciate Fe in sediments and soils, typically through linear combinations of reference spectra or theoretical shell-by-shell fitting (Hansel et al., 2005; Karlsson et al., 2008; Schroth et al., 2009; Sparks, 2004; Sun and Bostick, 2015). However, the capability of EXAFS analysis to distinguishing between minerals having similar structures, for example, ferrihydrite and goethite, has been questioned (O’Day et al., 2004; Schroth et al., 2009).
One approach to assess the reliability of EXAFS on quantifying Fe mineral composition is to examine the spectra of Fe mineral mixtures with known composition. Using this approach, O’Day et al (2004) verified that EXAFS could accurately interpret mixtures of Fe sulfide and non-sulfide (phyllosilicate ± oxide) minerals. However, few studies have assessed the performance of EXAFS using minerals mixed within the same structural class, let alone using complex natural sediments and soils. The method of standard-additions is widely used in liquid-phase analyses to increase confidence in quantification when interferences are a potential concern. In this approach, the linear regression of the instrument’s response to a known added amount of analyte is used to back-calculate the original concentration of the analyte by correcting for matrix effects and spectral interferences (Ellison and Thompson, 2008; Harris, 2010). Homogenization is a potential issue for using the standard-additions method on solids. In the solid phase, this method has been used for quantitative XRD (Harris, 2010; Hughes et al., 1994; Steenbruggen and Hollman, 1998), but, to our knowledge, has not been applied to quantify ferrihydrite by EXAFS.
This study applies both conventional EXAFS linear combination fitting (LCF) on a single sample and the method of standard-additions to quantify Fe mineral composition in natural sediments and mineral mixtures. Minerals used for spiking include ferrihydrite, goethite, and magnetite, all of which are Fe oxides but differ in arrangement of the basic octahedral structural units. Mineral compositions determined using the method of standard-additions were compared with those determined by conventional EXAFS-LCF method on unspiked samples, and with those determined independently by sequential extraction and 57Fe Mӧssbauer spectroscopy. Binary mineral mixtures were also prepared and examined.
2. MATERIAL AND METHODS
2.1 Natural Sediments
Two aquifer sediments were selected for this study: one from the fluvial floodplain of central Bangladesh, and the other from the Dover Municipal Landfill Superfund Site in New Hampshire, USA. The two sediments are referred to hereafter as Bangladesh sediments and Dover sediments, respectively. Bangladesh sediments were obtained from a freshly drilled borehole in the village of Purinda in Araihazar upazila (23.8541°N, 90.6354°E) (Mihajlov, 2014). Immediately following drilling using the traditional hand-flapper method, a 30 cm long, 1.8 cm ID sediment core was recovered at ~18 m below ground surface (BGS) from the borehole with a manual push corer (AMS 424.45). The sediment core, with top and bottom several centimeters discarded, was then capped, wrapped with electrical tape, sealed and refrigerated in a nitrogen-flushed airtight Mylar bag with oxygen adsorbents (Sorbent Systems). Bangladesh sediments were also sampled from this borehole into polypropylene microcentrifuge tubes, coated with glycerol to prevent exposure to oxygen and to preserve reduced Fe minerals, sealed and refrigerated in another nitrogen-flushed airtight Mylar bag with oxygen adsorbents. Dover sediments from the Superfund site were obtained between 9 and 12 m BGS in the southeast corner of the landfill perimeter by sonic vibration drilling. Immediately following retrieval, the sediments were sealed in a steel can with epoxy liners and refrigerated. Bangladesh sediments were composed of orange-colored sand, whereas Dover sediments were composed of a mixture of gray-colored fine sand, silt and clay. X-ray fluorescence (XRF) analysis using an InnovX Delta Premium instrument indicate that bulk Fe concentrations are 2.0% in both samples (concentrations reported in this study are all on a dry mass basis). Bulk Fe analyses of four certified references (National Institute of Standards and Technology NIST 2709, 2010, 2711, and Chinese Geochemical Standard GSS 1) and one internal standard (Standard Lamont Observatory Sediment from the Hudson SLOSH III) containing 2.9 – 4.3% Fe on the same XRF instrument were consistent within 93 – 102% of the certified or accepted values.
2.2 Iron Oxide Minerals
Ferrihydrite and goethite were synthesized following the procedures of Schwertmann and Cornell (2000): Ferrihydrite was prepared by precipitating ferric nitrate with potassium hydroxide at pH 7–8; goethite was prepared by oxidizing ferrous sulfate in the presence of carbonate at pH 6–7, which according to Schwertmann and Cornell (2000), has particle size and morphology close to various natural goethites. Ferrihydrite and goethite were freeze dried and stored as powder. Mineral identities were confirmed as 2-line ferrihydrite and microcrystalline goethite (micro-goethite), respectively, by XRD analysis (Supplementary Material Figure SA1). Magnetite was obtained from Ward’s Science and ground with an agate mortar-and-pestle to powder before use. The surface areas of the ferrihydrite, goethite and magnetite were 228, 24.9 and 2.77 m2 g−1, respectively, as determined by BET isotherm using nitrogen gas as adsorbate, although the actual surface area of ferrihydrite is likely underestimated by the BET method (Dzombak and Morel, 1990; Gustafsson, 2003). When calculating the concentrations of mineral additions, formulas Fe10O14(OH)2·0.74H2O, FeOOH and Fe3O4 were used for ferrihydrite, goethite and magnetite, respectively (Cornell and Schwertmann, 2003; Hiemstra, 2013).
2.3 Preparation of Standard-Additions and Mineral Mixtures
Bangladesh sediments from the core were freeze dried and mortar-and-pestle ground for an hour before use, producing homogenized dry powder. A 1 g aliquot of the powder was used as an unspiked Bangladesh sample. To assess the reliability of using EXAFS to quantify ferrihydrite, a 20 g aliquot of the powdered Bangladesh sediments were spiked with five increments of known ferrihydrite mass and homogenized by grinding. After each increment homogenization, 1 g of the mixture was removed and labeled as one of the standard-additions. This process achieved an added Fe concentration ranging from 2000 to 9000 mg kg−1 (added Fe fraction ranging from 9 to 32% of total Fe, Table SA1) and thus a bulk Fe concentration from 2.2 to 2.9%. To test the effectiveness of EXAFS analysis in separating potentially interfering species, Bangladesh sediments were also spiked with both ferrihydrite and goethite. Another 20 g aliquot of the powdered Bangladesh sediments and three combinations of ferrihydrite and goethite were used to achieve an added Fe concentration ranging from 6000 to 9000 mg kg−1 (from 23 to 31% of total Fe, Table SA1) and thus a bulk Fe concentration from 2.6 to 2.9%. The Dover samples were prepared with additions of ferrihydrite and in some cases also magnetite. To enable comparison of preparation methods, ~100 g of moist Dover sediments were used without prior drying or grinding, and Dover sediments and spiked mixtures were homogenized by stirring with a polypropylene spatula. A 1.5 g aliquot of the homogenized moist Dover sediments was used as an unspiked Dover sample. A 30 g aliquot of sediments was spiked with five increments of ferrihydrite with 1.5 g removed after each increment, achieving an added Fe concentration ranging from 2000 to 8000 mg kg−1 (from 8 to 29% of total Fe, Table SA2) and thus a bulk Fe concentration from 2.2 to 2.8%. Another 30 g aliquot of sediments was used for spiking with three combinations of both ferrihydrite and magnetite, with an added Fe concentration ranging from 4000 to 6000 mg kg−1 (from 15 to 22% of total Fe, Table SA2) and thus a bulk Fe concentration from 2.4 to 2.6%. Each of the Dover samples was coated with glycerol. The remainder (~38.5 g) of the 100 g Dover sediments was weighed before and after oven drying, to determine the water content (23.6%) and correct dry weight factor. Five binary mixtures in known ratios, either ferrihydrite-goethite as dry samples or ferrihydrite-magnetite as glycerol-coated samples, were also prepared (Table SA3). All the samples were sealed in polypropylene microcentrifuge tubes and refrigerated prior to analysis, and analyzed by EXAFS within 48 hours following preparation.
2.4 Iron EXAFS Spectra Collection and Processing
Iron K-edge EXAFS spectra were collected at the Stanford Synchrotron Radiation Laboratory (SSRL) on Beamlines 11-2 and 4-1, which were equipped with 100- and 32-element Ge detectors, respectively. An aliquot of each sample was sealed in Kapton tape, and analyzed in fluorescence mode. The monochromator crystal used was Si(220) with phi angle of 90 degrees. Soller slits and a 6 μx Mn filter were used to minimize the effects of scattered primary radiation. The beam was detuned as needed to reject higher-order harmonic frequencies and prevent detector saturation. Scans were calibrated by setting Fe metal foil edge inflection to 7112 eV. EXAFS spectra of many commonly encountered Fe reference compounds were previously collected at SSRL in a consistent fashion.
EXAFS spectra were processed using the SIXpack interface (Webb, 2005) unless mentioned otherwise. For each sample/reference, parallel EXAFS scans were averaged, normalized with linear pre-edge and quadratic post-edge functions, and converted to k3-weighted chi function with a threshold energy (E0) of 7124 eV. Relevant Fe mineral references to be included in linear combination fitting (LCF) were selected based on previously published studies on Bangladesh and Dover aquifers (Aziz et al., 2016; Jung et al., 2012; Mihajlov, 2014; Sun et al., 2016a; Sun et al., 2016b). To be specific, relevant references included ferrihydrite, micro-goethite, hematite, magnetite, Fe-bearing silicates, mackinawite, and siderite (reference spectra are in Figure SA2). Additionally, SPOIL values from target transform analysis were used as a statistical criteria to evaluate whether the references selected were suitable. The SPOIL value indicates whether the vector of the tested reference spectrum (i.e., target) fits well or instead increases the error in the matrix of sample spectra reproduced. Targets having SPOIL values < 6 could be potential references to be included in fitting (Beauchemin et al., 2002; Strawn and Baker, 2009). To further evaluate the ferrihydrite and micro-goethite references selected, EXAFS of ferrihydrite and four goethites in our spectral library were compared (details are in Table SA4). Then, least-squares LCF was performed over k-range of 2 to 13 Å−1, to quantify the fractions (mol% Fe) of individual references in the sample. Uncertainties for EXAFS-LCF fits were obtained by SIXpack, which include error propagation from fitting, spectral noise in sample and reference spectra, and similarities between reference spectra (Webb, 2005). For standard-additions, the fractions (mol% Fe) were converted to concentrations (mg Fe per kg sediments, i.e., mg kg−1), by simply multiplying bulk Fe concentrations. “EXAFS-LCF determined concentration” in this study thus refers to product of bulk Fe concentration and EXAFS-LCF determined fraction.
For each set of standard-additions, a linear regression model was generated between the added concentrations of the analyte (ferrihydrite, goethite or magnetite), xi, and the apparent (i.e., the sum of original and added) concentrations determined by EXAFS-LCF, yi. The original concentration in the unknown sample, which corresponds to the absolute value of the x-intercept of this regression, was back-calculated according to the formula (Harris, 2010):
| (1) |
where m and b are the slope and y-intercept. For the method of standard-additions, uncertainty on the original concentration was calculated according to the formula (Harris, 2010):
| (2) |
where N is the number of samples, m and b are the slope and y-intercept, and x̅ and y̅ are the average x- and y-values.
2.5 Additional Mineralogical Analyses
Sequential chemical extraction and 57Fe Mössbauer spectroscopy were used to provide independent measurements of Fe mineral composition that could be compared with EXAFS analysis. The sequential extraction procedure (see Table SA5 for details) was based on Poulton and Canfield (2005) and used in our previously published studies (Poulton and Canfield, 2005; Sun et al., 2016a; Sun et al., 2016b). The procedure includes four main steps to distinguish pools of Fe: (1) a 24 hr acetate extraction targeting carbonates, including siderite; (2) a 48 hr hydroxylamine-hydrochloride extraction targeting short-range-ordered oxides, including ferrihydrite; (3) a 2 hr dithionite-citrate extraction targeting crystalline oxides, including bulk goethite and hematite; and (4) a 6 hr ammonium oxalate extraction targeting recalcitrant oxides, including magnetite and presumably residual hematite from the previous step. Each extraction step was repeated once before proceeding to the next. Unspiked and spiked Bangladesh sediments were subjected to extraction after their EXAFS spectra were collected. The Dover samples prepared above were not used because they were glycerol-coated or oven-dried. Instead, fresh moist Dover sediments from the same container were freeze-dried, ground to powder, and subjected to extraction. Extractions were conducted at room temperature in constantly agitated polyethylene centrifuge tubes. Dissolved Fe concentrations in the extractions were determined by inductively coupled plasma mass spectrometry (Thermo Fisher Scientific Element XR) using previously published procedures (Sun et al., 2016a; Sun et al., 2016b).
57Fe Mӧssbauer spectroscopy was used, on unspiked Bangladesh sediments, to further assess Fe mineral composition. The analysis and spectra fitting routine were consistent with previously published procedures (Tishchenko et al., 2015). Mӧssbauer spectroscopy was performed with a variable temperature He-cooled system with a 1024 channel detector. A 57Co source embedded in a Rh matrix was used at room temperature. Velocity (gamma-ray energy) was calibrated using α-Fe foil at 298 K. The transducer was operated in constant acceleration mode and folding was performed to achieve a flat background. Each Fe mineral (site population) was quantified by the spectral fitting as a fraction of the total Fe spectral area. Quantification in this manner assumes equal Mӧssbauer recoilless fractions of all detected minerals, which should be valid at cryogenic temperatures and also be a good approximation at room temperature with dry samples (Tishchenko et al., 2015). Mӧssbauer analysis was also conducted on the synthesized ferrihydrite and goethite minerals. Additional details are contained in the Supplementary Material Section B.
Powder X-ray Diffraction (XRD) was also used, to determine sediment bulk mineralogy, including seeking to detect any possible Fe minerals. XRD analysis was carried out using a PANalytical X’pert3 Powder diffractometer, equipped with a PIXcel1D detector and a rotating sample stage. The diffractometer used Cu K-alpha radiation and scanned over 2θ range from 4° to 80°, with a step size of 0.013° and a counting time of 1 min per step.
3. RESULTS
3.1 Iron Mineral References Included in EXAFS-LCF
For unknown multi-mineral assemblages, EXAFS-LCF requires proper identification of the minerals present and inclusion of their spectra in fitting. To be consistent with previously published studies (Aziz et al., 2016; Jung et al., 2012; Mihajlov, 2014), ferrihydrite, micro-goethite, hematite, magnetite, Fe-bearing silicates, mackinawite, and siderite were selected as references for the samples derived from the Bangladesh sediments. These references were then evaluated based on their SPOIL values. Ferrihydrite and micro-goethite, which were used in spiking Bangladesh sediments, had SPOIL values of 2.91 and 4.45, respectively; the other selected references also had SPOIL values < 6 and thus were acceptable references in EXAFS-LCF (Table SA6). To be consistent with previously published studies on the Dover Superfund site (Sun et al., 2016a; Sun et al., 2016b), the minerals selected for the Bangladesh sediments were also selected as references for the samples derived from the Dover sediments. Ferrihydrite and magnetite, which were used in spiking Dover sediments, had SPOIL values of 1.45 and 1.92, respectively; the other references also had SPOIL values < 6 (Table SA6).
In addition, the spectral signatures of ferrihydrite, micro-goethite and three other environmentally relevant goethites, which vary with particle size and morphology, were compared (Figure 1 and Figure SA3). Variations between their EXAFS spectra were mostly observed over the k-range of 5 – 10 Å−1, where Fe backscattering has the highest amplitude. Although the interatomic Fe-Fe distances in these minerals are roughly the same, the Fe-Fe shells in micro-goethite have higher amplitudes than those in ferrihydrite and in nanocrystalline goethite (nano-goethite) (Figure 1B). Micro-goethite also show high spectral similarity with the two natural goethites available (Figure 1 and Figure SA3). Because micro-goethite closely resembles natural goethites in soils and sediments (Bertsch and Seaman, 1999; Schwertmann and Cornell, 2000) and was the goethite used for spiking the sediment samples, micro-goethite was regarded as the most appropriate goethite reference.
Figure 1.
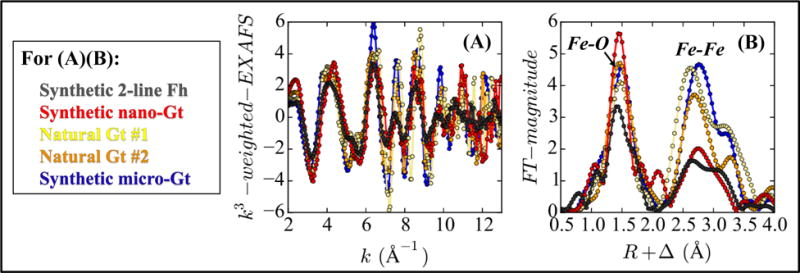
(A) k3-weighted EXAFS spectra of ferrihydrite (Fh) and goethite (Gt), over k range of 2 – 13 Å−1. (B) Corresponding radial structure functions, over R range of 0.5 – 4.0 Å. Details about these minerals are in Table SA4, and their continuous Cauchy wavelet transformed EXAFS spectra are in Figure SA3.
3.2 Iron Mineral Composition of Unspiked Sediments
For unspiked Bangladesh sediments, EXAFS-LCF (Table 1 and Table SA1) indicated a ferrihydrite concentration of 12700 ± 1700 mg kg−1 (64% ± 9% of total Fe) and a goethite concentration of 1740 ± 660 mg kg−1 (9% ± 3% of total Fe). EXAFS-LCF also reported similar results on glycerol-coated sediment samples collected from the same borehole (Figure SA4). Consistent with EXAFS-LCF, sequential extraction and 57Fe Mӧssbauer spectroscopy identified short-range-ordered Fe phases (e.g., Ferrihydrite and nano-goethite) as the major Fe phases. Sequential extractions (Table 1 and Table SA7) indicated an amorphous Fe oxide concentration of 7770 mg kg−1 (39% of total Fe, 58% of extractable Fe) and a crystalline Fe oxide concentration of 3620 mg kg−1 (18% of total Fe, 27% of extractable Fe). 57Fe Mӧssbauer spectroscopy (Table 2, Figure 2 and Table SB1) indicates a ferrihydrite concentration of 5370 ± 990 mg kg−1 (27% ± 5% of total Fe), a nano-goethite concentration of 4180 ± 200 mg kg−1 (21% ± 1% of total Fe), and an unidentified, highly disordered nano-scale Fe(III) oxyhydroxide concentration of 3780 ± 600 mg kg−1 (19% ± 3% of total Fe), which likely represents highly-substituted ferrihydrite or nano-goethite phases. As expected, XRD analysis could not identify ferrihydrite or any other Fe mineral in the Bangladesh sediments (Figure SA5).
Table 1.
Comparison between different methods of quantifying ferrihydrite, in aquifer sediment samples from Bangladesh and Dover. Results are reported in both Fe concentrations (mg kg−1) and fractions (% of total and extractable Fe).
| Sediments | Analytical technique | Conventional single-sample method | Method of standard-additions | ||
|---|---|---|---|---|---|
| Concentration | Fraction | Concentration | Fraction | ||
| Bangladesh | EXAFS-LCF | 12700 ± 1700 mg kg−1 | total: 64 ± 9% | 13200 ± 2000 mg kg−1 | total: 66 ± 10% |
| Hydroxylamine-HCl extraction | 7770 mg kg−1 |
total: 39% extractable: 58% |
6810 ± 1360 mg kg−1 |
total: 34 ± 7% extractable: 49 ± 10% |
|
| Dover | EXAFS-LCF | 8140 ± 1690 mg kg−1 | total: 41 ± 9% | 1020 ± 1000 mg kg−1 | total: 5 ± 5% |
| Hydroxylamine-HCl extraction | 1420 mg kg−1 |
total: 7% extractable: 18% |
– | – | |
Table 2.
Mӧssbauer Fe assignments in unspiked Bangladesh sediments. Fh = ferrihydrite, nGt = nano-goethite, and nano-Fe(III) = an unidentified, highly disordered nano-scale Fe(III) oxyhydroxide. Results are reported in both Fe concentrations (mg kg−1) and fractions (% of total Fe). Uncertainties are 2 standard deviations calculated from the Recoil™ Software. Details on 57Fe Mӧssbauer data collection and interpretation are given in Supplementary Material Section B.
| Site population | Concentration | Fraction | |
|---|---|---|---|
| Fe(III) in oxyhydroxides | Fh-like Fe(III) | 5370 ± 990 mg kg−1 | 27 ± 5% |
| nGt-like Fe(III) | 4180 ± 200 mg kg−1 | 21 ± 1% | |
| Nano-Fe(III) | 3780 ± 600 mg kg−1 | 19 ± 3% | |
| Fe(III) in clay and/or organic matter | 4580 ± 600 mg kg−1 | 23 ± 3% | |
| Fe(II) in clays and/or sorbed | 1790 ± 200 mg kg−1 | 9 ± 1% | |
| Fe(II) in ilmenite | 200 ± 200 mg kg−1 | 1 ± 1% | |
Figure 2.
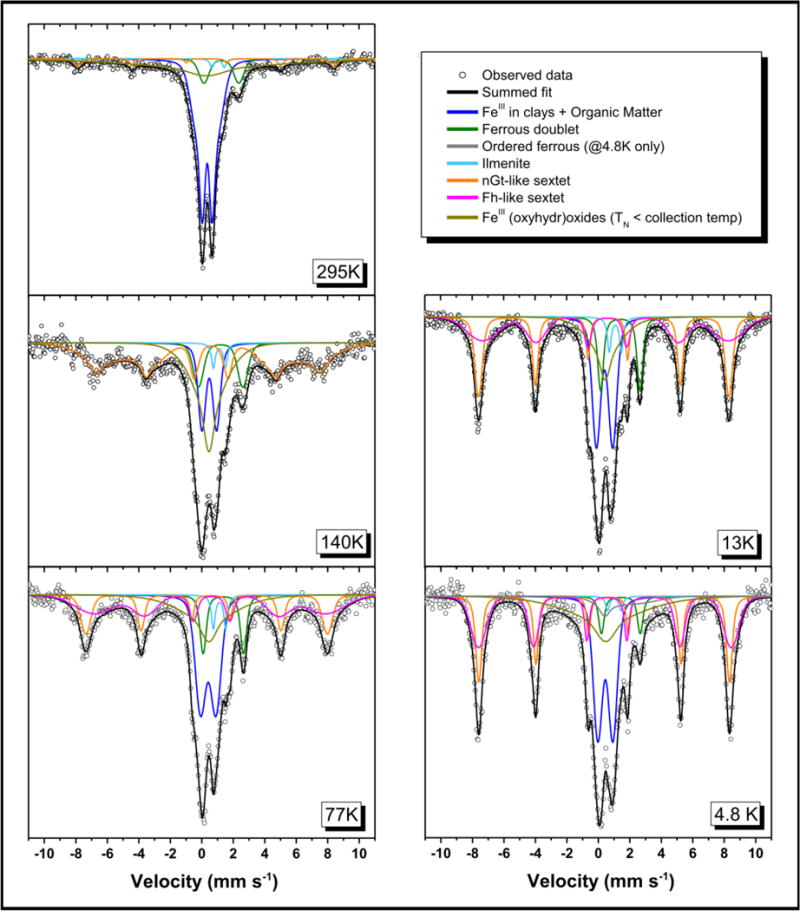
57Fe Mössbauer spectra of unspiked Bangladesh sediments at 295K, 140K, 77K, 13K and 5K. In each spectrum, the black line is the total calculated fit, through the discrete data points. The resolved spectral components and assignments are: (1) Fe(III) in clay minerals and organic matter (blue line); (2) Fe(II) in sheet silicates or sorbed Fe2+ (dark green line); (3) Fe(II) sorbed to magnetically ordering Fe(III) minerals (gray line); (4) Fe(II) in ilmenite (light blue line); (5) Fe(III) in nano-goethite (orange line); (6) Fe(III) in ferrihydrite (pink line); and (7) Fe(III) in unidentified even more disordered nano-scale oxyhydroxide mineral(s) (umber line).
For unspiked Dover sediments, EXAFS-LCF (Table 1 and Table SA2) indicated a ferrihydrite concentration of 8140 ± 1690 mg kg−1 (41% ± 9% of total Fe) and a magnetite concentration of 0 ± 470 mg kg−1 (0% ± 2% of total Fe). Compared to EXAFS-LCF fits, sequential extraction (Table 1, Table SA7 and Figure SA6) indicated a much lower concentration of amorphous Fe oxide, 1420 mg kg−1 (7% of total Fe, 18% of extractable Fe), and a higher concentration of recalcitrant Fe oxide, 2130 mg kg−1 (11% of total Fe, 27% of extractable Fe). Again, XRD analysis failed to identify any Fe mineral in the Dover sediments (Figure SA5).
3.3 Performance of EXAFS-LCF on Known Binary Mineral Mixtures
To determine if EXAFS-LCF can quantify ferrihydrite in the presence of other Fe minerals, known ferrihydrite-goethite mixtures and ferrihydrite-magnetite mixtures were examined. Fits were performed with spectra of the two known end-members, and also with spectra of all the environmentally relevant minerals that were used to fit natural sediments (Figure 3 and Table SA3). In either case, EXAFS-LCF fits agreed with known composition (Figure 4). When extra mineral references were used, EXAFS-LCF incorrectly reported a low concentration, 4% on average, of Fe-bearing silicates but correctly excluded four minerals that were not present.
Figure 3.
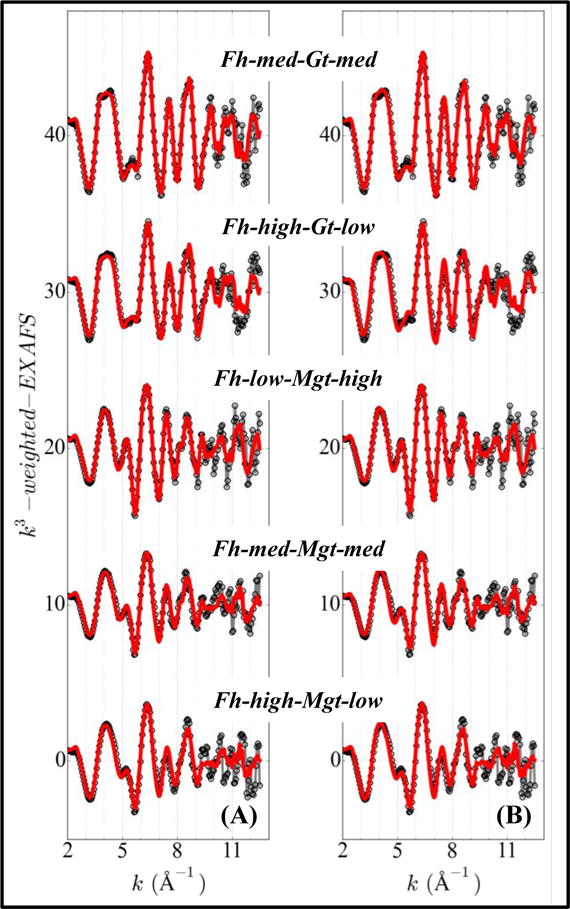
Iron EXAFS spectra and fits of binary mixtures of ferrihydrite (Fh), goethite (Gt) and magnetite (Mgt). Solid gray lines with open symbols: sample spectra; solid lines: EXAFS-LCF fits. (A) EXAFS-LCF was done with two ‘end-member’ reference spectra; (B) EXAFS-LCF was done with all the environmentally relevant reference spectra used for natural sediments.
Figure 4.
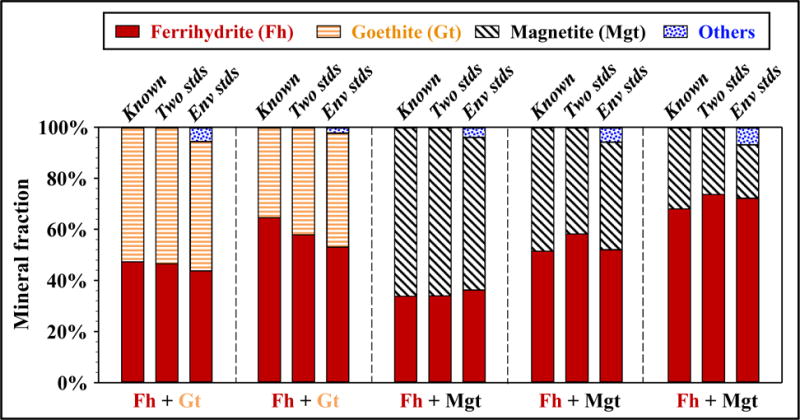
Comparison between known (actual) fractions of minerals and those determined by EXAFS-LCF, for binary mixtures of ferrihydrite, goethite and magnetite. No natural sediments were involved in these samples. For each sample, left column: known fractions – Known, middle column: EXAFS-LCF using two end-member references – Two stds, right column: EXAFS-LCF using all the environmentally relevant references – Env stds.
3.4 Iron Mineral Composition Quantified By the Method of Standard-Additions
EXAFS-LCF combined with the method of standard-additions was used to increase confidence in the quantification of Fe minerals in natural complex samples (Figure 5). For Bangladesh sediments, EXAFS-LCF fits on samples with ferrihydrite added in known concentrations (ferrihydrite-additions, Figure 6A) indicated an original ferrihydrite concentration of 13200 ± 2000 mg kg−1 (66% ± 10% of total Fe), and fits on goethite-additions (Figure 6B) indicated an original goethite concentration of 2680 ± 910 mg kg−1 (13% ± 5% of total Fe). When the concentrations of goethite were changing, the EXAFS-LCF fits on ferrihydrite stayed constant; for sediments unspiked and spiked with ferrihydrite/goethite, EXAFS-LCF fits of the other Fe minerals including Fe-bearing silicates stayed nearly identical (Table SA1). The method of standard-additions was also combined with sequential extractions. The concentration of Fe solubilized in hydroxylamine-HCl extraction step increased proportionally with increments of ferrihydrite spiked into Bangladesh sediments (Figure 7A). Hydroxylamine-HCl extractions on ferrihydrite-additions indicated an original amorphous Fe oxide concentration of 6800 ± 1360 mg kg−1 (34% ± 7% of total Fe, 49% ± 10% of extractable Fe). Responding to the additions of ferrihydrite, EXAFS-LCF and extractions both correctly indicated increased ferrihydrite concentrations, whereas XRD was insensitive as expected (Figure SA7).
Figure 5.
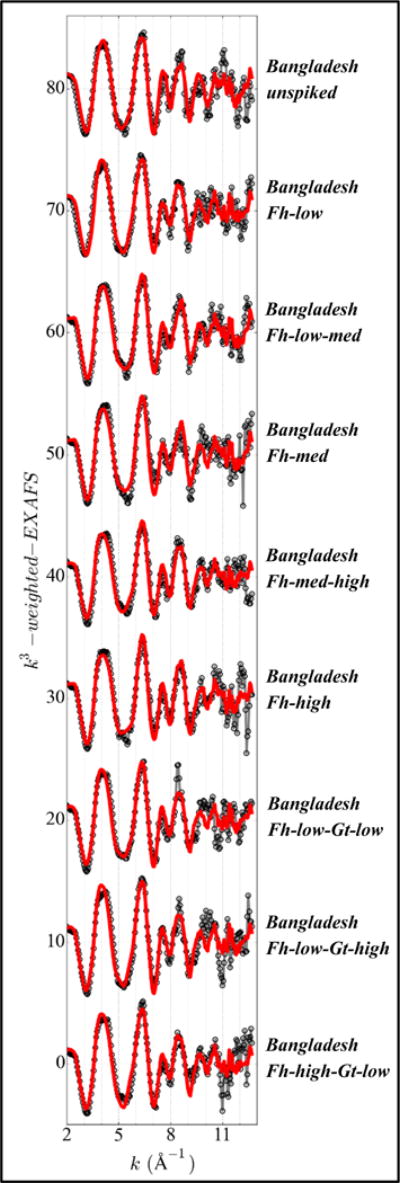
Iron EXAFS spectra and fits of unspiked and spiked Bangladesh sediments. Solid gray lines with open symbols: sample spectra; solid lines: EXAFS-LCF fits.
Figure 6.
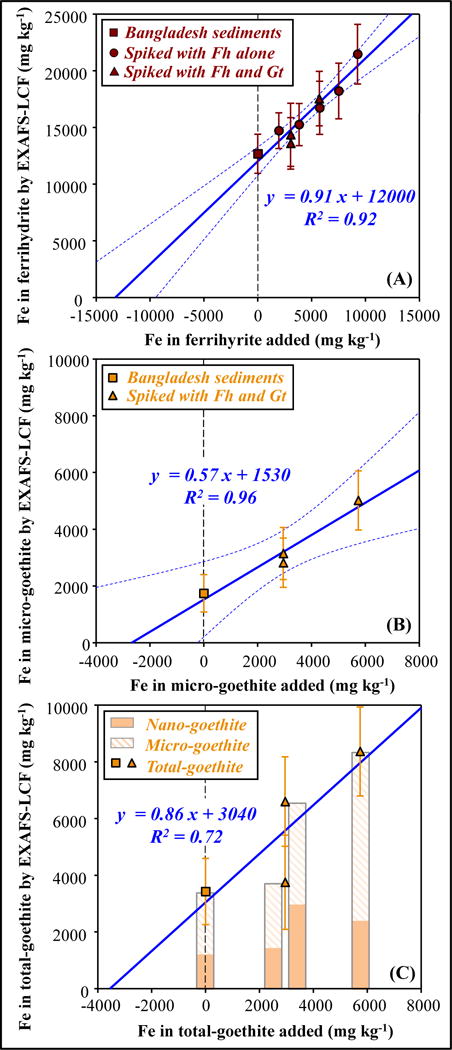
Comparison between added concentrations of (A) ferrihydrite (B)(C) goethite, and the concentrations determined by EXAFS-LCF, for unspiked and spiked Bangladesh sediments. “EXAFS-LCF determined concentration” refers to product of bulk Fe concentration and EXAFS-LCF determined fraction. Solid blue lines represent linear regressions; dashed blue lines, if shown, represent 95% confidence bands. In (C), nano-goethite was included in LCF, the two bars in the middle are offset for clarity.
Figure 7.
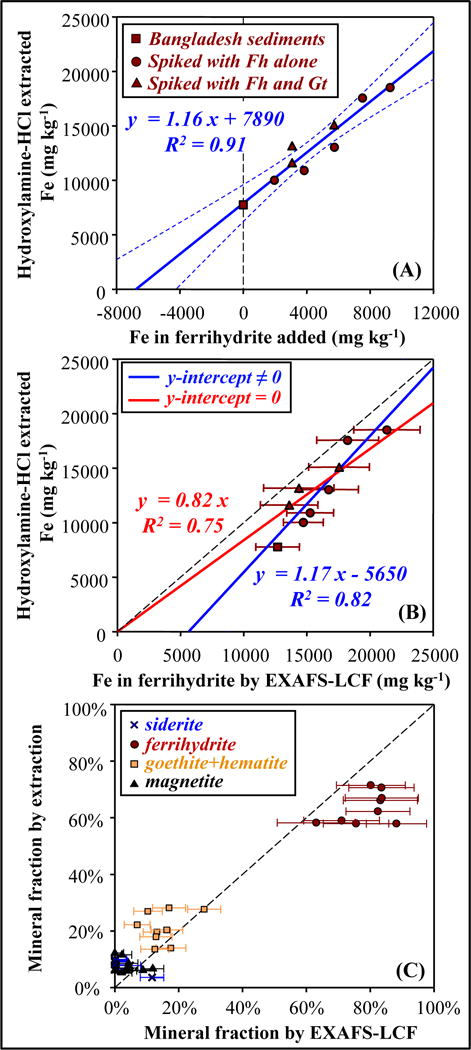
Comparison between (A) added (B) EXAFS-LCF determined concentrations of ferrihydrite, and the concentrations solubilized in hydroxylamine-HCl extractions, for unspiked and spiked Bangladesh sediments. (C) Comparison between Fe mineral compositions determined by extraction and by EXAFS-LCF. For extraction, fractions of extractable Fe were used. Fractions and uncertainties determined by EXAFS-LCF were re-calculated correspondingly.
For Dover sediments, EXAFS-LCF fits on ferrihydrite-additions, on the whole, indicated lower original ferrihydrite concentration than fits on the single unspiked sample (Figure 8 and Figure 9A). If the unspiked Dover sample was excluded, EXAFS-LCF fits on ferrihydrite-additions indicated an original ferrihydrite concentration of 1020 ± 1000 mg kg−1 (5% ± 5% of total Fe). Compared to Bangladesh ferrihydrite-additions, the data on Dover ferrihydrite-additions showed more scatter (Figure 6A versus Figure 9A). EXAFS-LCF fits on Dover magnetite-additions (Figure 9B) indicated an original magnetite concentration of 130 ± 300 mg kg−1 (1% ± 2% of total Fe).
Figure 8.
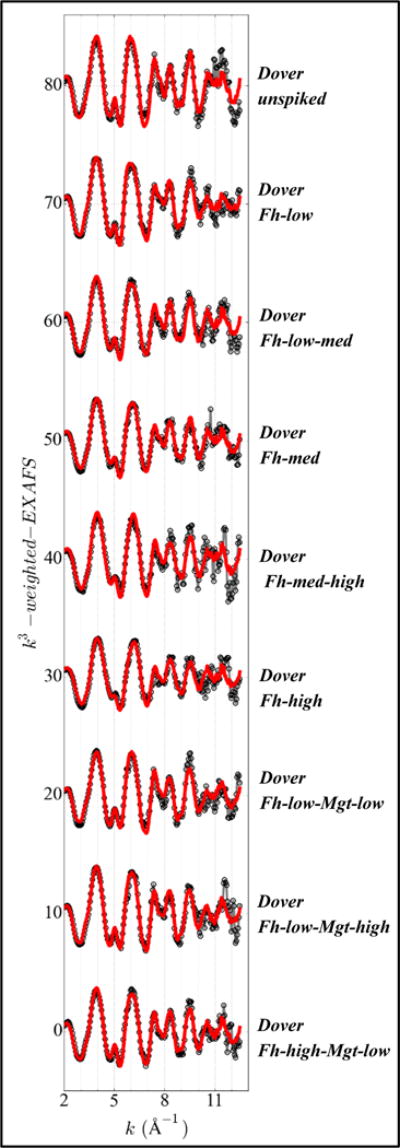
Iron EXAFS spectra and fits of unspiked and spiked Dover sediments. Solid gray lines with open symbols: sample spectra; solid lines: EXAFS-LCF fits.
Figure 9.
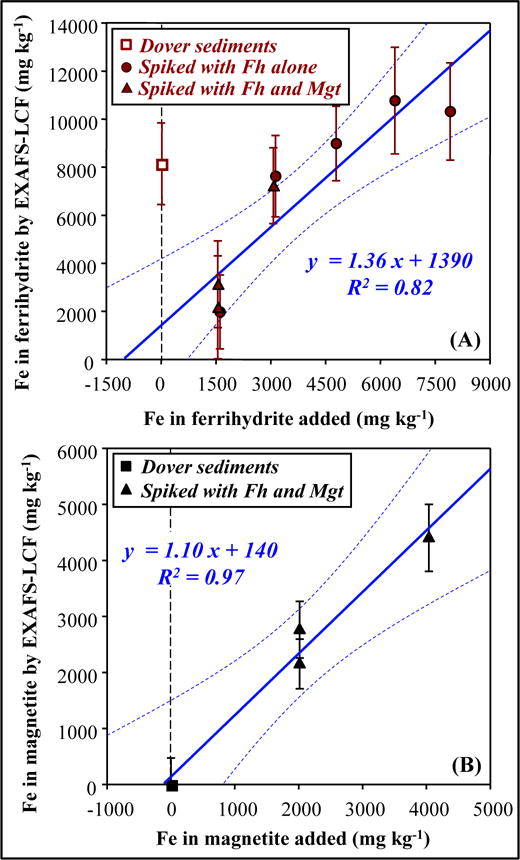
Comparison between added concentrations of (A) ferrihydrite (B) magnetite, and the concentrations determined by EXAFS-LCF, for unspiked and spiked Dover sediments. “EXAFS-LCF determined concentration” refers to product of bulk Fe concentration and EXAFS-LCF determined fraction. In (A), the open square symbol represents the unspiked sample, which was not used in linear regression.
4. DISCUSSION
4.1 Comparison of Methods of Quantifying Ferrihydrite
To determine if the “ferrihydrite” detected by EXAFS-LCF was truly ferrihydrite, this method was tested on known binary mineral mixtures (Figure 4). The result indicated that ferrihydrite could be differentiated from micro-goethite or other Fe oxides using EXAFS-LCF, even though their spectral similarity can complicate such differentiation (O’Day et al., 2004). EXAFS-LCF fits with extra mineral references agreed with fits with the two end-members, which further indicated the robustness of EXAFS-LCF and, to some extent, the uniqueness of the reference spectra. However, when extra references were used, as much as 4% of a component, often Fe-bearing silicates, might be included when it is not present (Table SA3). This indicates that the practical detection limit of EXAFS-LCF is on the order of 3 – 5%, similar to what was observed in other studies (O’Day et al., 2004).
For complex sediments/soils, if references are well defined, conventional EXAFS-LCF is effective at quantifying ferrihydrite; if Fe-bearing silicates or other minerals are variable in structure or not representatively described by a few references, then conventional EXAFS-LCF alone might be less accurate. An advantage of combining EXAFS-LCF with the method of standard-additions is that fitting error(s) caused by the choice of references is distributed uniformly over unspiked and spiked samples, at least when the addition does not appreciably change the bulk Fe concentration (in this study, the addition of Fe oxide minerals increased bulk Fe concentration from 2.0% to 2.2~2.9% in Bangladesh sediments and from 2.0% to 2.2~2.8% in Dover sediments). As such, the accuracy of quantifying ferrihydrite instead depends on the sensitivity of EXAFS to measure changes in the abundance of ferrihydrite. For Bangladesh sediments, the regression for ferrihydrite showed good linearity and a slope close to 1, and was not affected by the samples simultaneously spiked with goethite (Figure 6A). This indicates that EXAFS-LCF is able to respond systematically to additions of ferrihydrite in multi-mineral assemblages, even in the presence of goethite. Furthermore, the fits of the other minerals including Fe-bearing silicates stayed constant (Table SA1), indicating that they did not bias fits. For Bangladesh sediments, ferrihydrite quantified by EXAFS-LCF standard-additions agreed with the conventional EXAFS-LCF method on a single unspiked sample, and also had comparable uncertainty (Table 1). Given detailed prior work identified all the key references to include in the LCF model (Aziz et al., 2016; Jung et al., 2012; Mihajlov, 2014), it is expected that the EXAFS-LCF standard-additions and single sample methods agree. In cases where no prior work on Fe mineralogy is available, the concentration and uncertainty determined by EXAFS-LCF standard-additions should be more reliable given that it is less affected by the choice of other references.
Ferrihydrite in the Bangladesh sediments was also quantified by 57Fe Mӧssbauer spectroscopy and sequential extraction. Mössbauer is extremely sensitive to the degree of short-range ordering or crystallinity — much more so than EXAFS or XRD — such that the most highly substituted or disordered Fe oxyhydroxide phases exhibit only partial ordering (a collapsed sextet) at 5K (Figure 2). These highly-disordered phases may have angstrom-level atom spacing consistent with ferrihydrite or goethite, but regardless, the phases do not exhibit crystal ordering beyond a few nanometers. For Bangladesh sediments, nearly half of the Fe magnetically orders was consistent with either ferrihydrite or these highly disordered, nanocrystalline Fe(III) phases, which agreed with the abundance of ferrihydrite detected using EXAFS (Tables 1 and 2). Mӧssbauer spectroscopy also indicated broadly consistent composition of the other Fe minerals with EXAFS-LCF and validated the choice of mineral references included in fitting. As for sequential extraction, although it has certain limitations, this method is unique in that each extraction step corresponds to the reactivity of specific mineral class (Poulton and Canfield, 2005). Compared to ferrihydrite concentrations determined by EXAFS-LCF, the concentrations of hydroxylamine-HCl extractable Fe were consistently lower (Figure 7B and 7C). This can be attributed to incomplete extractions, something that is commonly observed in extraction experiments (Bacon and Davidson, 2008; Gleyzes et al., 2002). Nevertheless, hydroxylamine-HCl extraction, both conventional and combined with standard-additions, indicated significant concentration of amorphous Fe oxides in Bangladesh sediments (Table 1).
Conventional EXAFS-LCF also detected ferrihydrite in the Dover sediments (Table 1). However, this result disagrees with previous studies on the Dover Superfund site (Sun et al., 2016a; Sun et al., 2016b). The Dover sediments were gray-colored sediments from underneath a landfill that should contain limited quantity of oxidized reactive Fe. EXAFS-LCF fits on Dover ferrihydrite-additions successfully revealed the lack of ferrihydrite in the original sample (Figure 9A), which was further supported by hydroxylamine-HCl extraction (Table 1). The difference between EXAFS-LCF on a single sample and standard-additions, therefore, most likely reflects sediment heterogeneity or potentially sample preservation issue. For complex sediment/soil samples, it is hard to envision small aliquots being perfectly representative all the time. Such issues are not something that EXAFS-LCF itself or other analytical techniques can overcome. Furthermore, the Dover ferrihydrite-additions were less linear than Bangladesh ferrihydrite-additions (Figure 6A versus Figure 9A). The poorer fit is likely a result of difficulty with homogenizing small volumes of unpowdered solid materials, especially when they contain mixtures of sand, silt and clay. The comparison implies that grinding is a better method for homogenization.
4.2 Adequacy of EXAFS in Distinguishing Between Different Goethites
For the Bangladesh sediments, conventional EXAFS-LCF quantified a lower concentration of goethite than the EXAFS-LCF standard-additions method (Figure 6B). This apparent disagreement is likely because the synthetic micro-goethite used for spiking was not perfectly representative of the natural goethite in the Bangladesh sediments. Although in theory such micro-goethite is close to natural goethites (Bertsch and Seaman, 1999; Schwertmann and Cornell, 2000), in reality soil and sedimentary goethites are variable in composition and structure. [Note that ferrihydrite may also exhibit structural variations, partially due to interferences from aluminum and silicon (Adra et al., 2013; Wang et al., 2015).] Independent evidence from the Mossbauer analysis indicates that the Fe(III) oxides in the unspiked Bangladesh sediments at 295K are superparamagnetic or near their blocking temperature (Supplementary Material Section B). This contrasts with the synthetic micro-goethite used in the standard-additions experiment, which yielded a full sextet at 295K (Table SB2 and Figure SB1). Thus, natural goethite in the Bangladesh sediments is more disordered or of smaller particle size than the synthesized micro-goethite and similar to nano-goethites typically found in highly weathered soils and sediments (Ginn et al., 2017; Thompson et al., 2011; Tishchenko et al., 2015; van der Zee et al., 2003).
While ferrihydrite and micro-goethite have sufficiently distinct EXAFS spectra, it appears that the EXAFS spectra of ferrihydrite and nano-goethite are similar (Figure 1 and Figure SA3). If micro-goethite and nano-goethite were both present in the sample, including only the micro-goethite reference in fitting would possibly result in an underestimation of goethite and an overestimation of ferrihydrite concentrations. One potential solution is to include both micro- and nano-goethite in fitting. The goethite-like phases detected by Mössbauer (21% of total Fe, Table 2) were best approximated by nano-goethite standards and those phases exhibited a continuum of crystallinity based on ordering temperature that is consistent with multiple populations of goethite (Supplementary Material Section B.3.2). This suggests using two goethite references in EXAFS-LCF could be effective to differentiate goethite based on crystallinity. To test this idea, EXAFS-LCF were redone on Bangladesh goethite-additions with including both micro- and nano-goethite as references (Table SA8). From a statistical perspective based on the goodness-of-fit parameter, reduced χ2, including nano-goethite did not significantly improve the individual fits. This is not surprising considering that the spectral signature of nano-goethite can be described (or say masked) by the combination of ferrihydrite and micro-goethite. Nevertheless, using the method of standard-additions, the regression combining micro- and nano-goethite had a slope of 0.82 (Figure 6C), much closer to 1 than fits using micro-goethite alone (a slope of 0.57, Figure 6B). The new fits indicated an original goethite concentration of 3430 ± 1170 mg kg−1 (17% ± 6% of total Fe) from conventional EXAFS-LCF and 3530 ± 2960 mg kg−1 (18% ± 15% of total Fe) from standard-additions. The new fits suggested a nano-goethite concentration of about 2000 mg kg−1 (10% of total Fe, Figure 6C), which was previously fit as ferrihydrite. Using nano-goethite alone (no micro-goethite) in fitting resulted in unstable fits for goethite and other Fe minerals (Table SA8).
The inclusion of nano-goethite (in addition to ferrihydrite and micro-goethite) in EXAFS-LCF, especially when combined with standard-additions, may provide more mineralogical information than has previously been possible. However, using spectroscopically similar references in fitting produces larger uncertainty (Figure 6C) and increases complexity in data interpretation.
5. CONCLUSIONS AND IMPLICATIONS
This study verified the capability of EXAFS analysis to distinguishing ferrihydrite from other Fe minerals including micro-goethite, and verified the accuracy of conventional EXAFS-LCF. This is a timely, important verification as EXAFS analysis has been becoming one of the most popular analytical geochemical research tools. Furthermore, this study represented an initial attempt to apply the method of standard-additions to EXAFS-LCF analysis (and also to sequential extraction) using real sediments. Such application improves our ability to quantify Fe mineral composition in complex natural samples. In addition to Fe minerals, our general observations regarding quantification could be transferable to EXAFS-based analysis of other mineral phases. Due to limited time available on synchrotron-based EXAFS techniques, increased number of analyses required for standard-additions, as well as effort required for sample preparation including homogenization, it is probably difficult to involve standard-additions in routine EXAFS analysis. Nevertheless, such application provides a means of more conclusively detecting short-range-ordered minerals in unknown matrices. Data from the method of standard-additions are also less biased by any single sample when heterogeneity is present (as is often the case with natural sediments and soils). To evaluate the performance of EXAFS-LCF standard-additions more comprehensively, continued efforts are required and could be put into studying samples with unusually high or low bulk Fe concentrations, more variable degrees of crystallization, aluminum-substituted ferrihydrite and goethite, and variable contents of organic Fe species etc.
Another finding of this study is that all applied methods reveal the presence of ferrihydrite in Bangladesh sediments (Figure 10). This finding is significant because this short-range-ordered mineral is highly reactive with respect to microbial reduction, metal(loid) retardation and other processes. The Bangladesh sediments were obtained from a low-arsenic Pleistocene aquifer that provides critical drinking water resources in South and Southeast Asia, because groundwater of Holocene aquifers is contaminated with arsenic (Harvey et al., 2002; Horneman et al., 2004; Mihajlov, 2014; Zheng et al., 2005). Despite the broad consensus that Fe(III) oxides are more prevalent in Pleistocene aquifers than in Holocene aquifers, the presence of easily reducible ferrihydrite in Pleistocene aquifers is controversial, and as a result, ferrihydrite is often assumed to be absent (Jessen et al., 2012; Polizzotto et al., 2006; Stollenwerk et al., 2007). The multiple approaches applied in this study consistently indicate the presence of ferrihydrite (and nano-goethite) in Pleistocene aquifers and minimize the chances of a fitting artifact or incorrect attribution. This points out the need to better understand and document the distribution of ferrihydrite in these Pleistocene aquifers, to ensure more robust predictions of the long-term fate of arsenic and to design suitable remediation measures.
Figure 10.
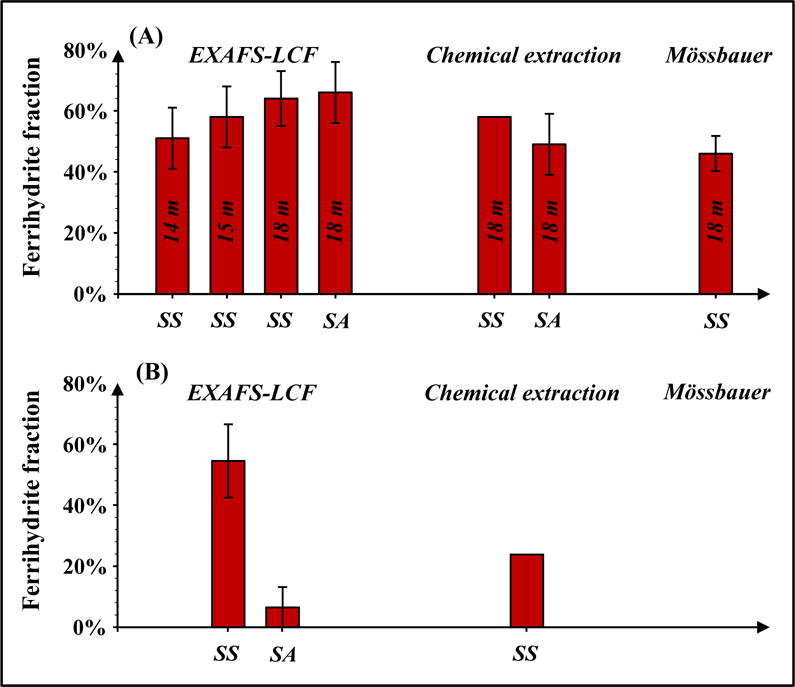
Summary histogram from all applied methods that quantified ferrihydrite in (A) Bangladesh sediments and (B) Dover sediments. SS = single-sample method, SA = standard-additions. In (A) the Bangladesh case, most analyses were conducted on the freeze-dried sediments, which were sampled at 18 m. Two additional samples were collected in the same borehole at 14 and 15 m, respectively, coated with glycerol, and also analyzed by EXAFS-LCF. For chemical extraction, fractions of extractable Fe were used. For Mӧssbauer, fractions of Fh-like and nano-Fe(III) were summed.
Supplementary Material
HIGHLIGHTS.
We combine standard-additions method with EXAFS linear combination fitting (LCF) to quantify sediment iron mineralogy.
Such combination provides an advanced means of detecting ferrihydrite and goethite.
The accuracy of conventional EXAFS-LCF method is verified.
Ferrihydrite and microcrystalline goethite can be distinguished and quantified by EXAFS-LCF.
Reactive ferrihydrite was identified in Bangladesh sediments obtained from a low-arsenic Pleistocene aquifer.
Acknowledgments
This study was financially supported by National Institute of Environmental Health Sciences grants ES010349 and ES009089. Synchrotron based EXAFS analysis was conducted at SSRL, a national user facility operated by Stanford University for the U.S. Department of Energy. Mössbauer analysis was funded by NSF grants EAR-1331846, EAR-1331841, EAR-1451508, and DEB-1457761 to A. Thompson. We are grateful to I. Mihajlov for providing the sediments from Bangladesh, J. Ross for assisting with sampling in Dover, A. Park for BET surface area measurement, and R. Davis for technical support during EXAFS data collection. This is LDEO Contribution Number 8168.
APPENDIX. SUPPLEMENTARY MATERIAL
Section A contains data on individual concentrations/fractions of the Fe mineral additions, EXAFS spectra of the references, the detailed EXAFS-LCF results, sequential extraction scheme and detailed extraction results, XRD patterns, etc. Section B contains details on 57Fe Mӧssbauer data collection and interpretation.
References
- Adra A, et al. Arsenic scavenging by aluminum-substituted ferrihydrites in a circumneutral pH river impacted by acid mine drainage. Environmental science & technology. 2013;47(22):12784–12792. doi: 10.1021/es4020234. [DOI] [PubMed] [Google Scholar]
- Akai J, et al. Mineralogical and geomicrobiological investigations on groundwater arsenic enrichment in Bangladesh. Applied Geochemistry. 2004;19(2):215–230. [Google Scholar]
- Aziz Z, et al. Evidence of decoupling between arsenic and phosphate in shallow groundwater of Bangladesh and potential implications. Applied Geochemistry. 2016 doi: 10.1016/j.apgeochem.2016.03.001. [DOI] [PMC free article] [PubMed] [Google Scholar]
- Bacon JR, Davidson CM. Is there a future for sequential chemical extraction? Analyst. 2008;133(1):25–46. doi: 10.1039/b711896a. [DOI] [PubMed] [Google Scholar]
- Beauchemin S, Hesterberg D, Beauchemin M. Principal component analysis approach for modeling sulfur K-XANES spectra of humic acids. Soil Science Society of America Journal. 2002;66(1):83–91. [Google Scholar]
- Bertagnolli H, Ertel TS. X‐Ray Absorption Spectroscopy of Amorphous Solids, Liquids, and Catalytic and Biochemical Systems—Capabilities and Limitations. Angewandte Chemie International Edition in English. 1994;33(1):45–66. [Google Scholar]
- Bertsch PM, Seaman JC. Characterization of complex mineral assemblages: Implications for contaminant transport and environmental remediation. Proceedings of the National Academy of Sciences of the United States of America. 1999;96(7):3350–3357. doi: 10.1073/pnas.96.7.3350. [DOI] [PMC free article] [PubMed] [Google Scholar]
- Childs CW. Ferrihydrite - a Review of Structure, Properties and Occurrence in Relation to Soils. Zeitschrift Fur Pflanzenernahrung Und Bodenkunde. 1992;155(5–6):441–448. [Google Scholar]
- Cornell RM, Schwertmann U. The Iron Oxides. Wiley-VCH; 2003. [Google Scholar]
- Drits VA, Sakharov BA, Salyn AL, Manceau A. Structural Model for Ferrihydrite. Clay Minerals. 1993;28(2):185–207. [Google Scholar]
- Dzombak DA, Morel FM. Surface complexation modeling: hydrous ferric oxide. John Wiley & Sons; 1990. [Google Scholar]
- Ellison SL, Thompson M. Standard additions: myth and reality. Analyst. 2008;133(8):992–997. doi: 10.1039/b717660k. [DOI] [PubMed] [Google Scholar]
- Ginn BR, Meile C, Wilmoth J, Tang Y, Thompson A. Rapid iron reduction rates are stimulated by high-amplitude redox fluctuations in a tropical forest soil. Environmental Science & Technology. 2017 doi: 10.1021/acs.est.6b05709. [DOI] [PubMed] [Google Scholar]
- Gleyzes C, Tellier S, Astruc M. Fractionation studies of trace elements in contaminated soils and sediments: a review of sequential extraction procedures. Trac-Trends in Analytical Chemistry. 2002;21(6–7):451–467. [Google Scholar]
- Gustafsson JP. Modelling molybdate and tungstate adsorption to ferrihydrite. Chemical Geology. 2003;200(1–2):105–115. [Google Scholar]
- Hansel CM, Benner SG, Fendorf S. Competing Fe(II)-induced mineralization pathways of ferrihydrite. Environmental Science & Technology. 2005;39(18):7147–7153. doi: 10.1021/es050666z. [DOI] [PubMed] [Google Scholar]
- Harris DC. Quantitative chemical analysis. Macmillan; 2010. [Google Scholar]
- Harvey CF, et al. Arsenic mobility and groundwater extraction in Bangladesh. Science. 2002;298(5598):1602–1606. doi: 10.1126/science.1076978. [DOI] [PubMed] [Google Scholar]
- Hiemstra T. Surface and mineral structure of ferrihydrite. Geochimica Et Cosmochimica Acta. 2013;105:316–325. [Google Scholar]
- Horneman A, et al. Decoupling of As and Fe release to Bangladesh groundwater under reducing conditions. Part 1: Evidence from sediment profiles. Geochimica Et Cosmochimica Acta. 2004;68(17):3459–3473. [Google Scholar]
- Houben G, Kaufhold S. Multi-method characterization of the ferrihydrite to goethite transformation. Clay Minerals. 2011;46(3):387–395. [Google Scholar]
- Hughes RE, Moore DM, Glass HD. Qualitative and Quantitative-Analysis of Clay-Minerals in Soils. Quantitative Methods in Soil Mineralogy. 1994:330–359. [Google Scholar]
- Jessen S, et al. Surface complexation modeling of groundwater arsenic mobility: Results of a forced gradient experiment in a Red River flood plain aquifer, Vietnam. Geochimica Et Cosmochimica Acta. 2012;98:186–201. [Google Scholar]
- Johannesson KH, Dave HB, Mohajerin TJ, Datta S. Controls on tungsten concentrations in groundwater flow systems: The role of adsorption, aquifer sediment Fe(III) oxide/oxyhydroxide content, and thiotungstate formation. Chemical Geology. 2013;351:76–94. [Google Scholar]
- Johnston J, Lewis D. A detailed study of the transformation of ferrihydrite to hematite in an aqueous medium at 92 C. Geochimica et Cosmochimica Acta. 1983;47(11):1823–1831. [Google Scholar]
- Jung HB, Bostick BC, Zheng Y. Field, experimental, and modeling study of arsenic partitioning across a redox transition in a Bangladesh aquifer. Environmental science & technology. 2012;46(3):1388–1395. doi: 10.1021/es2032967. [DOI] [PMC free article] [PubMed] [Google Scholar]
- Karlsson T, Persson P, Skyllberg U, Morth CM, Giesler R. Characterization of iron(III) in organic soils using extended X-ray absorption fine structure spectroscopy. Environmental Science & Technology. 2008;42(15):5449–5454. doi: 10.1021/es800322j. [DOI] [PubMed] [Google Scholar]
- Michel FM, et al. The structure of ferrihydrite, a nanocrystalline material. Science. 2007;316(5832):1726–1729. doi: 10.1126/science.1142525. [DOI] [PubMed] [Google Scholar]
- Mihajlov I. The vulnerability of low-arsenic aquifers in Bangladesh: a multi-scale geochemical and hydrologic approach. Columbia University; 2014. [Google Scholar]
- O’Day PA, Rivera N, Root R, Carroll SA. X-ray absorption spectroscopic study of Fe reference compounds for the analysis of natural sediments. American Mineralogist. 2004;89(4):572–585. [Google Scholar]
- Polizzotto ML, et al. Solid-phases and desorption processes of arsenic within Bangladesh sediments. Chemical Geology. 2006;228(1–3):97–111. [Google Scholar]
- Postma D, et al. Mobilization of arsenic and iron from Red River floodplain sediments, Vietnam. Geochimica Et Cosmochimica Acta. 2010;74(12):3367–3381. [Google Scholar]
- Poulton SW, Canfield DE. Development of a sequential extraction procedure for iron: implications for iron partitioning in continentally derived particulates. Chemical Geology. 2005;214(3–4):209–221. [Google Scholar]
- Robinson C, et al. Dynamics of arsenic adsorption in the targeted arsenic-safe aquifers in Mat lab, south-eastern Bangladesh: Insight from experimental studies. Applied Geochemistry. 2011;26(4):624–635. [Google Scholar]
- Schroth AW, Crusius J, Sholkovitz ER, Bostick BC. Iron solubility driven by speciation in dust sources to the ocean. Nature Geoscience. 2009;2(5):337–340. [Google Scholar]
- Schwertmann U, Cornell RM. Iron Oxides in the Laboratory Preparation and Characterization. 2nd. Wiley; Weinheim; 2000. [Google Scholar]
- Sparks D. Proceedings of the Eleventh International Symposium on Water–Rock Interaction WRI-11. AA Balkema Publishers Leiden; The Netherlands: 2004. The role of synchrotron radiation in advancing the frontiers of water-rock interactions; pp. 609–619. [Google Scholar]
- Steenbruggen G, Hollman GG. The synthesis of zeolites from fly ash and the properties of the zeolite products. Journal of Geochemical Exploration. 1998;62(1–3):305–309. [Google Scholar]
- Stollenwerk KG, et al. Arsenic attenuation by oxidized aquifer sediments in Bangladesh. Science of the Total Environment. 2007;379(2):133–150. doi: 10.1016/j.scitotenv.2006.11.029. [DOI] [PubMed] [Google Scholar]
- Strawn DG, Baker LL. Molecular characterization of copper in soils using X-ray absorption spectroscopy. Environmental Pollution. 2009;157(10):2813–2821. doi: 10.1016/j.envpol.2009.04.018. [DOI] [PubMed] [Google Scholar]
- Sun J, Bostick BC. Effects of tungstate polymerization on tungsten (VI) adsorption on ferrihydrite. Chemical Geology. 2015;417:21–31. [Google Scholar]
- Sun J, Bostick BC, Mailloux BJ, Ross JM, Chillrud SN. Effect of oxalic acid treatment on sediment arsenic concentrations and lability under reducing conditions. Journal of hazardous materials. 2016a;311:125–133. doi: 10.1016/j.jhazmat.2016.02.060. [DOI] [PMC free article] [PubMed] [Google Scholar]
- Sun J, Chillrud SN, Mailloux BJ, Bostick BC. In Situ Magnetite Formation and Long-Term Arsenic Immobilization under Advective Flow Conditions. Environmental Science & Technology. 2016b;50(18):10162–10171. doi: 10.1021/acs.est.6b02362. [DOI] [PMC free article] [PubMed] [Google Scholar]
- Thompson A, Rancourt DG, Chadwick OA, Chorover J. Iron solid-phase differentiation along a redox gradient in basaltic soils. Geochimica et Cosmochimica Acta. 2011;75(1):119–133. [Google Scholar]
- Tishchenko V, Meile C, Scherer MM, Pasakarnis TS, Thompson A. Fe 2+ catalyzed iron atom exchange and re-crystallization in a tropical soil. Geochimica et Cosmochimica Acta. 2015;148:191–202. [Google Scholar]
- Torn MS, Trumbore SE, Chadwick OA, Vitousek PM, Hendricks DM. Mineral control of soil organic carbon storage and turnover. Nature. 1997;389(6647):170–173. [Google Scholar]
- van der Zee C, Roberts DR, Rancourt DG, Slomp CP. Nanogoethite is the dominant reactive oxyhydroxide phase in lake and marine sediments. Geology. 2003;31(11):993–996. [Google Scholar]
- Wang X, et al. Formation and secondary mineralization of ferrihydrite in the presence of silicate and Mn (II) Chemical Geology. 2015;415:37–46. [Google Scholar]
- Webb SM. SIXpack: a graphical user interface for XAS analysis using IFEFFIT. Physica Scripta. 2005;T115:1011–1014. [Google Scholar]
- Willett IR, Chartres CJ, Nguyen TT. Migration of Phosphate into Aggregated Particles of Ferrihydrite. Journal of Soil Science. 1988;39(2):275–282. [Google Scholar]
- Zheng Y, et al. Geochemical and hydrogeological contrasts between shallow and deeper aquifers in two villages of Araihazar, Bangladesh: Implications for deeper aquifers as drinking water sources. Geochimica Et Cosmochimica Acta. 2005;69(22):5203–5218. [Google Scholar]
- Zhu M, et al. Structure of sulfate adsorption complexes on ferrihydrite. Environmental Science & Technology Letters. 2013;1(1):97–101. [Google Scholar]
Associated Data
This section collects any data citations, data availability statements, or supplementary materials included in this article.


