

Abstract
The rate of reconfiguration—or intramolecular diffusion—of monomeric Alzheimer (Aβ) peptides is measured and, under conditions that aggregation is more likely, peptide diffusion slows down significantly, which allows bimolecular associations to be initiated. By using the method of Trp–Cys contact quenching, the rate of reconfiguration is observed to be about five times faster for Aβ40, which aggregates slowly, than that for Aβ42, which aggregates quickly. Furthermore, the rate of reconfiguration for Aβ42 speeds up at higher pH, which slows aggregation, and in the presence of the aggregation inhibitor curcumin. The measured reconfiguration rates are able to predict the early aggregation behavior of the Aβ peptide and provide a kinetic basis for why Aβ42 is more prone to aggregation than Aβ40, despite a difference of only two amino acids.
Keywords: aggregation, Alzheimer’s disease, kinetics, inhibitors, peptides
Measuring aggregates
Trp–Cys contact quenching is used to measure the rate of reconfiguration of monomeric Alzheimer (Aβ) peptides. The measured reconfiguration rates are able to predict the early aggregation behavior of the Aβ peptide and provide a kinetic basis for why Aβ42 is more prone to aggregation than Aβ40, despite a difference of only two amino acids (see figure).
1. Introduction
Aggregation of proteins is the underlying cause of a large and growing number of degenerative and chronic diseases.[1] For example, Alzheimer’s disease affects 1 in 9 people over 65[2] and is characterized by neuronal cell death and dementia apparently caused, at least in part, by aggregation of Aβ peptide, a cleavage product of amyloid beta precursor protein (APP).[3] Virtually all proteins can be induced to aggregate in vitro, but the rate of aggregation and deviation from physiological conditions varies widely.[4] Thus, an obvious question is why some proteins, such as Aβ, are more prone to aggregation than others? It has also been observed that for many proteins aggregation initiates from a monomeric, unfolded, or partially unfolded conformation.[1, 5] Therefore, information about whether a sequence will aggregate must be embedded within the ensemble of freely diffusing unfolded states.
However, it is extremely difficult to characterize the unfolded ensemble of a monomeric protein, which would typically comprise of rapidly (≈microsecond timescale) fluctuating populations of interconverting conformations. The consensus of NMR spectroscopy and circular dichroism (CD) studies is that Aβ should be classified as disordered, although it is not a true random coil.[6] Recently, Rosenman et al. constrained molecular dynamics (MD) simulations with NMR spectroscopy measurements of J coupling constants.[7] When the simulation data was clustered, the most common cluster was less than 5% of the entire population. Different MD simulations have found a broad ensemble of structures. Lin et al. created a free energy landscape from MD simulations and found no well-separated basins within the entire ensemble.[8] A recent simulation by Barz et al. showed that there were no large conformational changes prior to or during the first step of aggregation: the formation of a dimer.[9] Taken together, these observations suggest a highly diffusive ensemble of largely unstructured states, none of which are very stable or can be defined as the structural precursor of aggregation. Thus, aggregation must be understood in terms of dynamics rather than structure.
Proteolytic cleavage of the APP protein releases various isoforms of Aβ peptide in humans, of which the two most abundant are Aβ42 and Aβ40, with a ratio of 1:9 in the brain.[10] Although the two isoforms differ by only two amino acids, they vary significantly in their aggregation behavior.[11] Under physiological conditions, the critical concentration of Aβ42 is five times lower than that of Aβ40.[12] Fibril formation of Aβ40 takes several hours, whereas Aβ42 forms fibrils within minutes.[13] Aβ42 is also much more neurotoxic and reportedly causes more oxidative damage than Aβ40.[13a, 14] Despite structural conservation observed by a wide range of NMR spectroscopy studies,[ 6a, 15] the difference between the two isoforms is not yet fully understood.
Herein, we show that Aβ42 reconfigures five times slower than Aβ40, which causes Aβ42 to make stable bimolecular contacts more easily than Aβ40. Moreover, our results indicate that the conditions which rescue the protein from aggregation speed up reconfiguration, and hence, lower the chances of early-stage aggregation. Using a previously reported aggregation model,[16] our measured reconfiguration rates accurately predict the early aggregation kinetics of the Aβ peptide. Hence, this work may provide a novel approach towards therapeutic development for Alzheimer’s disease and, as shown herein, can be used to test whether a small-molecule inhibitor is able to arrest aggregation early on. The major challenge associated with treating neurodegenerative diseases is diagnosing them early enough for therapeutic interventions to take effect. Most in vitro screening techniques are based on testing inhibitors for their ability to prevent late-stage aggregates, such as fibrils or higher order oligomers. However, aggregates as small as a di- or trimer can be neurotoxic and have been observed to cause memory deficits in the transgenic mouse model.[17] Therefore, we believe that this technique, which probes the early stages of aggregation, can become a valuable assay to identify drug candidates for Alzheimer’s disease.
2. Results and Discussion
2.1. Choice of Mutation Sites
To measure reconfiguration of the Aβ peptide, we used the method of Trp–Cys contact quenching, in which a Trp is transiently excited to a long-lived triplet state that is quenched upon contact with Cys.[18] The measurements described herein require one Trp and one Cys within the same sequence less than about 30 residues apart, such that a loop between them is made between 100 ns and 20 μs.[18] We created two mutants that spanned 71% of the sequence by mutating F19W and either F4C or M35C (Figure 1a). These sites were chosen because Phe and Met are similar in hydrophobicity to Cys and these amino acids, along with Trp, are not charged. Met and Cys both contain a sulfur atom that can be oxidized, which has been previously reported to be a common problem associated with wild-type (wt) Aβ purification;[13c] MALDI results performed after purification confirmed the absence of any such oxidation. As shown in Figure 1, these mutations have moderate effects on the prediction of amyloid formation by the Tango[19] and Zyggregator[20] algorithms, but these predictions do not completely agree with each other. Tango predicts slightly less propensity to form amyloid between residues 17–21 for the F19W mutation, but no change near the Cys mutations. In contrast, Zyggregator predicts no change near residue 19, but a decrease in propensity due to the F4C mutation and an increase in propensity due to the M35C mutation. Each of these effects is about 20–30 %. Zyggregator can also predict the propensity to form toxic oligomers. The overall pattern for oligomers is very similar to the amyloid prediction, as are the differences due to mutations (see Figure 1c). Not all positions are similarly conservative, as seen in Figure 1d and e, particularly for sites near F4.
Figure 1.

Aggregation propensities per residue for Aβ1–42 and various mutants. a) Sequence of Aβ with the mutations marked in blue and residues 41 and 42 marked in red. b) Amyloid prediction by Zyggregator. c) Amyloid prediction by Tango. d) Toxic oligomer prediction by Zyggregator. e) and f) Amyloid prediction by Zyggregator for alternate Cys positions. g) Amyloid prediction by Tango for Ab40 with the same colors as those used in b)–d).
Thioflavin T (ThT) data of the wt and mutant peptides are plotted in Figure 2a and b. The effect of the mutation on Aβ42 amyloid formation, as measured by ThT fluorescence, is minimal. Surprisingly, although the wt Aβ40 peptide exhibits kinetics that are two to three times slower than those of Aβ42, neither of the Aβ40 mutants exhibit any rise in ThT fluorescence. This indicates that fibrillization is either delayed or completely wiped out, which suggests that the fibrillization pathways for Aβ40 and Aβ42 are different and the F19W mutation prevents fibrillization along the Aβ40 pathway. However, this result does not imply that the early aggregation steps are altered, as observed for α-synuclein.[21] CD spectra of freshly dissolved monomers in Figure 2c show minimal differences between the wt and mutants before aggregation. CD spectra were also collected for the Aβ40 peptides after 12 h under the same conditions as those used for the ThT fluorescence experiments (Figure 2e). The wt sequence shows evidence of the β structure, whereas the mutants are random coil. This data further corroborates the ThT measurements. Finally, AFM images (Figure 2f) show that oligomers formed after 12 h under aggregation conditions for all Aβ40 peptides. The size and shape of oligomers suggest that the first stage of aggregation is not substantially altered by the mutations.
Figure 2.

Trp and Cys mutations in Aβ minimally perturb the aggregation kinetics. a) Fibrillization kinetics, as measured by ThT fluorescence, for the wt and two Aβ42 mutants. b) Fibrillization kinetics, as measured by ThT fluorescence, for the wt and two Aβ40 mutants. All measurements were made at 8 μM and 37°C, except for points marked with blue crosses, which were measured at 30 μM and 20°C. c) CD spectra of different mutants immediately after monomerization. The lines are for Aβ42 and the points are for Aβ40. d) CD spectra of Aβ42 before (solid lines) and after (dashed lines) the Trp–Cys experiment and in 30% sucrose (dark red); the same color scheme as that indicated in a) is used. e) CD spectra of Aβ40 mutants after 12 h in aggregation conditions; the same color scheme as that indicated in a) is used. f) AFM images of wt (top), F4C F19W(middle), and F19W M35C (bottom) after 12 h in aggregation conditions. The average diameter of the oligomers is (89±7) (wt), (56±6) (F4C F19W), (86±10) nm (F19W M35C).
CD spectra were also collected on samples prepared for the Trp–Cys experiment (Figure 2d). These spectra are unchanged with the addition of 30% sucrose and from before to after the Trp–Cys experiment. Altogether these data indicate that both Aβ40 and Aβ42 peptides are monomeric while measuring intramolecular diffusion and the addition of Trp and Cys do not substantially alter the monomeric conformational ensemble.
2.2. Measurement of Intramolecular Diffusion
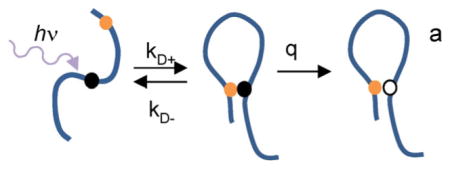
Herein, we measured intramolecular diffusion of the Aβ peptide by using the technique of Trp–Cys contact quenching. Based on the scheme in Figure 3a, the observed Trp triplet rate is given by Equation (1):[22]
Figure 3.

Measurement of Trp–Cys quenching in Aβ. a) Kinetic scheme to measure intramolecular diffusion: a UV photon excites W19 in the peptide to a long-lived triplet state (black ball) that is quenched upon close contact with C4 or C35 (orange ball), returning W19 to the ground state (white ball). The observed rate/lifetime of the Trp triplet state is given by Equations (1) and (2). b) Transient optical absorption at λ = 450 nm of Trp triplet in W19C35 at pH 7.5, 0 C. The red line is a three exponential fit. c) The fast lifetimes of Trp triplet in W19C35 at pH 7.5 for various viscosities and temperatures as marked. The lines are independent linear fits at each temperature.
| (1) |
Typical kinetics of the Trp triplet state are shown in Figure 3b. This data requires a fit to three decays over the time range of 100 ns to 10 ms. The slowest decay consists of photophysical and optical artifacts seen in all Trp triplet kinetics.[18] The fastest decay (≈1 μs) represents the monomer population undergoing rapid intramolecular diffusion. The intermediate decay has an amplitude smaller than the fast decay and a lifetime (≈20 μs) that is slightly shorter than that observed for the Trp triplet in the absence of any Cys. Therefore, the intermediate decay represents a population in which Trp19 does not undergo rapid intramolecular contact with Cys. This intermediate phase has been observed previously for proteins that fold under conditions in which the folded and unfolded populations coexist.[23] Since Aβ does not fold, this population is likely to consist of small oligomers in which Trp motion is constrained. It is unlikely to be due to a transient folded structure, the amplitude of which would change with temperature. The amplitude also does not change significantly with time; therefore, oligomers are not forming during the measurement. Instead, the oligomers are the result of imperfect monomerization during initial sample preparation. Thus, we report the fastest rate as kobs, which represents the population of rapidly diffusing monomers.
Equation (1) can be rewritten as a triplet lifetime [Eq. (2)]:
| (2) |
in which a reaction-limited (kR) rate depends only on temperature and the diffusion-limited (kD+) rate depends on both temperature and viscosity (η) of the solution. Therefore, this measurement gives information about the probability of intramolecular contacts and the intramolecular diffusion coefficient.
The kR and kD+ values in Equation (2) can be determined by measuring the Trp lifetime at different temperatures and viscosities, as shown in Figure 3c, from which the reaction-limited rates are determined from the intercept and the diffusion-limited rates are determined from the slope of these lines.[22] These rates are plotted in Figure 4a and b for various temperatures, solvent conditions, and both loops. The error bars represent the error in the linear fits.
Figure 4.

Measurement of intramolecular diffusion for various sequences. a) Measured reaction-limited rates (determined from the intercept of plots such as that in Figure 3c) versus temperature. b) Measured diffusion-limited rates (determined from the slope of plots such as that in Figure 3c) normalized to the viscosity of water at each temperature. Errors from the linear fits are shown as error bars in a) and b). c) Average Trp–Cys distance calculated from the reweighted wormlike chain (WLC) model described in the Supporting Information d) Intramolecular diffusion coefficients determined by using the WLC model and Equation (4).
Using Szabo, Schulten, and Schulten theory, we can model the polymer motion as diffusion on a 1D potential and relate the measured values to a probability distribution of Trp–Cys distance [P(r)] and an intramolecular diffusion coefficient, D [Eqs. (3) and (4)][22]
| (3) |
| (4) |
in which lc is the contour length of the protein and dα=4 Å is the distance of closest approach. The Trp quenching rate, q(r), has been experimentally determined and is very short range.[24] Thus, Equation (3) is only sensitive to the shortest distances of P(r) (4≤r≤8 Å).
We use Equation (3)[25] to determine the best probability distribution [P(r)] to match the measured reaction-limited rates, which then determines an effective intramolecular diffusion coefficient, D.
Determination of an appropriate P(r) is crucial for this analysis, but because the reaction-limited rate is a convolution of the distribution with q(r), it is difficult to definitively determine P(r). The Experimental Section describes two methods of calculating P(r): a simple Gaussian distribution and an energy reweighted WLC distribution.[26] The latter is likely to be more realistic, as shown by the average Trp–Cys distances in Figure 4c and Table 1.
Table 1.
Parameters for two different polymeric models that best fit the experimental data.
| Peptide | T [°C] | Gaussian 〈 r2〉1/2 [&] | Gaussian D [cm2 s−1] | WLC σ | WLC γ | WLC 〈 r2〉 [&] | WLC D [cm2 s−1] |
|---|---|---|---|---|---|---|---|
| Aβ1–42 C4W19 pH 7.5 | 0 | 34.6 | 1.2 × 10⁻⁷ | 1.85 | 0 | 21.0 | 2.0 × 10⁻⁷ |
| 10 | 50.0 | 8.8 × 10⁻⁷ | 0.7 | 0 | 24.0 | 3.9 × 10⁻⁷ | |
| 20 | 42 | 8.4 × 10⁻⁷ | 1.1 | 0 | 22.5 | 2.6 × 10⁻⁷ | |
| 30 | 37.4 | 6.5 × 10⁻⁷ | 1.65 | 0 | 22.0 | 2.0 × 10⁻⁷ | |
| 40 | 36.7 | 5.5 × 10⁻⁷ | 1.7 | 0 | 21.9 | 1.9 × 10⁻⁷ | |
| Aβ1–40 C4W19 pH 7.5 | 0 | 84 | 3.9 × 10⁻⁶ | −1.8 | 0 | 25.3 | 9 × 10⁻⁷ |
| 10 | 82 | 4.8 × 10⁻⁶ | −1.7 | 0 | 25.2 | 1.0 × 10⁻⁶ | |
| 20 | 79 | 4.1 × 10⁻⁶ | −1.6 | 0 | 25.2 | 1.1 × 10⁻⁶ | |
| 30 | 77.5 | 3.4 × 10⁻⁶ | −1.5 | 0 | 25.1 | 9 × 10⁻⁷ | |
| 40 | 72.1 | 2.5 × 10⁻⁶ | −1.0 | 0 | 24.9 | 9 × 10⁻⁷ | |
| Aβ1–42 W19C35 pH 7.5 | 0 | 39.4 | 1.7 × 10⁻⁷ | 0.15 | 56 | 22.4 | 9.0 × 10⁻⁸ |
| 10 | 39.6 | 2.8 × 10⁻⁷ | 0.2 | 55 | 22.4 | 1.5 × 10⁻⁷ | |
| 20 | 44.0 | 7.4 × 10⁻⁷ | 0.02 | 52 | 22.9 | 2.5 × 10⁻⁷ | |
| 30 | 35.7 | 4.4 × 10⁻⁷ | 0.55 | 52 | 22.1 | 2.5 × 10⁻⁷ | |
| 40 | 32.2 | 3.9 × 10⁻⁷ | 0.9 | 52 | 22.0 | 2.5 × 10⁻⁷ | |
| Aβ1–42 W19C35 pH 10 | 0 | 69.3 | 4.5 × 10⁻⁶ | −0.1 | 57 | 26.3 | 1.2 × 10⁻⁶ |
| 10 | 62 | 6× 10⁻⁶ | −0.02 | 55 | 26.1 | 1.3 × 10⁻⁶ | |
| 20 | 48 | 4.6 × 10⁻⁶ | 0.03 | 52 | 25.5 | 1.3 × 10⁻⁶ | |
| 30 | 47 | 5× 10⁻⁶ | 0.2 | 54 | 25.1 | 1.2 × 10⁻⁶ | |
| 40 | 42 | 3.7 × 10⁻⁶ | 0.35 | 55 | 24.5 | 1.7 × 10⁻⁶ | |
| Aβ1–42 W19C35 curcumin | 0 | 60 | 4.1 × 10⁻⁶ | 0.5 | 0 | 24.8 | 1.5 × 10⁻⁶ |
| 10 | 58 | 3.5 × 10⁻⁶ | 0.2 | 0 | 24.8 | 1.5 × 10⁻⁶ | |
| 20 | 55 | 3.3 × 10⁻⁶ | 0.3 | 0 | 24.7 | 1.1 × 10⁻⁶ | |
| 30 | 50 | 3× 10⁻⁶ | 0.5 | 0 | 24.5 | 1.3 × 10⁻⁶ | |
| 40 | 46 | 2× 10⁻⁶ | 0.7 | 0 | 24.3 | 1.1 × 10⁻⁶ | |
| Aβ1–40 W19C35 pH 7.5 | 0 | 80 | 3.5 × 10⁻⁶ | −0.8 | 0 | 25.4 | 9 × 10⁻⁷ |
| 10 | 78 | 3.3 × 10⁻⁶ | −0.5 | 0 | 25.3 | 1 × 10⁻⁶ | |
| 20 | 69 | 3.1 × 10⁻⁶ | −0.4 | 0 | 25.1 | 1.1 × 10⁻⁶ | |
| 30 | 62 | 1.8 × 10⁻⁶ | 0.1 | 0 | 24.8 | 9 × 10⁻⁷ | |
| 40 | 56 | 1.3 × 10⁻⁶ | 0.6 | 0 | 24.3 | 8 × 10⁻⁷ |
From an appropriate P(r) and the measured kD+, we can calculate D. Determining the error in each D directly is difficult because it depends on a convolution of q(r) and P(r), but because D is directly proportional to kD+ the proportional errors in D should be comparable to those of kD+, about 10%. Both models produce diffusion coefficients within a factor of two of each other, which suggests a conservative estimate of uncertainty in D. Figure 4d shows the diffusion coefficients of different loops as a function of temperature and for different solution conditions. Interestingly, there is little change in diffusion with temperature, which implies that there are no large energy barriers between subpopulations in the ensemble. In contrast, the reported strong temperature dependence of fibril formation suggests a large energetic barrier for fibrillization.[27]
Figure 4c compares the average intramolecular distances, 〈r〉 = ∫ rZ(r)dr, between Trp and Cys for different mutants and different pH values for Aβ42 and Aβ40. There are insignificant differences between the two mutants for both Aβ40 and Aβ42, which suggests that the observed trends are global phenomena for the entire peptide. For Aβ42, the Trp–Cys distance increases by about 10% when the pH is increased to about the same distance as that observed for Aβ40.
Aβ42 was also investigated in the presence of an equimolar concentration of curcumin; a known aggregation inhibitor.[28] The results are also shown in Figure 4. Previous work on α-synuclein with curcumin showed that the observed rates decreased, even though free curcumin actually acted as a quencher of free Trp and increased kobs.[29] The same effect is observed with Aβ, which indicates that curcumin strongly binds to the monomer, preventing direct quenching of Trp. The reaction-limited rates are lower and the average intramolecular distance is higher, similar to observations of Aβ42 at pH 10.
Figure 4d provides a comparison of the intramolecular diffusion coefficients. Because D depends on measurements of both kR and kD+, it varies differently with sequence and conditions than 〈r〉. Our results show that for Aβ40 at pH 7.5, Aβ42 at pH 10.0, and Aβ42 at pH 7.5 with curcumin, diffusion is similarly fast, about 1–2×10⁻⁶ cm2 s−1, whereas Aβ42 at pH 7.5 is factor of 5 slower at 30–40 °C. Notably, these differences are much bigger than the differences observed for 〈r〉. The faster diffusion coefficients are similar to those measured for unstructured peptides and proteins in high denaturant,[18, 23c] whereas the slower coefficients are similar to that measured for α-synuclein under aggregation-prone conditions.[30]
The experimental results clearly show an anticorrelation between aggregation propensity and intramolecular diffusion, such that diffusion is slower for conditions that favor aggregation. This relationship holds for changes in pH, peptide length, and the addition of a small-molecule inhibitor. Measurement of intramolecular diffusion has never been reported for the Aβ peptide, but available structural evidence supports our conclusions about the relative intramolecular distances for different sequences and solution conditions. A comparison between intramolecular contact maps of Aβ42 and Aβ40 based on previously reported MD simulations has revealed that the two additional hydrophobic residues at the Aβ42 C terminus, Ile41 and Ala42, significantly increase contacts within the C terminus and also between the C terminus and the central hydrophobic cluster, Leu17–Ala21.[15c] Additionally, Tyr10 in Aβ42 contacts residues 13–32 more frequently than Aβ40.[31] Another MD simulation study has revealed many more close interactions between residues 25–37 and 12–20 for Aβ42 compared with Aβ40, as per reported contact maps.[32] This result further supports the hypothesis that stronger C-terminus interactions between 39–40 and 41–42 residues of Aβ42 allows the rest of the residues in the hydrophobic patch (residues 29–39) to form interactions with other residues distant in sequence. Increased intramolecular contact frequencies in the Aβ42 sequence could be responsible for the measured compaction of the protein chain (Figure 4c). In another analysis of MD trajectories of Aβ42 in explicit water, nonlocal backbone hydrogen bonds between residues 16–17 and 39–41 were observed being formed, decreasing the number of water molecules around those residues and possibly leading to compaction.[33] Due to such nonlocal backbone contacts being formed, those regions may become inaccessible to hydrogen bonding with water, facilitating intermolecular side-chain interactions, which could initiate aggregation in the Aβ42 peptide.
Previous studies also supported the difference in intramolecular diffusion between Aβ42 and Aβ40. MD simulations[6d, 15c] and NMR spectroscopy studies[6c] have reported that the C terminus of Aβ42 is more structured than that of Aβ40. It has been hypothesized that the formation of a β-hairpin in the sequence IIGLMVGGVVIA, involving short strands at residues 31–34 and 38–41, reduces the C-terminal flexibility of Aβ42 peptide, which could lead to slow intramolecular diffusion. However, Ball et al. concluded it was mostly attributable to transient hydrophobic contacts,[15c] which would also naturally slow diffusion of peptide.
By comparing the differences in pH, Bhowmik et al. showed that there was no change in helix content over the pH range 5.5 to 10.5,[34] but this might be expected because the ensemble was already highly disordered. Rather, the increase in chain size and diffusivity for Aβ42 from pH 7.5 to 10 is likely to be due to a change in the net charge and distribution of charges because of deprotonation of Lys16 and Lys28, as well as the additional negative charge on Tyr10. Because the net charge of the Aβ42 sequence increases at higher pH, the sequence becomes increasingly disordered due to charge–charge repulsions. This could lead to an increase in the intramolecular diffusion coefficient of Aβ42 at higher pH. At pH 7.5, diffusion is similarly fast when Aβ42 is bound in a 1:1 ratio with curcumin; a known aggregation inhibitor of Aβ fibrils.[28] The aromatic rings of curcumin are likely to bind to aromatic residues at sequence positions 4, 10, 19, and 20.[35] These binding events may disrupt interactions of these hydrophobic residues with other hydrophobic groups far in sequence, leading to a larger chain size and release of long-range contacts, which could lead to an increase in diffusivity. Ahmad and Lapidus reported a similar effect of curcumin on α-synuclein,[29] and Acharya et al. showed that a molecular tweezer made α-synuclein bigger by making local electrostatic interactions more likely than nonlocal interactions.[36]
The anticorrelation of aggregation propensity and intramolecular diffusion is consistent with a previously reported kinetic model,[16] presented in the Supporting Information, that relates the formation of the dimer to competition between bimolecular diffusion and intramolecular diffusion. Two monomers may interact by bimolecular diffusion, forming an encounter complex. When two aggregation-prone conformations are in close contact, they may form a relatively long-lived encounter complex that would eventually lead to a stable oligomer. But if intramolecular diffusion is sufficiently fast, the complex comes apart because one or both can reconfigure to an aggregation-incompetent conformation. The assumptions of the model are discussed in detail in the Supporting Information, as are estimates of the reconfiguration rates for Aβ42 and Aβ40. Figure S1 in the Supporting Information shows that, if all other rates are kept the same, the oligomerization rates for Aβ40 are about fourfold slower than that of Aβ42. This correlates to the approximately five times higher concentration required for Aβ40 to aggregate in the same lag time as Aβ42,[13d, 37] because kbi is directly proportional to concentration. This conclusion is further supported by another reported measurement of dimer formation by using single-molecule force spectroscopy. The lifetimes of dimers were measured to be 0.46 s for Aβ42 and 0.1 s for Aβ40, which was commensurate with the 5 times difference in reconfiguration.[ 38]
3. Conclusion
These results showed that kinetic competition between monomer reconfiguration and bimolecular association controlled the first step in aggregation, and thus, monomeric reconfiguration was a crucial determinant of aggregation propensity. This was a general result. Given any sequence, the reconfiguration rate of which has been measured, early aggregation kinetics might be predicted by using this method. Because it is difficult to understand early aggregation, such as dimer formation in terms of structure, a kinetic approach such as this may be useful in the characterization of aggregation behavior of any protein. Furthermore, we showed that a small molecule, such as curcumin, could significantly speed up monomer reconfiguration of the readily aggregating Aβ42, and hence, prevent dimer formation. Because it has been shown that the oligomeric dimer is a toxic species and may induce early Alzheimer’s disease associated symptoms in transgenic mouse models,[17] this work presents a unique approach directed towards arresting aggregation right at the start. This aggregation model can serve as a basis for finding ways to prevent Alzheimer’s disease from occurring or progressing.
Experimental Section
Peptide Expression and Purification
The fusion construct Aβ plasmids were a kind gift by Dr. Rudi Glockshuber, from ETH Zurich. The fusion construct consisted mainly of a soluble polypeptide segment comprising 19 repeats of the tetrapeptide sequence NANP, a solubilizing Aβ fusion partner, followed by the tobacco etch virus (TEV) protease recognition sequence ENLYFQ↓D (the arrow indicates the cleavage site) followed by the Aβ sequence.[13c]
Two different Trp/Cys pair containing Aβ42 and Aβ40 mutants were created by using the QuikChange site-directed mutagenesis kit (Stratagene, La Jolla, CA, USA) and DNA sequencing was used to ensure the presence of the desired mutations. The sequenced wt and mutant plasmids were then extracted from the XL1 blue competent cells and transformed into Escherichia coli BL21 (DE3) cells and plated out in LB–agar plates containing 100 μgmL−1 ampicillin.
E. coli BL21 (DE3) cells bearing the corresponding plasmid for expressing the Aβ fusion construct were first grown in 5 mL tube cultures of LB media containing 100 μgmL−1 ampicillin, while being shaken at 37°C at 220 rpm for 4 h. It was then transferred to 1 L LB media flasks (ampicillin concentration 100 μgmL−1) and was shaken overnight at 37 °C at 150 rpm. Protein expression was induced after 16 h by addition of filtered 1 mM isopropyl-β-D-thiogalacoside (IPTG) and then the flasks were shaken for a further 4 h in 37°C at 150 rpm. The cells were then harvested by centrifugation at 4000 rpm for 20 min (rotor SLA-1500). The pellets formed were resuspended in Aβ lysis buffer [20 mM Tris, 6M guanidinium hydrochloride (GdnHCl), pH 8.0], sonicated, and then stirred at 4°C for 90 min. The cell debris was then removed by centrifugation (19 000 rpm in rotor SS-34) at 4 °C for 1 h.
The supernatant was subjected to an affinity purification step because the fusion construct contained a His tag. Ni-NTA agarose column (Nickel charged resins by Qiagen) was first equilibrated with five column volumes of Aβ equilibration buffer (20 mM Tris, 10 mM imidazole, 6M GdnHCl, pH 8.0) after which the supernatant was loaded and incubated with gentle shaking at 4°C for 1 h to enable binding of the His-tagged fusion protein to the nickel column. Following binding, the nickel resins containing the bound protein were resuspended in five column volumes of wash buffer (20 mM Tris, 20 mM imidazole, 6M GdnHCl, pH 8.0) and gently shaken at 4°C for 30 min to remove unbound bacterial protein. The washing step was repeated at least two to three times, until all unbound proteins were washed away, and the supernatants were discarded each time. Finally, the nickel resins containing mostly fusion protein were resuspended in two column volumes of elution buffer (20 mM Tris, 250 mM imidazole, 6M GdnHCl, pH 8.0) and gently shaken at 4°C for 1 h, following which the supernatant containing eluted fusion protein was collected and stored at −20°C until further use. The elution step could be repeated until all fusion protein had been recovered.
The fusion proteins from the previous step were filtered and loaded into an Agilent Zorbax SB300 C8 semipreparative HPLC column in 10% (v/v) acetonitrile containing 0.1% trifluoroacetic acid (TFA) at a flow rate of 1 mLmin−1. The sample injection loop was washed many times at the same acetonitrile gradient to ensure that all fusion protein gradually bound to the column and all unbound proteins eluted, before the acetonitrile gradient was increased. Because of the high hydrophobicity of Aβ, HPLC purifications were performed at 60 °C to enable better yield. Once the protein bound to the column, the acetonitrile gradient was gradually increased, along with the flow rate, resulting in the elution of Aβ fusion protein at 40% acetonitrile and 0.1% TFA, at 60°C and a flow rate of 2 mLmin−1. The fusion protein was collected and lyophilized, and then stored at −20°C.
The ProTEV Plus enzyme, which was a 48 kDa, improved version of the TEV protease (more stable in terms of enzymatic activity), was purchased from Promega (catalog #V6101). It was reported to be a highly specific proteolytic enzyme that cleaved at the position shown by the arrow, ENLYFQ↓D; thus liberating Aβ the first residue of which was D. The lyophilized Aβ fusion protein was directly dissolved in the Aβ cleavage buffer [10 mM Tris, 0.5 mM ethylenediaminetetraacetic acid (EDTA), pH 8.0] and the cleavage reaction was performed in the presence of 1 mM dithiothreitol (DTT) at 4°C with 16 h incubation. Approximately 20 μg of fusion was cleaved by using five units of the enzyme (1 μL of 5 units/μL enzyme) following the protocol provided by Promega. DTT was added to prevent methionine oxidation/Cys disulfide bond formation at position 35 reported previously as a potential problem arising during purification.[13c] As soon as Aβ was cleaved, it began aggregating; at the end of the 16 h incubation period, all aggregated Aβ was sedimented by centrifugation (rotor F13S14X50Cy, 11000 rpm for 30 min) and then resuspended in 70% (w/w) formic acid, filtered, and immediately subjected to reverse-phase HPLC (RP-HPLC). The peptide was loaded into an Agilent Zorbax SB300 C8 semipreparative HPLC column in 10% (v/v) acetonitrile and 0.1% TFA at flow rate of 1 mLmin−1. Following rounds of washing of the sample loop, the acetonitrile gradient was increased the same way as before. The fusion partner, which was more hydrophilic, eluted first followed by the Aβ peptide at 40% acetonitrile and 0.1% TFA, at 60°C and a flow rate of 2 mLmin−1. It was collected, lyophilized, and stored at −20°C. The identity of the peptide was confirmed by ESI-MS.
Monomerization Protocol
To ensure that Aβ peptide was monomeric for every experiment, the lyophilized peptide was dissolved in 2–10 mM NaOH, sonicated for 2 min, filtered through a 0.2 μm syringe filter, and lyophilized for further use.[13c] Resuspension of Aβ peptide at pH>10 helped to ensure that the starting condition of the Aβ peptide was a random coil in a conformation confirmed by CD.
ThT Fluorescence Measurements
The ThT fluorescence experiment was performed according to the protocol previously reported.[13c] Monomerized Aβ peptide in lyophilized form was resuspended into 10 mM NaOH until a concentration of roughly 100–200 μM was achieved, as measured by A280 absorbance (wt ε280=1730 M−1 cm−1; F4C, F19W, M35C, and F19W mutants ε280=6990 M −1 cm−1 ). The solution was further diluted by using 10 mM NaOH, which was kept on ice, to a concentration of around 80 μM and immediately used for ThT fluorescence experiments. The reaction mixture for the aggregation experiment was mixed in a 1 cm path length quartz cuvette comprised of monomerized 80 μM Aβ stock solution (100 μL), 20 mM sodium phosphate buffer (750 μL, pH 7.4), 10 mM HCl (100 μL), 5M NaCl (20 μL), 2.5 mM ThT (20 μL), and 100 mM tris(2-carboxyethyl)-phosphine (TCEP; 10 μL). The final protein concentration was 8 μM. The mixture was stirred continuously at 37°C and its fluorescence was recorded every 3 and 10 min for approximately 30 s for Aβ40 and Aβ42 mutants, respectively (excitation: λ=440 nm, emission: λ=482 nm) by using a PTI QW4 spectrofluorometer equipped with a temperature-controlled cell holder. Immediately prior to recording each reading, the cuvette was inverted about five times for homogenous suspension of fibrils.
The ThT fluorescence kinetics for Aβ42 were fitted to a sigmoid function [Eq. (5)]:
| (5) |
in which A was the final amplitude of the ThT fluorescence, t1/2 was the time the sigmoid reached 50% of the maximum amplitude, and τ was the rise time. The lag time was defined as t1/2−2τ and the aggregation rate as kagg=1/τ. The fits of each measurement are shown in Table 2.
Table 2.
Fit parameters for the aggregation kinetics shown in Figure 1b.
| Mutant | A [A.U.] | t1/2 [min] | τ [min] | Lag time [min] | kagg [min−1] |
|---|---|---|---|---|---|
| wt | 24 9164±3721 | 45.4±0.8 | 9.05±0.72 | 27.3±1.1 | 0.110±0.009 |
| wt #2 | 27 4061±1696 | 31.9±0.4 | 8.51±0.33 | 14.8±0.5 | 0.117±0.005 |
| M35C | 22 3779±4283 | 49.4±1.1 | 10.6±0.98 | 28.3±1.5 | 0.095±0.009 |
| M35C #2 | 22 5840±2731 | 44.5±0.6 | 7.74±0.56 | 29.0±0.9 | 0.129±0.009 |
| F4C | 24 2888±2932 | 41.7±0.6 | 6.54±0.53 | 28.6±0.8 | 0.153±0.013 |
| F4C #2 | 29 2406±4065 | 34.1±0.7 | 5.01±0.59 | 24.0±0.9 | 0.200±0.023 |
CD Measurements
CD measurements were performed in an Applied Photophysics Chirascan spectropolarimeter, with a 1 mm path length cell. The time per point was about 2.5 s and the bandwidth was fixed at 1 nm. To look at the secondary structure of monomers, lyophilized Aβ42 was resuspended in 10 mM NaOH, filtered, and diluted 20 times into 20–25 mM sodium phosphate buffer (pH 7.5, kept in ice) to yield a final protein concentration of about 5 μM. The dead time between dissolving the peptide and data collection was 10 min. Other measurements were conducted as described for ThT or Trp–Cys measurements.
AFM
AFM on the Aβ40 peptides was performed by using a Cypher S, Asylum, research instrument. Samples were prepared by adsorbing 20 μL of the Aβ40 peptides (incubated for 12 h under aggregation conditions) onto freshly cleaved mica for 30 min. The salts and excess fluid from the mica surface were removed and dried overnight. Samples were imaged by using a high-precision silicon tip for ac mode imaging in air.
Trp–Cys Quenching Measurements
For this experiment, lyophilized Aβ was resuspended into 10 mM NaOH, filtered, and diluted into 20–25 mM sodium phosphate buffer (pH 7.5) containing 1 mM TCEP (to prevent disulfide bond formation) and various sucrose concentrations (0, 10, 20, and 30% w/w) in an ice bucket. The final concentration of the mutant proteins was kept fixed at 30 μM for each set of temperature and viscosity measurements. The buffer, sucrose, and TCEP solutions were bubbled with N2O for 1 h prior to dilution of the peptide to eliminate oxygen and scavenge solvated electrons created in the UV laser pulse.
The instrument to measure the Trp triplet lifetime has been described previously.[18, 23c] Briefly, the Trp triplet was populated simultaneously with the singlet state through a UV pulse of light. The triplet-state population was monitored by optical absorption at λ=450 nm (improving on previous measurements, the probe light was provided by a 500 mW diode laser). The decay in optical absorption was detected by a silicon diode, compared with a reference beam, amplified 50×, and recorded on two digital oscilloscopes covering a range from 1 ns to 10 ms. The lifetime of the Trp triplet state in water was about 40 μs, but could be much shorter in the presence of Cys.[18] The bimolecular rate of Cys quenching Trp was 2×10⁸M −1 s−1[18] and the concentration of peptide in these experiments was 30 μM, so the bimolecular contribution to the rate was about 6000 s−1, which was much less than the measured rates due to intramolecular quenching.
Calculating Intramolecular Diffusion Coefficients
To find the intramolecular diffusion coefficient, D, given in Equation (4), we required a probability distribution P(r), such that Equation (4) predicted the measured kR. The distance-dependent quenching rate, q(r), was found experimentally to be that given by Equation (6):
| (6) |
in which ko=4.2×10⁹ s−1, a=4 Å, and β=4 Å−1.[24] Many different techniques for calculating P(r) have been previously used, from simple polymer models to all-atom MD simulations. For Aβ, we used the two models described below. Once an appropriate distribution was chosen for a particular solvent condition, D was calculated by using P(r) and the measured kD+.
Gaussian Chain Model
The simplest polymer chain model, a freely jointed chain, yielded a Gaussian distribution [Eq. (7)]:
| (7) |
in which N was a normalization constant and 〈r2〉 was an adjustable parameter that determined the average Trp–Cys distance. The optimal 〈r2〉1/2 for each temperature, sequence, and solvent condition is given in Table 1. These values were likely to be large due to the intrinsic broadness of the distribution because Equation (3) was only sensitive to the shortest Trp–Cys distances.
Energy Reweighted WLC Model
Chen et al. proposed a model of unstructured proteins in which the preferred conformations were those in which noncontiguous residues of similar hydropathy were in close proximity.[26] Acharya et al. expanded this model to include charge effects as well.[39] This model used as a starting point a large number (20000000) of WLCs created by a Monte Carlo method, setting the persistence length to 4 Å. These chains were created with an excluded diameter for each link on the chain of 4 Å. From these chains, we created a normalized probability distribution, P(r), for the distance, r, between W19 and C4 or C35.
To create compact ensembles, we reweighted the probability distribution to favor conformations in which residues of similar hydropathy were near each other. We assigned hydropathy, h, for each residue in the sequence by using the Miyazawa–Jernigan scale and assumed that two residues with h values within 30% of each other contributed to hydrophobic or -philic interactions, reducing the free energy of the system, and therefore, making conformations containing such interactions favorable [Eq. (8)].
| (8) |
We applied a distance cutoff to EH such that EH=0 for |ri−rj | > 6.5 Å. To account for charged residues, we found the charge, q, on each residue at a particular pH by using the Henderson–Hasselbach equation and calculated the Coulombic energy [Eq. (9)]:
| (9) |
γ and σ were adjustable parameters for the Coulombic and hydrophobic interactions, respectively.
Using the total interaction energy, ETOT=EH+Ee, we could reweight the probability distribution P(r) to yield a new distribution, Z(r) [Eq. (10)]:
| (10) |
The reaction-limited rate was then calculated from the new distribution [Eq. (11)]:
The tuning parameters, γ and σ, could be adjusted to make the calculated kR agree with the measured reaction-limited rate at any particular temperature. For most conditions, we set γ=0 because one rate could not constrain two adjustable parameters and most of the sequence was not charged, and therefore, did not contribute to Ee. However, when comparing measurements at pH 7.5 and 10, we initially set σ=0 and adjusted γ to make the ratio of rates at these two pH values match the measured ratio, then adjusted σ to get absolute agreement with experimental results. As shown in Table 2, the final average Trp–Cys distance and diffusion coefficient were not substantially altered by including the effect of charge.
Supplementary Material
Acknowledgments
The plasmids for the Aβ fusion proteins were a kind gift from Dr. Rudi Glockshuber. We thank Dr. David Eisenberg and Dr. Cong Liu for advice on protein purification, Dr. Barbara Atshaves for use of an HPLC, Terry Ball for assistance with protein purification, Dr. Reza Loloee for assistance with AFM measurements, and Dr. Gal Bitan for many helpful discussions. This work is supported by the National Institutes of Health, R01 GM100908.
Footnotes
Supporting Information for this article can be found under: http://dx.doi.org/10.1002/cphc.201600706.
References
- 1.Knowles TPJ, Vendruscolo M, Dobson CM. Nat Rev Mol Cell Biol. 2014;15:384–396. doi: 10.1038/nrm3810. [DOI] [PubMed] [Google Scholar]
- 2.Alzheimer’s Association. Alzheimer’s Dementia. 2014:10. [Google Scholar]
- 3.Hardy J, Selkoe DJ. Science. 2002;297:353–356. doi: 10.1126/science.1072994. [DOI] [PubMed] [Google Scholar]
- 4.Dobson CM. Seminars Cell Developmental Biol. 2004;15:3–16. doi: 10.1016/j.semcdb.2003.12.008. [DOI] [PubMed] [Google Scholar]
- 5.Hubin E, van Nuland NAJ, Broersen K, Pauwels K. Cell Mol Life Sci. 2014;71:3507–3521. doi: 10.1007/s00018-014-1634-z. [DOI] [PMC free article] [PubMed] [Google Scholar]
- 6.a) Hou L, Shao H, Zhang Y, Li H, Menon NK, Neuhaus EB, Brewer JM, Byeon IJL, Ray DG, Vitek MP, Iwashita T, Makula RA, Przybyla AB, Zagorski MG. J Am Chem Soc. 2004;126:1992–2005. doi: 10.1021/ja036813f. [DOI] [PubMed] [Google Scholar]; b) Bitan G, Kirkitadze MD, Lomakin A, Vollers SS, Benedek GB, Teplow DB. Proc Natl Acad Sci USA. 2003;100:330–335. doi: 10.1073/pnas.222681699. [DOI] [PMC free article] [PubMed] [Google Scholar]; c) Yan YL, Wang CY. J Mol Biol. 2006;364:853–862. doi: 10.1016/j.jmb.2006.09.046. [DOI] [PubMed] [Google Scholar]; d) Sgourakis NG, Yan YL, McCallum SA, Wang CY, Garcia AE. J Mol Biol. 2007;368:1448–1457. doi: 10.1016/j.jmb.2007.02.093. [DOI] [PMC free article] [PubMed] [Google Scholar]
- 7.Rosenman DJ, Connors CR, Chen W, Wang C, García AE. J Mol Biol. 2013;425:3338– 3359. doi: 10.1016/j.jmb.2013.06.021. [DOI] [PMC free article] [PubMed] [Google Scholar]
- 8.Lin YS, Bowman GR, Beauchamp KA, Pande VS. Biophys J. 2012;102:315–324. doi: 10.1016/j.bpj.2011.12.002. [DOI] [PMC free article] [PubMed] [Google Scholar]
- 9.Barz B, Olubiyi OO, Strodel B. Chem Commun. 2014;50:5373–5375. doi: 10.1039/c3cc48704k. [DOI] [PubMed] [Google Scholar]
- 10.Pauwels K, Williams TL, Morris KL, Jonckheere W, Vandersteen A, Kelly G, Schymkowitz J, Rousseau F, Pastore A, Serpell LC, Broersen K. J Biol Chem. 2012;287:5650–5660. doi: 10.1074/jbc.M111.264473. [DOI] [PMC free article] [PubMed] [Google Scholar]
- 11.Finder VH, Glockshuber R. Neurodegener Dis. 2007;4:13–27. doi: 10.1159/000100355. [DOI] [PubMed] [Google Scholar]
- 12.Harper JD, Lansbury PT. Annu Rev Biochem. 1997;66:385–407. doi: 10.1146/annurev.biochem.66.1.385. [DOI] [PubMed] [Google Scholar]
- 13.a) Kuperstein I, Broersen K, Benilova I, Rozenski J, Jonckheere W, Debulpaep M, Vandersteen A, Segers-Nolten I, Van Der Werf K, Subramaniam V, Braeken D, Callewaert G, Bartic C, D’Hooge R, Martins IC, Rousseau F, Schymkowitz J, De Strooper B. EMBO J. 2010;29:3408–3420. doi: 10.1038/emboj.2010.211. [DOI] [PMC free article] [PubMed] [Google Scholar]; b) Stroud JC, Liu C, Teng PK, Eisenberg D. Proc Natl Acad Sci USA. 2012;109:7717–7722. doi: 10.1073/pnas.1203193109. [DOI] [PMC free article] [PubMed] [Google Scholar]; c) Finder VH, Vodopivec I, Nitsch RM, Glockshuber R. J Mol Biol. 2010;396:9–18. doi: 10.1016/j.jmb.2009.12.016. [DOI] [PubMed] [Google Scholar]
- 14.Klein AM, Kowall NW, Ferrante RJ. Ann N Y Acad Sci. 1999;893:314–320. doi: 10.1111/j.1749-6632.1999.tb07845.x. [DOI] [PubMed] [Google Scholar]
- 15.a) Riek R, Güntert P, Dçbeli H, Wipf B, Wüthrich K. Eur J Biochem. 2001;268:5930–5936. doi: 10.1046/j.0014-2956.2001.02537.x. [DOI] [PubMed] [Google Scholar]; b) Shao H, Jao S-c, Ma K, Zagorski MG. J Mol Biol. 1999;285:755–773. doi: 10.1006/jmbi.1998.2348. [DOI] [PubMed] [Google Scholar]; c) Ball KA, Phillips AH, Wemmer DE, Head-Gordon T. Biophys J. 2013;104:2714–2724. doi: 10.1016/j.bpj.2013.04.056. [DOI] [PMC free article] [PubMed] [Google Scholar]
- 16.Lapidus LJ. Mol BioSyst. 2013;9:29–35. doi: 10.1039/c2mb25334h. [DOI] [PMC free article] [PubMed] [Google Scholar]
- 17.Shankar GM, Li SM, Mehta TH, Garcia-Munoz A, Shepardson NE, Smith I, Brett FM, Farrell MA, Rowan MJ, Lemere CA, Regan CM, Walsh DM, Sabatini BL, Selkoe DJ. Nat Med. 2008;14:837–842. doi: 10.1038/nm1782. [DOI] [PMC free article] [PubMed] [Google Scholar]
- 18.Lapidus LJ, Eaton WA, Hofrichter J. Proc Natl Acad Sci USA. 2000;97:7220–7225. doi: 10.1073/pnas.97.13.7220. [DOI] [PMC free article] [PubMed] [Google Scholar]
- 19.Fernandez-Escamilla AM, Rousseau F, Schymkowitz J, Serrano L. Nat Biotechnol. 2004;22:1302– 1306. doi: 10.1038/nbt1012. [DOI] [PubMed] [Google Scholar]
- 20.Tartaglia GG, Pawar AP, Campioni S, Dobson CM, Chiti F, Vendruscolo M. J Mol Biol. 2008;380:425–436. doi: 10.1016/j.jmb.2008.05.013. [DOI] [PubMed] [Google Scholar]
- 21.Conway KA, Lee SJ, Rochet JC, Ding TT, Williamson RE, Lansbury PT. Proc Natl Acad Sci USA. 2000;97:571–576. doi: 10.1073/pnas.97.2.571. [DOI] [PMC free article] [PubMed] [Google Scholar]
- 22.Lapidus LJ, Steinbach PJ, Eaton WA, Szabo A, Hofrichter J. J Phys Chem B. 2002;106:11628–11640. [Google Scholar]
- 23.a) Buscaglia M, Schuler B, Lapidus LJ, Eaton WA, Hofrichter J. J Mol Biol. 2003;332:9–12. doi: 10.1016/s0022-2836(03)00891-x. [DOI] [PubMed] [Google Scholar]; b) Chen YJ, Parrini C, Taddei N, Lapidus LJ. J Phys Chem B. 2009;113:16209–16213. doi: 10.1021/jp904189b. [DOI] [PubMed] [Google Scholar]; c) Singh VR, Kopka M, Chen Y, Wedemeyer WJ, Lapidus LJ. Biochemistry. 2007;46:10046–10054. doi: 10.1021/bi700270j. [DOI] [PubMed] [Google Scholar]; d) Voelz VA, Jager M, Yao S, Chen Y, Zhu L, Waldauer SA, Bowman GR, Friedrichs M, Bakajin O, Lapidus LJ, Weiss S, Pande VS. J Am Chem Soc. 2012;134:12565–12577. doi: 10.1021/ja302528z. [DOI] [PMC free article] [PubMed] [Google Scholar]; e) Waldauer SA, Bakajin O, Lapidus LJ. Proc Natl Acad Sci USA. 2010;107:13713– 13717. doi: 10.1073/pnas.1005415107. [DOI] [PMC free article] [PubMed] [Google Scholar]
- 24.Lapidus LJ, Eaton WA, Hofrichter J. Phys Rev Lett. 2001;87:4. doi: 10.1103/PhysRevLett.87.258101. [DOI] [PubMed] [Google Scholar]
- 25.Szabo A, Schulten K, Schulten Z. J Chem Phys. 1980;72:4350–4357. [Google Scholar]
- 26.Chen Y, Wedemeyer WJ, Lapidus LJ. J Phys Chem B. 2010;114:15969–15975. doi: 10.1021/jp104746g. [DOI] [PubMed] [Google Scholar]
- 27.a) Kusumoto Y, Lomakin A, Teplow DB, Benedek GB. Proc Natl Acad Sci USA. 1998;95:12277–12282. doi: 10.1073/pnas.95.21.12277. [DOI] [PMC free article] [PubMed] [Google Scholar]; b) Lin MS, Chen LY, Tsai HT, Wang SSS, Chang Y, Higuchi A, Chen WY. Langmuir. 2008;24:5802–5808. doi: 10.1021/la703369b. [DOI] [PubMed] [Google Scholar]
- 28.Yang FS, Lim GP, Begum AN, Ubeda OJ, Simmons MR, Ambegaokar SS, Chen PP, Kayed R, Glabe CG, Frautschy SA, Cole GM. J Biol Chem. 2005;280:5892–5901. doi: 10.1074/jbc.M404751200. [DOI] [PubMed] [Google Scholar]
- 29.Ahmad B, Lapidus LJ. J Biol Chem. 2012;287:9193–9199. doi: 10.1074/jbc.M111.325548. [DOI] [PMC free article] [PubMed] [Google Scholar]
- 30.Ahmad B, Chen Y, Lapidus LJ. Proc Natl Acad Sci USA. 2012;109:2336–2341. doi: 10.1073/pnas.1109526109. [DOI] [PMC free article] [PubMed] [Google Scholar]
- 31.Yang M, Teplow DB. J Mol Biol. 2008;384:450–464. doi: 10.1016/j.jmb.2008.09.039. [DOI] [PMC free article] [PubMed] [Google Scholar]
- 32.Bora RP, Prabhakara R. J Chem Phys. 2009;131:155103. doi: 10.1063/1.3249609. [DOI] [PubMed] [Google Scholar]
- 33.Lee C, Ham S. J Comput Chem. 2011;32:349–355. doi: 10.1002/jcc.21628. [DOI] [PubMed] [Google Scholar]
- 34.Bhowmik D, MacLaughlin CM, Chandrakesan M, Ramesh P, Venkatramani R, Walker GC, Maiti S. Phys Chem Chem Phys. 2014;16:885–889. doi: 10.1039/c3cp54151g. [DOI] [PubMed] [Google Scholar]
- 35.Masuda Y, Fukuchi M, Yatagawa T, Tada M, Takeda K, Irie K, Akagi K-i, Monobe Y, Imazawa T, Takegoshi K. Bioorg Med Chem. 2011;19:5967–5974. doi: 10.1016/j.bmc.2011.08.052. [DOI] [PubMed] [Google Scholar]
- 36.Acharya S, Safaie BM, Wongkongkathep P, Ivanova MI, Attar A, Klaerner FG, Schrader T, Loo JA, Bitan G, Lapidus LJ. J Biol Chem. 2014;289:10727–10737. doi: 10.1074/jbc.M113.524520. [DOI] [PMC free article] [PubMed] [Google Scholar]
- 37.Pauwels K, Williams TL, Morris KL, Jonckheere W, Vandersteen A, Kelly G, Schymkowitz J, Rousseau F, Pastore A, Serpell LC, Broersen K. J Biol Chem. 2012;287:5650–5660. doi: 10.1074/jbc.M111.264473. [DOI] [PMC free article] [PubMed] [Google Scholar]
- 38.a) Kim BH, Lyubchenko YL. Nanomedicine. 2014;10:871–878. doi: 10.1016/j.nano.2013.11.016. [DOI] [PMC free article] [PubMed] [Google Scholar]; b) Kim BH, Palermo NY, Lovas SN, Zaikova T, Keana JFW, Lyubchenko YL. Biochemistry. 2011;50:5154–5162. doi: 10.1021/bi200147a. [DOI] [PMC free article] [PubMed] [Google Scholar]
- 39.Acharya S, Safaie BM, Wongkongkathep P, Ivanova MI, Attar A, Klärner FG, Schrader T, Loo JA, Bitan G, Lapidus LJ. J Biol Chem. 2014;289:10727–10737. doi: 10.1074/jbc.M113.524520. [DOI] [PMC free article] [PubMed] [Google Scholar]
Associated Data
This section collects any data citations, data availability statements, or supplementary materials included in this article.