

In this study, Henriques et al. demonstrate that transcription is a nearly universal feature of enhancers in Drosophila and mammalian cells and that nascent RNA sequencing strategies are optimal for identification of both enhancers and superenhancers. Their findings provide insights into the unique characteristics of superenhancers, which stimulate high-level gene expression through rapid pause release; interestingly, this property renders associated genes resistant to loss of factors that stabilize paused RNAPII.
Keywords: enhancers, P-TEFb, Pol II pausing, superenhancers, transcription, termination
Abstract
Regulation by gene-distal enhancers is critical for cell type-specific and condition-specific patterns of gene expression. Thus, to understand the basis of gene activity in a given cell type or tissue, we must identify the precise locations of enhancers and functionally characterize their behaviors. Here, we demonstrate that transcription is a nearly universal feature of enhancers in Drosophila and mammalian cells and that nascent RNA sequencing strategies are optimal for identification of both enhancers and superenhancers. We dissect the mechanisms governing enhancer transcription and discover remarkable similarities to transcription at protein-coding genes. We show that RNA polymerase II (RNAPII) undergoes regulated pausing and release at enhancers. However, as compared with mRNA genes, RNAPII at enhancers is less stable and more prone to early termination. Furthermore, we found that the level of histone H3 Lys4 (H3K4) methylation at enhancers corresponds to transcriptional activity such that highly active enhancers display H3K4 trimethylation rather than the H3K4 monomethylation considered a hallmark of enhancers. Finally, our work provides insights into the unique characteristics of superenhancers, which stimulate high-level gene expression through rapid pause release; interestingly, this property renders associated genes resistant to the loss of factors that stabilize paused RNAPII.
The dynamic regulation of gene expression is crucial for cell growth, differentiation, and development. All cell types in an organism share the same genetic information yet can execute remarkably diverse gene expression programs and behaviors (Levine 2010; Calo and Wysocka 2013). This diversity is largely derived from cell type-specific and condition-specific usage of gene-distal regulatory regions such as enhancers. Furthermore, genetic defects or polymorphisms associated with disease often lie in noncoding regulatory regions, and enhancer dysfunction is implicated in a growing number of disease states (Smith and Shilatifard 2014). Accordingly, there is great interest in developing and optimizing strategies to identify the enhancer landscape in novel cell types and patient-derived tissue samples.
Enhancers were first described as nucleosome-depleted regions with a high density of sequence motifs recognized by DNA-binding transcription factors (TFs). TF binding recruits a plethora of coactivators (Collis et al. 1990), such as p300/CBP, which acetylate TFs and nucleosomes in the vicinity (e.g., acetylation of histone H3 Lys27 [H3K27ac]). With the advance of genomic studies, additional characteristics of enhancers were identified, and this definition was expanded (for reviews, see Calo and Wysocka 2013; Shlyueva et al. 2014). For example, monomethylation of histone H3 Lys4 (H3K4me1) was found to be enriched at enhancer loci (Heintzman et al. 2007; Visel et al. 2009; Creyghton et al. 2010; Rada-Iglesias et al. 2011). In contrast, protein-coding gene promoters typically exhibit trimethylated histone H3K4 (H3K4me3). As a result, the presence of a peak of H3K27ac at a locus, accompanied by high levels of H3K4me1 and low H3K4me3, has been broadly used to identify active enhancers across various cell types and tissues (The ENCODE Project Consortium 2012). However, this methodology has drawbacks and generates considerable false positives and false negatives (Kim and Shiekhattar 2015). Furthermore, recent work has demonstrated that the presence of H3K4me1 is not a requirement for enhancer function (Dorighi et al. 2017; Rickels et al. 2017) and that H3K4me2 and H3K4me3 of local histones are fully compatible with enhancer activity. Therefore, the field is actively working toward improved strategies for defining enhancer regulatory regions.
Notably, enhancers are often sites of transcription (De Santa et al. 2010; Kim et al. 2010; Core et al. 2014). Little is currently known about whether or how enhancer transcription is regulated, but the presence of core promoter motifs and general TFs at many noncoding RNA loci suggests that the process of transcription initiation recapitulates that at mRNA promoters (Core et al. 2014; Arner et al. 2015; Duttke et al. 2015; Scruggs et al. 2015). However, whereas mRNA genes generate stable processed RNAs, transcription at enhancers produces short highly unstable noncoding RNAs (Collis et al. 1990; Kim et al. 2010). Indeed, enhancer RNAs (eRNAs) are often detectable only through the study of nascent RNA species or upon depletion of RNA degradation machineries. Thus, there is a growing interest in probing the nascent RNA transcriptome to locate enhancer regions (Andersson et al. 2014; Core et al. 2014; Arner et al. 2015; Austenaa et al. 2015; Danko et al. 2015). Moreover, given an explosion of models suggesting functions for eRNAs in the modulation of chromatin-modifying enzymes (Kaneko et al. 2014; Bose et al. 2017), three-dimensional looping (Kim and Shiekhattar 2015), and TF retention (Sigova et al. 2015), there is a critical need for a better understanding of the determinants of eRNA production and stability.
Here, we used the high-resolution high-sensitivity Start-seq technique to define unannotated transcription start sites (uTSSs). Start-seq involves the isolation and sequencing of short nascent RNAs associated with early elongation complexes and has proved to be valuable in the definition of TSSs for mRNA genes and divergent noncoding transcripts (Nechaev et al. 2010; Scruggs et al. 2015). Working in Drosophila cells, we compared uTSSs with a repertoire of enhancer loci functionally defined in high-throughput reporter assays (Arnold et al. 2013; Zabidi et al. 2015). We found a remarkable correlation between enhancer activity and both the location and the level of transcription at uTSSs. Furthermore, clustering analysis of uTSSs reveals groups of enhancers, often referred to as superenhancers, in fly cells and developing embryos. As in mammalian systems, these superenhancers are strongly enriched around TFs and master regulators. In mouse embryonic stem cells (mESCs), we demonstrate that Start-seq can be used to define both enhancers and superenhancers with unsurpassed spatial resolution and to elucidate the mechanisms by which superenhancer target genes are regulated.
Surprisingly, in both flies and mESCs, we discovered that the most active enhancers harbor H3K4me3 rather than H3K4me1 and showed that the level of H3K4 methylation corresponds to the amount of transcription at a locus. Thus, the most active enhancers are the most highly transcribed and thus most likely to display H3K4me3; paradoxically, this will cause them to be overlooked by the current prediction methods that rely on H3K4me1 enrichment.
We also report that RNA polymerase II (RNAPII) undergoes regulated pausing and pause release at noncoding loci. Pausing in early transcription elongation is recognized as a hallmark of protein-coding genes and represents a key control point for gene expression (Adelman and Lis 2012). Pausing is induced by the association of the NELF and DSIF complexes with polymerase as it enters elongation. Notably, NELF stabilizes paused RNAPII against termination, allowing the paused complex to remain associated with the promoter region for minutes while awaiting the signal for pause release (Henriques et al. 2013; Jonkers et al. 2014; Chen et al. 2015; Krebs et al. 2017; Shao and Zeitlinger 2017). Consequently, loss of NELF increases RNAPII turnover (Henriques et al. 2013), presumably through termination, resulting in the down-regulation of many genes (Gilchrist et al. 2010; Williams et al. 2015). The duration of pausing is typically dictated by the rate of recruitment of the kinase P-TEFb, whose activity enables pause escape. P-TEFb phosphorylates the Spt5 subunit of DSIF and the C-terminal domain of RNAPII, triggering dissociation of NELF and elongation of RNAPII downstream into the gene (Adelman and Lis 2012). Pausing is a critical checkpoint: RNAPII does not productively elongate without the P-TEFb-mediated modifications and new protein partners that accompany pause release (Gilchrist et al. 2010; Adelman and Lis 2012).
Current models of enhancer function imply that enhancers stimulate the transition of RNAPII from pausing to productive RNA synthesis through recruitment of P-TEFb and/or the superelongation complex (Schaukowitch et al. 2014; Smith and Shilatifard 2014; Bradner et al. 2017). Thus, the recognition that RNAPII pauses at enhancers and eRNA synthesis requires pause release has significant implications for such models and invokes a shift in our thinking on the process of enhancer transcription.
Results
Nascent RNAs identify regulatory elements
Start-seq is a sensitive assay that captures nascent TSS-associated RNAs (Start-RNAs) within early elongation complexes (Nechaev et al. 2010; Henriques et al. 2013). Nascent RNAs are sequenced in a strand-specific manner from both the 5′ end (to precisely define TSSs) and the 3′ end (to pinpoint the position of elongating RNAPII). To define active TSSs genome-wide, we developed an algorithm, TSScall, that uses Start-seq 5′ end reads and a reference genome annotation (gtf format). TSScall first identifies TSS locations for active annotated genes, which we call observed TSSs (obsTSSs), using a user-defined search window around reference annotations. Subsequently, TSScall finds peaks of Start-seq reads that fall outside of annotated regions (e.g., >1 kb away from obsTSSs on the same strand). We collectively refer to such sites as uTSSs (Fig. 1A). TSScall is available with extended usage information on GitHub (http://github.com/niehs/TSScall). TSScall also groups divergent or convergent TSSs within 1 kb of one another, stitching together nearby TSSs into clusters. Within each cluster, a “dominant” TSS is defined as the site with the highest read counts. Importantly, TSScall makes no assumptions about transcription directionality during TSS identification. Similar algorithms that require the presence of divergent TSSs for enhancer identification will miss many sites in Drosophila, which exhibits lower levels of divergent initiation than mammals (Core et al. 2012). Notably, TSScall has been optimized to generate a list of genomic obsTSS and uTSS coordinates from Start-seq data within minutes that can then be input directly into user-friendly Web-based resources for integrative genomic analysis, such as ORIO (Online Resource for Integrative Omics) (Lavender et al. 2017).
Figure 1.

Start-RNAs identify regulatory elements with enhancer activity. (A) Start-RNAs (sense Start-RNA [green] and antisense Start-RNA [purple]) as well as RNAPII, H3K4me1, H3K4me3, and H3K27ac ChIP-seq (chromatin immunoprecipitation [ChIP] combined with high-throughput sequencing) profiles are shown around the Kdm2 gene, revealing both annotated TSSs and uTSSs. (B) Start-RNAs and DNase sequencing (DNase-seq) signal at uTSSs, ranked by number of Start-RNA reads (±50 base pairs [bp]). uTSSs that fall within 1 kb of the peak of STARR (self-transcribing active regulatory region) enhancer activity are indicated (green) (Arnold et al. 2013; Zabidi et al. 2015). (C,D) The read density from a number of genomic features is shown at uTSSs within STARR-seq (STARR sequencing) enhancers. P-values are from Mann-Whitney test. (E) Distribution of the number of uTSSs associated with active mRNA genes in S2 cells. A subset of genes has five or more associated uTSSs (n = 568 genes; green). (F) Examples of genes with five or more associated uTSSs. (G) Browser shot of the ecdysone receptor gene (EcR) showing enrichment with Start-RNAs, STARR-seq signal (red), and H3K27ac (purple) and H3K4me1 (gray) histone modifications. (H) 4-thiouridine (4sU) RNA sequencing (RNA-seq) signal is shown for the genes with zero, one to four, and five or more associated uTSSs. P-values are from Kruskal-Wallis test. Box plots show the 25th–75th percentiles, and error bars depict the 10th–90th percentiles. See also Supplemental Figure S1.
Running TSScall on ∼46 million Start-RNA reads from Drosophila S2 cells identified 10,668 obsTSSs and 11,995 uTSSs (Materials and Methods). RNAPII ChIP-seq (chromatin immunoprecipitation [ChIP] combined with high-throughput sequencing) signal and histone marks associated with activity could be found at uTSSs (Fig. 1A). We hypothesized that a fraction of uTSSs represents enhancers, prompting us to assess chromatin accessibility, histone modifications, and other features of enhancers at these loci. First, we ranked all uTSSs by the number of Start-RNA reads (±50 base pairs [bp] from the uTSS) and found that many uTSSs corresponded to regions of accessible chromatin as defined by DNase hypersensitivity (Fig. 1B). Drosophila S2 cells provide a unique opportunity as the cell type with the most comprehensive list of functionally defined enhancer loci based on STARR-seq (self-transcribing active regulatory region [STARR] sequencing), a high-throughput and quantitative method for identifying genomic sequences with enhancer activity in a reporter assay (Arnold et al. 2013; Zabidi et al. 2015). Importantly, STARR-seq has been used with several different promoters, allowing identification of sequences that enhance either housekeeping or developmental classes of promoters (n = 11,364). Thus, we compared uTSSs with the list of enhancer loci identified by STARR-seq. Strikingly, nearly half of uTSSs (∼49%, n = 5894) fell within these functionally defined enhancer regions (Fig. 1B). This represents a high rate of positive enhancer identification and compares very favorably with efforts by the ENCODE Consortium to define enhancer regions based on a compendium of histone modifications where ∼30% of putative enhancer loci were found to possess enhancer activity in similar reporter assays (Kwasnieski et al. 2014).uTSSs that fall within enhancer regions are generally more transcriptionally active (Fig. 1C) and considerably more accessible (Fig. 1D) than uTSSs that do not fall within a functionally defined enhancer. The overlapping sites also display higher levels of histone marks H3K4me1 and H3K27ac as well as occupancy by cohesin (Fig. 1D), all canonical marks of enhancers (Calo and Wysocka 2013; Shlyueva et al. 2014). Interestingly, uTSSs located outside of functionally defined enhancers exhibit higher levels of H3K36me3 (Fig. 1D), a histone modification characteristic of productive transcription elongation. We therefore hypothesize that these sites could include TSSs for long noncoding RNAs or yet unannotated protein-coding genes. Sequences surrounding several randomly selected uTSSs that were not considered active in high-throughput STARR-seq assays did nonetheless exhibit detectable enhancer activity in a more sensitive luciferase reporter assay (Supplemental Fig. S1A). Overall, we suggest that the characterization of uTSSs by Start-seq is a sensitive and powerful method to define enhancers, as nearly 50% of uTSSs are within functionally defined enhancer regions.
Clusters of uTSSs are enriched around master regulators
For each active annotated gene, the TSScall algorithm also reports the number of “associated” uTSSs (defined for each obsTSS as the number of uTSSs that are closer to it than to any other obsTSS). Whereas most genes were associated with fewer than two uTSSs, we found a small number of genes with five or more associated uTSSs (n = 568) (Fig. 1E, with five or more in green). Large clusters of enhancers, called superenhancers, have been identified previously in a number of mammalian cell types, surrounding genes important for cell identity and disease (Hnisz et al. 2013; Whyte et al. 2013). Therefore, we wondered whether the clusters of uTSSs identified here could represent a similar phenomenon and identify key regulators in Drosophila cells. Indeed, genes with five or more associated uTSSs revealed a striking enrichment in DNA-binding TFs and regulators of signal-responsive networks, such as ecdysone receptor, AP-1, and NF-κB pathways (Fig. 1F; Supplemental Fig. S1B; Supplemental Table S1). Clusters of STARR enhancers can be similarly found around such genes (Arnold et al. 2013). Notably, the uTSSs within these clusters display elevated levels of H3K4me1 and H3K27ac and are highly expressed (e.g., Fig. 1G,H; Supplemental Fig. S1C)—features previously used to distinguish superenhancers from typical enhancers (Hnisz et al. 2013).
Importantly, a similar approach in mixed stage embryos (0- to 16-h embryos) (Supplemental Fig. S1D,E; Supplemental Table S1) reveals that genes with high levels of associated uTSSs are enriched in TFs and chromatin regulators, including developmental regulators (TALE/MEIS factors, muscleblind, and ovo), histone-modifying complexes (Kdm2 and Trithorax), and chromatin remodelers (Swi/Snf subunits). Thus, we conclude that important genes controlling chromatin state and development in flies, like those in mammalian systems, are surrounded by a high level of regulatory activity and can be readily identified from Start-seq data by locating clusters of TSSs.
Transcription levels correlate with enhancer activity
Knowing that many uTSSs are within with functionally defined enhancer loci (Fig. 1B) led us to ask where Start-RNAs originate within these regions (Arnold et al. 2013; Zabidi et al. 2015). Using the aforementioned comprehensive list of enhancers in S2 cells (Arnold et al. 2013; Zabidi et al. 2015), we found that Start-RNAs are significantly enriched within these regions, particularly at the center of enhancer activity (Fig. 2A, left). In contrast, random genomic regions with the same size distribution have limited transcriptional activity (Fig. 2A, right). Ranking enhancers by their activity levels revealed that enhancers with greater activity are more highly transcribed, as measured by Start-RNA signal (Fig. 2B). This result highlights the important relationship between transcription levels and enhancer activity (Kim et al. 2010; Core et al. 2014; Arner et al. 2015) and demonstrates the utility of Start-seq in elucidating both the location and activity of enhancer loci.
Figure 2.
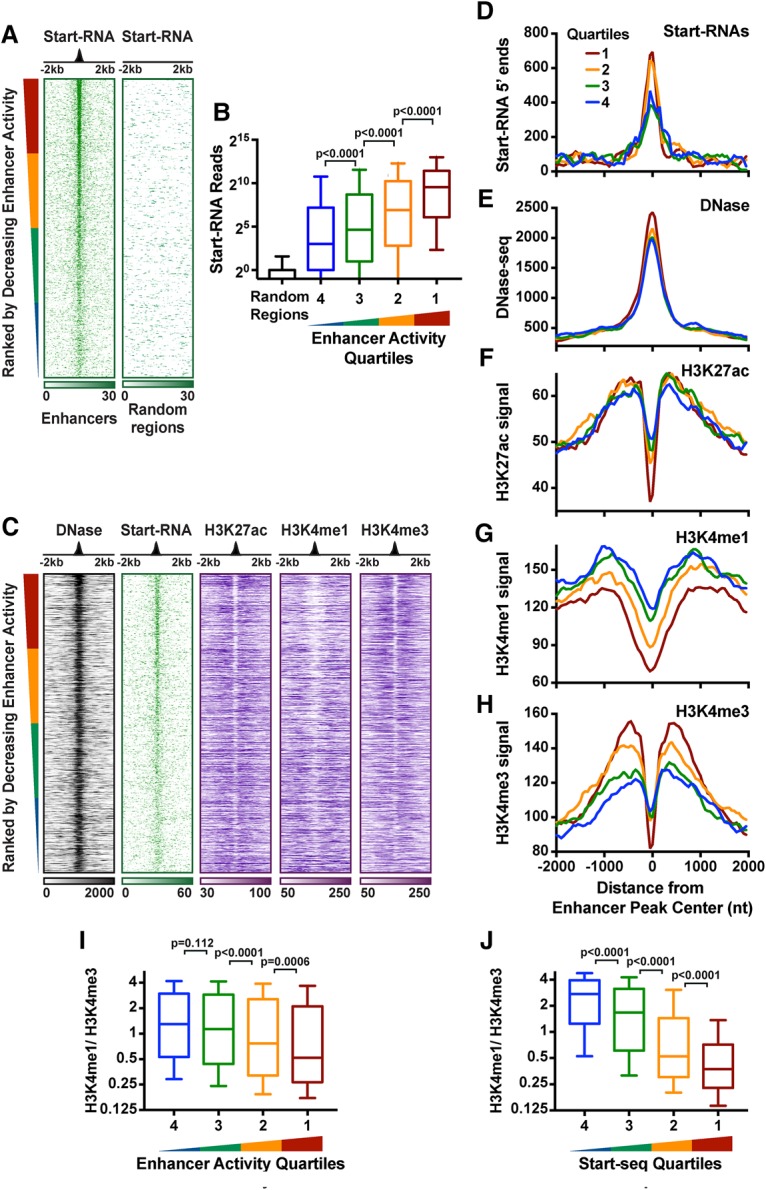
Start-RNAs are a sensitive readout of enhancer location and activity. (A) 5′ end distributions of Start-RNAs at enhancer regions (n = 11,364; left) and randomly selected genomic regions (right) of the same size. Data are oriented around enhancer peaks and rank-ordered based on enhancer activity. (B) The number of Start-seq reads (±200 bp) is shown at enhancer regions divided into quartiles by activity and at random regions for comparison. Spearman correlation ρ = 0.24. (C) Heat map representations of DNase-seq, Start-RNAs, and H3K27ac, H3K4me1, or H3K4me3 ChIP-seq signal around accessible STARR enhancers that contain an eTSS (a uTSS within an accessible STARR enhancer). n = 3692. Data are oriented and rank-ordered as in A. (D–H) Average distributions of Start-RNA 5′ ends (D), DNase-seq (E), H3K27ac (F), H3K4me1 (G), and H3K4me3 (H) histone modifications at sites shown in C. Read counts were summed in 50-nucleotide (nt) bins and centered on the enhancer center peak, and, in D, the moving average across five bins was plotted. (I,J) Ratio of H3K4me1 to H3K4me3 at sites shown in C rank-ordered by enhancer activity (I) or Start-RNA levels (±200 bp) (J). Box plots show the 25th–75th percentiles, and error bars depict the 10th–90th percentiles. P-values are from Kruskal-Wallis test. See also Supplemental Figure S2.
A pattern of chromatin organization and histone modifications has been broadly used for epigenomic annotation of enhancers in a myriad of biological contexts (for review, see Shlyueva et al. 2014). For example, H3K4me1 is thought to denote both active and inactive enhancer regions, whereas H3K27ac is a feature of active enhancers (Creyghton et al. 2010; Rada-Iglesias et al. 2011). These signatures have been correlated with the presence of enhancers and shown to be predictive of enhancer states, but it is unclear what relationship they display with the levels of enhancer activity. Therefore, we asked what genomic features give the clearest insight into the location and level of enhancer activity. Notably, one of the caveats of the STARR-seq plasmid-based reporter assay is that it does not account for the influence of the chromatin environment on gene regulation (Shlyueva et al. 2014). Therefore, to enrich for enhancer regions that are active in vivo, we focused on STARR-seq enhancers within accessible chromatin regions as measured by DNase sequencing (DNase-seq). Additionally, because STARR-seq identified a number of mRNA promoters that could act as enhancers, we removed any STARR-seq regions that lacked an enhancer-like uTSS. We then plotted DNase, Start-seq, and histone modifications at these sites, ranked by decreasing enhancer activity (n = 3692) (Fig. 2C). Again, Start-RNA levels display a positive correlation with enhancer activity (Fig. 2B–D). However, neither DNA accessibility nor H3K27ac levels show a clear relationship with enhancer activity in Drosophila (Fig. 2E,F), in agreement with studies in mammals (Kwasnieski et al. 2014).
Highly active and highly transcribed enhancers display H3K4me3
Compared with promoters, H3K4me3 levels at enhancers have been described to be low, and thus an elevated ratio of H3K4me1 to H3K4me3 has been proposed as one of the characteristics that differentiate enhancers from promoters (Heintzman et al. 2007). However, promoters themselves can often function as enhancers, raising questions about the importance of this distinction (Arnold et al. 2013). Furthermore, prior studies suggest a global, positive relationship between the levels of H3K4 methylation and transcriptional activity, including at sites that generate unstable RNAs (Core et al. 2014; Soares et al. 2014). We therefore sought to probe the relationship between H3K4 methylation, transcription activity, and enhancer activity by leveraging our high-confidence set of sites that exhibit (1) functional enhancer activity, (2) eRNA synthesis, and (3) accessible chromatin. Remarkably and contrary to expectations, we observed a modest, negative correlation between H3K4me1 levels and enhancer activity (ρ = −0.173) (Fig. 2G). Moreover, highly active enhancer regions possess significantly elevated levels of H3K4me3 (Fig. 2H). As a result, the H3K4me1 to H3K4me3 ratio was found to be a poor predictor of the strongest enhancers (Fig. 2I) despite its widespread use in the definition of such regulatory elements.
We next wanted to determine whether the most transcriptionally active enhancers are marked by H3K4me3. Thus, we investigated the same set of functionally defined elements separated into quartiles of activity by Start-RNA levels. Importantly, this analysis confirmed that the most transcriptionally active enhancers are strongly depleted in H3K4me1 and enriched in H3K4me3 (Supplemental Fig. S2A,B). Therefore, enhancers that generate the highest levels of transcription exhibit significantly lower H3K4me1/ H3K4me3 ratios (Fig. 2J).
To ensure that these findings were robust, we repeated analyses of H3K4 methylation at STARR-seq enhancers that are >2 kb away from the obsTSS of an annotated gene TSS (Supplemental Fig. S2C). We also evaluated chromatin marks at uTSSs within accessible STARR enhancers (referred to here as eTSSs) that are >1.25 kb upstream of the nearest obsTSS (Supplemental Fig. S2D). In both cases, the relationship between high-level transcription at enhancers and H3K4me3 deposition was maintained. We conclude that the level of transcription defines the state of H3K4 methylation. Consequently, the most active enhancers display more H3K4me3 than H3K4me1. Critically, this finding raises questions about the current genomic strategies for enhancer prediction and strongly supports the use of nascent transcription assays for this purpose.
Drosophila enhancers display both divergent and convergent transcription
The majority of mammalian TSSs for protein-coding genes and enhancers occurs in pairs, with coupled sense and antisense promoters (De Santa et al. 2010; Kim et al. 2010; Wu and Sharp 2013; Duttke et al. 2015; Scruggs et al. 2015). In contrast, global run-on sequencing (GRO-seq) assays indicated lower levels of divergent transcription at promoters and putative enhancers in Drosophila (Core et al. 2012). To probe this difference using our high-confidence set of eTSSs (those occurring within accessible STARR-seq enhancers; n = 4873), we determined the percentage of eTSSs with a TSScall-defined antisense TSS within 1 kb upstream (divergent) or downstream (convergent). This revealed divergent transcription at 50.7% and convergent transcription at 48.9% of Drosophila eTSSs (Fig. 3A; Supplemental Fig. 3A). Moreover, we discovered a sizeable percentage of eTSSs exhibiting both divergent and convergent transcription (20.2%). Thus, the percentage of eTSSs that are unidirectional is relatively low, particularly considering our stringent thresholds for TSS identification. Antisense eTSSs could be found near mRNA genes, in agreement with the reported proximity of Drosophila enhancers with promoters (Arnold et al. 2013). Interestingly, when we evaluated intergenic eTSSs, we found markedly higher levels of divergent transcription (∼65% divergent) than at enhancers located within genes (Supplemental Fig. 3A), suggesting that intergenic Drosophila eTSSs are more like their mammalian counterparts.
Figure 3.

eRNA synthesis is regulated during elongation. (A) The percentage of eTSSs that are divergent, convergent, or both with another defined TSS (mRNA or uTSS) within 1 kb. eTSSs without any antisense partners in this window are denoted as unidirectional. (B) Distribution of Initiator (Inr) and pause button (PB) motifs centered on eTSSs (n = 4873; top) and mRNA TSSs (n = 10,162; bottom). (C) The average distribution of 5′ end (green) and 3′ end (blue) Start-RNAs centered on eTSSs and mRNA TSSs. (D) Normalized Start-RNA 3′ end distributions from control or flavopiridol (FP)-treated cells (10 min). Data are centered on eTSSs and rank-ordered by decreasing levels of Start-RNAs (±50 bp). (E,F) The average distribution of Start-RNA 3′ end locations (E) and levels (F) (0–100 bp from the TSS) from control or FP-treated cells. Box plots show the 25th–75th percentiles, and error bars depict the 10th–90th percentiles. P-values are from Mann-Whitney test. (G) Heat map depicting the relative changes in Start-RNAs at eTSSs and mRNA TSSs after triptolide (Trp) inhibition. Data are organized into five clusters (color-coded in the left side bar). n = 1492 eTSSs; n = 8389 mRNA TSSs. The histogram at the right represents the percentage of sites from mRNA TSSs (empty bars) or eTSSs (filled bars) within each cluster. (H, left) 3′ end positions from Start-seq and PRO-seq (precision run-on sequencing) are shown around eTSSs. Data are oriented and ranked as in D. (I) The average distribution of 3′ ends from Start-seq and PRO-seq centered on eTSSs and mRNA TSSs. At eTSSs, note the decrease in PRO-seq signal to background levels ∼150 bp from the TSS (indicated by black arrows). See also Supplemental Figure S3.
Promoter elements associated with polymerase pausing at mRNA TSSs are also enriched at eTSSs
RNAPII pausing is an important regulatory step in the expression of protein-coding genes in many organisms (Adelman and Lis 2012), but it is unclear whether enhancer-bound RNAPII undergoes the same regulatory steps. Pausing at Drosophila mRNA promoters is associated with specific sequence motifs, including an Initiator (Inr) element centered at the TSS, an upstream binding site for the TF GAGA, and a “pause button” (PB) motif found within the promoter-proximal region (Hendrix et al. 2008; for review, see Vo Ngoc et al. 2017). We thus asked whether these elements are present at enhancer loci. We found that eTSSs displayed information content comparable with that of protein-coding TSSs (mRNA TSSs; n = 10,162) (Supplemental Fig. S3B), with identical locations of Inr and PB elements (Fig. 3B). This finding is in agreement with previous work showing that the Inr motif and other core promoter elements associated with initiation are enriched at noncoding loci (Andersson et al. 2014; Core et al. 2014; Arner et al. 2015; Duttke et al. 2015; Scruggs et al. 2015) and extends this result to sites with known enhancer function. Furthermore, our work uncovers conservation of promoter elements that influence pausing at eTSSs, suggesting that transcriptional pausing could occur in a regulated fashion at enhancer loci.
Evidence for regulated pausing at enhancers
To further evaluate the process of initiation at enhancers, we examined the distributions of Start-RNA 5′ ends, which define the level and focus of transcription initiation. Comparing eTSSs with mRNA TSSs, we found that enhancer transcription levels were lower than at protein-coding genes (Fig. 3C, green lines), as anticipated. However, initiation was similarly focused around eTSSs. This suggests a surprising level of precision in enhancer transcription initiation. We next investigated the distribution of Start-RNA 3′ ends at eTSSs and mRNA TSSs (Fig. 3C, blue lines). Pausing at mRNA genes occurs 20–60 nucleotides (nt) downstream from the TSS, creating a peak of 3′ end reads in this region (Fig. 3C, bottom). Similarly, Start-RNA 3′ ends revealed that RNAPII pauses at a similar location downstream from eTSSs (Fig. 3C, bottom, peak extends from +20 to +70). These findings underscore that TSS-proximal pausing occurs during early elongation at enhancer loci, as it does for protein-coding genes (Core et al. 2012; Henriques et al. 2013).
Control of early elongation and pause release within enhancer regions
Current models of enhancer function typically involve eRNAs or enhancer-associated factors stimulating pause release at the target gene promoter, enabling productive mRNA elongation (Schaukowitch et al. 2014; Smith and Shilatifard 2014; Kim and Shiekhattar 2015; Bradner et al. 2017). Intriguingly, eRNAs are also reported to be transcribed simultaneously with their target genes (Arner et al. 2015). However, it remains unclear how eRNA synthesis is controlled. We thus asked whether elongation of eRNAs is regulated using mechanisms previously defined at protein-coding genes.
Pause release at mRNA genes is triggered by the activity of the kinase P-TEFb, which phosphorylates Spt5, allowing dissociation of NELF and release of RNAPII into productive elongation (Peterlin and Price 2006). To determine whether eRNA synthesis also involves P-TEFb-mediated pause release, we measured Start-RNA levels in the presence of the P-TEFb inhibitor flavopiridol (FP). Previous work has demonstrated that prevention of pause release by FP causes an accumulation of paused RNAPII and associated nascent RNAs at gene promoters (Henriques et al. 2013; Jonkers et al. 2014). Likewise, inhibition of pause release with FP (10 min of treatment) elicits a broad increase in Start-RNA abundance at eTSSs (Fig. 3D). Metagene analyses and quantification of the Start-RNA 3′ end signal at eTSSs reveals a marked increase in reads that is restricted to the region of pausing, similar to mRNA TSSs (Fig. 3E,F; Henriques et al. 2013). This result demonstrates that P-TEFb activity is indeed required to promote release of RNAPII at enhancers.
We next addressed the temporal stability of RNAPII and associated eRNAs at enhancers by taking advantage of the potent inhibitor of transcription initiation triptolide (Trp) (Vispé et al. 2009; Henriques et al. 2013; Chen et al. 2015; Krebs et al. 2017; Shao and Zeitlinger 2017). Trp treatment inhibits the activity of the TFIIH helicase, blocking new transcription initiation. In this way, the stability (or lifetime) of existing early elongation complexes can be measured by analyzing Start-RNA levels during a time course of Trp-mediated inhibition (Henriques et al. 2013; Krebs et al. 2017). Importantly, RNAPII lost from mRNA promoters during Trp treatment is typically released into productive elongation, although a modest level of premature termination was described previously (Henriques et al. 2013).
We analyzed decay rates of paused RNAPII at both mRNA TSSs and eTSSs with significant read counts in the absence of Trp, performing an unbiased clustering of sites with similar decay kinetics (Fig. 3G). As reported previously for mRNA TSSs, this uncovered a range of RNAPII stabilities, with half-lives of paused RNAPII ranging from ∼2 min to >20 min (Supplemental Fig. S3C; Henriques et al. 2013; Jonkers et al. 2014; Chen et al. 2015; Krebs et al. 2017; Shao and Zeitlinger 2017). Intriguingly, almost 50% of eTSSs fall within the cluster with the fastest RNAPII decay rate (t½ < 2.5 min), suggesting that paused RNAPII is less stable at enhancers than promoters (Fig. 3G). However, like mRNA TSSs, eTSSs were distributed across all clusters and displayed highly variable decay rates. Indeed, RNAPII exhibited very slow decay kinetics at a subset of both promoters and enhancers (clusters 4 and 5), indicative of highly stable RNAPII molecules (Fig. 3G, right). Together, these data imply that pausing occurs at enhancers and support that RNAPII at enhancers undergoes termination or pause release more rapidly than within promoter regions.
To determine the efficiency of pause release and the extent of nascent transcription at enhancers, we made use of precision run-on sequencing (PRO-seq) (Kwak et al. 2013). This strategy captures nascent transcripts associated with actively engaged polymerase and allows for single-nucleotide resolution localization. PRO-seq is thus complementary with Start-seq to confirm the presence of paused RNAPII at enhancers and define the length of nascent eRNAs as measured precisely from their TSSs. Heat maps displaying 3′ ends of nascent transcripts detected using either Start-seq or PRO-seq reveal early elongation complexes near eTSSs (Fig. 3H). As observed with Start-RNA 3′ ends (Fig. 3I, blue), PRO-seq 3′ ends (Fig. 3I, gray) display a TSS-proximal peak characteristic of pausing. At mRNA promoters, PRO-seq signal is observed to extend downstream into the gene at levels that are significantly above background. However, at enhancers, PRO-seq signal drops to background levels just beyond the region of pausing, indicating that RNAPII does not typically transcribe more than ∼100 nt from the eTSS (Fig. 3I, see arrows; Supplemental Fig. S3D). To our knowledge, this is the first direct measurement of the distance of enhancer transcription wherein the single-nucleotide resolution of eTSSs afforded by Start-seq coupled with precise mapping of nascent eRNA 3′ ends by PRO-seq confirms a surprising dearth of productive RNAPII elongation within enhancer regions.
The above data indicate that paused RNAPII at enhancers is particularly susceptible to early termination (Austenaa et al. 2015). Our previous work had shown a modest level of termination by paused RNAPII at mRNA promoters and demonstrated that short RNAs released in this manner are targeted for 3′-to-5′ RNA degradation by the exosome (Henriques et al. 2013). Interestingly, we found that RNAs released during this premature termination were often oligo-adenylated at their 3′ ends, a characteristic that facilitates interactions with and degradation by exosome. Specifically, Start-RNAs detected in cells depleted of exosome activity using RNAi harbored nontemplated stretches of A residues at their 3′ ends (Henriques et al. 2013). We therefore analyzed Start-RNAs generated from enhancer regions, comparing samples from wild-type cells with those depleted of exosome activity (Rrp40 RNAi). This analysis revealed a marked enrichment in 3′ end oligo-adenylated eRNA species in the Rrp40-depleted samples (Supplemental Fig. S3E–G). Importantly, a higher percentage of RNAs derived from enhancers were found to be oligo-adenylated than from promoters (Supplemental Fig. S3F), suggesting a higher level of termination and targeted RNA degradation. Taken together, our results show that regulated pausing and pause release occur at enhancers and that early elongation complexes at enhancers are more susceptible to termination than their promoter-associated counterparts. We propose that the elevated level of RNAPII termination at enhancers and the specific targeting of these short RNAs to the exosome through oligo-adenylation play a central role in instituting the lack of stability that is a hallmark of eRNAs.
Elongation factor Spt5 is necessary for protein-coding transcription in Drosophila
The above data suggest that early transcription elongation is regulated similarly at coding and noncoding RNA loci, with controlled pausing and pause release governing eRNA production and RNAPII occupancy of enhancers. The Spt5 factor plays a central role in pausing and release: Its presence is required for the association of NELF with paused RNAPII, and its phosphorylation is a central event in pause release (Adelman and Lis 2012). We thus wished to evaluate the effect of Spt5 depletion on transcription at enhancers and other noncoding regions. Spt5 was of particular interest in this regard, since recent work in Saccharomyces cerevisiae (Shetty et al. 2017) demonstrated that Spt5 loss impacted mRNA synthesis and noncoding RNA production differently: mRNA levels were significantly reduced in the absence of Spt5, but noncoding antisense transcripts were increased. We therefore depleted the Spt5 protein in Drosophila using RNAi (Supplemental Fig. S4A,B) and globally measured newly synthesized RNAs, RNAPII occupancy, and Start-RNA production. Crucially, to accurately define the nature and breadth of Spt5 activities in vivo, we used rigorous “spike-in” normalization of all genomic data sets (see the Materials and Methods).
We performed metabolic labeling of RNA (using 10-min labeling with 4-thiouridine [4sU]) in Spt5-depleted cells as compared with cells mock-treated with dsRNA targeting β-galactosidase (control cells). 4sU RNA sequencing (RNA-seq) is a highly sensitive bias-free method (Cleary et al. 2005) for analysis of newly transcribed RNA that gives insight into the dynamics of RNA synthesis. Evaluation of newly synthesized RNA revealed considerably reduced transcription of mRNA in the absence of Spt5 (Fig. 4A, top), with the vast majority of active genes being significantly down-regulated (Fig. 4A, bottom). Thus, in agreement with recent work in S. cerevisiae (Shetty et al. 2017), our results indicate a broad critical role for Spt5 in productive transcription elongation at protein-coding genes. We note that the global impact of Spt5 depletion on mRNA production observed using 4sU RNA-seq is consistent with the essential nature and evolutionary conservation of Spt5. However, this result differs from previous findings using measurements of steady-state mRNA levels that lacked “spike-in” normalization controls. This earlier work argued for a much more selective gene-specific role of Spt5 (Krishnan et al. 2008; Komori et al. 2009; Diamant et al. 2016). However, based on our findings and those from the Winston laboratory (Shetty et al. 2017), we suggest that prior reports vastly underestimated the role of Spt5 and that evaluation of newly transcribed RNAs in conjunction with appropriate normalization strategies gives the most accurate readout of transcriptional defects caused by perturbation of essential factors.
Figure 4.

Elongation factor Spt5 is critical for all RNAPII-dependent transcription. (A, top) 4sU RNA-seq reveals a broad reduction in transcription upon Spt5 depletion. P < 0.001. Fold change > 1.5. (Bottom) Example tracks of a down-regulated gene. (B) Normalized RNAPII ChIP-seq signal (antibody against Rpb3) in control and Spt5-depleted cells. Data are shown around TSSs (depicted as arrows) with significant RNAPII signal in control cells. n = 7733. Genes are rank-ordered randomly. (C) Average RNAPII signal at protein-coding genes upon Spt5 depletion. (D) Average distribution of Start-RNA 3′ ends in control and Spt5-depleted cells at protein-coding promoters. (E) Example enhancer region, with the eTSS position shown as arrow. Spt5 depletion decreases levels of Start-RNA (3′ ends are shown) and RNAPII ChIP-seq signal. (F) Average distribution of RNAPII ChIP-seq signal from control cells and Spt5-depleted cells around active enhancers >2 kb from an obsTSS. n = 1254. (G) Average distribution of Start-RNA 3′ ends from control cells and Spt5-depleted cells around eTSSs. n = 4873. (H,I) Pie chart showing the percentage of TSSs with divergent (H) and convergent (I) transcription antisense to mRNA TSSs. Example genes are shown for each. (J) Start-RNA levels (±50 bp) from control or Spt5-depleted cells centered on mRNA TSSs and uTSSs that are divergent from or convergent with mRNA genes. Box plots show the 25th–75th percentiles, and error bars depict the 10th–90th percentiles. P-values are from Kruskal-Wallis test. See also Supplemental Figure S4.
To address whether reduced RNA levels were directly due to defects in transcription elongation, we performed RNAPII ChIP-seq in control and Spt5-depleted S2 cells using an exogenous reference genome for normalization. The results revealed a strong global decrease in RNAPII signal near the promoters of protein-coding genes upon loss of Spt5 (Fig. 4B). As observed previously in NELF-depleted cells (Gilchrist et al. 2010), RNAPII that fails to pause promoter-proximally is not released into productive elongation but is lost from the gene body (Fig. 4C). Loss of engaged promoter-proximal RNAPII in Spt5-depleted cells was further confirmed by Start-seq in control versus Spt5-depleted cells (Fig. 4D). Taken together, these data establish that Drosophila Spt5 is globally required for RNAPII accumulation at mRNA promoters and for the majority of productive mRNA synthesis.
Spt5 is critical for synthesis of all RNAPII transcribed noncoding RNAs in Drosophila
In addition to protein-coding genes, Spt5 depletion perturbed every annotated class of RNAPII transcribed RNA (Supplemental Fig. S4C), including pre-microRNAs and other noncoding RNAs. This highlights the importance of Spt5 across RNA species with varied biogenesis and processing strategies. We thus asked whether synthesis of eRNAs also requires Spt5. We found that RNAPII occupancy and Start-RNA levels are greatly reduced at enhancers in Spt5-depleted cells (see the example locus in Fig. 4E). Analysis of RNAPII ChIP-seq signal at enhancers reveals enrichment of RNAPII at the peak of enhancer activity in control cells (STARR enhancers that are >2 kb from the nearest obsTSS are shown) (Fig. 4F, gray). This RNAPII signal is significantly decreased when Spt5 is depleted (Fig. 4F, orange; Supplemental Fig. S4D). Similarly, Start-RNA levels at eTSSs in control versus Spt5-depleted samples confirm a significant reduction in eRNA synthesis upon loss of Spt5 (Fig. 4G; Supplemental Fig. S4E). We conclude that the transcription elongation machinery, exemplified by Spt5, is broadly essential for the maintenance of RNAPII and transcription activity at enhancers.
This finding motivated us to analyze the effect of Spt5 depletion on transcription near mRNA TSSs that is either divergent (upstream antisense) (Fig. 4H) or convergent (downstream antisense) (Fig. 4I) in nature. Recent work indicated that loss of Spt5 in S. cerevisiae caused concomitant decreases in mRNA production and increases in divergent and convergent antisense transcripts (Shetty et al. 2017). Although Drosophila promoters exhibit less divergent and convergent antisense transcription than mammalian promoters (Core et al. 2012), of 10,162 mRNA promoters, we identified 1479 that generate divergent RNAs (Fig. 4H) and 1763 with convergent RNAs (Fig. 4I). Individual examples of antisense transcription showed considerable losses of both RNAPII and Start-seq signal in Spt5-depleted cells (Fig. 4H,I). Accordingly, the negative effects of Spt5 depletion on these antisense transcription units is pervasive and even stronger than effects on mRNAs (Fig. 4J). These data provide strong evidence that Spt5 is essential in Drosophila for all RNAPII-dependent transcription, including at enhancers and antisense loci. This finding underscores the central importance of early elongation control in RNAPII-driven RNA production in higher eukaryotes.
Nascent RNA synthesis is a general characteristic of enhancers and superenhancers in mESCs
Our results in Drosophila suggest that Start-RNA peaks are a powerful and accurate predictor of enhancer location and activity. To extend this to a mammalian system, we tested the performance of Start-seq and TSScall in defining the enhancer landscape in mESCs. Beginning with 160 million Start-RNA reads, TSScall revealed 145,559 distinct sites of unannotated transcription initiation in addition to 15,066 TSSs of annotated genes. These TSSs could be grouped into 32,663 TSS clusters (e.g., Klf4 locus) (Fig. 5A). As anticipated, many uTSSs identified by Start-seq fell within regions previously defined as enhancers or superenhancers based on patterns of histone modifications (Hnisz et al. 2013; Whyte et al. 2013). Mapping of uTSSs within these previously established coordinates for enhancer and superenhancer loci (Hnisz et al. 2013; Whyte et al. 2013) revealed that the average mESC enhancer exhibits two uTSSs, as expected for the divergent transcription characteristic of enhancers (Arner et al. 2015). Strikingly, the average superenhancer has 14 distinct uTSSs, indicating a remarkable level of regulatory activity in these regions.
Figure 5.

uTSSs pinpoint sites of TF binding within enhancers and superenhancers. (A) Peaks of Start-RNAs near the Klf4 overlap region enriched with master regulators and characterized as a superenhancer. Start-RNAs are shown, along with a combined track of Oct4, Sox2, and Nanog TFs; Mediator; and superenhancer designations from Whyte et al. (2013). (B) The distribution of the number of uTSSs associated (by distance) with the 15,066 genes in mESCs. A subset of genes (n = 583; green) contains ≥50 associated uTSSs. (C) Example genes associated with ≥50 uTSSs (see also Supplemental Table S1). (D) Heat maps depict Start-RNAs in antisense and sense orientation, chromatin accessibility (micrococcal nuclease [MNase]), histone modifications (H3K27ac and H3K4me1), and TF occupancy (Mediator and Oct4, Sox2, and Nanog) centered around the “dominant” TSS in each cluster. n = 32,663. The dominant TSS, shown as an arrow, defines the “sense” strand. Data are rank-ordered by decreasing cluster size. (E) Composite metagene profiles around the dominant TSS of MNase-seq (MNase digestion of chromatin followed by deep sequencing) (top) and H3K27ac, Mediator, and TFs Oct4, Sox2, and Nanog (bottom). (F) Heat map representation of Start-RNAs and H3K4me1 or H3K4me3 ChIP-seq signal around uTSSs. n = 21,763. Data are rank-ordered by decreasing levels of Start-RNAs (±50 bp). (G) Ratio of H3K4me1 to H3K4me3 at uTSSs organized into quartiles by Start-RNA levels (±50 bp). Box plots show the 25th–75th percentiles, and error bars depict the 10th–90th percentiles. P-values are from Kruskal-Wallis test. See also Supplemental Figure S5.
As in Drosophila, we noticed a subset of genes that was associated with an elevated number of uTSSs (n = 583) (Fig. 5B, green). Gene ontology analysis demonstrated that these genes were enriched in TFs and chromatin modifiers and included key regulators of pluripotency and self-renewal, such as Sox2, Klf4, Esrrb, Prdm14, and MycN (Fig. 5C; Supplemental Fig. S5A). Accordingly, there was significant overlap of genes enriched in associated uTSSs and genes previously shown to be regulated by superenhancers (Whyte et al. 2013). In summary, we found that nascent Start-RNAs are a valuable readout of enhancer location and activity in a variety of cell types, with the potential to define both traditional enhancers and clusters of regulatory regions.
Enhancer TSSs pinpoint sites of master regulator binding and open chromatin
Clusters of TSSs were ranked by decreasing size and centered on the peak of transcription activity (Fig. 5D) to interrogate chromatin features and transcription regulators around these sites. Notably, MNase-seq (micrococcal nuclease [MNase] digestion of chromatin followed by deep sequencing) displays a distinct pattern around the peak of transcription within each cluster (Fig. 5D,E, top), with the dominant TSS located within a clear nucleosome-depleted region and highly positioned nucleosomes downstream. This pattern is strikingly similar to that seen around divergently transcribed protein-coding genes (Scruggs et al. 2015), suggesting that RNAPII transcription organizes chromatin at enhancers as well as promoters. Consistently, H3K27ac is enriched within TSS clusters (Fig. 5D) and peaks on the nucleosome just downstream from the dominant TSS (Fig. 5E, bottom), whereas H3K4me1 is found diffusely across TSS clusters. Interestingly, TSS positions are closely associated with peaks for lineage-specific master regulators such as Oct4, Sox2, and Nanog as well as the Mediator complex (within 200 bp) (Fig. 5D,E, bottom). Therefore, we found that precisely identifying sites of unannotated transcription greatly improves our resolution for study of chromatin architecture and TF activity within enhancers.
Our results in Drosophila suggest that the use of the histone mark H3K4me1 to identify enhancer loci could bias this process against highly active enhancers, which tend to exhibit H3K4me3 (Fig. 2J). We thus wished to address whether the most actively transcribed enhancer regions in mESCs are enriched in H3K4me3. For this analysis, we focused on TSS clusters that did not contain an mRNA TSS that could confound the results and ranked these enhancer clusters by their transcriptional activity as measured by Start-RNA levels (n = 21,763) (Fig. 5F). Remarkably, when comparing Start-RNA levels with H3K4 methylation, we found clear H3K4me3 ChIP-seq signal at the most transcriptionally active loci, in agreement with results in Drosophila. Furthermore, high ratios of H3K4me1 to H3K4me3 are found only at loci with low transcriptional activity (Fig. 5G). Given growing evidence that the level of enhancer transcription corresponds to enhancer activity, this suggests that highly active enhancers would be misannotated by current protocols involving H3K4 methylation levels.
High density of nearby enhancers facilitates pause release and robust gene activity
To confirm that RNAPII was paused at enhancers in mESCs, we plotted the 3′ ends of the Start-RNAs around uTSSs. We observed strong enrichment between +20 and +65 with respect to uTSSs (Supplemental Fig. S5B), characteristic of RNAPII pausing. We thus wished to investigate whether pausing at enhancers in mESCs participated in the strong phenotypes observed when these cells were deleted of NELF (NELF-B knockout using tamoxifen-inducible Cre recombination) (Williams et al. 2015). Our prior work had shown that loss of NELF severely blunted differentiation potential through both down-regulation of factors in key signaling cascades that direct differentiation (e.g., FGF/ERK) and a modest up-regulation of pluripotency genes. Whereas down-regulated signaling genes harbored highly paused RNAPII and the mechanisms underlying transcriptional loss could be rationalized, the mechanisms by which pluripotency genes were up-regulated by NELF knockout remained unclear. Intriguingly, these genes tend to be regulated by superenhancers (Whyte et al. 2013) and were significantly enriched in associated uTSSs (Fig. 5C).
Analysis of nascent RNA production at superenhancer- and traditional enhancer-associated genes using GRO-seq revealed the presence of paused RNAPII near promoters of both gene sets but with far more RNAPII released into bodies of superenhancer-associated genes (Fig. 6A). Correspondingly, genes associated with superenhancers or with ≥50 uTSSs were highly expressed, as observed by 4sU RNA-seq (Supplemental Fig. S6A,B). To quantify the efficiency of pause release at gene promoters, we calculated the pausing index, which is the ratio of RNAPII signal density near a promoter (−100 to +200 bp from TSS), to signal density within the gene body (+300 to +600 bp from TSS) such that higher pausing indices reflect a greater retention of promoter-paused RNAPII. Indeed, despite having considerably stronger RNAPII recruitment to promoters, superenhancer-associated genes (Fig. 6B) and those with ≥50 nearby uTSSs (Supplemental Fig. S6C) have significantly lower pausing indices than the typical gene. This implies that pause release is stimulated rapidly at these genes, presumably by high-level P-TEFb activity. We note that this finding would explain the exquisite sensitivity of superenhancer-associated genes to drugs or conditions that perturb P-TEFb: Under normal conditions, they experience very efficient P-TEFb-mediated pause release and may rely on this to maintain elevated levels of gene activity.
Figure 6.

Clusters of enhancers facilitate high-level activity and pause release. (A) Average sense strand GRO-seq signal around enhancer-associated (black; n= 4459) and superenhancer-associated (green; n = 231) genes. (B) Comparison of pausing indices among genes associated with enhancers (n = 4459) versus superenhancers (n = 231) (defined in Whyte et al. 2013). (C,D) Fold change in 4sU RNA-seq at genes associated with enhancers or superenhancers (C) and Start-RNA levels at these sites (D) upon deletion of NELF-B. Box plots show the 25th–75th percentiles, and error bars depict the 10th–90th percentiles. P-values are from Mann-Whitney test. (E) Working model. (Top) Genes associated with enhancers or small clusters of uTSSs harbor paused RNAPII. NELF stabilizes pausing at this gene group until P-TEFb is recruited such that the kinetic delay of pausing is offset by increased promoter occupancy of engaged RNAPII. (Bottom) Superenhancers/large clusters of uTSSs maintain a high local concentration of stimulatory factors, including P-TEFb, such that NELF-mediated pausing is not required—and is likely inhibitory—for expression. See also Supplemental Figure S6.
Notably, the low pausing indices and high activity observed at superenhancer-associated genes suggest that NELF-mediated pausing is extremely short-lived at these loci. We thus wondered whether they might be differentially sensitive to perturbation of NELF. We performed 4sU RNA-seq in control mESCs compared with cells where NELF-B had been deleted, as described previously (Williams et al. 2015). As in our previous work using RNA-seq, we noted up-regulation of a number of pluripotency genes, particularly those associated with superenhancers (Fig. 6C) and genes associated with ≥50 associated uTSSs (Supplemental Fig. S6D), whereas genes associated with typical enhancers showed no consistent effect. Interestingly, Start-RNA levels within superenhancers or large clusters of uTSSs were also increased upon loss of NELF (Fig. 6D; Supplemental Fig. S6E), indicating increased eRNA production across these loci when pausing is diminished. Thus, under conditions of efficient recruitment of P-TEFb and rapid stimulation of pause release, there appears to be no need for the increased stability of paused RNAPII afforded by NELF, and the imposition of the pausing checkpoint merely slows down RNA production (Fig. 6E, model).
Discussion
Here we used Start-seq, a highly sensitive method that captures nascent TSS-associated RNAs to map TSS locations and establish a clearer picture of enhancer-mediated regulation. The intersection of our data with a comprehensive set of enhancers characterized using reporter assays (Arnold et al. 2013; Zabidi et al. 2015) revealed a strong correspondence between enhancer activity and both the locations and the levels of eRNA transcription. The single-nucleotide resolution of Start-seq permits a clear characterization of DNA information content and detailed regulatory mechanisms at enhancer loci, indicating a striking conservation of early elongation control between enhancers and protein-coding genes. Importantly, our work demonstrates that the DSIF subunit Spt5 is broadly required for RNAPII activity, consistent with a universal role in both pausing and productive elongation by RNAPII. The breadth of Spt5's impact in Drosophila appears to be different from S. cerevisiae, where the absence of Spt5 caused RNAPII elongation to stall within ∼500 bp and yielded a significant increase in antisense transcription (Shetty et al. 2017).
We confirmed that transcripts generated from enhancer loci are more prone to termination than protein-coding genes (Austenaa et al. 2015). Moreover, we demonstrated that termination typically occurs within <150 nt of the eTSS, with eRNAs being targeted for rapid degradation by the exosome. Consequently, this short length and instability of eRNAs place limits on their potential roles. Importantly, our data support models in which nascent eRNAs associated with paused RNAPII participate in protein–RNA interactions in cis that can promote enhancer activity (Henriques et al. 2013; Sigova et al. 2015; Bose et al. 2017). Identifying the specific termination and degradation targeting factors involved is beyond the scope of this work; however, the diversity of sequence contexts and behaviors at noncoding loci suggests that multiple pathways would regulate transcription termination at these sites (Proudfoot 2016). For example, the pause-inducing factors NELF and DSIF can associate with the Integrator complex, and this noncanonical 3′ end processing machinery has been implicated in transcription termination at enhancers (Kim and Shiekhattar 2015).
Crucially, recent work demonstrated that the presence of H3K4me1 is not required for the generation of eRNAs (Dorighi et al. 2017; Rickels et al. 2017). Consistently, we found that the presence of H3K4me1 is a poor predictor of active enhancers, with a bias against the most active enhancer loci. In contrast, we found that nascent RNA production effectively delineates enhancer location and activity. We showed a strong correspondence between H3K4me3 methylation and enhancer transcriptional activity, in agreement with and extending prior work (Core et al. 2014).
Furthermore, we defined a significant enrichment in unannotated transcription activity near master regulators in S2 cells, fly embryos, and mESCs. We conclude that Start-seq and related assays are thus well-suited for discovery of superenhancer loci. Investigation of these regions demonstrates that pausing at superenhancers and their associated genes is more transient than at typical genes (Fig. 6A,B; Williams et al. 2015), facilitating high-level expression. This behavior suggests that P-TEFb is efficiently recruited and retained in superenhancer clusters, triggering dissociation of NELF shortly after initiation and enabling productive elongation. Consequently, these genes show no reliance on NELF to stabilize paused RNAPII and are even delayed by the pausing checkpoint, as shown by up-regulation upon loss of NELF (Williams et al. 2015). It is tempting to speculate that the local environment afforded by clusters of enhancers maintains high concentrations of TFs and the general transcription machinery without the need for RNAPII pausing. Therefore, the very nature of superenhancers, which makes them highly susceptible to inhibition of P-TEFb and pause release, renders them resistant to conditions that disrupt the process of pausing itself.
Materials and methods
Cell culture conditions, proliferation assay, and RNAi
All Drosophila S2 cell culture was conducted at 26°C using cells from the Drosophila Genomics Resource Center in M3 medium supplemented with bactopeptone, yeast extract, and 10% FBS. For all experiments, Spt5 RNAi was performed for 48 h. mESCs were derived from NELF-Bwt/wt, CreER+/−, and NELF-BFl/Fl, CreER+/− mice on a C57Bl/6 background, as per standard protocols (Williams et al. 2015). Where indicated, cells were treated with 100 nM 4OHT (Sigma) to recombine out the floxed NELF-B alleles (NELF knockout) for 5 d. mESC culture was conducted at 37°C in 5% CO2 and passaged every 2 d. mESCs were grown in 2i conditions and maintained without feeders in knockout DMEM supplemented with 15% knockout serum replacement (KOSR) (Invitrogen).
4sU RNA-seq
Newly transcribed RNA from five independent replicates of control and Spt5-depleted S2 cells or two distinct clones of control and NELF knockout mESCs grown in 2i were labeled for 10 min using 500 µM 4sU (Sigma, T4509). Separation of total RNA into newly transcribed and untagged pre-existing RNA was performed as described previously (Cleary et al. 2005). As per library preparation, RNA quality was assessed using a Bioanalyzer Nano ChIP (Agilent). Ribosomal RNA was removed prior to library construction by hybridizing to ribo depletion beads that contained biotinylated capture probes (Ribo-Zero, Epicentre). RNA was then fragmented, and libraries were prepared according to the TruSeq stranded total RNA Gold kit (Illumina) using random hexamer priming. ERCC spike-ins were used for normalization (as in Williams et al. 2015).
ChIP
For ChIP-seq, Drosophila S2 cells and mouse bone marrow-derived macrophages (BMDM) were cross-linked for 10 min with 1% formaldehyde. ChIP material was prepared independently for each cell type as described previously (Henriques et al. 2013). To ensure proper normalization between RNAPII ChIP-seq of control and Spt5-depleted cells, S2 cells and BMDM ChIP material were pooled in a 10:1 ratio (Drosophila to mice), and immunoprecipitations were carried out with anti-Rpb3 (Drosophila) and total anti-RNAPII antibody (mice; Santa Cruz Biotechnology, H-224). For the remaining ChIP-seq libraries, separate immunoprecipitations were performed with anti-cohesin (gift from D. Dorsett), anti-H3K4me1 (Millipore, 07-436), anti-H3K4me3 (Millipore, 07-473), anti-H3K27ac (Abcam, ab4729), and anti-H3K36me3 (Abcam, ab9050) antibodies. Immunoprecipitated material was purified using the Qiaquick PCR purification kit, and ChIP-seq libraries were prepared using the NEXTflex ChIP-seq kit (Bioo Scientific) according to the manufacturer's instructions.
Start-seq
For Start-seq, control and Spt5-depleted cells were grown as described above. Start-RNAs were prepared from two (Spt5-depleted) biological replicates, as described before (Nechaev et al. 2010). After nucleus isolation and quantification, samples were spiked with 15 synthetic capped RNAs into the Trizol preparation at a specific quantity per 106 cells as described previously (Henriques et al. 2013). Libraries were prepared according to the TruSeq small RNA kit (Illumina).
Annotated TSS and uTSS calling
We used TSScall for rapid annotation of TSSs in S2 cells, embryos (stage 0–16 h), and mESCs. This calling approach was based on previously described methodologies (Nechaev et al. 2010; Scruggs et al. 2015). TSScall and additional supporting instructions are available at http://github.com/lavenderca/TSScall. For further details, see the Supplemental Material.
Publically available data
A number of data sets were used throughout the study to support our results. Start-Seq, PRO-seq, GRO-seq, and mESC histone modifications were published previously (Shen et al. 2012; Henriques et al. 2013; Kwak et al. 2013; Williams et al. 2015; Krebs et al. 2017). For a complete list of Gene Expression Omnibus (GEO) accession numbers, see the Supplemental Material.
Accession Numbers
All sequencing data have been deposited in the GEO database under accession number GSE85191.
Supplementary Material
Acknowledgments
We thank A. Stark and D. Dorsett for kindly providing pSTARR-seq fly vectors and Drosophila cohesin antibody, respectively. We thank all Adelman laboratory members, with a special thanks to Emily Egan for assistance, helpful discussions, and critical reading of the manuscript. This research was supported in part by the Intramural Research Program of the National Institutes of Health, the National Institute of Environmental Health Sciences (Z01297 ES101987), and Startup Funds provided by Harvard Medical School to K.A.
Footnotes
Supplemental material is available for this article.
Article published online ahead of print. Article and publication date are online at http://www.genesdev.org/cgi/doi/10.1101/gad.309351.117.
References
- Adelman K, Lis JT. 2012. Promoter-proximal pausing of RNA polymerase II: emerging roles in metazoans. Nat Rev Genet 13: 720–731. [DOI] [PMC free article] [PubMed] [Google Scholar]
- Andersson R, Gebhard C, Miguel-Escalada I, Hoof I, Bornholdt J, Boyd M, Chen Y, Zhao X, Schmidl C, Suzuki T, et al. 2014. An atlas of active enhancers across human cell types and tissues. Nature 507: 455–461. [DOI] [PMC free article] [PubMed] [Google Scholar]
- Arner E, Daub CO, Vitting-Seerup K, Andersson R, Lilje B, Drabløs F, Lennartsson A, Rönnerblad M, Hrydziuszko O, Vitezic M, et al. 2015. Transcribed enhancers lead waves of coordinated transcription in transitioning mammalian cells. Science 347: 1010–1014. [DOI] [PMC free article] [PubMed] [Google Scholar]
- Arnold CD, Gerlach D, Stelzer C, Boryń ŁM, Rath M, Stark A. 2013. Genome-wide quantitative enhancer activity maps identified by STARR-seq. Science 339: 1074–1077. [DOI] [PubMed] [Google Scholar]
- Austenaa LMI, Barozzi I, Simonatto M, Masella S, Chiara Della G, Ghisletti S, Curina A, de Wit E, Bouwman BAM, de Pretis S, et al. 2015. Transcription of mammalian cis-regulatory elements is restrained by actively enforced early termination. Mol Cell 60: 460–474. [DOI] [PubMed] [Google Scholar]
- Bose DA, Donahue G, Reinberg D, Shiekhattar R, Bonasio R, Berger SL. 2017. RNA binding to CBP stimulates histone acetylation and transcription. Cell 168: 135–149.e22. [DOI] [PMC free article] [PubMed] [Google Scholar]
- Bradner JE, Hnisz D, Young RA. 2017. Transcriptional addiction in cancer. Cell 168: 629–643. [DOI] [PMC free article] [PubMed] [Google Scholar]
- Calo E, Wysocka J. 2013. Modification of enhancer chromatin: what, how, and why? Mol Cell 49: 825–837. [DOI] [PMC free article] [PubMed] [Google Scholar]
- Chen F, Gao X, Shilatifard A. 2015. Stably paused genes revealed through inhibition of transcription initiation by the TFIIH inhibitor triptolide. Genes Dev 29: 39–47. [DOI] [PMC free article] [PubMed] [Google Scholar]
- Cleary MD, Meiering CD, Jan E, Guymon R, Boothroyd JC. 2005. Biosynthetic labeling of RNA with uracil phosphoribosyltransferase allows cell-specific microarray analysis of mRNA synthesis and decay. Nat Biotechnol 23: 232–237. [DOI] [PubMed] [Google Scholar]
- Collis P, Antoniou M, Grosveld F. 1990. Definition of the minimal requirements within the human β-globin gene and the dominant control region for high level expression. EMBO J 9: 233–240. [DOI] [PMC free article] [PubMed] [Google Scholar]
- Core LJ, Waterfall JJ, Gilchrist DA, Fargo DC, Kwak H, Adelman K, Lis JT. 2012. Defining the status of RNA polymerase at promoters. Cell Rep 2: 1025–1035. [DOI] [PMC free article] [PubMed] [Google Scholar]
- Core LJ, Martins AL, Danko CG, Waters CT, Siepel A, Lis JT. 2014. Analysis of nascent RNA identifies a unified architecture of initiation regions at mammalian promoters and enhancers. Nat Genet 46: 1311–1320. [DOI] [PMC free article] [PubMed] [Google Scholar]
- Creyghton MP, Cheng AW, Welstead GG, Kooistra T, Carey BW, Steine EJ, Hanna J, Lodato MA, Frampton GM, Sharp PA, et al. 2010. Histone H3K27ac separates active from poised enhancers and predicts developmental state. Proc Natl Acad Sci 107: 21931–21936. [DOI] [PMC free article] [PubMed] [Google Scholar]
- Danko CG, Hyland SL, Core LJ, Martins AL, Waters CT, Lee HW, Cheung VG, Kraus WL, Lis JT, Siepel A. 2015. Identification of active transcriptional regulatory elements from GRO-seq data. Nat Methods 12: 433–438. [DOI] [PMC free article] [PubMed] [Google Scholar]
- De Santa F, Barozzi I, Mietton F, Ghisletti S, Polletti S, Tusi BK, Muller H, Ragoussis J, Wei C-L, Natoli G. 2010. A large fraction of extragenic RNA pol II transcription sites overlap enhancers. PLoS Biol 8: e1000384. [DOI] [PMC free article] [PubMed] [Google Scholar]
- Diamant G, Eisenbaum T, Leshkowitz D, Dikstein R. 2016. Analysis of subcellular RNA fractions revealed a transcription-independent effect of tumor necrosis factor α on splicing, mediated by Spt5. Mol Cell Biol 36: 1342–1353. [DOI] [PMC free article] [PubMed] [Google Scholar]
- Dorighi KM, Swigut T, Henriques T, Bhanu NV, Scruggs BS, Nady N, Still CD, Garcia BA, Adelman K, Wysocka J. 2017. Mll3 and Mll4 facilitate enhancer RNA synthesis and transcription from promoters independently of H3K4 monomethylation. Mol Cell 66: 568–576.e4. [DOI] [PMC free article] [PubMed] [Google Scholar]
- Duttke SHC, Lacadie SA, Ibrahim MM, Glass CK, Corcoran DL, Benner C, Heinz S, Kadonaga JT, Ohler U. 2015. Human promoters are intrinsically directional. Mol Cell 57: 674–684. [DOI] [PMC free article] [PubMed] [Google Scholar]
- The ENCODE Project Consortium. 2012. An integrated encyclopedia of DNA elements in the human genome. Nature 489: 57–74. [DOI] [PMC free article] [PubMed] [Google Scholar]
- Gilchrist DA, Santos dos G, Fargo DC, Xie B, Gao Y, Li L, Adelman K. 2010. Pausing of RNA polymerase II disrupts DNA-specified nucleosome organization to enable precise gene regulation. Cell 143: 540–551. [DOI] [PMC free article] [PubMed] [Google Scholar]
- Heintzman ND, Stuart RK, Hon G, Fu Y, Ching CW, Hawkins RD, Barrera LO, Van Calcar S, Qu C, Ching KA, et al. 2007. Distinct and predictive chromatin signatures of transcriptional promoters and enhancers in the human genome. Nat Genet 39: 311–318. [DOI] [PubMed] [Google Scholar]
- Hendrix DA, Hong J-W, Zeitlinger J, Rokhsar DS, Levine MS. 2008. Promoter elements associated with RNA Pol II stalling in the Drosophila embryo. Proc Natl Acad Sci 105: 7762–7767. [DOI] [PMC free article] [PubMed] [Google Scholar]
- Henriques T, Gilchrist DA, Nechaev S, Bern M, Muse GW, Burkholder A, Fargo DC, Adelman K. 2013. Stable pausing by RNA polymerase II provides an opportunity to target and integrate regulatory signals. Mol Cell 52: 517–528. [DOI] [PMC free article] [PubMed] [Google Scholar]
- Hnisz D, Abraham BJ, Lee TI, Lau A, Saint-André V, Sigova AA, Hoke HA, Young RA. 2013. Super-enhancers in the control of cell identity and disease. Cell 155: 934–947. [DOI] [PMC free article] [PubMed] [Google Scholar]
- Jonkers I, Kwak H, Lis JT. 2014. Genome-wide dynamics of Pol II elongation and its interplay with promoter proximal pausing, chromatin, and exons. Elife 3: e02407. [DOI] [PMC free article] [PubMed] [Google Scholar]
- Kaneko S, Son J, Bonasio R, Shen SS, Reinberg D. 2014. Nascent RNA interaction keeps PRC2 activity poised and in check. Genes Dev 28: 1983–1988. [DOI] [PMC free article] [PubMed] [Google Scholar]
- Kim T-K, Shiekhattar R. 2015. Architectural and functional commonalities between enhancers and promoters. Cell 162: 948–959. [DOI] [PMC free article] [PubMed] [Google Scholar]
- Kim T-K, Hemberg M, Gray JM, Costa AM, Bear DM, Wu J, Harmin DA, Laptewicz M, Barbara-Haley K, Kuersten S, et al. 2010. Widespread transcription at neuronal activity-regulated enhancers. Nature 465: 182–187. [DOI] [PMC free article] [PubMed] [Google Scholar]
- Komori T, Inukai N, Yamada T, Yamaguchi Y, Handa H. 2009. Role of human transcription elongation factor DSIF in the suppression of senescence and apoptosis. Genes Cells 14: 343–354. [DOI] [PubMed] [Google Scholar]
- Krebs AR, Imanci D, Hoerner L, Gaidatzis D, Burger L, Schübeler D. 2017. Genome-wide single-molecule footprinting reveals high RNA polymerase II turnover at paused promoters. Mol Cell 67: 411–422.e4. [DOI] [PMC free article] [PubMed] [Google Scholar]
- Krishnan K, Salomonis N, Guo S. 2008. Identification of Spt5 target genes in zebrafish development reveals its dual activity in vivo. PLoS ONE 3: e3621. [DOI] [PMC free article] [PubMed] [Google Scholar]
- Kwak H, Fuda NJ, Core LJ, Lis JT. 2013. Precise maps of RNA polymerase reveal how promoters direct initiation and pausing. Science 339: 950–953. [DOI] [PMC free article] [PubMed] [Google Scholar]
- Kwasnieski JC, Fiore C, Chaudhari HG, Cohen BA. 2014. High-throughput functional testing of ENCODE segmentation predictions. Genome Res 24: 1595–1602. [DOI] [PMC free article] [PubMed] [Google Scholar]
- Lavender CA, Shapiro AJ, Burkholder AB, Bennett BD, Adelman K, Fargo DC. 2017. ORIO (Online Resource for Integrative Omics): a Web-based platform for rapid integration of next generation sequencing data. Nucleic Acids Res 45: 5678–5690. [DOI] [PMC free article] [PubMed] [Google Scholar]
- Levine M. 2010. Transcriptional enhancers in animal development and evolution. Curr Biol 20: R754–R763. [DOI] [PMC free article] [PubMed] [Google Scholar]
- Nechaev S, Fargo DC, Santos dos G, Liu L, Gao Y, Adelman K. 2010. Global analysis of short RNAs reveals widespread promoter-proximal stalling and arrest of Pol II in Drosophila. Science 327: 335–338. [DOI] [PMC free article] [PubMed] [Google Scholar]
- Peterlin BM, Price DH. 2006. Controlling the elongation phase of transcription with P-TEFb. Mol Cell 23: 297–305. [DOI] [PubMed] [Google Scholar]
- Proudfoot NJ. 2016. Transcriptional termination in mammals: stopping the RNA polymerase II juggernaut. Science 352: aad9926. [DOI] [PMC free article] [PubMed] [Google Scholar]
- Rada-Iglesias A, Bajpai R, Swigut T, Brugmann SA, Flynn RA, Wysocka J. 2011. A unique chromatin signature uncovers early developmental enhancers in humans. Nature 470: 279–283. [DOI] [PMC free article] [PubMed] [Google Scholar]
- Rickels R, Herz H-M, Sze CC, Cao K, Morgan MA, Collings CK, Gause M, Takahashi Y-H, Wang L, Rendleman EJ, et al. 2017. Histone H3K4 monomethylation catalyzed by Trr and mammalian COMPASS-like proteins at enhancers is dispensable for development and viability. Nat Genet 156: 645. [DOI] [PMC free article] [PubMed] [Google Scholar]
- Schaukowitch K, Joo J-Y, Liu X, Watts JK, Martinez C, Kim T-K. 2014. Enhancer RNA facilitates NELF release from immediate early genes. Mol Cell 56: 29–42. [DOI] [PMC free article] [PubMed] [Google Scholar]
- Scruggs BS, Gilchrist DA, Nechaev S, Muse GW, Burkholder A, Fargo DC, Adelman K. 2015. Bidirectional transcription arises from two distinct hubs of transcription factor binding and active chromatin. Mol Cell 58: 1101–1112. [DOI] [PMC free article] [PubMed] [Google Scholar]
- Shao W, Zeitlinger J. 2017. Paused RNA polymerase II inhibits new transcriptional initiation. Nat Genet 49: 1045–1051. [DOI] [PubMed] [Google Scholar]
- Shen Y, Yue F, McCleary DF, Ye Z, Edsall L, Kuan S, Wagner U, Dixon J, Lee L, Lobanenkov VV, et al. 2012. A map of the cis-regulatory sequences in the mouse genome. Nature 488: 116–120. [DOI] [PMC free article] [PubMed] [Google Scholar]
- Shetty A, Kallgren SP, Demel C, Maier KC, Spatt D, Alver BH, Cramer P, Park PJ, Winston F. 2017. Spt5 plays vital roles in the control of sense and antisense transcription elongation. Mol Cell 66: 77–88.e5. [DOI] [PMC free article] [PubMed] [Google Scholar]
- Shlyueva D, Stampfel G, Stark A. 2014. Transcriptional enhancers: from properties to genome-wide predictions. Nat Rev Genet 15: 272–286. [DOI] [PubMed] [Google Scholar]
- Sigova AA, Abraham BJ, Ji X, Molinie B, Hannett NM, Guo YE, Jangi M, Giallourakis CC, Sharp PA, Young RA. 2015. Transcription factor trapping by RNA in gene regulatory elements. Science 350: 978–981. [DOI] [PMC free article] [PubMed] [Google Scholar]
- Smith E, Shilatifard A. 2014. Enhancer biology and enhanceropathies. Nat Struct Mol Biol 21: 210–219. [DOI] [PubMed] [Google Scholar]
- Soares LM, Radman-Livaja M, Lin SG, Rando OJ, Buratowski S. 2014. Feedback control of Set1 protein levels is important for proper H3K4 methylation patterns. Cell Rep 6: 961–972. [DOI] [PMC free article] [PubMed] [Google Scholar]
- Visel A, Blow MJ, Li Z, Zhang T, Akiyama JA, Holt A, Plajzer-Frick I, Shoukry M, Wright C, Chen F, et al. 2009. ChIP-seq accurately predicts tissue-specific activity of enhancers. Nature 457: 854–858. [DOI] [PMC free article] [PubMed] [Google Scholar]
- Vispé S, DeVries L, Créancier L, Besse J, Bréand S, Hobson DJ, Svejstrup JQ, Annereau J-P, Cussac D, Dumontet C, et al. 2009. Triptolide is an inhibitor of RNA polymerase I and II-dependent transcription leading predominantly to down-regulation of short-lived mRNA. Mol Cancer Ther 8: 2780–2790. [DOI] [PubMed] [Google Scholar]
- Vo Ngoc L, Wang Y-L, Kassavetis GA, Kadonaga JT. 2017. The punctilious RNA polymerase II core promoter. Genes Dev 31: 1289–1301. [DOI] [PMC free article] [PubMed] [Google Scholar]
- Whyte WA, Orlando DA, Hnisz D, Abraham BJ, Lin CY, Kagey MH, Rahl PB, Lee TI, Young RA. 2013. Master transcription factors and mediator establish super-enhancers at key cell identity genes. Cell 153: 307–319. [DOI] [PMC free article] [PubMed] [Google Scholar]
- Williams LH, Fromm G, Gokey NG, Henriques T, Muse GW, Burkholder A, Fargo DC, Hu G, Adelman K. 2015. Pausing of RNA polymerase II regulates mammalian developmental potential through control of signaling networks. Mol Cell 58: 311–322. [DOI] [PMC free article] [PubMed] [Google Scholar]
- Wu X, Sharp PA. 2013. Divergent transcription: a driving force for new gene origination? Cell 155: 990–996. [DOI] [PMC free article] [PubMed] [Google Scholar]
- Zabidi MA, Arnold CD, Schernhuber K, Pagani M, Rath M, Frank O, Stark A. 2015. Enhancer-core-promoter specificity separates developmental and housekeeping gene regulation. Nature 518: 556–559. [DOI] [PMC free article] [PubMed] [Google Scholar]
Associated Data
This section collects any data citations, data availability statements, or supplementary materials included in this article.