

Abstract
Motivation
A large number of distal enhancers and proximal promoters form enhancer–promoter interactions to regulate target genes in the human genome. Although recent high-throughput genome-wide mapping approaches have allowed us to more comprehensively recognize potential enhancer–promoter interactions, it is still largely unknown whether sequence-based features alone are sufficient to predict such interactions.
Results
Here, we develop a new computational method (named PEP) to predict enhancer–promoter interactions based on sequence-based features only, when the locations of putative enhancers and promoters in a particular cell type are given. The two modules in PEP (PEP-Motif and PEP-Word) use different but complementary feature extraction strategies to exploit sequence-based information. The results across six different cell types demonstrate that our method is effective in predicting enhancer–promoter interactions as compared to the state-of-the-art methods that use functional genomic signals. Our work demonstrates that sequence-based features alone can reliably predict enhancer–promoter interactions genome-wide, which could potentially facilitate the discovery of important sequence determinants for long-range gene regulation.
Availability and Implementation
The source code of PEP is available at: https://github.com/ma-compbio/PEP.
Supplementary information
Supplementary data are available at Bioinformatics online.
1 Introduction
High-throughput whole-genome mapping technologies such as Hi-C (Lieberman-Aiden et al., 2009) and ChIA-PET (Tang et al., 2015) have provided us with new opportunities to study genome-wide chromatin interactions. In particular, these methods have allowed us to identify enhancer–promoter interactions (EPIs) at much more refined resolution. In mammalian and vertebrate genomes, gene promoters and distal regulatory enhancers may be millions of base-pairs away from each other; and an enhancer oftentimes does not regulate its closest gene (Zhang et al., 2013; Dixon et al., 2015). Studies using global chromatin interaction data based on Hi-C and ChIA-PET have shown that a large fraction of enhancers form long-range EPIs to regulate genes far away in the genome (Sanyal et al., 2012; Li et al., 2012). However, the general principles at the sequence level underlying such long-range EPIs remain largely elusive.
In this paper, our goal is to reveal whether there are sequence-based features within enhancer elements and promoter elements that are strongly predictive for EPIs. It is generally unclear whether, and to what extent, the information encoded in the genome sequence contains important potential instructions for forming EPIs. There are recent computational methods in predicting EPIs based on functional genomic features, in particular, RIPPLE (Roy et al., 2015) and TargetFinder (Whalen et al., 2016). In both methods, many functional genomic datasets were used, including DNase-seq, histone marks, transcription factor (TF) ChIP-seq and gene expression. In addition, TargetFinder also used CAGE and DNA methylation data. The general approach of using functional genomic signals as features for the machine learning classifier in both RIPPLE and TargetFinder is similar. From these studies, we now know that signals from aforementioned functional genomic data are informative to computationally distinguish EPIs from non-interacting enhancer–promoter pairs. However, it is still unknown whether the information in genome sequences within enhancers and promoters is sufficient to distinguish EPIs. In this paper, we aim to answer the following question: if we are only given the locations of putative enhancers and promoters in a particular cell type, can we train a predictive model for that cell type to identify EPIs directly from the genomic sequences without using any functional genomic signals? Note that our main goal of this work is to build a predictive model for individual cell type to assess if sequence features are sufficient for EPI predictions.
An overview of our method is shown in Figure 1. We developed an algorithm based on a boosted tree ensemble model to predict long-range EPIs by incorporating two strategies for extracting features directly from the DNA sequences of enhancer and promoter elements. We call our algorithm PEP (Predicting Enhancer–Promoter interactions) with two modules, PEP-Motif and PEP-Word, which use different feature extraction approaches. In PEP-Motif, we search for patterns of known transcription factor binding site (TFBS) motifs in the sequences involved in EPI. The normalized occurrence frequencies of these TFBS motifs are then used as features representing an enhancer or a promoter. In PEP-Word, we use the word embedding model (Mikolov et al., 2013a, 2013b) to directly embed the sequences of enhancer and promoter regions into a new feature space. Each sequence is then represented by a continuous feature vector. In both PEP-Motif and PEP-Word modules, we concatenate the individual feature vectors to form feature representations of any given enhancer–promoter pair. If the paired regions have identified interactions based on Hi-C data, the pair is labeled as a positive sample; otherwise, it is labeled as a negative sample. We then developed a predictive model based on an ensemble learning method—Gradient Tree Boosting (GTB) (Friedman, 2001). We evaluated the performance of our method and compared with TargetFinder (Whalen et al., 2016) as well as RIPPLE (Roy et al., 2015). In six different cell lines, we show that PEP (both modules) achieved competitive results as compared to the state-of-the-art methods that use non-sequence features from functional genomic signals. Overall, our results suggest that, without relying on information from functional genomic signals, sequence-based features alone are effective in predicting EPIs in a specific cell type, if we are given the locations of putative enhancers and promoters in that cell type. We believe that our new method has the potential to become a generic model to allow us to elucidate sequence-based instructions that determine long-range gene regulation.
Fig. 1.
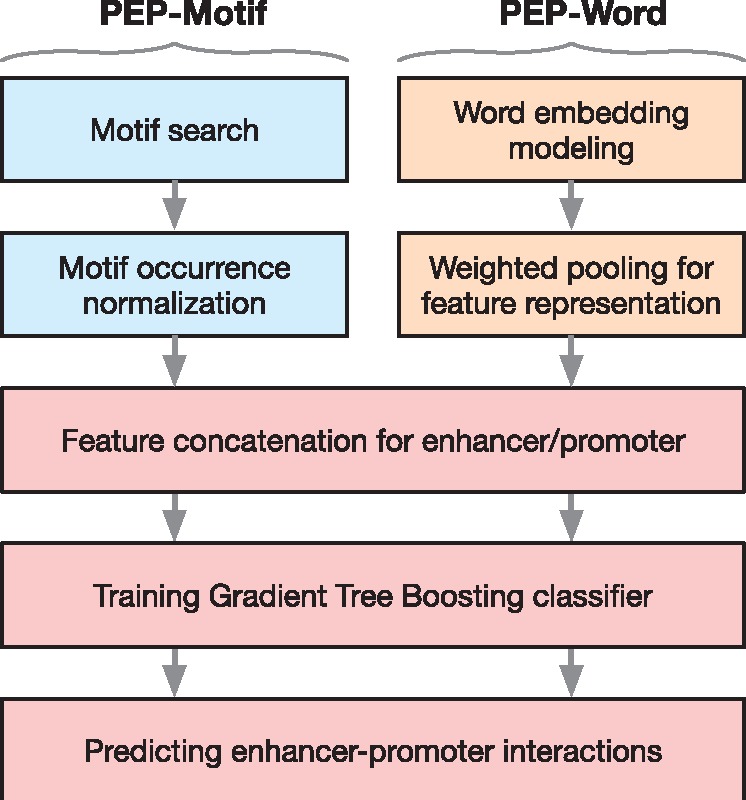
Method overview of PEP
2 Results
2.1 Predicting EPIs using features based on TFBS motifs
We first evaluated the performance of PEP-Motif on the E/P (Enhancer/Promoter) datasets (see Methods section) in six cell lines (GM12878, K562, IMR90, HeLa-S3, HUVEC and NHEK), as compared to TargetFinder (Whalen et al., 2016) based on its E/P/W performance (i.e. functional genomic signals from enhancer, promoter and the window between them) on the same datasets. Results are shown in Figure 2 and Supplementary Table S3, where we also include results from PEP-Word and PEP-Integrate (discussed in the following sections). Different metrics including AUROC (Area Under the Receiver Operating Characteristic curve), AUPR (Area Under the Precision-Recall curve), Precision, Recall, F1 score and MCC were used to evaluate the predictions (see Supplementary Methods A.8) based on 10-fold cross validation. Due to class imbalance in our data (>95% of samples are negative), AUPR, F1 score and MCC are more appropriate performance measures than AUROC (Davis and Goadrich, 2006), though we include the latter for completeness.
Fig. 2.

Evaluation of PEP-Motif, PEP-Word and PEP-Integrate (K = 6 for K-mers) on E/P data from six cell lines in comparison with TargetFinder (E/P/W) in terms of AUROC, AUPR, Precision, Recall, F1 and MCC
Our results show that PEP-Motif reaches comparable performance as compared to TargetFinder (E/P/W) on average, and achieves improvement in certain cell types. The average AUPR achieved by PEP-Motif across six cell lines is 0.84, similar to that of TargetFinder (E/P/W) (0.86). We found that PEP-Motif outperforms TargetFinder (E/P/W) with higher AUPR, F1 score, MCC, Precision and Recall in GM12878, which has the largest sample size. PEP-Motif also performs competitively as compared to TargetFinder (E/P/W) in IMR90, reaching higher F1 score, MCC, Recall and similar Precision. In K562, NHEK, and HUVEC, TargetFinder performs better than PEP-Motif. Overall, the performance of each method varies across different cell lines. However, on average the performance of PEP-Motif is comparable to TargetFinder (E/P/W) (Fig. 2). This suggests that using sequence features based on TF motifs alone can achieve competitive results as compared to TargetFinder which uses a large number of features of functional genomic signals. We then asked if we can use a subset of the features to achieve similar performance. Motif features were selected in PEP-Motif based on importance ranking to reduce the feature dimension while maintaining prediction performance (Supplementary Fig. S1). The feature importance was estimated by the GTB model and features were ranked accordingly (see Methods). We observed that AUPR initially increases quickly as top-ranking features are being added. The performance improvement then slows dramatically, approaching saturation when the number of features exceeds around 100, which is <8% of all the features (1280 in total). This suggests that most of the prediction strength of PEP-Motif can be captured by a small subset of important features.
2.2 Predicting EPIs using features based on word embedding model
We evaluated PEP-Word using the same datasets from the six cell lines as compared to TargetFinder (E/P/W) (Fig. 2 and Supplementary Table S3). The average AUPR achieved by PEP-Word across six cell lines is 0.85, similar to that of TargetFinder (E/P/W) (0.86). The most significant overall improvement was observed in IMR90. PEP-Word achieves AUPR, Precision, Recall, F1 score and MCC of 0.84, 0.90, 0.75, 0.82 and 0.81 in IMR90, respectively, each of which is increased from that of TargetFinder (E/P/W) (0.82, 0.85, 0.73, 0.78 and 0.78, respectively). We then compared PEP-Word with PEP-Motif (Supplementary Table S3). We found that on average PEP-Word can achieve better performance as compared to PEP-Motif. PEP-Word outperforms PEP-Motif in three out of the six cell lines (HUVEC, IMR90 and NHEK) with about 2–3% improvement on AUPR, Precision, F1 score and MCC. In particular, in NHEK, where PEP-Motif is not competitive to TargetFinder (E/P/W), PEP-Word achieves 0.90 AUPR and 0.92 Precision, reaching comparable level with TargetFinder (E/P/W), along with around 2.5% increase for Recall, F1 score and MCC as compared to PEP-Motif. PEP-Motif performs slightly better in HeLa-S3. The two modules achieve similar performance in GM12878 and K562. These results suggest that PEP-Word can achieve competitive performance as compared to TargetFinder (E/P/W) using only sequence features based on word embedding, without even relying on known TF binding motif models. In addition, PEP-Word generally shows some improvement over PEP-Motif, although these two PEP models seem to have different advantages in different cell lines.
2.3 Integrating features from PEP-Motif and PEP-Word to predict EPIs
To test if we can further improve the prediction by integrating PEP-Motif and PEP-Word, we formed a combination of important features from both modules. We call the result ‘PEP-Integrate’ features (Supplementary Methods A.5). We used the top 300 important TF motif features from PEP-Motif to concatenate with the PEP-Word feature vector, followed by retraining of the GTB model and evaluation (results in Fig. 2 and Supplementary Table S3). Here, the number of motif features to select for integration is evaluated by sequentially increasing the feature selection set (Supplementary Fig. S2).
In general, PEP-Integrate achieves higher performance as compared to PEP-Word and PEP-Motif individually. We also found that overall PEP-Integrate is more competitive now as compared to TargetFinder (E/P/W). The largest improvement was observed in IMR90. PEP-Integrate achieves AUPR, F1 score and MCC of 0.85, 0.84 and 0.83, respectively, in IMR90, which are 3–5% higher than those from TargetFinder (E/P/W) (AUPR: 0.82, F1 score: 0.78, MCC: 0.78). PEP-Integrate also reaches higher Precision than TargetFinder (E/P/W) in five of the six cell lines (GM12878, K562, HeLa-S3, IMR90 and NHEK), with improvement ranging from 2% to 8%. These results demonstrate that the integration of the features from PEP-Motif and PEP-Word can lead to overall more accurate EPI predictions.
2.4 Additional comparison with TargetFinder and RIPPLE using EE/P datasets
We further tested PEP-Integrate, PEP-Word and PEP-Motif on the EE/P (Extended Enhancer/Promoter) datasets (results shown in Supplementary Fig. S3 and Table S4; see Methods section for the description of EE/P data). The EE/P data were used in Whalen et al. (2016) for training and evaluating the model utilizing extended enhancer and promoter regions [TargetFinder (EE/P)]. Note that the extended enhancers are similar in length (∼6 kb) to the enhancers (∼5 kb) used by RIPPLE (Roy et al., 2015). Therefore, RIPPLE was also applied to EE/P data for performance comparisons (Supplementary Methods A.9).
Our results show that PEP-Integrate outperforms TargetFinder (EE/P) with higher AUPR on five of the six cell lines (Supplementary Table S4). PEP-Integrate also achieves higher F1 score and MCC in three (GM12878, HUVEC and NHEK) and four (GM12878, IMR90, HUVEC and NHEK) cell lines, respectively. PEP-Motif and PEP-Word both achieve the same average of AUPR as TargetFinder (EE/P) across the six cell lines, which is 0.85, but show different advantages. PEP-Motif outperforms TargetFinder (EE/P) in GM12878, HeLa-S3 and HUVEC on AUPR, while PEP-Word achieves higher AUPR than TargetFinder (EE/P) in HeLa-S3, HUVEC and NHEK. Additionally, PEP-Motif, PEP-Word and PEP-Integrate outperform RIPPLE in all six cell lines on almost all metrics.
2.5 Important TFBS motif-based features discovered by PEP-Motif
To assess the contribution of features in PEP-Motif, we ranked the motif features according to their importance estimated by GTB. We categorized the motif features into different importance levels based on quantiles spaced at 5% of the feature importance distribution in each cell line. For instance, motif features ranked top 5% are considered as the most important. Each motif corresponds to two motif features (enhancer-associated or promoter-associated). The top 5% important features are thus taken from the union of enhancer and promoter features. We observed that top-ranked motif features are mostly cell-type specific. Specifically, 135 motif features in enhancers and 38 motif features in promoters are ranked top 5% in importance in one cell line. However, some of these cell-type specific important motifs share highly similar Position Weight Matrices (PWMs) and can be grouped. Utilizing motif similarities we developed a motif clustering approach (Supplementary Methods A.2), which resulted in 503 motif representatives, including 427 single motifs and 76 small size clusters (each with 2–4 motifs). A motif representative denotes a single motif or a motif cluster.
We next assessed motif feature importance at the level of motif representatives to have more robust evaluation of cell-type specific important features. For every motif cluster in each cell line, the highest feature importance of the member motifs is selected to represent importance of the associated motif cluster. We found 139 motif representatives in enhancers and 48 in promoters, respectively, that have top 5% feature importance in at least one cell line. Among these most predictive features, we discovered 98 motif representatives in enhancers and 26 in promoters that have top 5% importance in only one cell line. For more stringent discrimination of the cell-type specificity of these motif representatives, we further examined feature importance of motifs close to them in the constructed similarity graph. For each member of a motif representative, we searched for all motifs within distance of 2. If none of such neighboring motifs has top 5% feature importance in other cell lines, the examined motif representative is regarded as cell-type specific. Using this approach, we found 79 cell-type specific top 5% important motif representatives in enhancers and 17 in promoters (Supplementary Tables S5 and S6).
In addition to cell-type specific ones, some motif representatives are recognized by multiple cell lines as highly predictive. We found that 62 top 5% predictive motif representatives in enhancers and 29 in promoters are shared by at least two cell lines. Moreover, 31 motif representatives in enhancers and eight in promoters rank top 10% in at least four of the six cell lines. We also noticed that some cell-type specific top 5% important motif features have predictive effect in other cell lines, though at lower importance levels, which can be observed from Figure 3.
Fig. 3.

Estimated feature importance of motifs in PEP-Motif that have top 5% importance in at least one cell line. The feature importance is scaled between 0 (low importance) and 1 (high importance). Of the 503 motif representatives (427 single motifs and 76 motif clusters) found by PEP-Motif, 139 in enhancers and 48 in promoters have top 5% feature importance in at least one cell line. Here we display the top 100 of 139 predictive motif representatives in enhancers and all 48 predictive motif representatives in promoters. Each motif is represented by the name of its corresponding TF. If a TF has multiple associated motifs, alternative motifs are marked according to their identities in the database [e.g. EHF(S) denotes a single site motif of EHF (Kulakovskiy et al., 2016)]. If a motif represents a motif cluster, names of all the member motifs are shown in combination. We performed hierarchical clustering on both motifs (rows of the feature importance matrix) and cell types (columns) to have the motif features grouped. A cell is highlighted with white border if the corresponding motif has top 5% feature importance in the respective cell type
TFs associated with predictive motifs or motif representatives may belong to a TF family. We found that some TF families are enriched with highly predictive TFs. FOX, STAT, TEAD, IRF, SOX, SPI, E2F, ERR, ETS and SP/KLF are among those families. For example, motifs of FOXA1, FOXO3, FOXG1, FOXH1, FOXO1 and FOXO4 each have top 5% feature importance but in different cell lines. All are from the FOX family, which is featured by a conserved DNA-binding domain and important in regulating cell growth. Overall, PEP-Motif systematically estimated predictive power of all TFBS motifs for EPIs from one of the most complete and up-to-date motif databases. Results in six cell lines reveal either cell-type specific or more ubiquitous feature importance of different TF motifs.
2.6 Estimated important TFBS motifs are consistent with existing studies
Based on feature importance estimation for motif based features from PEP-Motif, we found that the highly predictive motif features are generally quite consistent with existing studies. For example, we found that the CTCF motif in enhancer regions (extended with flanking regions) is among the top 5% most important features across all of the six cell lines, reflecting the fact that CTCF is a key player in mediating chromatin loops (Ong and Corces, 2014; Bonev and Cavalli, 2016). In addition, ZNF143 has been identified by recent studies as a chromatin-looping factor with sequence specificity dependency at promoters (Bailey et al., 2015), where ZNF143 binds directly to promoters and contributes to chromatin interactions connecting promoters to distal regulatory elements. Other studies have strongly implicated that ZNF143 partners with CTCF in establishing the conserved chromatin structure by cooperating with cohesin (Ye et al., 2016). The results of PEP-Motif demonstrated that ZNF143 motif in promoters ranks top 30% in estimated feature importance across four cell lines (GM12878, K562, HeLa-S3 and NHEK), with much higher feature importance than ZNF143’s importance in enhancers, supporting that it functions mainly through promoters.
The important TF motifs estimated by PEP-Motif (which uses sequence features only) are also quite consistent with the results from TargetFinder (where functional genomic signals including many TF ChIP-seq data were used). TargetFinder has 209 types of functional genomic features in total across all cell lines for a single region (enhancer/window/promoter), of which 162 are TF ChIP-seq signals. However, not all the TFs used by TargetFinder (E/P/W) with ChIP-seq data have binding site models in HOCOMOCO Human v10 motif database (Kulakovskiy et al., 2016) used by PEP-Motif. We therefore focused on the TFs shared by both methods to have a fair comparison. Similar to the feature ranking approach used in PEP-Motif, we categorized all the features in TargetFinder (E/P/W) into different importance levels based on quantiles spaced at 5% of the feature importance distribution estimated in (Whalen et al., 2016). We found that there are 60, 59, 29, 7, 6 and 1 comparable TFs (i.e. shared between TargetFinder and PEP-Motif) in GM12878, K562, HeLa-S3, IMR90, HUVEC and NHEK, respectively, mainly because GM12878, K562 and HeLa-S3 cell lines have more available functional genomic features than the other three cell lines. Recall that TFs in enhancer/window regions and those in promoter regions are considered distinct features. For enhancer/window, on average more than 95% of the comparable TFs with medium or high feature importance (ranked top 50%) in TargetFinder (E/P/W) are also at top 50% importance level estimated by PEP-Motif (Supplementary Table S7). At the high importance level, there are 21, 27 and 12 TFs estimated as top 25% in importance by both methods in GM12878, K562 and HeLa-S3, respectively (Supplementary Table S8). Among the TFs identified by both methods as important features, ZNF384, TBP, RUNX3, SPI1, SP1, CEBPB, SRF, JUND and MAX may have received less attention on their functions in mediating EPIs, as pointed out in TargetFinder (Whalen et al., 2016). In PEP-Motif, motifs for these TFs in enhancers were all estimated as top 30% most important in multiple cell lines. We also identified common promoter-associated important TFs for the two methods (Supplementary Table S9).
We next explored the interacting enhancer-associated motif features and promoter-associated motif features (E-P feature interactions), utilizing the feature combination structures learned by the decision trees of the GTB model. As an ensemble of decision trees, the GTB model is able to learn high order of feature interactions (Friedman, 2001, 2002). We utilized the method XGBFIR (Kostenko, 2016) to analyze the GTB model in PEP-Motif and extracted predictive feature interactions in each cell type. Results are shown in Supplementary Table S10 and Figures S8–S10. We found that existing studies support some of our predicted feature interactions. For examples, the interaction between CTCF in enhancer region and CTCF in promoter region has been identified as important feature interaction across multiple cell lines (Supplementary Table S10), which reflects the role of CTCF in mediating chromatin loops (Ong and Corces, 2014; Bonev and Cavalli, 2016). Additionally, we found many other TF motif features involved in predictive feature interactions, although the overall significance of these pairs have yet to be determined (Supplementary Table S10 and Fig. S8–S10). Nevertheless, the feature interactions detected from our model can be used to further study more complicated combinations of TFs in mediating EPI.
2.7 Potentially important TFs identified only by PEP-Motif
PEP-Motif also identified potentially important TF motif features that may play key role in mediating EPIs but were not studied by TargetFinder due to data unavailability. To mitigate variance due to small training sample size in a single cell line, we considered only features found to be important in at least two cell lines at specified feature importance levels. With all the TF features used by both TargetFinder and PEP-Motif in any of the six cell lines excluded, we discovered 24 enhancer-associated TFs and six promoter associated TFs that have top 5% feature importance in at least two cell lines (Table 1). There are six enhancer-associated TFs that have top 10% feature importance in at least four cell lines, including ANDR (clustered with GCR and PRGR in the motif similarity graph), EGR3, EHF, ETV5, HAND1 and ZSC16. In particular, EHF is ranked top 25% in HeLa-S3 and top 5% in the other five cell lines. Among the highly predictive promoter-associated TFs, MNT (clustered with SPIC) is ranked top 5% in three cell lines (GM12878, K562 and HeLa-S3). HOXD8 (clustered with POU5F1B, POU2F2 and POU3F3) and KLF4 (clustered with KLF1 and KLF3) are both ranked top 15% in five cell lines. There is experimental evidence from existing research regarding the functions of some of these TFs. For example, recent studies showed that KLF4 plays an important role in organizing long-range chromatin interactions with POU5F1 (OCT4) by recruiting cohesin to POU5F1 enhancer (Wei et al., 2013). In addition, it was reported that POU2F2 can interact with ANDR, PRGR and GCR (also named AR, PGR and NR3C1) (Préfontaine et al., 1999), consistent with the estimated importance of these TFs by PEP-Motif in forming EPIs. Although the exact functions of these TFs in forming EPIs have yet to be further investigated, our results suggest that PEP-Motif can identify potentially important TF motifs based on known PWMs without using ChIP-seq data, further highlighting its ability to discover key sequence features that may be involved in mediating EPIs.
Table 1.
Important TF motifs discovered by PEP-Motif (but not by TargetFinder) to be of top 5% feature importance in at least two cell lines (the upper part) and those of top 10% feature importance in at least three cell lines (the lower part)
| Cell lines | Potential novel predictive TF of top 5% importance (in PEP-Motif but not in TargetFinder) |
|---|---|
| 2 (E) | (PRGR, ANDR, GCR), BHE23, (TBX4,TBR1,TBX21), |
| CEBPE, EGR3, ENOA,(EVX1, FOXG1,FOXL1), FOXO1, | |
| HAND1, HBP1, HOXA1, MCR, (NFAT5,NFAC3), STAT6, | |
| (NR1I2, NR1I3), RHXF1, SMAD3, SOX10, SOX4, | |
| BRAC, TEAD3, ZNF713 | |
| 3 (E) | EHF, ZSC16 |
| 2 (P) | AP2D, (KLF4, KLF1,KLF3), NKX32, PLAG1 |
| 3 (P) | (HOXD8, POU5F1B, POU2F2, POU3F3), (MNT,SPIC) |
| Cell lines | Potential novel predictive TF of top 10% importance (in PEP-Motif but not in TargetFinder) |
|---|---|
| 3 (E) | BHE23, ERR2, ENOA, EOMES, FEV, GCM1, |
| (HSF1, HSF2, HOXB2, HSF4), HOXA1, (KLF3, KLF1, KLF4), | |
| MCR, MITF, MYOD1, (RORG, RORA, NR1D1), | |
| (NR1I2, NR1I3), SMAD3, TEAD3, TF7L2, ZBT18, ZNF713 | |
| 4 (E) | (ANDR, PRGR, GCR), EGR3, ETV5, HAND1, ZSC16 |
| 5 (E) | EHF |
| 3 (P) | (HOXD8, POU5F1B, POU2F2, POU3F3), PLAG1 |
| 4 (P) | (KLF4, KLF1, KLF3), (MNT, SPIC) |
Note: Each TF is represented by one or multiple motifs. If the corresponding motif is associated with a motif cluster, all members of the cluster are displayed and the motif reaching the specified importance level is in italic. ‘E’ represents enhancer regions and ‘P’ represents promoter regions. The row name represents the exact number of cell lines where the motif reaches the specified importance level, e.g. ‘2 (E)’ denotes that the feature in the enhancer region has top 5% importance in exactly two cell lines.
2.8 PEP-Word features are informative in identifying EPIs
Different from PEP-Motif, PEP-Word uses word embedding model to directly embed sequences into a numerical feature space, without utilizing information of TF binding motif models. Therefore, the extracted features are abstract and not limited to explicit association with certain TFBS. We then assessed whether these features are informative for discriminating between EPIs and non-EPIs.
We used t-Distributed Stochastic Neighbor Embedding (t-SNE) (Van Der Maaten, 2014) to visualize the feature vectors of randomly selected positive samples (EPI) and negative samples (non-EPI) (Supplementary Fig. S6). The n dimensional (n = 600) features were reduced to two dimensions. We found that the positive samples and negative samples exhibit visibly different distributions in the two-dimensional space, even though dimension reduction for visualization causes some information loss of discriminative features. We further examined the distribution of positive and negative samples on the original dimensions of the embedded feature space (Supplementary Fig. S7) and found that the features are quite different between the two classes. The results suggest that EPIs and non-EPIs are distributed differently in the new feature space constructed from the word embedding model of PEP-Word. Therefore, PEP-Word is shown to be effective in feature representation of EPIs using only DNA sequences.
3 Methods
3.1 Datasets
In this work we used the same datasets in TargetFinder (Whalen et al., 2016), which include enhancer–promoter interaction data in six cell lines (GM12878, K562, IMR90, HeLa-S3, HUVEC and NHEK). The dataset of each cell line has cell-line specific annotations of putative enhancers and promoters as well as interacting and non-interacting enhancer–promoter pairs. Active enhancers and promoters in each cell line were identified using annotations from the ENCODE Project (ENCODE Project Consortium et al., 2012) and the Roadmap Epigenomics Project (Kundaje et al., 2015). The Hi-C data (Rao et al., 2014) were used to annotate EPIs in (Whalen et al., 2016). For each positive sample, 20 negative samples were sampled, following the same constraint of distance between the positive pairs (Whalen et al., 2016). Thus, the negative sample size is 20 times of the positive sample size on each cell line. The distance between the paired enhancer and promoter in the datasets ranges from 10 kb to 2 Mb.
In our performance evaluation, we used both E/P (Enhancer/Promoter) data and EE/P (Extended Enhancer/Promoter) data defined in Whalen et al. (2016) for the six cell lines. In EE/P data, an extended enhancer is defined as an enhancer with 3 kb flanking regions on both sides (Whalen et al., 2016) and interactions are identified on basis of extended enhancers and promoters. The numbers of interacting and non-interacting enhancer–promoter pairs in each of the six cell line datasets are given in Supplementary Tables S1 and S2.
3.2 Classification using gradient tree boosting model
In PEP, we use Gradient Tree Boosting (GTB) as the predictive learning algorithm to predict EPI based on feature representations generated by PEP-Motif or PEP-Word. GTB is a specialized Gradient Boosting Machine (GBM) (Friedman, 2001, 2002) with decision trees used as base learners. Given the training samples , the GTB model aims to learn a mapping function from x to y. Here is the feature vector of the i-th sample and yi is its label (see Supplementary Methods A.1 for details). In our study the prediction of long-range EPI is formulated as a two-class classification problem. Numerical features are extracted from sample DNA sequences of the paired regions based on either TFBS motifs (for PEP-Motif) or word embedding model (for PEP-Word). We used the XGBClassifier implemented by the XGBoost learning library (Chen and Guestrin, 2016a, 2016b) to train the model. We performed 10-fold cross validation to train and tune a classifier on each cell line. The classifier estimates the probabilities of a sample belonging to the two classes. We merged predictions on the test data of each fold, obtaining predictions on the whole dataset. As the positive and negative samples are heavily imbalanced, when training the classifier, positive samples were given a larger weight (proportional to the ratio of negative sample size to positive sample size). Accordingly, several different metrics were used to measure performance during evaluation. Note that the evaluation and comparisons were performed with consistent 10-fold cross-validation approach for all methods. More details on the GTB model and the definitions of evaluation metrics are in Supplementary Methods A.1 and A.9.
3.3 Feature extraction for TFBS motifs in PEP-Motif
The sequences for enhancer/promoter annotations used in this study are based on human genome assembly hg19. In Whalen et al. (2016) the authors found that epigenetic markers within the window between an enhancer–promoter pair are highly useful in predicting the interactions, and much of the prediction strength can be recovered by only exploiting 3 kb flanking regions of the enhancers on both sides. We used the 4 kb extended flanking regions of enhancers to extract sequence-based features by balancing of computational efficiency and performance robustness, although we also evaluated different lengths of flanking regions (Supplementary Methods A.6 and Fig. S5). We used FIMO (Grant et al., 2011) for motif scanning along the sequences with the PWMs from HOCOMOCO Human v10 database (Kulakovskiy et al., 2016), one of the most comprehensive human TF binding motif databases, with 641 non-redundant TF binding PWMs for 601 TFs. We used a P-value threshold of 1e-04 to identify motif matches from FIMO. For a certain motif, we computed the normalized motif occurrences for each of the enhancer or promoter sequences to form the feature vector. Given M motifs, let be the number of occurrences of the respective motifs in the i-th sequence with length Li. The feature vector of the i-th sequence is , where . Finally, to formulate the feature representation of an enhancer–promoter pair, we concatenated the feature vectors of the enhancer region and the promoter region.
We then estimated feature importance for each of the motif features based on our GTB model. The importance is first estimated for a single decision tree based on how the feature at each split point improves the performance, which is then normalized by the number of samples classified by the corresponding split node. The feature importance estimates from individual trees are then averaged across all the decision trees in the ensemble. Additionally, we explored whether the prediction strength of PEP-Motif can be captured by a selected subset of the motif features. Features were ranked by their estimated importance in descending order. We sequentially added features to the selection set based on their importance rankings. A subset of features was used for model training and evaluation each time.
3.4 Feature extraction in PEP-Word based on word embedding model
PEP-Word uses a continuous distributed representation of sequences to extract informative features encoded in the enhancer–promoter sequence pairs. PEP-Word is based on word embedding (Mikolov et al., 2013a, 2013b), which was initially developed in the field of Natural Language Processing (NLP) to obtain continuous distributed representation of words. In our model, a DNA subsequence of length K (denoted as K-mer) is used as a word. The model is trained to embed each K-mer into a new n-dimensional feature space. Weighted pooling is then performed to generate feature vectors for sequences of varied lengths. The word embedding model can be presented as a projection matrix of size , where is the vocabulary size and n is the dimensionality of the embedded feature space. The vocabulary V is the set of all distinct words of interest. In our case since our words are K-mers of nucleotides. Each row of the matrix represents the embedded n-dimensional feature vector of the corresponding word.
We use the Continuous Bag-of-Words (CBOW) method (Mikolov et al., 2013b) to implement word embedding. In CBOW, our goal is to maximize the following objective function:
| (1) |
where represents the model parameters, wt is the target word, c is a context word of wt, V is the vocabulary, and is the set of all the context words of wt, which depends on the context window size. For example, if 20 words prior to the target word are used as context, the context window size is 20. is the probability of observing the target word wt given the context c. Originally, is formulated by a softmax function:
| (2) |
where and vc represent the embedded feature vectors of a target word wt and a context word c obtained from the word embedding model, respectively. is a score measuring the compatibility between vc and . However, it is computationally expensive to normalize these probabilities over all word pairs. Instead, negative sampling is used to generate negative samples of word pairs, by which a set of negative samples are selected instead of all word pairs. A positive sample is a pair of a target word and its context. A negative sample is a pair of a context c and a noise word not associated with the context. The problem is then formulated as binary logistic regression. Our goal is to optimize the word embedding model for better discrimination between positive and negative samples. Negative sampling is a variation of Noise Contrastive Estimation (NCE) (Mnih and Kavukcuoglu, 2013). The objective function is to maximize:
| (3) |
where wt and c denote the target word and the context, respectively. represents a noise word and , where is the probability distribution of noise words. k is the number of negative samples drawn from the noise distribution per positive sample. D represents the training data of pairs of target word and context. is the probability that the word pair is observed in D, given the parameters of the word embedding model. is the probability that is not observed in D, given . The expectation in the second term of Equation (3) represents the expected log probability of producing a negative sample under the noise distribution. For negative sampling, the objective function takes the following alternative form (Goldberg and Levy, 2014), which is approximately equivalent to Equation (3):
| (4) |
where
| (5) |
| (6) |
represents the set of randomly sampled negative word pairs.
In PEP-Word, cell-type specific word embedding models are trained for both enhancer regions and promoter regions, respectively. Features resulted from the respective models of the paired regions are then concatenated to form a feature representation of the pair. For a given cell line, we extracted the DNA sequences of all the annotated enhancers (or promoters). An overlapping window of size K and sliding stride 1 was used to obtain all the K-mers in the sequence sequentially. Thus, a sequence of length L generates K-mers in order, forming a ‘sentence’. Sentences from all the enhancers (or promoters) were pooled to form a corpus used for unsupervised training of a word embedding model. In our implementation, we set K = 6, the feature vector size n to be 300, and the context window size of a target word (K-mer) to be 20. Namely, 20 context words of a target word were used in training. We chose K = 6 to keep the balance between computational efficiency and information complexity contained by each K-mer (Supplementary Fig. S5). We also tested by varying the embedding dimension n from 100 to 600 and found that setting n = 300 best balanced computational efficiency and performance (Supplementary Fig. S5).
We then used the trained word embedding model to formulate feature representations of enhancers (or promoters). Similar to PEP-Motif, 4 kb flanking regions of the enhancers were included in sequence extraction and feature representation. Evaluation with respect to different choices of flanking region size is shown in Supplementary Fig. S5. The feature vector representing the i-th sequence is: , where wk is the k-th word (K-mer) in the vocabulary, is the weight of wk for sequence si and is the feature vector of wk generated by the word embedding model. In our method based on weighted pooling (see Supplementary Methods A.3).
4 Conclusion and discussion
Although new high-throughput mapping approaches such as Hi-C and ChIA-PET have become increasingly useful to identify potential long-range interactions between enhancers and promoters genome-wide, it is still unclear whether the sequence-based features are sufficient to define and predict EPIs. In this work, we have developed PEP to answer this question. We use two different but complementary approaches in PEP, including PEP-Motif, which only uses TF binding motifs as features, and PEP-Word, which uses word embedding model to extract more generic sequence features. Based on our results, we have demonstrated that sequenced-based features alone can indeed effectively predict EPIs in a cell type if we are given the genomic locations of putative enhancers and promoters in that particular cell type. We found that features based on TF binding motifs only (from PEP-Motif) and features based on word embedding (from PEP-Word) can both achieve performance competitive with the state-of-the-art methods that use non-sequence-based, functional genomic signals. In addition, the combined model (from PEP-Integrate) showed further improvement in predicting EPIs. Overall, we demonstrated that PEP is a promising predictive model with the potential to reveal important sequence-level instructions that guide long-range gene regulation in the genome. Such a model may be further developed into a powerful tool to predict non-coding variants that may disrupt long-range interactions.
There are a number of areas that our model can be improved. For example, we have limited ability to interpret the features extracted from word embedding model due to the difficulty in intuitively explaining the embedded space. This is actually also a challenge in the field of NLP even though word embedding strategies have been applied in NLP widely. Indeed, visualization methods such as t-SNE can be used to provide an idea of the embedded space and its ability in distinguishing the samples. Therefore, even though we have shown that PEP-Word seems to achieve better performance than PEP-Motif in most cell lines, we are not able to clearly identify the sequence features captured by PEP-Word but not by PEP-Motif. Nevertheless, the comparison between PEP-Motif and PEP-Word together with the findings from PEP-Integrate provides useful insights that the important sequence-based features that determine EPIs are likely to be a combination of TF binding motifs and other non-motif sequence features; and such combination may vary across different cell types. Additionally, if we use the PEP classifier trained on one cell line to predict EPIs in another cell line, the performance is generally quite low. Using functional genomic signals, the recently developed method RIPPLE (Roy et al., 2015) explored cross-cell-type EPI prediction and found that multiple types of functional genomic signals from multiple cell types can be utilized to make predictions of regulatory interaction in a new cell type. Therefore, it would be interesting to explore new approaches of optimally selecting sequence-based features and functional genomic features in order to achieve the strongest possible predictions in a different cell type, especially for a new cell type where the functional genomic data have yet to be generated. Such an effort would be highly informative to better understand EPIs and their variation across different cell types.
Supplementary Material
Acknowledgement
We would like to thank Dechao Tian and Yuchuan Wang for the discussions and the anonymous reviewers for their suggestions.
Funding
This work is supported in part by National Institutes of Health grant HG007352 (to J.M.), and National Science Foundation grants 1054309 and 1262575 (to J.M.). R.Z. is supported by Tsinghua University’s Top Open program for his visit to Carnegie Mellon University during summer 2016. S.S. is supported by a National Science Foundation Graduate Research Fellowship DGE-1252522.
References
- Bailey S.D. et al. (2015) ZNF143 provides sequence specificity to secure chromatin interactions at gene promoters. Nat. Commun., 2, 6186. [DOI] [PMC free article] [PubMed] [Google Scholar]
- Bonev B., Cavalli G. (2016) Organization and function of the 3d genome. Nat. Rev. Genet., 17, 661–678. [DOI] [PubMed] [Google Scholar]
- Chen T., Guestrin C. (2016a) XGBoost. https://github.com/dmlc/xgboost.
- Chen T., Guestrin C. (2016b) XGBoost: A scalable tree boosting system. In: Proceedings of the 22nd ACM SIGKDD International Conference on Knowledge Discovery and Data Mining, p.785–794. ACM, New York, NY, USA.
- Davis J., Goadrich M. (2006) The relationship between precision-recall and ROC curves. In: Proceedings of the 23rd International Conference on Machine Learning, p.233–240. ACM, New York, NY, USA.
- Dixon J.R. et al. (2015) Chromatin architecture reorganization during stem cell differentiation. Nature, 518, 331–336. [DOI] [PMC free article] [PubMed] [Google Scholar]
- ENCODE Project Consortium. et al. (2012) An integrated encyclopedia of DNA elements in the human genome. Nature, 489, 57–74. [DOI] [PMC free article] [PubMed] [Google Scholar]
- Friedman J.H. (2001) Greedy function approximation: a gradient boosting machine. Ann. Stat., 29, 1189–1232. [Google Scholar]
- Friedman J.H. (2002) Stochastic gradient boosting. Comput. Stat. Data Anal., 38, 367–378. [Google Scholar]
- Goldberg Y., Levy O. (2014) word2vec explained: deriving Mikolov et al.’s negative-sampling word-embedding method. arXiv:1402.3722 [cs.CL], https://arxiv.org/abs/1402.3722.
- Grant C.E. et al. (2011) FIMO: scanning for occurrences of a given motif. Bioinformatics, 27, 1017–1018. [DOI] [PMC free article] [PubMed] [Google Scholar]
- Kostenko B. (2016) XGBoost feature interactions reshaped. https://github.com/limexp/xgbfir.
- Kulakovskiy I.V. et al. (2016) HOCOMOCO: expansion and enhancement of the collection of transcription factor binding sites models. Nucleic Acids Res., 44, D116–D125. [DOI] [PMC free article] [PubMed] [Google Scholar]
- Kundaje A. et al. (2015) Integrative analysis of 111 reference human epigenomes. Nature, 518, 317–330. [DOI] [PMC free article] [PubMed] [Google Scholar]
- Li G. et al. (2012) Extensive promoter-centered chromatin interactions provide a topological basis for transcription regulation. Cell, 148, 84–98. [DOI] [PMC free article] [PubMed] [Google Scholar]
- Lieberman-Aiden E. et al. (2009) Comprehensive mapping of long-range interactions reveals folding principles of the human genome. Science, 326, 289–293. [DOI] [PMC free article] [PubMed] [Google Scholar]
- Mikolov T. et al. (2013a) Distributed representations of words and phrases and their compositionality. In: Advances in Neural Information Processing Systems (NIPS), p.3111–3119. Curran Associates, Inc., USA.
- Mikolov T. et al. (2013b) Efficient estimation of word representations in vector space. arXiv:1301.3781 [cs.CL], https://arxiv.org/abs/1301.3781.
- Mnih A., Kavukcuoglu K. (2013) Learning word embeddings efficiently with noise-contrastive estimation. In: Advances in Neural Information Processing Systems (NIPS), p.2265–2273. Curran Associates, Inc., USA.
- Ong C.-T., Corces V.G. (2014) CTCF: an architectural protein bridging genome topology and function. Nat. Rev. Genet., 15, 234. [DOI] [PMC free article] [PubMed] [Google Scholar]
- Préfontaine G.G. et al. (1999) Selective binding of steroid hormone receptors to octamer transcription factors determines transcriptional synergism at the mouse mammary tumor virus promoter. J. Biol. Chem., 274, 26713–26719. [DOI] [PubMed] [Google Scholar]
- Rao S.S. et al. (2014) A 3d map of the human genome at kilobase resolution reveals principles of chromatin looping. Cell, 159, 1665–1680. [DOI] [PMC free article] [PubMed] [Google Scholar]
- Roy S. et al. (2015) A predictive modeling approach for cell line-specific long-range regulatory interactions. Nucleic Acids Res., 43, 8694–8712. [DOI] [PMC free article] [PubMed] [Google Scholar]
- Sanyal A. et al. (2012) The long-range interaction landscape of gene promoters. Nature, 489, 109–113. [DOI] [PMC free article] [PubMed] [Google Scholar]
- Tang Z. et al. (2015) CTCF-mediated human 3d genome architecture reveals chromatin topology for transcription. Cell, 163, 1611–1627. [DOI] [PMC free article] [PubMed] [Google Scholar]
- Van Der Maaten L. (2014) Accelerating t-SNE using tree-based algorithms. J. Mach. Learn. Res., 15, 3221–3245. [Google Scholar]
- Wei Z. et al. (2013) Klf4 organizes long-range chromosomal interactions with the oct4 locus in reprogramming and pluripotency. Cell Stem Cell, 13, 36–47. [DOI] [PubMed] [Google Scholar]
- Whalen S. et al. (2016) Enhancer–promoter interactions are encoded by complex genomic signatures on looping chromatin. Nat. Genet., 48, 488–496. [DOI] [PMC free article] [PubMed] [Google Scholar]
- Ye B.-Y. et al. (2016) ZNF143 is involved in CTCF-mediated chromatin interactions by cooperation with cohesin and other partners. Mol. Biol., 50, 431–437. [DOI] [PubMed] [Google Scholar]
- Zhang Y. et al. (2013) Chromatin connectivity maps reveal dynamic promoter-enhancer long-range associations. Nature, 504, 306–310. [DOI] [PMC free article] [PubMed] [Google Scholar]
Associated Data
This section collects any data citations, data availability statements, or supplementary materials included in this article.