

Abstract
Alternative splicing generates distinct mRNA isoforms and is crucial for proteome diversity in eukaryotes. The RNA-binding protein (RBP) U2AF2 is central to splicing decisions, as it recognizes 3′ splice sites and recruits the spliceosome. We establish “in vitro iCLIP” experiments, in which recombinant RBPs are incubated with long transcripts, to study how U2AF2 recognizes RNA sequences and how this is modulated by trans-acting RBPs. We measure U2AF2 affinities at hundreds of binding sites and compare in vitro and in vivo binding landscapes by mathematical modeling. We find that trans-acting RBPs extensively regulate U2AF2 binding in vivo, including enhanced recruitment to 3′ splice sites and clearance of introns. Using machine learning, we identify and experimentally validate novel trans-acting RBPs (including FUBP1, CELF6, and PCBP1) that modulate U2AF2 binding and affect splicing outcomes. Our study offers a blueprint for the high-throughput characterization of in vitro mRNP assembly and in vivo splicing regulation.
Most eukaryotic genes are transcribed into long pre-mRNAs that consist of multiple exons and introns. The splicing reaction, i.e., the removal of introns and joining of exons in different combinations, allows for the production of distinct mature mRNA isoforms and is the main source of proteome diversity in eukaryotes (Nilsen and Graveley 2010).
Splicing is catalyzed by a large multi-subunit complex called the spliceosome that recognizes the 5′ and 3′ splice sites as well as the branch point of each intron (Matera and Wang 2014). Spliceosome activity is regulated by a large set of trans-acting RNA-binding proteins (RBPs) that bind to cis-regulatory elements in the pre-mRNA and guide splice site recognition (Fu and Ares 2014; Vuong et al. 2016). How these RBPs act together on the cis-regulatory elements to assemble pre-ribonucleoprotein complexes (pre-mRNPs) and determine the splicing outcome is commonly referred to as the “splicing code.” Understanding the splicing code remains one major goal in RNA biology.
A central player in 3′ splice site definition is the U2 Auxiliary Factor 2 (U2AF2; also referred to as U2AF65). U2AF2 binds to a uridine/cytidine-rich sequence element upstream of the 3′ splice site, referred to as the polypyrimidine tract (Py-tract) (Singh et al. 2000; Mackereth et al. 2011). Together with SF1 and U2AF1, which recognize the branch point and the AG dinucleotide of the 3′ splice site, respectively, U2AF2 is essential to recruit the small nuclear ribonucleoprotein (snRNP) U2, a subunit of the spliceosome (Berglund et al. 1998; Merendino et al. 1999; Zorio and Blumenthal 1999). U2AF2 binding comprises a major regulatory step during spliceosome assembly and is modulated by several RBPs, e.g., by means of direct competition, cooperative recruitment, or modulation of RNA secondary structure (Zuo and Maniatis 1996; Saulière et al. 2006; Soares et al. 2006; Warf et al. 2009; Tavanez et al. 2012; Zarnack et al. 2013). Despite these individual examples, we still lack a comprehensive understanding of the factors that shape U2AF2 binding and enable targeted splice site recognition.
A state-of-the-art approach to study protein–RNA interactions in vivo is individual-nucleotide resolution UV crosslinking and immunoprecipitation (iCLIP), which allows quantitative mapping of RBP binding at high resolution (König et al. 2010). Given that RBP binding to RNA is highly modulated by the presence of other RBPs in vivo, different high-throughput assays have been developed to study the intrinsic binding of isolated RBPs in vitro, including RNAcompete, RNA Bind-n-Seq, RNA-MaP, and RNA-MITOMI (Ray et al. 2009; Martin et al. 2012; Buenrostro et al. 2014; Lambert et al. 2014; Cook et al. 2015). Depending on the setup, these approaches allow determination of the consensus motif of an RBP, measuring its affinity to a large number of short RNA substrates, or studying the impact of additional factors on RBP binding. However, they often employ short, artificially designed oligonucleotides as substrates, making it difficult to directly compare in vitro to in vivo binding.
Here, we develop in vitro iCLIP to close the gap between in vitro and in vivo approaches. Based on these data, we employ mathematical modeling and machine learning to systematically compare in vitro and in vivo iCLIP landscapes and to identify regulatory RBPs controlling U2AF2 binding in vivo. Our study thus offers a blueprint for high-throughput in vitro experiments to study interactive RBP binding in mRNP assembly and the regulatory code of splicing.
Results
In vitro iCLIP provides the intrinsic binding landscape of U2AF2
Consistent with U2AF2 playing a key role in 3′ splice site definition, iCLIP data from HeLa cells show that U2AF2 binding is highly enriched at 3′ splice sites and depleted from the intron body (Supplemental Fig. S1A; Zarnack et al. 2013). Given that pyrimidine-rich U2AF2 binding motifs also exist throughout introns, the question arises how U2AF2 is specifically recruited to 3′ splice sites.
In order to determine the intrinsic RNA binding behavior of U2AF2 in the absence of other RBPs, we developed in vitro iCLIP to characterize its binding on long transcripts in a well-defined minimal system (Fig. 1A). We use a recombinant peptide comprising the two RRM domains of U2AF2 (U2AF2RRM12; amino acid residues 148–342), which largely recapitulates the binding characteristics of the full-length protein (Mackereth et al. 2011). U2AF2RRM12 is mixed with an equimolar pool of 11 in vitro-transcribed RNAs that resemble endogenous pre-mRNAs with constitutively and alternatively spliced exons. Upon UV crosslinking (254 nm), the full binding landscape of U2AF2RRM12 along the 11 in vitro transcripts is determined using the standard iCLIP protocol. To capture the complete set of potential U2AF2 binding sites, we combined in vitro and in vivo iCLIP data for peak calling and identify a total of 795 U2AF2 binding sites (see Methods). We find a good agreement across all binding sites in three replicate experiments (Pearson correlation coefficient r ≥ 0.742, P-value < 10−15) (Fig. 1C; Supplemental Fig. S1B) and between in vitro iCLIP experiments with either U2AF2RRM12 or recombinant full-length U2AF2 (Pearson correlation coefficient r = 0.806, P-value < 10−15) (Supplemental Fig. S1C).
Figure 1.

In vitro iCLIP provides intrinsic binding landscapes that can be directly compared to in vivo data. (A) Schematic comparison of in vitro and in vivo iCLIP. Unlike in vivo iCLIP, which identifies RNA–protein interactions in the complex cellular environment, in vitro iCLIP captures the interactions in a simplified system consisting of naked in vitro transcripts and recombinant RBP. (B) Regulated binding sites show strong differences between in vivo and in vitro U2AF2 binding. Genome browser view of U2AF2RRM12 in vitro (blue) and U2AF2 in vivo (brown) iCLIP on MAT2A. In vitro iCLIP was performed with 1.5 µM U2AF2RRM12 and an equimolar pool of 11 in vitro-transcribed RNAs (length 1.7–4.4 kb; final concentration per transcript = 0.2 nM) (Supplemental Table S1). Selected sites that are not regulated (gray), stabilized (blue), or cleared (orange) in vivo are highlighted. (C) Replicate experiments are highly reproducible. Scatter plot of read counts in U2AF2RRM12 binding sites from two independent in vitro iCLIP experiments. Pearson correlation coefficient (r) and associated P-value indicated above. (D) RNA binding preferences are conserved between in vitro and in vivo. Scatter plot showing the frequency of 4-mers in a 9-nt window around U2AF2RRM12 in vitro and U2AF2 in vivo binding sites (from genome-wide in vivo iCLIP data) (Zarnack et al. 2013). Pearson correlation coefficient (r) and P-value indicated above. (E) U2AF2 distribution across transcript regions differs between in vitro and in vivo. Bar diagram showing the proportion of iCLIP reads from U2AF2RRM12 in vitro (blue) and U2AF2 in vivo iCLIP (brown) originating from 5′ splice sites (5′ss), 3′ splice sites (3′ss), and intronic regions (intron body).
Comparison with transcriptome-wide in vivo iCLIP data (HeLa cells) indicates that the in vivo binding specificity of U2AF2 is preserved in vitro (Fig. 1B). This is supported by a strong correlation in the frequency of 4-nt sequence motifs (4-mers), which correspond to the common motif width recognized by a single RRM of U2AF2 (Pearson correlation coefficient r = 0.967, P-value < 10−15) (Fig. 1D; Mackereth et al. 2011). Moreover, a computational binding model (GraphProt) (Maticzka et al. 2014) trained on the in vivo iCLIP data scores the top in vitro iCLIP-derived binding sites similar to in vivo sites (Supplemental Fig. S1D). Nevertheless, differences of in vitro and in vivo landscapes exist, in particular when comparing the positioning of U2AF2RRM12 across introns. Unlike the in vivo scenario, the in vitro iCLIP binding signal is only slightly higher at 3′ splice sites compared to other intronic regions (Fig. 1E). This suggests that U2AF2 does not exhibit an intrinsic preference for 3′ splice sites and that additional layers of regulation exist that direct U2AF2 to 3′ splice sites in vivo.
Large-scale quantification of U2AF2 binding affinities
To further quantify U2AF2's binding specificity, we determined dissociation constants (Kd) that reflect the affinity for a given binding site. To this end, we performed titration experiments in which increasing concentrations of U2AF2RRM12 (0.15–15 µM) are mixed with stable amounts of the 11 in vitro transcripts. Visual inspection confirmed that incremental increases in the U2AF2RRM12 concentration enhance binding in a dose-dependent manner, eventually leading to saturation of several binding sites (Fig. 2A; Supplemental Fig. S2A,B). To determine Kd values, we fit a mathematical model that describes RNA–protein binding to the titration curves of all U2AF2 binding sites in four replicate experiments (Fig. 2B,C; see Supplemental Material). This model describes U2AF2 binding to short RNA sequence elements in a 1:1 equilibrium using mass-action kinetics, and resembles previous models of protein or small RNA binding to multiple target sequences (Schmiedel et al. 2012; Jens and Rajewsky 2015; Lorenzin et al. 2016). Importantly, the model accounts for confounding technical biases, such as the sequencing depth of each sample, UV crosslinking efficiencies, PCR amplification biases of RNA sequences, and experimental noise. Our titration experiments thus allow us to disentangle U2AF2 binding affinities from these technical biases (Fig. 2B; see Supplemental Material).
Figure 2.
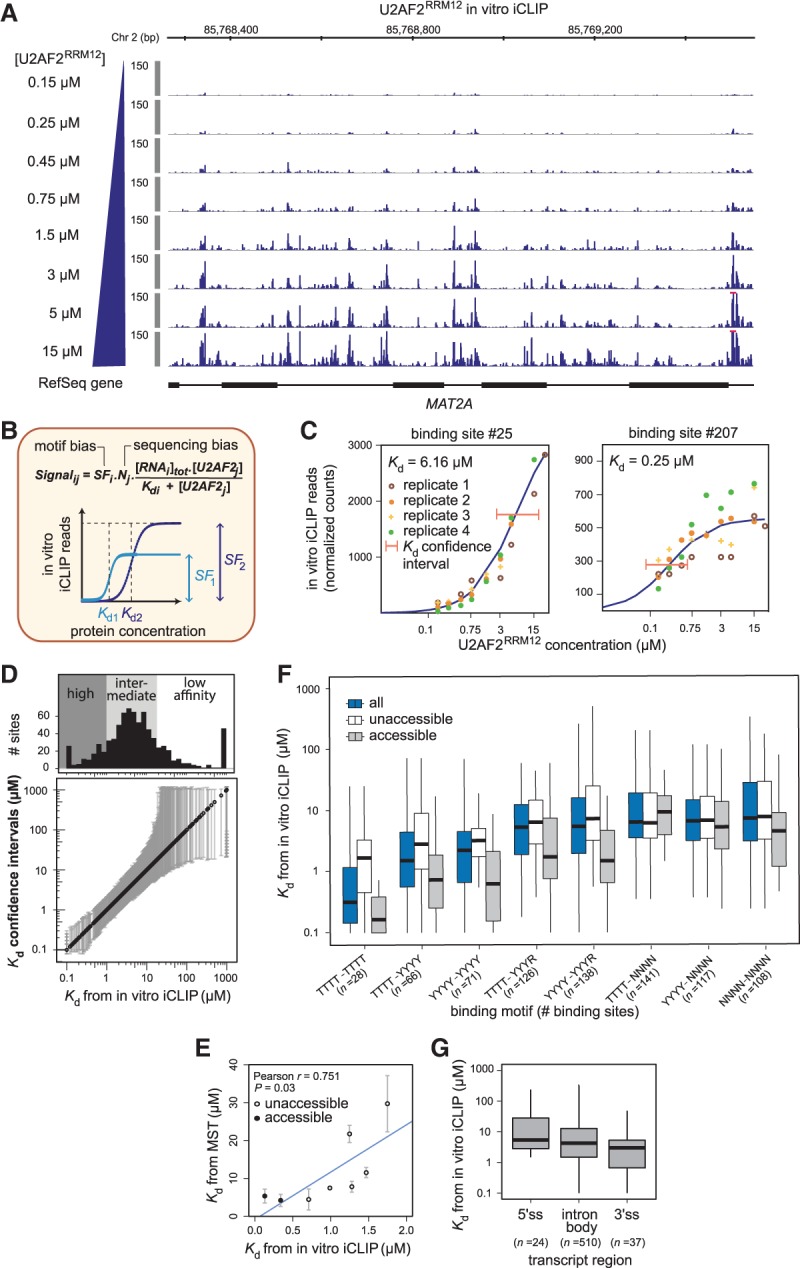
Binding site affinities can be extracted from in vitro iCLIP titration experiments. (A) Titration experiments with increasing U2AF2RRM12 concentrations (0.15–15 µM). Genome browser view of normalized U2AF2RRM12 in vitro iCLIP signal in MAT2A. Red bars indicate values beyond the displayed data range. (B) Kd values were extracted by modeling the read counts from in vitro iCLIP as a function of RNA and U2AF2RRM12 concentrations. A scaling factor (SF) and a normalization factor (N) account for motif and sequencing biases, respectively. Schematic titration curves show two binding sites with lower or higher affinity and/or crosslinking efficiency (dark or light blue, respectively). (C) Titration curves for an intermediate-affinity (left) and a high-affinity binding site (right) (numbers above relate to Supplemental Table S2). Best-fit curves (dark blue) and confidence intervals for the estimated Kd values (orange lines) based on four replicate experiments. (D, lower panel) Plot showing all Kd values from in vitro iCLIP in increasing order (black circles) with their confidence intervals (gray lines). (Upper panel) Histogram of binding sites along the range of Kd values. Binding sites were divided into 120 high-affinity binding sites (Kd < 1 µM), 513 intermediate-affinity sites (1 ≤ Kd ≤ 18 µM), and 162 low-affinity sites (Kd > 18 µM). (E) Kd values from in vitro iCLIP are correlated with microscale thermophoresis (MST) measurements for eight selected binding sites (Supplemental Table S3). Binding sites are marked as accessible (gray) or unaccessible (white) based on RNA fold predictions (see Methods). Pearson correlation coefficient (r) and associated P-value indicated above. (F) Kd values from in vitro iCLIP are proportionate to the underlying pyrimidine content. Binding sites were stratified based on different 8-mers within a 17-nt window (blue; number of binding sites within each category in brackets), and further subdivided into unaccessible (white) or accessible (gray) as in F. (G) Affinities at 3′ splice sites do not significantly differ from other transcript regions. Bar plot showing the distribution of Kd values from in vitro iCLIP for U2AF2 binding sites in different transcript regions.
By model fitting, we simultaneously estimate Kd values for all 795 U2AF2RRM12 binding sites within a range from 0.1 to 1000 µM (Fig. 2D; Supplemental Table S2). In total, we find 120 high-affinity sites with a Kd of <1 µM. The remaining sites subdivide into 513 sites with an intermediate affinity (1 µM ≤ Kd ≤ 18 µM) and 162 low-affinity sites (Kd > 18 µM). The latter no longer reach saturation within the employed concentration range, resulting in uncertainty in the predicted Kd values (Fig. 2D). Determining parameter confidence intervals using a profile likelihood approach (Raue et al. 2009) confirmed that the Kd values of the high-affinity sites (Kd < 1 µM) can be inferred with good accuracy (on average, fivefold difference between 5% and 95% confidence levels) (Fig. 2D).
We validated the Kd estimates using microscale thermophoresis (MST). To this end, short RNA oligonucleotides (18–36 nt) resembling eight binding sites from the in vitro transcripts were Cy5-labeled and incubated with U2AF2RRM12. The obtained MST-Kd values correlate well with the best-fit in vitro iCLIP estimates (Pearson correlation coefficient r = 0.751, P-value = 0.03) (Fig. 2E; Supplemental Table S3). We note that the MST-Kd values differ in absolute terms (10-fold, on average), possibly due to the fluorescence labeling of oligonucleotides for MST. We therefore additionally performed label-free quantification using isothermal titration calorimetry (ITC). The resulting ITC-Kd values again correlated and were in better absolute agreement with the in vitro iCLIP-derived Kd values (Pearson correlation coefficient r = 0.71, P-value = 0.07; average twofold difference) (Supplemental Fig. S2C,D; Supplemental Table S3). The remaining deviation may result from different reaction temperatures or the fact that binding sites are presented in the context of longer in vitro iCLIP transcripts. Taken together, we conclude that mathematical modeling of titration data allows us to reliably estimate U2AF2 affinities.
In order to assess how the RNA sequence composition affects the U2AF2 binding affinity to RNA, we extracted all 8-mers in a 17-nt window around each binding site. As expected from the literature, binding sites containing pyrimidine-rich U8-mers show the highest affinities (median Kd = 320 nM), while increasing numbers of cytidines and purines weaken and abrogate U2AF2RRM12 binding, respectively (Fig. 2F; Mackereth et al. 2011). Surprisingly, binding sites with a similar sequence motif can exhibit very different Kd values. We tested for the impact of RNA secondary structure by calculating a probability for each binding site to be accessible or within a double-stranded RNA region (see Methods). Indeed, we find that structural accessibility accounts for clear differences in Kd values: For instance, U8-containing binding sites buried within RNA secondary structure show substantially lower U2AF2 affinities when compared to unstructured U8-mers that can be freely accessed by the protein (median Kd = 1.75 µM vs. 0.17 µM) (Fig. 2F). This could also explain some of the deviation to MST/ITC measurements, which do not allow for secondary structure effects (Fig. 2E). These observations confirm previous reports (Luo et al. 2016; Taliaferro et al. 2016) that RNA secondary structure can have a strong impact on protein–RNA interactions.
U2AF2 binding to RNA is highly regulated in vivo
As a first step to investigate the rules of U2AF2 binding, we compared affinities across transcript regions. We find that U2AF2 binding sites at 3′ splice sites are not strongly enriched for high-affinity binding, but instead exhibit an affinity spectrum largely overlapping with intronic sites (Fig. 2G). This observation indicates that affinity is not the primary determinant of U2AF2's preference for 3′ splice sites, pointing toward regulation of U2AF2 binding in vivo.
To systematically identify sites that are regulated in vivo, we compared in vivo and in vitro U2AF2 binding landscapes. We asked to what extent the calibrated in vitro U2AF2 binding model can explain the in vivo iCLIP data. Specifically, we simulated sets of hypothetical U2AF2RRM12 binding landscapes across a range of RNA and protein concentrations using the previously determined in vitro Kd values (Fig. 3A). We then identified the hypothetical landscape with the best fit to the in vivo iCLIP data by calculating the difference between model simulation and in vivo data for nine in vitro transcripts (571 binding sites). The best-fit binding landscape overlaps well with the in vivo iCLIP data but also shows clear differences at putatively regulated sites (Fig. 3B).
Figure 3.

Comparative modeling of in vitro and in vivo binding reveals numerous sites of U2AF2 regulation. (A) Schematic of in vitro–in vivo fitting to identify regulatory hotspots. Best-fit was obtained by comparing the in vivo binding to hypothetical landscapes that were simulated from the mathematical model of U2AF2RRM12 in vitro binding based on identified Kd values and varying RNA and U2AF2 concentrations. Discrepancies between best-fit and in vivo binding landscape (z-score) were used to infer stabilization (blue) and clearance (orange) in vivo. (B) Comparison of best-fit (dotted blue line) and in vivo landscape (gray line) on PCBP2 showing stabilized (blue) and cleared (orange) U2AF2 binding sites. Gray shadow represents standard deviation of in vivo iCLIP read counts from three independent replicates. (C) The majority of U2AF2 binding sites are regulated. Plot showing the proportion of nonregulated (|z-score| < 1; white), stabilized (z-score > 1; blue), and cleared (z-score < −1; orange) binding sites in different transcript regions (5′ splice sites, constitutive or alternative 3′ splice sites, and intron body). (D) U2AF2 binding is most efficiently maintained at 3′ splice sites upon partial U2AF2 knockdown (KD). Bar plot showing the proportion of U2AF2 in vivo iCLIP reads in control cells (light gray) and upon partial U2AF2 KD (dark gray) for binding sites in different transcript regions. Analyses across transcriptomes (left) as well as restricted to nine tested in vitro transcripts (right) are shown. (E,F) A nearby AG dinucleotide or branch point (BP) motif is not sufficient to explain the substantial U2AF2 stabilization at 3′ splice sites. (E) Box plot showing the z-score distribution of U2AF2 binding sites at 3′ splice sites (gray) and in intron bodies (white). Binding sites were separated into six roughly equal-sized bins with increasing distance to the next AG dinucleotide (between 1 nt and 417 nt; indicated as ranges below). Individual data points are shown for n < 15. (F) Box plot as in E for binding sites without BP (n = 191 binding sites), with upstream BP motif (n = 230), and with upstream BP motif and adjacent 3′ splice site (n = 55).
Sites with strong in vivo regulation were identified using a z-score that quantifies the distance between best-fit landscape and in vivo observation relative to the in vivo experimental variation (Fig. 3A; Supplemental Table S2). Intriguingly, 324 (57%) out of 571 binding sites may be regulated in vivo (|z-score| > 1). These include 151 (26%) stabilized and 173 (30%) cleared sites with enhanced and reduced U2AF2 binding in vivo, respectively (Supplemental Fig. S3A). The remaining 247 (43%) binding sites display no evidence of regulation in HeLa cells. The discrepancy between in vivo and in vitro binding suggests that these sites may represent regulatory hotspots at which U2AF2 binding is shaped by auxiliary factors.
Focusing on different transcript regions, we observe that 75% of all U2AF2 binding sites at 3′ splice sites of constitutive exons are stabilized in vivo (Fig. 3C; Supplemental Fig. S3A). Similarly, 100% of the alternative 3′ splice sites are regulated—either stabilized or cleared, consistent with alternative splicing decisions occurring at these exons. In line with strong stabilization at 3′ splice sites, we observe that U2AF2 binding at these sites reacts least to a partial U2AF2 knockdown (reflected in an increased relative proportion of U2AF2 binding) (Fig. 3D; Supplemental Fig. S3B). This suggests that U2AF2 binding at 3′ splice sites is close to saturation and robust to perturbations.
In contrast to the prevalent stabilization at 3′ splice sites, the majority of U2AF2 binding sites at 5′ splice sites and in intron bodies are either not regulated or cleared in vivo (Fig. 3C; Supplemental Fig. S3A). The widespread clearance supports the existence of proofreading mechanisms that suppress the recognition of cryptic sites to ensure accurate splicing. In addition, we observe a substantial number of stabilized U2AF2 binding sites within intron bodies, which could be of functional importance in distally regulating neighboring exons (Shao et al. 2014).
U2AF1 and SF1 are direct U2AF2 interaction partners that are known to stabilize its binding at 3′ splice sites by recognizing the AG dinucleotide and the branch point (BP), respectively (Berglund et al. 1998; Wu et al. 1999). We therefore related the degree of in vivo stabilization to the presence or absence of a downstream AG dinucleotide and an upstream BP motif. We observe a preferential in vivo clearance of intronic binding sites that are devoid of AG or BP motifs, as expected from previous reports (Fig. 3E,F; Soares et al. 2006; Tavanez et al. 2012). However, not all binding sites that harbor AG or BP motifs are stabilized in vivo. Instead, it is specifically the binding sites at 3′ splice sites that show pronounced stabilization, whereas intronic sites do not (Fig. 3E,F). This suggests the involvement of further auxiliary factors, other than U2AF1 and SF1, in regulating U2AF2 binding.
Machine learning predicts regulators of U2AF2 binding
In order to identify auxiliary RBPs that shape U2AF2 binding in living cells, we pursued a supervised machine learning approach that relates the direction of regulation to the presence of 4224 sequence features (Fig. 4A). These features include primary sequence motifs, such as in silico predictions of RBP binding sites (position-specific scoring matrices, PSSMs) (Ray et al. 2013) and all possible 6-nt motifs (referred to as k-mers), as well as positional information such as the relative location within the transcript. We then trained a Random Forests machine learning approach on these features, thereby correctly classifying U2AF2 binding sites into stabilized or cleared in vivo with high accuracy (misclassification rate of ∼12%) (see Supplemental Material).
Figure 4.

Random Forests machine learning reveals possible regulators of in vivo U2AF2 binding. (A) Schematic workflow of the Random Forests approach that learns the most relevant features to classify U2AF2 binding sites into stabilized (z-score > 1, 151 sites) or cleared (z-score < −1, 173 sites) in vivo. (B) Twelve regulatory groups are identified as top candidates for in vivo U2AF2 regulation. Plot contrasting the relative importance and purity of collapsed regulatory groups from the top 100 features obtained by Random Forests analysis. Purity indicates specificity of association with a certain direction of regulation (see Supplemental Material). Circle diameter represents scaled number of sites with predicted binding sites of a representative RBP from the group for the predominant direction of regulation (blue = stabilized in vivo, orange = cleared in vivo). (C) HNRNPC (C1) suppresses U2AF2RRM12 binding specifically at sites that are down-regulated in vivo and show overlapping HNRNPC binding according to in silico predictions (left panel) or HNRNPC in vivo iCLIP data (right panel). Box plots of log2-transformed fold-changes (log2FC) of normalized U2AF2RRM12 read counts from in vitro iCLIP cofactor assays with different concentrations of recombinant HNRNPC (C1) (200, 500, and 1000 nM) over a control with U2AF2RRM12 alone. U2AF2 binding sites are subdivided into sites without HNRNPC (white) and sites with HNRNPC but not regulated in vivo (z-score < |0.5|; gray), stabilized in vivo (z-score > 1; blue), or cleared in vivo (z-score < −1; orange). An additional box summarizes all sites with decreased U2AF2 binding upon HNRNPC KD in vivo (log2FC < −1; yellow) (Zarnack et al. 2013). Individual data points are shown for n < 11. (D) In vitro iCLIP recapitulates in vivo competition between HNRNPC and U2AF2. Genome browser view of U2AF2 in vivo iCLIP data (brown) from control and HNRNPC knockdown HeLa cells (Zarnack et al. 2013), as well as in vitro iCLIP data (blue) for U2AF2RRM12 alone (control) and upon addition of recombinant HNRNPC (C1) at HNRNPC-regulated alternative exon of CD55. Orange shading highlights HNRNPC-regulated site. (E) HNRNPC triggers similar regulation of U2AF2 binding in vivo and in vitro. Scatter plots comparing log2FC upon in vitro addition of HNRNPC (C1) (HNRNPC (C1) + U2AF2RRM12/U2AF2RRM12) with log2FC of U2AF2 in vivo iCLIP read counts upon HNRNPC KD (KD/control) for three different concentrations of recombinant HNRNPC (C1). Pearson correlation coefficients (r) and associated P-values are given.
For further analyses of the classification results, we considered the top 100 features, which include four positional features, 11 PSSMs, and 85 k-mers (Supplemental Table S4). The specificity of the identified features was confirmed by comparisons with Random Forests runs on nonregulated binding sites (see Supplemental Material). The highest-ranking feature is “distance to 3′ splice site,” reflecting the pronounced level of U2AF2 regulation at 3′ splice sites. In addition, we find PSSM matches of known splicing factors, such as HNRNPC, SRSF9, and SF3B4 (Champion-Arnaud and Reed 1994; König et al. 2010; Fu et al. 2013). To reduce redundancy, we mapped the k-mers to known RBP binding motifs based on their similarity with available PSSMs (see Supplemental Material). Moreover, we collapsed RBPs that belong to the same protein family (such as the paralogs PCBP1/2/3) or share similar motifs into 12 regulatory groups (Supplemental Table S5). For each group, we calculated a “purity factor” that reflects their specificity for either stabilized or cleared U2AF2 binding sites (see Methods).
Taking into account both importance and purity, we predict the RBPs from the regulatory groups “PCBP,” “PTB,” “HNRNPC,” “FUBP,” and “SR proteins” among the top regulators of U2AF2 binding (Fig. 4B). Some groups, such as “SR proteins” or “PCBP,” preferentially associate with either stabilized or cleared binding sites, suggesting that they mainly function as enhancers or suppressors of U2AF2 binding, respectively. For most regulatory groups, however, the specificity for a certain direction is low, indicating that their effect may depend on the sequence context. In essence, using machine learning we derived a shortlist of promising candidate RBPs that could be involved in stabilizing or clearing U2AF2 binding in vivo.
In vitro iCLIP cofactor assays recapitulate in vivo regulation by HNRNPC
To test the impact of the predicted U2AF2 regulators, we performed in vitro iCLIP cofactor assays, in which we assessed how the addition of recombinant RBPs affects U2AF2 binding to transcripts. We initially validated this approach using HNRNPC (C1) (HNRNPC isoform 1), which ranks among the top regulators in our Random Forests analysis (rank #5; Supplemental Table S4) and is known to regulate U2AF2 binding by direct competition (Burd et al. 1989; Zarnack et al. 2013).
The addition of recombinant HNRNPC (C1) to our in vitro U2AF2RRM12 iCLIP assay recapitulates known regulatory scenarios: For instance, HNRNPC suppresses in vitro U2AF2RRM12 binding to the Py-tract of the alternative exon in CD55 (Fig. 4D), reflecting that HNRNPC affects U2AF2 binding to this site and alternative splicing of the corresponding exon in vivo (Zarnack et al. 2013). On a global scale, our in vitro assay confirms that HNRNPC (C1) suppresses U2AF2RRM12 binding in a dose-dependent manner (Fig. 4C). This effect preferentially occurs at U2AF2 binding sites, which harbor a nearby HNRNPC binding site according to motif predictions (Ray et al. 2013) or previously published in vivo iCLIP data (Fig. 4C, right panel; Zarnack et al. 2013). Notably, the strongest HNRNPC-induced changes are specifically observed at cleared U2AF2 binding sites (z-score < −1) (Fig. 4C, orange boxes), which suggests that our model accurately predicts sites of in vivo U2AF2 regulation. To further confirm that in vitro HNRNPC addition reflects the in vivo situation, we compared our data to a published HNRNPC knockdown in HeLa cells (Zarnack et al. 2013). Importantly, we find that the same U2AF2 binding sites that respond to HNRNPC knockdown are also controlled by HNRNPC (C1) in vitro in a concentration-dependent manner (Pearson correlation coefficient r ∼ 0.4, P-value < 10−4) (Fig. 4C,E, yellow boxes).
Together, this demonstrates that the in vitro cofactor assay reflects HNRNPC's regulatory effects on U2AF2 binding as they occur in vivo. Thus, this setup enables us to investigate the molecular mechanisms of U2AF2 regulation across hundreds of binding sites in a defined environment.
Cofactor assays validate new activators and repressors of U2AF2 recruitment
To further explore U2AF2 regulation, we selected 10 additional RBPs from different regulatory groups obtained from our machine learning approach. These comprise previously described regulators of U2AF2, including ELAVL1, PTBP1, and MBNL1 (Saulière et al. 2006; Izquierdo 2008; Warf et al. 2009; Echeverria and Cooper 2014; Wongpalee et al. 2016), as well as novel candidates, such as FUBP1, RBM24, CELF6, KHDRBS1 (Sam68), PCBP1 (HNRNPE1), SNRPA (U1-A), and RBM41.
We performed in vitro iCLIP cofactor assays by adding 114–500 nM of the recombinant RBPs (Supplemental Fig. S4) to in vitro iCLIP reactions with U2AF2RRM12 and the nine protein-coding in vitro transcripts (see Methods). As a negative control, we used 500 nM BSA. The impact of each RBP was quantified as a log2 fold-change (log2FC) in U2AF2RRM12 binding upon RBP addition. We find that the added RBPs substantially modify U2AF2RRM12 binding at dozens of sites (Fig. 5A), with the majority of binding sites being specifically affected by individual RBPs.
Figure 5.

Cofactors change U2AF2RRM12 binding in vitro. (A) Different patterns of U2AF2 regulation by cofactors can be observed in vitro. Heat map showing log2FC of normalized U2AF2RRM12 read counts upon addition of cofactors (U2AF2RRM12 + cofactor/U2AF2RRM12). In vitro transcripts indicated above. Only binding sites with |log2FC| > 2 in at least one cofactor experiment are shown. (B) Several cofactors significantly change U2AF2RRM12 binding. Bar plot showing log2FC upon cofactor addition as in A for sites with no cofactor motif (white) as well as sites with cofactor motif and not regulated (gray, −0.5 < z-score < 0.5), stabilized in vivo (blue, z-score > 1), or cleared in vivo (orange, z-score < −1). Data were scaled such that log2FC of sites without cofactor motif are centered around zero. Added cofactor concentrations are indicated in each panel. Dots indicate individual data points for n < 50. Adjusted P-values are given for all groups with false discovery rate (FDR) < 10% (two-sided Student's t-test, Benjamini–Hochberg correction, compared to binding sites without cofactor motif).
To deduce the overall impact of each RBP, we followed the analysis strategy described above for HNRNPC (C1) and sorted the U2AF2 binding sites according to their model-predicted in vivo regulation and the presence of in silico predicted RBP binding motifs. This consolidated analysis confirms that, similarly to HNRNPC (C1), PTBP1 and PCBP1 significantly decrease U2AF2RRM12 binding specifically at sites that show overlapping binding motifs and are cleared in vivo (Fig. 5B). Moreover, our in vitro iCLIP cofactor assay identifies CELF6 and FUBP1 as novel U2AF2 enhancers that significantly stabilize U2AF2RRM12 binding (Fig. 5B). Likewise, SNRPA and MBNL1 may also cause an up-regulation of U2AF2 binding; however, these effects only occur at a few binding sites and do not reach statistical significance. For the remaining RBPs (ELAVL1, KHDRBS1, RBM24, and RBM41), we do not observe coherent effects in our in vitro iCLIP cofactor assays, possibly because their in vivo function relies on additional factors such as U2AF1 or domains not present in U2AF2RRM12 (Zuo and Maniatis 1996; Zhang et al. 2013). Together, we confirm that several predicted cofactors regulate U2AF2RRM12 binding in vitro, in a way that coincides with stabilized or cleared U2AF2 binding in vivo. Altogether, these observations underline the power of in vitro iCLIP in combination with mathematical modeling and machine learning to identify regulators and to detect genuine sites of U2AF2 regulation.
Multiple U2AF2 binding sites affect PTBP2 alternative splicing
The ability of our in vitro iCLIP cofactor assays to mimic in vivo U2AF2 regulation is exemplified at the alternative PTBP2 exon 10. This exon harbors two U2AF2 binding sites directly on the Py-tract as well as multiple distal intronic sites. We find that in vitro addition of PTBP1 down-regulates U2AF2 binding at one of the Py-tract-associated sites (referred to as BS1) as well as at an extended cluster of distal binding sites (jointly referred to as BS2), thereby restoring the in vivo U2AF2 binding pattern at these sites (Fig. 6A). In vivo PTBP1 iCLIP data (Coelho et al. 2015) confirm overlapping PTBP1 binding at BS1 and BS2, suggesting direct competition.
Figure 6.

In vitro experiment captures in vivo regulation at PTBP2 exon 10. (A) In vitro cofactor assays recapitulate in vivo clearance and stabilization of U2AF2 binding by PTBP1 and FUBP1, respectively. Genome browser view of in vivo iCLIP for PTBP1 (green) and U2AF2 (brown), as well as in vitro iCLIP for U2AF2RRM12 alone and upon addition of recombinant FUBP1 and PTBP1 proteins upstream of PTBP2 exon 10. Regulated U2AF2 sites are marked as BS1-3. Red bar marks in vivo PTBP1 iCLIP signal that extends beyond the visualized range. (B) Minigene reporter assays reveal regulatory impact on alternative exon inclusion. (Top) RT-PCR primers to measure splicing changes. (Bottom) Schematic model of U2AF2 regulation at BS1-3 and its impact on inclusion of PTBP2 exon 10. (C,D) Inclusion of PTBP2 exon 10 is conjointly regulated by BS1, BS2, and BS3. Bar plots showing PTBP2 exon 10 inclusion (depicted as “percent spliced in,” PSI) in control (light gray) and PTBP1/2 (C) or FUBP1 (D) knockdown (KD, dark gray) HeLa cells. Minigene constructs include wild-type (WT) and four mutated versions with BS1 deletion (BS1del), BS2 deletion (BS2del), substitution of BS2 with a U2AF2 binding site that is not regulated by PTBP1 (BS2sub), and BS3 mutation that eliminates the U2AF2 recognition motif (BS3mut). (**) P-value < 0.01 (two-sided Student's t-test). Error bars represent standard deviation of the mean (n = 2 for FUBP1 and n = 3 for PTBP1 knockdown experiments).
To probe the impact of PTBP1 on splicing regulation, we generated a minigene reporter spanning PTBP2 exons 9–11 including BS1-3 (Fig. 6B). Consistent with our in vitro cofactor assays and previous reports, we find that siRNA-mediated knockdown of PTBP1 (together with PTBP2 to avoid functional redundancy) significantly changes exon 10 inclusion in the wild-type minigene (measured as percent spliced in, PSI) (Fig. 6C; Boutz et al. 2007; Li et al. 2013). In order to test the relevance of BS1 and BS2 in PTBP1 regulation, we first deleted the Py-tract-associated BS1, which should eliminate PTBP1 binding while preserving U2AF2 binding on the neighboring site (Fig. 6A; Supplemental Table S6). This results in 100% PTBP2 exon 10 inclusion and thus resembles the PTBP1/2 knockdown, indicating that the mutation completely relieves PTBP1 repression at the 3′ splice site (Fig. 6C). This suggests that BS1 is the primary site of PTBP2 exon 10 regulation via PTBP1. In addition, deleting BS2 also enhances exon 10 inclusion, indicating that this intronic U2AF2 binding site can exert a splicing-inhibitory function. In order to selectively increase U2AF2 binding at BS2, we deactivated PTBP1 regulation by substituting BS2 with a heterologous U2AF2 binding site (BS2sub) that is strongly bound by U2AF2 and lacks overlapping PTBP1 binding in vivo. In support of a splicing-inhibitory function of U2AF2 binding at BS2, the substitution results in decreased exon 10 inclusion (Fig. 6C). This suggests that PTBP1 can promote PTBP2 exon 10 inclusion by clearing intronic U2AF2 binding at BS2 which otherwise would inhibit splicing.
In addition to PTBP1 regulation, we observed that in vitro addition of FUBP1 strongly increases U2AF2RRM12 binding to a distal intronic site (BS3), thereby resembling the stabilized U2AF2 binding at this site in vivo (Fig. 6A). Similar to BS2, mutations that eliminate U2AF2 binding at BS3 (BS3mut) point to a splicing-inhibitory function (Fig. 6D), possibly by recruiting U2AF2 to an unproductive site, which may interfere with intron definition. However, BS3mut shows the opposite effect as seen upon FUBP1 knockdown (Fig. 6D), suggesting that FUBP1 can act via additional sites to regulate exon 10 inclusion.
Taken together, these observations unfold a complex regulatory scenario for PTBP2 exon 10 involving multiple U2AF2 sites, some of which are located more than 300 nt upstream of the 3′ splice site. By pinpointing the sites of regulated U2AF2 binding, in vitro iCLIP helps in the functional and mechanistic interpretation of splicing regulation.
RBP regulation in vitro predicts endogenous splicing in vivo
To systematically investigate the effect of all 11 auxiliary RBPs, we depleted them in HeLa cells and monitored endogenous splicing of the four alternative exons present in our in vitro transcripts using semiquantitative RT-PCR (Supplemental Fig. S5). We find that up to seven out of 11 RBP knockdowns substantially change alternative exon inclusion in PTBP2 exon 10, MYL6 exon 6, and CD55 exon 10 (|ΔPSI|>10%), whereas PCBP2 exon 12 does not respond to any knockdown (Fig. 7A, right).
Figure 7.
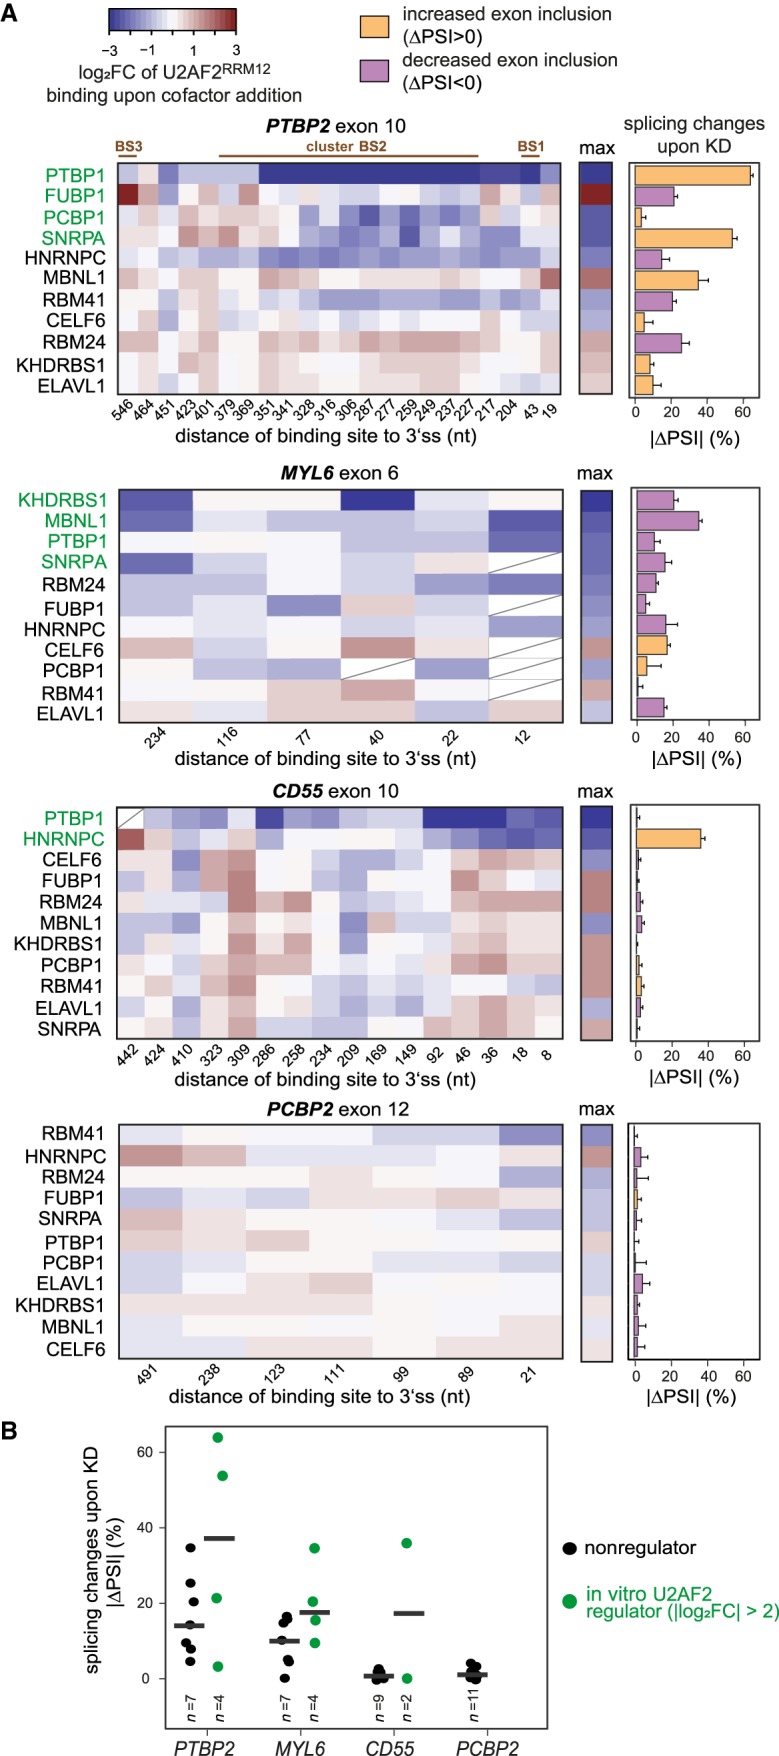
In vitro changes predict in vivo regulation of alternative splicing. (A) Changes in U2AF2RRM12 binding in vitro coincide with effects on alternative exon inclusion upon KD of individual cofactors. (Left panel) Heat maps showing log2FC of normalized in vitro U2AF2RRM12 read counts upon cofactor addition (U2AF2RRM12 + cofactor/U2AF2RRM12) for binding sites within 600 nt of the 3′ splice sites of four alternative exons (PTBP2 exon 10, MYL6 exon 6, CD55 exon 10, and PCBP2 exon 12; note that the preceding introns in MYL6 and PCBP2 are only 304 nt and 510 nt in length, respectively). Cofactors in each heat map are ordered by the maximum change in U2AF2RRM12 binding at any site in vitro (summarized in the middle panel). Binding sites with low coverage are marked with a diagonal line or completely removed if present in less than half of the KD samples. (Right panel) Bar chart showing absolute changes in exon inclusion (percent spliced in, PSI) in vivo upon KD of individual cofactors. Colors indicate direction of splicing change (orange, up-regulation upon KD; purple, down-regulation). Based on their maximum effect on U2AF2RRM12 binding in vitro, cofactors were subdivided into “in vitro U2AF2 regulators” (green, maximal |log2FC| > 2 in U2AF2RRM12 binding upon cofactor addition) and “nonregulators” (white, maximal |log2 FC| ≤ 2). Error bars represent standard deviation of the mean (n = 3). (B) Cofactors that significantly influence U2AF2RRM12 binding in vitro trigger stronger splicing changes in vivo. Dot plot showing ΔPSI upon cofactor KDs for four alternative exons. Coloring of in vitro U2AF2 regulators and nonregulators as in A.
Accordingly, these exons are preceded by numerous strongly regulated U2AF2 binding sites within a 600-nt window upstream of the 3′ splice site (Fig. 7A, left). For instance, MYL6 exon 6 hosts multiple sites that are targeted by KHDRBS1, MBNL1, PTBP1, and SNRPA in the cofactor assays and could be involved in splicing regulation (Fig. 7A). We used the maximal regulatory effect on these binding sites to classify the 11 RBPs as “in vitro U2AF2 regulators” or “nonregulators” for each exon (labeled in green or black, respectively, in Fig. 7A). We find that in vitro U2AF2 regulators of a given exon generally trigger larger splicing changes upon knockdown compared to nonregulators (Fig. 7B). The direction of the splicing change is difficult to infer, possibly due to complex constellations of multiple regulated U2AF2 binding sites. Taken together, these results illustrate that our in vitro iCLIP cofactor assays can facilitate the interpretation of U2AF2 regulation and alternative splicing in vivo.
Discussion
In vitro iCLIP monitors hundreds of natural U2AF2 binding sites
Binding site affinity is a key biophysical parameter that drives the behavior and mode of action of RBPs. High-throughput methods, such as RNA Bind-n-Seq or HTS-EQ, employ simultaneous measurements across large oligonucleotide libraries to determine affinities (Lambert et al. 2014; Jain et al. 2017). However, as these approaches usually entail short synthetic RNA fragments presenting random sequences, the obtained information is not directly transferable to in vivo binding events. More recently, Taliaferro et al. (2016) used natural sequence RNA Bind-n-Seq (nsRBNS) to monitor the binding of two RBPs to natural 109-nt RNA fragments taken from evolutionary conserved alternative exons, although the exact location of the binding site remained elusive.
Here, we introduce in vitro iCLIP to quantify RBP binding across hundreds of naturally occurring binding sites in their natural RNA sequence context within long transcripts (∼2 kb on average). The transcripts were chosen to cover different regulatory scenarios, including alternative and constitutive exons as well as the complete intervening introns, and harbor almost 800 U2AF2 binding sites with the full spectrum of affinities. Notably, in vitro iCLIP precisely defines the binding sites, thereby pinpointing the contextual RNA sequence and structural features with high resolution and accuracy.
An elementary binding model derives the RNA binding affinities
A central part of our analytical framework is the mathematical binding model, which assumes reversible and monomeric binding of U2AF2 to quantitatively describe the binding equilibrium underlying the in vitro iCLIP data.
More complex model variants beyond monomeric binding are conceivable, such as a dimeric assembly of U2AF2 on RNA. However, in line with previous biochemical and structural data (Mackereth et al. 2005, 2011), such scenarios are not supported by our data (Supplemental Fig. S7C; see Supplemental Material). When fitting the model to in vivo U2AF2 binding landscapes, we explicitly consider that RNA binding sites may compete for a limiting U2AF2 pool in the cell. Nevertheless, the best-fit in vivo model indicates that competition is absent in vivo, owing to a large pool of free U2AF2. Consistently, the estimated intracellular U2AF2 concentration of 11 µM agrees well with previous mass spectrometry measurements of absolute cellular protein expression (Schwanhäusser et al. 2011). Thus, RBPs such as U2AF2 may behave differently from small RNA-based post-transcriptional regulators that are often present in limiting amounts (Salmena et al. 2011; Schmiedel et al. 2012; Jens and Rajewsky 2015).
So far, quantitative comparisons of iCLIP signals between binding sites are challenging because technical biases lead to different absolute signals. Confounding effects include, for example, sequence-dependent UV crosslinking preferences and PCR amplification biases. Notably, our in vitro iCLIP approach provides the opportunity to overcome this limitation and to quantitatively determine dissociation constants (Kd) that reflect the affinity for a given binding site. Moreover, the mathematical model provides a combined estimate of binding site-specific biases in form of the scaling factor (Fig. 2B). These results could be used to train sequence-bias models that predict technical biases for arbitrary sequence compositions, which could aid the quantitative interpretation of iCLIP signals in the future.
U2AF2's binding affinity is driven by RNA sequence and structure
The Kd values from our model agree well with reported affinities in the low micromolar range for synthetic U9 or U13 oligonucleotides (Mackereth et al. 2011; Agrawal et al. 2016; Voith von Voithenberg et al. 2016). Consistently, naturally occurring sites harboring continuous U8-tracts are among the strongest binding sites in our data set. In contrast, we confirm that an isolated U4 half-site offers only a weak binding site that does not outperform any other motif (Mackereth et al. 2011). Together, our results support the conformational model of U2AF2 RNA recognition, assuming that two half-sites (U4 or Y4) are required to accommodate both RNA recognition motifs (RRMs) of U2AF2 (Mackereth et al. 2011). In this context, it will be of particular interest to understand how the pyrimidine arrangement at a binding site affects U2AF2's affinity and how U2AF2 can discriminate between weak and strong RNA sequence motifs.
The long transcripts in our in vitro experiments allow for the formation of RNA secondary structures, which can affect in vivo RNA–protein interactions (Luo et al. 2016; Taliaferro et al. 2016). Notably, we globally find that binding motifs within local RNA structures show, on average, almost 10-fold lower affinities compared to freely accessible sites. Consistently, it was previously shown that U2AF2's affinity to troponin T2, cardiac type (TNNT2) pre-mRNA is strongly reduced if the binding site is occluded within a stem–loop structure (Warf et al. 2009). Binding of the RBP MBNL1 modulates this local RNA structure, thereby limiting U2AF2 access and regulating TNNT2 alternative splicing. Our data suggest that this mode of regulation through RNA secondary structure may be widespread for U2AF2.
U2AF2 is extensively stabilized at 3′ splice sites and cleared in introns
Our mathematical binding model allows quantitative comparison of in vivo and in vitro U2AF2 binding. Notably, we obtain a substantial overlap between in vivo and in vitro binding landscapes, even with the simplest assumption of invariant Kd values, enabling us to specifically identify divergent binding sites which are regulated in vivo (see below). A similar set was retrieved using more elaborate fitting approaches in which a subset of Kd values are allowed to change during fitting to reflect that auxiliary RBPs may affect apparent U2AF2 binding affinities (see Supplemental Material). This confirmed the robustness of our model to reliably predict in vivo U2AF2 regulation.
We find that U2AF2 is subject to extensive regulation in vivo. First, we observe a massive stabilization of U2AF2 binding at 3′ splice sites in vivo and show that affinity itself is not the most critical factor in 3′ splice site recognition. Similarly, we detect an efficient in vivo clearance of many high-affinity sites within introns, supporting the existence of proofreading mechanisms. For instance, the specific suppression of binding sites without nearby AG motifs could be mediated by HNRNPA1 or DEK in conjunction with U2AF1 as previously described (Soares et al. 2006; Tavanez et al. 2012).
The theoretical-experimental approach identifies and validates novel U2AF2 regulators
In order to identify putative regulators, we trained a Random Forests classifier. Random Forests models provide information on the importance of each feature for classification, thereby facilitating the extraction of regulatory RBPs (Breiman 2001).
Importantly, the in vitro iCLIP cofactor assays verify several of these RBPs as genuine regulators of U2AF2. Among them, HNRNPC and PTBP1 had already been described to suppress U2AF2 binding via direct competitive binding at Py-tracts (Saulière et al. 2006; Zarnack et al. 2013; Wongpalee et al. 2016). For HNRNPC, our in vitro setup recapitulates the in vivo changes (Zarnack et al. 2013), supporting that the competition does not require additional factors. For PTBP1, on the other hand, several mechanisms have been previously described (Keppetipola et al. 2012). In our assay, addition of PTBP1 alone triggers profound down-regulation at numerous U2AF2 binding sites, resembling the direct competition at the alternative exons in tropomyosin 2 (TPM2) or gamma-aminobutyric acid type A (GABAA) receptor gamma2 subunit (GABRG2) pre-mRNA (Ashiya and Grabowski 1997; Gooding et al. 1998).
In addition to HNRNPC and PTBP1, our study suggests PCBP1 (also known as HNRNPE1) as a novel suppressor of U2AF2 binding in vivo. To date, this protein has been studied mostly in translation, while knowledge about its role in splicing focused on one alternative exon in CD44 pre-mRNA (Geuens et al. 2016; Tripathi et al. 2016). More recently, PCBP1 was found in a complex with the splicing regulators TIA1 and RBM39 that was suggested to increase U2 snRNP recruitment (Huang et al. 2017). Notably, our experiments offer support for a direct role of PCBP1 in shaping the in vivo U2AF2 binding landscape.
We also identify two RBPs as novel enhancers of U2AF2 binding, namely CELF6 and FUBP1 (Fig. 5B). Little is known about the role of both proteins in splicing regulation. CELF6 belongs to the family of CUG-BP- and ETR-3-like factors (CELF). Other family members had already been shown to interfere with U2AF2 binding at neurofibromin 1 (NF1) exon 23a (Barron et al. 2010). CELF6, however, was the only CELF protein that did not change inclusion of this exon upon knockdown, and its role thus remained enigmatic.
FUBP1 was originally described as a DNA-binding protein (Duncan et al. 1994; Zhang and Chen 2013) but also was reported to function as an RBP in mRNA stability and translation (Wang et al. 1998; Olanich et al. 2011). However, its known involvement in splicing regulation is restricted to a few examples of activated target exons, e.g., in DMD or MDM2 pre-mRNA (Jacob et al. 2014; Miro et al. 2015). Notably, our data suggest enhanced U2AF2 binding as a molecular mechanism of FUBP1 splicing regulation, for instance, through cooperative binding. Considering that U2AF2RRM12 lacks the RS domain commonly implicated in protein-protein interactions (Boucher et al. 2001), the impact on U2AF2 binding is most likely accomplished by different interaction interfaces or other means. In this context, two recent publications describe FUBP1 binding to double-stranded RNA structures that it might partially unfold in vivo using its helicase activity (Li et al. 2013; Kralovicova and Vorechovsky 2017). Given U2AF2's strong preference for single-stranded RNA that we and others observed (Warf et al. 2009; Mackereth et al. 2011), it is tempting to speculate that FUBP1 might open critical binding sites for U2AF2.
iCLIP-based modeling disentangles complex regulatory mechanisms in vivo
By comparing our in vitro iCLIP cofactor assays to RBP knockdowns in living cells, we show that regulated in vitro U2AF2RRM12 binding upon cofactor addition is generally associated with knockdown-induced alternative splicing changes. Notably, our results extend beyond a simple interpretation of splicing efficiency as a function of Py-tract composition and intrinsic U2AF2 binding site strength (Voith von Voithenberg et al. 2016). We demonstrate that U2AF2 is extensively regulated by auxiliary factors, resulting in low-affinity sites that can be highly bound in vivo and vice versa. Moreover, each exon is preceded by multiple U2AF2 binding sites, and the extent and direction of splicing regulation depend on the complex interplay of these sites (Shao et al. 2014; Wu and Fu 2015). It has been shown that increased binding of core factors—even directly at the splice sites—does not always result in enhanced splicing, e.g., if it impedes the access of other regulators. For instance, PTBP1 was found to stabilize U1 snRNP binding at the 5′ splice site of FAS exon 6. This has been suggested to block across-exon interactions during exon definition, thereby reducing alternative exon inclusion (Izquierdo et al. 2005). A similar scenario would be conceivable to explain why MBNL1 activates U2AF2RRM12 binding at the 3′ splice site of PTBP2 exon 10 and at the same time inhibits inclusion of this exon in vivo (Fig. 7A). Future in vitro iCLIP experiments with an increasing number of alternative exons will help to understand how the concerted action of multiple RBPs determines the splicing outcome.
In conclusion, we use comparative modeling of in vivo and in vitro iCLIP to identify and validate auxiliary RBPs that can stabilize or clear U2AF2 binding in vivo and control alternative splicing. The in vitro iCLIP method can be extended to a transcriptome-wide scale to further increase the analytical power in future applications. Furthermore, the approach can be applied to RBPs involved in other processes, thus offering a valuable tool for studying RNA–protein interactions and providing novel insights into the complexity of mRNP assembly in post-transcriptional regulation.
Methods
In vitro iCLIP experiments
In vitro iCLIP experiments were performed with recombinant U2AF2RRM12 and a pool of 11 different in vitro transcripts (Supplemental Table S1) that were obtained as described in the Supplemental Material. Briefly, the protocol builds on the standard iCLIP protocol (Huppertz et al. 2014; Sutandy et al. 2016) with the following modifications in early steps: The in vitro transcripts were preheated to reduce large-scale RNA secondary structures, and then mixed with titrated concentrations of U2AF2RRM12 (150 nM–15 µM). For the cofactor experiments, different concentrations of 11 recombinant RBPs were added to an in vitro mix of 500 nM U2AF2RRM12 and nine different in vitro transcripts in binding buffer (Fig. 5). All in vitro mixtures were incubated for 10 min at 37°C and then UV-irradiated on top of an ice plate (250 nm). To normalize the final in vitro iCLIP libraries, a crosslinked mixture of U2AF2RRM12 and the U2AF2-bound NUP133 in vitro transcript was spiked in to each sample. Partial RNase digestion and DNase treatment were performed following the standard iCLIP protocol. The final libraries were sequenced as single-end reads on an Illumina MiSeq sequencing system. An overview of the in vitro iCLIP libraries is given in Supplemental Table S7. A more detailed description of the protocol can be found in the Supplemental Material.
Characterization of U2AF2 binding sites
iCLIP sequencing reads were filtered and mapped to the human genome as described in the Supplemental Material. Peak calling was performed on combined normalized in vitro and in vivo iCLIP data by iteratively identifying 9-nt windows with the highest cumulative signal and sufficient enrichment over a region-wise uniform background distribution. This procedure yielded a total of 795 binding sites (Supplemental Table S2). To compare the RNA sequence composition at U2AF2 binding sites, we counted all 4-mers as well as the occurrence of pyrimidine-rich motifs within the 9-nt peak region. RNAplfold (Bernhart et al. 2006) was used to compute local RNA sequence accessibility. Moreover, we assigned binding sites to three different transcript regions: Binding sites within the first 40 nt of an intron or between the start of the Py-tract and the 3′ splice site were defined as “associated with the 5′ or 3′ splice site,” respectively, while the remaining intron body is referred to as “intronic.” Further details on all steps are given in the Supplemental Material.
Model-based estimation of in vitro Kd values
The binding of U2AF2RRM12 to the binding sites in the 11 in vitro transcripts was modeled using a reversible and monomeric binding model (details in Supplemental Material). By assuming steady state, we expressed the concentration of bound U2AF2RRM12 on binding site i as a function of the dissociation constant Kdi, and the U2AF2RRM12 and binding site concentrations:
Model and experimental data were compared by assuming that the in vitro iCLIP signal is proportional to the complex concentration, the experimental error (; Zi being an independent normal random variable), the binding site-specific “scaling factor” (SFi), and an experiment-specific normalization factor (N) (details in Supplemental Material):
The unknown parameters SFi, N, Kdi, σ were estimated by separately fitting the simulated in vitro iCLIP signal to four replicate in vitro iCLIP titration experiments (see Supplemental Material). For all replicates and experimental conditions, we assumed the same values for Kdi, SFi, and [Sitei]total, and a relative (log-constant) error σ, whereas N differs between experiments and replicates. Since U2AF2RRM12 was present in excess over its target RNAs under in vitro conditions, we neglected that the protein may be limiting and therefore set [U2AF2] to be the total U2AF2RRM12 concentration in the test tube.
Parameter uncertainties were assessed using the profile likelihood approach (Raue et al. 2009). To this end, each parameter was systematically perturbed around its best-fit value and fixed to this perturbed value, while allowing all remaining parameters to change when refitting the model to the data. This approach yields a two-dimensional profile for each parameter, the profile likelihood, in which the goodness-of-fit is shown as a function of the fixed parameter value. Finally, a profile likelihood-based confidence interval was calculated for each parameter using the likelihood ratio test at a 95% confidence level (α = 0.05, degrees of freedom = 1). For more details, see Supplemental Material and Supplemental Figures S6, S7.
Model-based analysis of in vivo regulatory hotspots
We employed our binding model to systematically identify differences between in vitro and in vivo binding landscapes. To this end, we searched for the best overlap by fitting the in vitro model to the in vivo iCLIP landscape. Some biophysical parameters such as Kdi and SFi were assumed to be the same in vitro and in vivo. The unknown concentration of U2AF2, the concentrations of the 29 introns in the nine protein-coding transcripts, as well as the in vivo experimental error and the in vivo normalization factor were estimated by fitting (see Supplemental Material). In contrast to the in vitro model fitting, we did not assume the free pool of U2AF2 to be present in excess over the transcripts and hence allowed for protein sequestration effects between the binding sites.
In order to identify regulatory hotspots at which U2AF2 binding is modulated in vivo, we tested at which binding sites the “expected in vivo signal” given by the model fit differs from the in vivo measurement. We quantified this difference for binding site i and normalized it to the experimental variation to obtain a z-score:
Here, σinvivo is the relative error estimated as the standard deviation of the three in vivo iCLIP replicates. Binding sites are called as regulated in vivo if the difference between model fit and experiment is bigger than the experimental variation (|zi| > 1). The sign of the z-score indicates whether a binding site shows a higher or lower binding affinity in vivo when compared to the in vitro situation (z-score > 1 and z-score < −1, respectively). For more details, see Supplemental Material and Supplemental Figures S6, S7.
Random Forests analysis
Random Forests (RF) machine learning (Breiman 2001) was used to classify binding sites into cleared in vivo (z-score < −1) or stabilized in vivo (z-score > 1). Each binding site was characterized by three types of features in a 99-nt window, comprising k-mers, position-specific scoring matrices (PSSMs) for 120 unique RBPs (Ray et al. 2013), and positional information, such as splice site strength or distance to the next downstream AG. To identify putative U2AF2 regulators, we considered the top 100 features ranked by importance (Supplemental Table S4), which were collapsed into 12 regulatory groups (see Supplemental Material).
Analysis of in vitro iCLIP cofactor assays
To facilitate direct comparisons, reads from each in vitro iCLIP cofactor replicate were down-sampled, normalized to the spike-in control, and converted to “signal-over-background.” For Figure 5B, regulatory categories were assigned according to (1) their model-based in vivo regulation (based on comparison of in vivo and in vitro U2AF2 binding landscapes), and (2) in silico predictions of associated RBP binding sites. Each set was tested against the control group of U2AF2 binding sites without an associated RBP binding site. To validate the HNRNPC-mediated regulation, we compared our results to previously published in vivo U2AF2 iCLIP data from HNRNPC knockdown HeLa cells (Fig. 4C,E; Zarnack et al. 2013). For Figure 7A, we used all U2AF2 binding sites within 600 nt upstream of the 3′ splice site (with the exception of MYL6 exon 6 and PCBP2 exon 12, which harbor only 304 nt and 510 nt of preceding intron, respectively). Further details are given in the Supplemental Material.
RBP knockdowns and in vivo splicing assays
RBPs were depleted from HeLa cells for 48 h using specific siRNAs (Supplemental Table S8). Knockdown efficiency was confirmed using Western blot or quantitative PCR (qPCR). Wild-type and mutated PTBP2 minigenes (Supplemental Table S6) were measured in HeLa cells upon FUBP1 KD or PTBP1/2 double-KD for 48 h.
For in vivo splicing measurements, cDNAs were reverse transcribed from total RNA with oligo(dT)18 primers. Splicing products were measured by amplification with different primer combinations targeting four alternative exons in PTBP2, MYL6, CD55, and PCBP2, and visualization of the products in a 2200 TapeStation system (Agilent) to obtain the molar ratio of each splicing product. Percent spliced in (PSI) in each sample was calculated as
All primers used in these experiments are listed in Supplemental Table S9.
Data access
All data from this study have been submitted to the Gene Expression Omnibus (GEO; https://www.ncbi.nlm.nih.gov/geo/) under accession numbers GSE99688 (in vivo iCLIP), GSE99698 (in vitro iCLIP titration experiments), and GSE99696 (in vitro iCLIP cofactor assays) as part of SuperSeries GSE99700. Custom code used in analysis with input data is available in the Supplemental Data S1 and at https://github.com/StefanieEbersberger/invitro_iCLIP_U2AF65.
Supplementary Material
Acknowledgments
We thank all members of the Legewie and König groups for constant support and discussion. We also acknowledge Christian Renz, Hans-Peter Wollscheid, and Helle Ulrich as well as Kelifa Arab and Christof Niehrs for providing constructs/proteins and helping with recombinant protein purification. We thank René Ketting and Jernej Ule for comments on the manuscript, and we kindly thank members of the IMB Genomics and Bioinformatics Core Facilities for technical assistance and reagents. This work was funded by the German Research Foundation via SPP1935 to J.K. and M.S. (KO 4566/2-1 and Sa 823/10-1, respectively), as well as a joint DFG grant to J.K., S.L., and K.Z. (KO 4566/4-1, LE 3473/2-1, and ZA 881/2-1, respectively).
Author contributions: F.X.R.S. performed all in vivo and in vitro iCLIP experiments as well as validation experiments. S.E. did all bioinformatics analysis of in vivo and in vitro iCLIP data as well as the machine learning analysis. L.H. and S.L. conceived and implemented the binding model. A.B. was responsible for initial data processing of in vivo and in vitro iCLIP data. M.B. performed initial in vitro iCLIP cofactor assays with HNRNPC (C1). H.-S.K. and M.S. performed and analyzed ITC measurements. D.M. and R.B. trained and applied the GraphProt model. J.F. and P.F.S. calculated binding site accessibility scores. J.K. and S.L. conceived and supervised the project. F.X.R.S., S.E., L.H., K.Z., J.K., and S.L. wrote the manuscript with input from all coworkers.
Footnotes
[Supplemental material is available for this article.]
Article published online before print. Article, supplemental material, and publication date are at http://www.genome.org/cgi/doi/10.1101/gr.229757.117.
References
- Agrawal AA, Salsi E, Chatrikhi R, Henderson S, Jenkins JL, Green MR, Ermolenko DN, Kielkopf CL. 2016. An extended U2AF65–RNA-binding domain recognizes the 3′ splice site signal. Nat Commun 7: 10950. [DOI] [PMC free article] [PubMed] [Google Scholar]
- Ashiya M, Grabowski PJ. 1997. A neuron-specific splicing switch mediated by an array of pre-mRNA repressor sites: evidence of a regulatory role for the polypyrimidine tract binding protein and a brain-specific PTB counterpart. RNA 3: 996–1015. [PMC free article] [PubMed] [Google Scholar]
- Barron VA, Zhu H, Hinman MN, Ladd AN, Lou H. 2010. The neurofibromatosis type I pre-mRNA is a novel target of CELF protein-mediated splicing regulation. Nucleic Acids Res 38: 253–264. [DOI] [PMC free article] [PubMed] [Google Scholar]
- Berglund JA, Abovich N, Rosbash M. 1998. A cooperative interaction between U2AF65 and mBBP/SF1 facilitates branchpoint region recognition. Genes Dev 12: 858–867. [DOI] [PMC free article] [PubMed] [Google Scholar]
- Bernhart SH, Hofacker IL, Stadler PF. 2006. Local RNA base pairing probabilities in large sequences. Bioinformatics 22: 614–615. [DOI] [PubMed] [Google Scholar]
- Boucher L, Ouzounis CA, Enright AJ, Blencowe BJ. 2001. A genome-wide survey of RS domain proteins. RNA 7: 1693–1701. [PMC free article] [PubMed] [Google Scholar]
- Boutz PL, Stoilov P, Li Q, Lin CH, Chawla G, Ostrow K, Shiue L, Ares M, Black DL. 2007. A post-transcriptional regulatory switch in polypyrimidine tract-binding proteins reprograms alternative splicing in developing neurons. Genes Dev 21: 1636–1652. [DOI] [PMC free article] [PubMed] [Google Scholar]
- Breiman L. 2001. Random Forests. Mach Learn 45: 5–32. [Google Scholar]
- Buenrostro JD, Araya CL, Chircus LM, Layton CJ, Chang HY, Snyder MP, Greenleaf WJ. 2014. Quantitative analysis of RNA-protein interactions on a massively parallel array reveals biophysical and evolutionary landscapes. Nat Biotechnol 32: 562–568. [DOI] [PMC free article] [PubMed] [Google Scholar]
- Burd CG, Swanson MS, Görlach M, Dreyfuss G. 1989. Primary structures of the heterogeneous nuclear ribonucleoprotein A2, B1, and C2 proteins: a diversity of RNA binding proteins is generated by small peptide inserts. Proc Natl Acad Sci 86: 9788–9792. [DOI] [PMC free article] [PubMed] [Google Scholar]
- Champion-Arnaud P, Reed R. 1994. The prespliceosome components SAP 49 and SAP 145 interact in a complex implicated in tethering U2 snRNP to the branch site. Genes Dev 8: 1974–1983. [DOI] [PubMed] [Google Scholar]
- Coelho MB, Attig J, Bellora N, König J, Hallegger M, Kayikci M, Eyras E, Ule J, Smith CWJ. 2015. Nuclear matrix protein Matrin3 regulates alternative splicing and forms overlapping regulatory networks with PTB. EMBO J 34: 653. [DOI] [PMC free article] [PubMed] [Google Scholar]
- Cook KB, Hughes TR, Morris QD. 2015. High-throughput characterization of protein–RNA interactions. Brief Funct Genomics 14: 74–89. [DOI] [PMC free article] [PubMed] [Google Scholar]
- Duncan R, Bazar L, Michelotti G, Tomonaga T, Krutzsch H, Avigan M, Levens D. 1994. A sequence-specific, single-strand binding protein activates the far upstream element of c-myc and defines a new DNA-binding motif. Genes Dev 8: 465–480. [DOI] [PubMed] [Google Scholar]
- Echeverria GV, Cooper TA. 2014. Muscleblind-like 1 activates insulin receptor exon 11 inclusion by enhancing U2AF65 binding and splicing of the upstream intron. Nucleic Acids Res 42: 1893–1903. [DOI] [PMC free article] [PubMed] [Google Scholar]
- Fu XD, Ares M Jr . 2014. Context-dependent control of alternative splicing by RNA-binding proteins. Nat Rev Genet 15: 689–701. [DOI] [PMC free article] [PubMed] [Google Scholar]
- Fu Y, Huang B, Shi Z, Han J, Wang Y, Huangfu J, Wu W. 2013. SRSF1 and SRSF9 RNA binding proteins promote Wnt signalling-mediated tumorigenesis by enhancing β-catenin biosynthesis. EMBO Mol Med 5: 737–750. [DOI] [PMC free article] [PubMed] [Google Scholar]
- Geuens T, Bouhy D, Timmerman V. 2016. The hnRNP family: insights into their role in health and disease. Hum Genet 135: 851–867. [DOI] [PMC free article] [PubMed] [Google Scholar]
- Gooding C, Roberts GC, Smith CW. 1998. Role of an inhibitory pyrimidine element and polypyrimidine tract binding protein in repression of a regulated α-tropomyosin exon. RNA 4: 85–100. [PMC free article] [PubMed] [Google Scholar]
- Huang SC, Zhang HS, Yu B, McMahon E, Nguyen DT, Yu FH, Ou AC, Ou JP, Benz EJ. 2017. Protein 4.1R exon 16 3′ splice site activation requires coordination among TIA1, Pcbp1, and RBM39 during terminal erythropoiesis. Mol Cell Biol 37: e00446-16. [DOI] [PMC free article] [PubMed] [Google Scholar]
- Huppertz I, Attig J, D'Ambrogio A, Easton LE, Sibley CR, Sugimoto Y, Tajnik M, König J, Ule J. 2014. iCLIP: protein–RNA interactions at nucleotide resolution. Methods 65: 274–287. [DOI] [PMC free article] [PubMed] [Google Scholar]
- Izquierdo JM. 2008. Hu antigen R (HuR) functions as an alternative pre-mRNA splicing regulator of Fas apoptosis-promoting receptor on exon definition. J Biol Chem 283: 19077–19084. [DOI] [PubMed] [Google Scholar]
- Izquierdo JM, Majós N, Bonnal S, Martínez C, Castelo R, Guigó R, Bilbao D, Valcárcel J. 2005. Regulation of Fas alternative splicing by antagonistic effects of TIA-1 and PTB on exon definition. Mol Cell 19: 475–484. [DOI] [PubMed] [Google Scholar]
- Jacob AG, Singh RK, Mohammad F, Bebee TW, Chandler DS. 2014. The splicing factor FUBP1 is required for the efficient splicing of oncogene MDM2 pre-mRNA. J Biol Chem 289: 17350–17364. [DOI] [PMC free article] [PubMed] [Google Scholar]
- Jain N, Lin HC, Morgan CE, Harris ME, Tolbert BS. 2017. Rules of RNA specificity of hnRNP A1 revealed by global and quantitative analysis of its affinity distribution. Proc Natl Acad Sci 114: 2206–2211. [DOI] [PMC free article] [PubMed] [Google Scholar]
- Jens M, Rajewsky N. 2015. Competition between target sites of regulators shapes post-transcriptional gene regulation. Nat Rev Genet 16: 113–126. [DOI] [PubMed] [Google Scholar]
- Keppetipola N, Sharma S, Li Q, Black DL. 2012. Neuronal regulation of pre-mRNA splicing by polypyrimidine tract binding proteins, PTBP1 and PTBP2. Crit Rev Biochem Mol Biol 47: 360–378. [DOI] [PMC free article] [PubMed] [Google Scholar]
- König J, Zarnack K, Rot G, Curk T, Kayikci M, Zupan B, Turner DJ, Luscombe NM, Ule J. 2010. iCLIP reveals the function of hnRNP particles in splicing at individual nucleotide resolution. Nat Struct Mol Biol 17: 909–915. [DOI] [PMC free article] [PubMed] [Google Scholar]
- Kralovicova J, Vorechovsky I. 2017. Alternative splicing of U2AF1 reveals a shared repression mechanism for duplicated exons. Nucleic Acids Res 45: 417–434. [DOI] [PMC free article] [PubMed] [Google Scholar]
- Lambert N, Robertson A, Jangi M, McGeary S, Sharp PA, Burge CB. 2014. RNA Bind-n-Seq: quantitative assessment of the sequence and structural binding specificity of RNA binding proteins. Mol Cell 54: 887–900. [DOI] [PMC free article] [PubMed] [Google Scholar]
- Li H, Wang Z, Zhou X, Cheng Y, Xie Z, Manley JL, Feng Y. 2013. Far upstream element-binding protein 1 and RNA secondary structure both mediate second-step splicing repression. Proc Natl Acad Sci 110: E2687–E2695. [DOI] [PMC free article] [PubMed] [Google Scholar]
- Lorenzin F, Benary U, Baluapuri A, Walz S, Jung LA, von Eyss B, Kisker C, Wolf J, Eilers M, Wolf E. 2016. Different promoter affinities account for specificity in MYC-dependent gene regulation. eLife 5: e15161. [DOI] [PMC free article] [PubMed] [Google Scholar]
- Luo Z, Yang Q, Yang L. 2016. RNA structure switches RBP binding. Mol Cell 64: 219–220. [DOI] [PubMed] [Google Scholar]
- Mackereth CD, Simon B, Sattler M. 2005. Extending the size of protein–RNA complexes studied by nuclear magnetic resonance spectroscopy. ChemBioChem 6: 1578–1584. [DOI] [PubMed] [Google Scholar]
- Mackereth CD, Madl T, Bonnal S, Simon B, Zanier K, Gasch A, Rybin V, Valcarcel J, Sattler M. 2011. Multi-domain conformational selection underlies pre-mRNA splicing regulation by U2AF. Nature 475: 408–411. [DOI] [PubMed] [Google Scholar]
- Martin L, Meier M, Lyons SM, Sit RV, Marzluff WF, Quake SR, Chang HY. 2012. Systematic reconstruction of RNA functional motifs with high-throughput microfluidics. Nat Methods 9: 1192–1194. [DOI] [PMC free article] [PubMed] [Google Scholar]
- Matera AG, Wang Z. 2014. A day in the life of the spliceosome. Nat Rev Mol Cell Biol 15: 108–121. [DOI] [PMC free article] [PubMed] [Google Scholar]
- Maticzka D, Lange SJ, Costa F, Backofen R. 2014. GraphProt: modeling binding preferences of RNA-binding proteins. Genome Biol 15: R17. [DOI] [PMC free article] [PubMed] [Google Scholar]
- Merendino L, Guth S, Bilbao D, Martinez C, Valcarcel J. 1999. Inhibition of msl-2 splicing by Sex-lethal reveals interaction between U2AF35 and the 3′ splice site AG. Nature 402: 838–841. [DOI] [PubMed] [Google Scholar]
- Miro J, Laaref AM, Rofidal V, Lagrafeuille R, Hem S, Thorel D, Méchin D, Mamchaoui K, Mouly V, Claustres M, et al. 2015. FUBP1: a new protagonist in splicing regulation of the DMD gene. Nucleic Acids Res 43: 2378–2389. [DOI] [PMC free article] [PubMed] [Google Scholar]
- Nilsen TW, Graveley BR. 2010. Expansion of the eukaryotic proteome by alternative splicing. Nature 463: 457–463. [DOI] [PMC free article] [PubMed] [Google Scholar]
- Olanich ME, Moss BL, Piwnica-Worms D, Townsend RR, Weber JD. 2011. Identification of FUSE-binding protein 1 as a regulatory mRNA-binding protein that represses nucleophosmin translation. Oncogene 30: 77–86. [DOI] [PMC free article] [PubMed] [Google Scholar]
- Raue A, Kreutz C, Maiwald T, Bachmann J, Schilling M, Klingmüller U, Timmer J. 2009. Structural and practical identifiability analysis of partially observed dynamical models by exploiting the profile likelihood. Bioinformatics 25: 1923–1929. [DOI] [PubMed] [Google Scholar]
- Ray D, Kazan H, Chan ET, Castillo LP, Chaudhry S, Talukder S, Blencowe BJ, Morris Q, Hughes TR. 2009. Rapid and systematic analysis of the RNA recognition specificities of RNA-binding proteins. Nat Biotechnol 27: 667–670. [DOI] [PubMed] [Google Scholar]
- Ray D, Kazan H, Cook KB, Weirauch MT, Najafabadi HS, Li X, Gueroussov S, Albu M, Zheng H, Yang A, et al. 2013. A compendium of RNA-binding motifs for decoding gene regulation. Nature 499: 172–177. [DOI] [PMC free article] [PubMed] [Google Scholar]
- Salmena L, Poliseno L, Tay Y, Kats L, Pandolfi Pier P. 2011. A ceRNA hypothesis: the Rosetta Stone of a hidden RNA language? Cell 146: 353–358. [DOI] [PMC free article] [PubMed] [Google Scholar]
- Saulière J, Sureau A, Expert-Bezançon A, Marie J. 2006. The polypyrimidine tract binding protein (PTB) represses splicing of exon 6B from the β-tropomyosin pre-mRNA by directly interfering with the binding of the U2AF65 subunit. Mol Cell Biol 26: 8755–8769. [DOI] [PMC free article] [PubMed] [Google Scholar]
- Schmiedel JM, Axmann IM, Legewie S. 2012. Multi-target regulation by small RNAs synchronizes gene expression thresholds and may enhance ultrasensitive behavior. PLoS One 7: e42296. [DOI] [PMC free article] [PubMed] [Google Scholar]
- Schwanhäusser B, Busse D, Li N, Dittmar G, Schuchhardt J, Wolf J, Chen W, Selbach M. 2011. Global quantification of mammalian gene expression control. Nature 473: 337–342. [DOI] [PubMed] [Google Scholar]
- Shao C, Yang B, Wu T, Huang J, Tang P, Zhou Y, Zhou J, Qiu J, Jiang L, Li H, et al. 2014. Mechanisms for U2AF to define 3′ splice sites and regulate alternative splicing in the human genome. Nat Struct Mol Biol 21: 997–1005. [DOI] [PMC free article] [PubMed] [Google Scholar]
- Singh R, Banerjee H, Green MR. 2000. Differential recognition of the polypyrimidine-tract by the general splicing factor U2AF65 and the splicing repressor sex-lethal. RNA 6: 901–911. [DOI] [PMC free article] [PubMed] [Google Scholar]
- Soares LMM, Zanier K, Mackereth C, Sattler M, Valcárcel J. 2006. Intron removal requires proofreading of U2AF/3′ splice site recognition by DEK. Science 312: 1961. [DOI] [PubMed] [Google Scholar]
- Sutandy FXR, Hildebrandt A, König J. 2016. Profiling the binding sites of RNA-binding proteins with nucleotide resolution using iCLIP. In Post-transcriptional gene regulation (ed. Dassi E), pp. 175–195. Springer, New York. [DOI] [PubMed] [Google Scholar]
- Taliaferro JM, Lambert NJ, Sudmant PH, Dominguez D, Merkin JJ, Alexis MS, Bazile CA, Burge CB. 2016. RNA sequence context effects measured in vitro predict in vivo protein binding and regulation. Mol Cell 64: 294–306. [DOI] [PMC free article] [PubMed] [Google Scholar]
- Tavanez JP, Madl T, Kooshapur H, Sattler M, Valcárcel J. 2012. hnRNP A1 proofreads 3′ splice site recognition by U2AF. Mol Cell 45: 314–329. [DOI] [PubMed] [Google Scholar]
- Tripathi V, Sixt KM, Gao S, Xu X, Huang J, Weigert R, Zhou M, Zhang YE. 2016. Direct regulation of alternative splicing by SMAD3 through PCBP1 is essential to the tumor-promoting role of TGF-β. Mol Cell 64: 549–564. [DOI] [PMC free article] [PubMed] [Google Scholar]
- Voith von Voithenberg L, Sánchez-Rico C, Kang HS, Madl T, Zanier K, Barth A, Warner LR, Sattler M, Lamb DC. 2016. Recognition of the 3′ splice site RNA by the U2AF heterodimer involves a dynamic population shift. Proc Natl Acad Sci 113: E7169–E7175. [DOI] [PMC free article] [PubMed] [Google Scholar]
- Vuong CK, Black DL, Zheng S. 2016. The neurogenetics of alternative splicing. Nat Rev Neurosci 17: 265–281. [DOI] [PMC free article] [PubMed] [Google Scholar]
- Wang X, Avigan M, Norgren RB Jr. 1998. FUSE-binding protein is developmentally regulated and is highly expressed in mouse and chicken embryonic brain. Neurosci Lett 252: 191–194. [DOI] [PubMed] [Google Scholar]
- Warf MB, Diegel JV, von Hippel PH, Berglund JA. 2009. The protein factors MBNL1 and U2AF65 bind alternative RNA structures to regulate splicing. Proc Natl Acad Sci 106: 9203–9208. [DOI] [PMC free article] [PubMed] [Google Scholar]
- Wongpalee SP, Vashisht A, Sharma S, Chui D, Wohlschlegel JA, Black DL. 2016. Large-scale remodeling of a repressed exon ribonucleoprotein to an exon definition complex active for splicing. eLife 5: e19743. [DOI] [PMC free article] [PubMed] [Google Scholar]
- Wu T, Fu XD. 2015. Genomic functions of U2AF in constitutive and regulated splicing. RNA Biol 12: 479–485. [DOI] [PMC free article] [PubMed] [Google Scholar]
- Wu S, Romfo CM, Nilsen TW, Green MR. 1999. Functional recognition of the 3′ splice site AG by the splicing factor U2AF35. Nature 402: 832–835. [DOI] [PubMed] [Google Scholar]
- Zarnack K, König J, Tajnik M, Martincorena I, Eustermann S, Stévant I, Reyes A, Anders S, Luscombe NM, Ule J. 2013. Direct competition between hnRNP C and U2AF65 protects the transcriptome from the exonization of Alu elements. Cell 152: 453–466. [DOI] [PMC free article] [PubMed] [Google Scholar]
- Zhang J, Chen QM. 2013. Far upstream element binding protein 1: a commander of transcription, translation and beyond. Oncogene 32: 2907–2916. [DOI] [PMC free article] [PubMed] [Google Scholar]
- Zhang Y, Madl T, Bagdiul I, Kern T, Kang HS, Zou P, Mäusbacher N, Sieber SA, Krämer A, Sattler M. 2013. Structure, phosphorylation and U2AF65 binding of the N-terminal domain of splicing factor 1 during 3′-splice site recognition. Nucleic Acids Res 41: 1343–1354. [DOI] [PMC free article] [PubMed] [Google Scholar]
- Zorio DAR, Blumenthal T. 1999. Both subunits of U2AF recognize the 3′ splice site in Caenorhabditis elegans. Nature 402: 835–838. [DOI] [PubMed] [Google Scholar]
- Zuo P, Maniatis T. 1996. The splicing factor U2AF35 mediates critical protein–protein interactions in constitutive and enhancer-dependent splicing. Genes Dev 10: 1356–1368. [DOI] [PubMed] [Google Scholar]
Associated Data
This section collects any data citations, data availability statements, or supplementary materials included in this article.