Abstract
Background:
Flow cytometry analysis is the method of choice for the differential diagnosis of hematologic disorders. It is typically performed by a trained hematopathologist through visual examination of bidimensional plots, making the analysis time-consuming and sometimes too subjective. Here, a pilot study applying genetic algorithms to flow cytometry data from normal and acute myeloid leukemia subjects is described.
Subjects and Methods:
Initially, Flow Cytometry Standard files from 316 normal and 43 acute myeloid leukemia subjects were transformed into multidimensional FITS image metafiles. Training was performed through introduction of FITS metafiles from 4 normal and 4 acute myeloid leukemia in the artificial intelligence system.
Results:
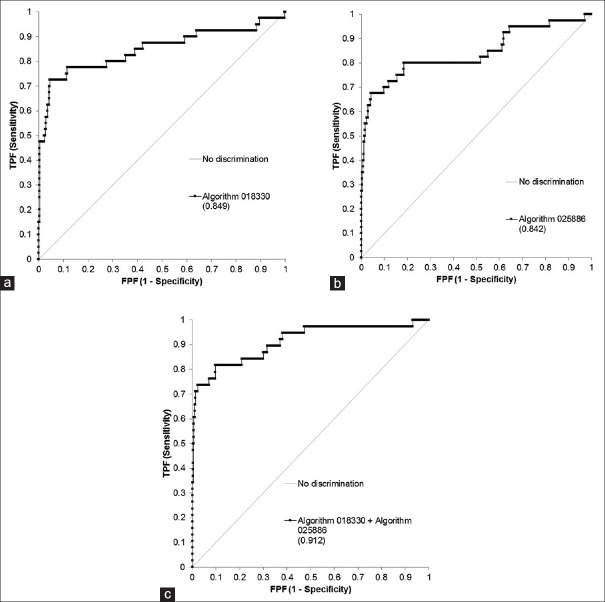
Two mathematical algorithms termed 018330 and 025886 were generated. When tested against a cohort of 312 normal and 39 acute myeloid leukemia subjects, both algorithms combined showed high discriminatory power with a receiver operating characteristic (ROC) curve of 0.912.
Conclusions:
The present results suggest that machine learning systems hold a great promise in the interpretation of hematological flow cytometry data.
Keywords: Flow cytometry, image analysis, leukemia, machine learning
INTRODUCTION
In the last decades, flow cytometry immunophenotyping has become the method of choice for the differential diagnosis of reactive and neoplastic hematologic disorders.[1] Routinely, 3–10 or more single tube combinations of monoclonal antibodies are used to characterize the different cellular populations in a wide range of biological specimens including blood, bone marrow tissue, body fluids, and lymph nodes.[2] This technology can be performed on solid tissues, but a single-cell suspension needs to be prepared previously. The initial step in flow cytometry analysis is data acquisition, where several tens of thousands of cells are measured in a few seconds and stored as very large sets of digitalized data. As an example, a file containing information on six parameters, when performed on 6 × 10⁴ cells, creates a data set containing 3.6 × 10⁵ coded numbers.[3] With the continuous discovery of new cell markers and the trend to more targeted therapies, it is conceivable that these number will increase exponentially. To manage such quantities of data, a computer is physically connected to the flow cytometer, and specialized software handle the digital interface. Through the adjustment of a series of physical conditions by the flow cytometer operator (e.g., voltage and compensation) appropriate acquisition is achieved. The compiled data are usually written and read in the form of the Flow Cytometry Standard (FCS) files, which are organized in the form of a large matrix of intensities over wavelengths versus events.[4] Almost every event will be a single cell, with rare occasional doublets (pairs of cells which pass the laser closely together). For each event, the measured fluorescence intensity indicates the amount of fluorescent-tagged antibodies directed to specific biomarkers, and therefore, a proxy for the amount of such biomarker in one cell. The ultimate interpretation of flow cytometry data is typically performed on a series of two-dimensional plots, where an experienced operator selects subpopulations of interest and interprets distributional patterns through visual examination.[5] The analysis can be time-consuming and subjective, sometimes involving intuition rather than standardized statistical inference. Depending on expertise, a certain cell population can be misidentified, overestimated or underestimated. The problem is compounded by the limited number of tagging fluorophores that can be analyzed simultaneously due to overlapping spectra, although the recent development of mass cytometry may greatly overcome this issue in the future.[6] Finally, there is a cost related side. Medicare reimbursement of each flow cytometry professional interpretation with 16 markers or more (CPT code 88189) was proposed to be $92.6 in 2017.[7]
Although flow cytometry interpretation is generally performed on series of two-dimensional image plots, it should be imagined in a multi-dimensional space where each dimension corresponding to a biological marker. Thus, every sample could be projected onto an n-dimensional space where each dimension is represented by a specific antigen. This fact encouraged researchers in search of mathematical analyses that can scale highly multidimensional data without significant impact on computation time.[8] Among these are cluster analysis,[9] principal component analysis,[10] and support vector machines.[11]
Genetic programming is a framework for the development of executable programs using evolutionary computing methods.[12] It relies on flexible optimization methods inspired by the theory of evolution of natural systems. Many different problems from different domains have been successfully tackled using evolutionary computing including routing of telecommunications networks,[13] design of protein sequences,[14] and image-processing tasks such as edge detection, film restoration, face recognition, and Earth-observing satellite multispectral data.[15] Multispectral image analysis and feature extraction coupled to evolutionary computing have been tested on microscopic images from histologic sections of ovarian serous carcinoma[16] and urine cytology specimens with urothelial carcinoma.[17]
The present study describes a method for the interpretation of flow cytometry data applying genetic algorithms.
Methods
Flow cytometry data procurement
FCS files were downloaded from dataset #FR-FCM-ZZYA (AML, FlowCAP II), currently maintained in the public website www.flowrepository.org.[18] The dataset identifies each patient with a number and the assignment “normal” or “AML.” For each patient, there are eight FCS files, which correspond to acquisitions from eight separate tubes containing specified antibody combinations (tube #1 is an isotype control and #8 is unstained).
Transformation of Flow Cytometry Standard files into Tagged Image File Format (TIFF) file folders
Flow cytometry data contained in FCS files was transformed into TIFF image files and stored in individual folders (one per patient) using R freeware with addition of “prada” library,[19] “tiff” library[20] and the following command script:
>sampdat <-readFCS(“\\Users\\Desktop\\FlowRepository_aml\\A.fcs”)
>fdat <-exprs (sampdat)
>tiff (filename=“\\Users\\Desktop\\aml_secondbatch\\benign\\temp.tif”, width=553, height=552)
>plot (fdat [, “D”], fdat[, “E”], pch=”.”, xlab=””, ylab=””, log=”y”, axes=NULL)
>dev.off()
>img<readTIFF(“\\Users\\Desktop\\aml_secondbatch\\benign\\temp.tif”, native=TRUE)
>writeTIFF (img, “\\Users\\Desktop\\aml_secondbatch\\benign\\B\\B_C.tif”, compression=c(“none”), reduce=TRUE)
where,
“A” defines the flow cytometry tube in the patient dataset,
“B” is the patient number in the repository,
“C” is an assigned sub index that identifies each TIFF file in the right sequential order,
“D” and “E” selects the flow cytometry channels in the tube.
Each folder contained six two-dimensional TIFF image files in the following sequential order:
TIFF image file #0: CD34-PC5 vs Forward Scatter
TIFF image file #1: CD117-PE vs Forward Scatter
TIFF image file #2: CD45-ECD vs Forward Scatter
TIFF image file #3: CD117-PE vs HLA DR-FITC
TIFF image file #4: CD117-PE vs CD34-PC5
TIFF image file #5: CD20-PC7 vs Forward Scatter.
Transformation of TIFF files into Flexible Image Transport System metafiles
The grayscale TIFF image files contained in each patient folder were stacked together into six-dimensional image cube metafiles where each data plane pixel of x, y location is aligned in a third dimension z. This was achieved by transforming the TIFF image files into one Flexible Image Transport System (FITS) metafile using Interactive Data Language (IDL) 5.6 (Research Systems, Inc., Boulder CO) software. FITS files are a standardized data format widely used in astronomy for the analysis of hyperspectral images.[21] A FITS metafile consists of a sequence of one or more Headers and Data Units. A header is composed of ASCII card images usually read in a string array variable. The header describes the content of the associated data unit, which might be a spectrum, and image or tabular data in ASCII or binary format.
Training
An overview of the process is summarized in Figure 1. FITS metafiles were transformed into training files by means of the graphical user interface ALADDIN.[22] ALADDIN allows the user to manually create training files by assigning the “true” or “false” condition to selected areas of the image cube using the region of interest selection tool. The training files were then introduced in the LINUX version of GENIE.[23,24] Before starting the training process, the evolutionary parameters were set as follows: number of algorithms per generation: 40; maximum number of genes in each algorithm: 20; allowed number of generations: 350; backend classifier: Fisher; crossover mechanism: single point; crossover rate: 0.9; crossover type: standard; elite fraction: 0.1; fitness metric: Hamming; mutation parameter rate: 0.3; mutation rate: 0.6; selection method: Tournament 3; thresholding: intelligent.
Figure 1.
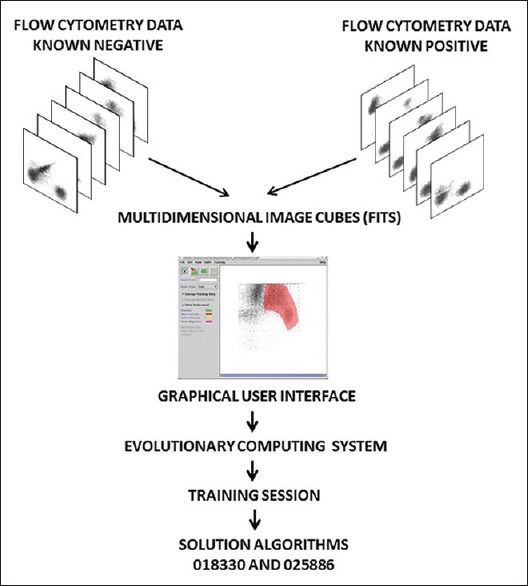
Experimental design. Training: Six bi-dimensional flow cytometry plots obtained from normal patients and acute myeloid leukemia patients were stacked together into Flexible Image Transport System image cubes. Specific regions of the cube were assigned the “feature” or “nonfeature” condition by mean of a graphical user interface and introduced into the evolutionary computing system that generates a linear mathematical algorithm with highest fitness to the training cohort
Two separate training sessions were run using four FITS files from acute myeloid leukemia patients (the first four listed in the repository corresponding to patients 5, 7, 9 and 26) and four FITS files from normal patients (the first four listed in the repository corresponding to patients 1, 2, 3, and 4).
In one training session, the right halves of the image cubes from acute myeloid leukemia patients were assigned “true” or “feature” condition, while the right halves of the image cubes from normal patients were selected as “false” or “nonfeature.” A second training session was run using the same four FITS files as the first session, but inverting the selection, meaning that the right halves of the image cubes from acute myeloid leukemia patients were assigned “false” or “nonfeature” condition and the right halves of the image cubes from normal patients were assigned “true” or “feature” condition.
Testing
Testing was performed by applying the learned algorithms to FITS metafiles of the testing cohort. The results are expressed in the form of binary image arrays where each pixel is assigned value 1 or “true” and 0 or “false” by the algorithm. The performance of each algorithm can be estimated by observation of the result images. Quantification of the results was also attempted by calculating the number of pixels assigned value 1 by the algorithm or combination of algorithms, using IDL®.
Statistical analysis
Receiver operator characteristics (ROC) curves were created in Excel Analyze-it software® (Leeds, UK). Combined sensitivity and specificity were calculated using increasing levels of numerical cutoff value.
RESULTS
Training
The first training session was run to generate an algorithm that identifies the right half portion of the image cubes from acute myeloid leukemia patients as “true.” After 350 iterations, GENIE produced the best algorithm coined “018830” with fitness for the training set of 830.126, where 1000 represents perfect fitness.
The sequence of algorithm 018830 is:
[MEAN rD2 wS1 2 1] [IFLTE rD3 rD4 rD4 rS1 wS2] [ADDP rS2 rD2 wS0] [MEAN rD3 wS2 4 3] [IFLTE rS2 rD0 rD3 rS0 wS1] [QTREG rS1 wS2 wS0 wS1 0.04] [QTREG rD0 wS0 wS3 wS1 0.07] [RANGE rS2 wS0 7 3] [ASF_CLOP rS2 wS1 7 3] [DILATE rS3 wS2 10 6].
Algorithm 018830 is a combination of four neighborhood operators (Mean, Range, Dilate and Alternating Sequential Filter Close/Open), one logical operator (If Less Than Else), one basic mathematical operator (Add Planes) and one region size related statistical operator (QTREG).
Every operation in the sequence appears sequentially listed between brackets. For instance, the first operator MEAN reads data plane 2 (CD45 vs. Forward Scatter) and smooths the data plane with a round (structure element specified by the number 1 at the end of the gene) 2 × 2 kernel (specified by the preceding number 2). The resulting data plane is written in scratch plane S1. Finally, a Fisher Discriminant[25] applies a linear combination of the scratch planes followed by a threshold to produce the binary answer plane.
The second training session was run to generate an algorithm that identifies the right half portion of the image cubes from normal patients as “true.” After 350 iterations, GENIE produced the best algorithm coined “025886” with fitness for the training set regions of 870.188.
The sequence of algorithm 025886 is:
[QTREG rD0 Ws2 wS1 wS0 0.05] [ASF_CLOP Rs2 Ws2 10 4] [ERODE rD1 wS0 4] [ASF_CLOP rS0 wS0 10 0] [OPENCLOSE rS2 wS2 7 0] [SOBELGRAD rD5 wS1] CLOSEOPEN rS1 wS1 9 0].
Algorithm 025886 is a combination of one region size related statistical operator (QTREG) and four neighborhood operators (Alternating Sequential Filter Close/Open, OpenClose, Erode and Sobelgradient).
For a more detailed description, Supplementary Text 1 (150.6KB, pdf) lists the IDL code of the operators used by both algorithms.
Testing
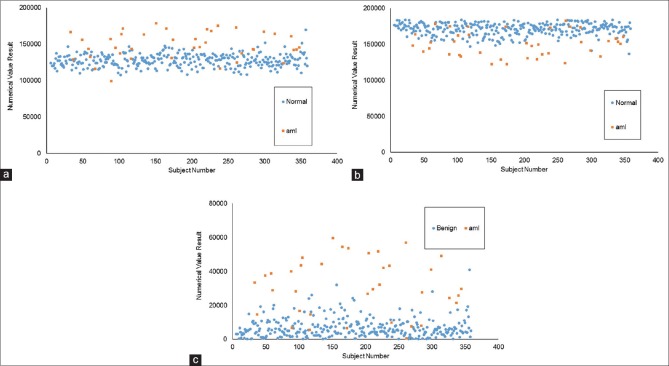
FITS metafiles obtained from all patients in the repository (except those used in the training session) were used for testing. It consisted 312 normal patients and 39 acute myeloid leukemia patients. The algorithms assign a weighted value from 0 to 255 to every pixel of the GENIE result image, which is then reduced to a binary array by a thresholding parameter. Representative examples of result images obtained after applying algorithms 018330 and 025866 to testing patients are shown in Figure 2. Result images from all testing patients using algorithms 018330 and 025866 can be seen in Supplementary Figures 1 (3.6MB, pdf) and 2 (3.2MB, pdf) , respectively. Algorithm 018330, applied to FITS metafiles from most acute myeloid leukemia patients, generates binary images with a larger proportion of white (feature) pixels on the right side when compared to normal patients, which show a higher proportion of black (nonfeature) pixels on that area. This is consistent with the fact that algorithm 018330 was trained using the right half of the training FITS metafiles. This was done to facilitate a more coherent algorithm, focused on fewer number or less contradictory features. As expected, algorithm 018330 underperforms on those areas of the FITS metafiles that had never been exposed to, such as the left half and the area of the background that surrounds the flow cytometry plot. On the other hand, algorithm 025866, applied to FITS metafiles from acute myeloid leukemia subjects, results in a larger proportion of black pixels on the right side. Within the IDL® environment, the left side of the result images was masked and the total number of white pixels used as a measure of category assignment (normal vs. AML). The image results of every subject generated by each algorithm were also combined, to mask those pixels in the array that were classified as “feature” by both 018330 and 025866. The underlying process is exemplified in Figure 3 for one normal and one AML subject. The numerical results of the entire testing cohort for algorithms 018330 alone, 025866 alone and both algorithms combined can be seen in Figure 4a-c], respectively. When the numerical data are used to differentiate between acute myeloid leukemia and normal patients, algorithm 018330 alone achieves an area under the ROC curve of 0.849 [Figure 5a], while in algorithm 025866 alone is of 0.842 [Figure 5b]. Both algorithms combined produced an area under the ROC curve of 0.912 [Figure 5c].
Figure 2.
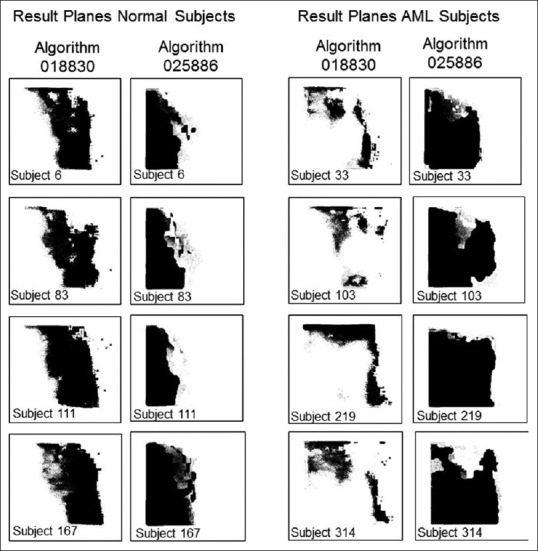
Representative result planes obtained by applying mathematical algorithms 018330 and 025886 to flow cytometry Flexible Image Transport System files from normal subjects #6, #83, #11 and #167 (left) and acute myeloid subjects #33, #103, #219 and #314. Result planes from all normal and acute myeloid leukemia subjects are shown in Supplementary Figures 1 (3.6MB, pdf) and 2 (3.2MB, pdf) , respectively
Figure 3.
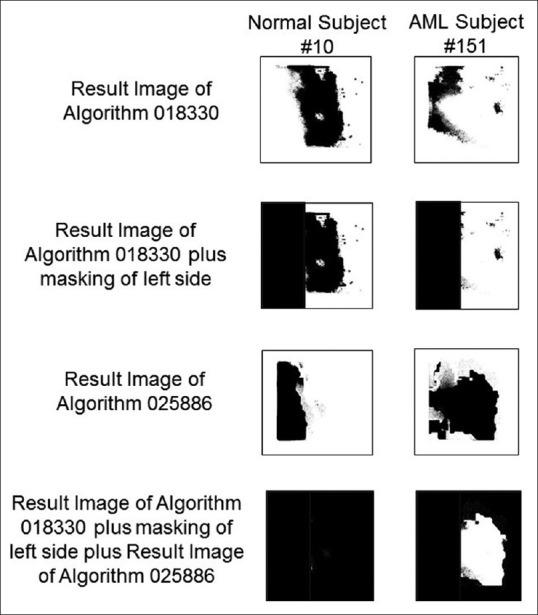
Image result processing to quantify the performance of algorithms 018330 and 025886. Normal subject #10 (left) and acute myeloid leukemia subject #151 (right) are as examples. The first step consists of applying algorithm 018330 to a Flexible Image Transport System metafile, creating a result image shown on top. The second step consists of masking the left side of those result images (that corresponds to an area in the Flexible Image Transport System metafile that had never been seen by the algorithms). In Step 3, algorithm 025886 is applied to the same original Flexible Image Transport System metafile. Lastly, those pixels classified as “feature” by both algorithms 018330 and 025866 are masked
Figure 4.
Quantification of result images generated by algorithm 018330 alone (a), algorithm 025886 alone (b) and both algorithms combined (c) in 312 normal patients and 39 acute myeloid leukemia subjects
Figure 5.
Receiver operating characteristics curve of algorithm 018330 alone (a), algorithm 025886 alone (b) and both algorithms combined (c) in 312 benign patients and 39 acute myeloid leukemia subjects
Discussion
The present study describes a novel approach in the analysis and interpretation of flow cytometry data using genetic algorithms. Here, the Linux version of GENIE[23] was used to classify flow cytometry data from normal patients and acute myeloid leukemia patients. The learning process follows the classic evolutionary paradigm: a population of candidate image-processing linear algorithms is randomly generated, and the fitness of each individual assessed. After fitness has been assigned, modification of the fittest members of the population follows via selection, crossover and mutation and the step is repeated.[26] Fitness evaluation and reproduction with modification are iterated until some stopping condition is satisfied (for example, a candidate solution reaching a predetermined score is found). The system relies on commercially available IDL® software for the more computationally intensive fitness evaluation. One advantage of genetic algorithms is that in general, they do not require additional measures to reduce data dimensionality as it happens to other computer learning systems such as support vector machines.[27] The process makes the use of a graphical user interface, which facilitates the hematopathologist-machine interaction, and in this way, specific areas of the multidimensional space could be oriented and/or selected by the operator for training.
Using a small training cohort of eight cases (four normal patients and four acute myeloid leukemia patients), the artificial intelligence system was capable of classifying a cohort of 351 patients (312 normal and 39 acute myeloid leukemia) with an area under the receiver characteristics curve of 0.912.
Although the distinction between these two conditions is not considered a challenging problem for the practicing hematopathologist most of the time, testing it on a less disputable task provides a more suitable introduction of the technique.
The potential impact that the varying technical conditions used by different laboratories may have on the efficiency of a given algorithm is not known. One common limitation of genetic algorithms is their tendency to overfitting, which stresses the importance of a careful selection of training features. Furthermore, the algorithms are dimensionally restricted, which means that the future incorporation of new markers to the panel may need that the system be re-trained. The learning application carries out its classification, not in a context of disease or population identification, but rather spectral/spatial image analysis requiring a way to translate it back for clinical usefulness. Here, the number of pixels classified by the machine as “feature” was intuitively counted to “measure” the results. However, other characteristics in the result planes may prove in the future to be more efficient for each specific task. One should also consider that the image processing operators (or genes) available to the algorithm were originally created for remote-sensing applications. More appropriate mathematical operators can presumably be written in IDL or C, and implemented within this environment.
The cases used here fit only into two categories (AML and normal), when hematopathology practice most commonly involves multi-class decision making. This is a common problem of most artificial intelligence systems, in that they infer binary solutions. Multi-class resolution is usually achieved through decomposition into binary classification steps, in the form of “one versus all (winner takes all)” or one versus one (max wins voting),” and this requires the development of complex hierarchical structures. It is possible that the algorithms described here could misclassify when faced with an unintended tasks. An example would be for algorithm 018330 to classify cases of acute lymphoblastic leukemia as “acute myeloid leukemia present.” This problem could be resolved by generating a second algorithm that differentiates between these two entities.
The original flow cytometry data were obtained running the standard lymphoma/leukemia 24 marker panel which does not include myeloperoxidase. The inclusion of such marker could probably increase the efficiency of the assay, although this needs to be proven. In theory, the system does not intend to identify a population positive for one or more markers (such as CD34 or CD117) but to score a multidimensional composite. For example, based on reading the sequences, algorithm 018830, trained to look for acute myeloid leukemia patients, makes use of all markers in some way (every data plane except D1). Meanwhile algorithm 025886, trained to look for normal subjects, uses data planes with only CD34, CD117, CD20 and forward scatter information only (D0, D1, and D5).
It remains to be addressed what are the capabilities of this technique in the accurate detection of intermediate states such as myelodysplastic syndromes or the assessment of posttreatment minimal residual disease. The incorporation of cell density information in addition to population distribution may be useful in the task. The images generated by the R-Prada platform in this study lack pixel depth (meaning every pixel is 0 or 1). This is because hematopathologists routinely use 1-bit format imagery to interpret the data. However, it is conceivable cell density information in the form of grayscale data could be clinically useful. The common 16-bit image file conveys a dynamic range of 65,535.[28]
Some possible ways to improve the performance of this model are permitted. One option involves retraining a new algorithm with increasing number of training files, perhaps selecting examples containing features that were missed by the preceding algorithm. Acute myeloid leukemia is known to show high variability of antigenic expression depending on lineage and differentiation,[29] which may require the use of more than just one algorithm. As shown in this manuscript, two separate algorithms, trained to perform opposite tasks, were later combined using a simple logical script written in IDL, increasing the accuracy over the testing cohort. This brings up the possibility of developing “cognizant” algorithms capable of classifying over FITS metafiles built from result images of lower-order algorithms, trained on specific features (abstract thinking).
In the recent years, there has been a surge in the development of diverse computational methods applicable to flow cytometry data. A good example of this effort is represented by the “Flow Cytometry: Critical Assessment of Population Identification Methods (FlowCAP) project,” where different methods are compared through specific challenges.[30] One of these challenges, termed FlowCAP-II, involved the identification of cell populations that can discriminate between acute myeloid leukemia positive (n = 43) and healthy donor (n = 316) patients. That same flow cytometry data were used for this study. In the FlowCAP-II challenge, 25 different algorithms were tested, showing F-measures between 0.46 and 1.00. However, it is not known how these would perform under more robust statistical evaluation such as ROC analysis. In the FlowCAP-II study, half of the total data was used for training purposes, whereas in this pilot work, the training cohort represents approximately 2% of the patients.
The flow cytometry data from normal and acute myeloid patients used in this work were obtained through the public web-based https://www.flowrepository.org. This website, provided by The International Society for Advancement of Cytometry, supports the storage, annotation, analysis, and sharing of flow cytometry datasets.[31] The datasets are annotated in compliance with the Minimum Information about Flow Cytometry Experiment (MIFlowCyt) standard, which greatly facilitates third-party interpretation of the data. The dataset used in this study (FR-FCM-ZZYA) has a MIFlowCyt score of 97.12%. Research studies, like the one presented here, reaffirm the notion that sharing flow cytometry data through web-based public repositories allows for the exploration of alternative approaches, perhaps not previously envisioned by the original publisher, and this should be strongly encouraged.
CONCLUSION
The present work describes a method that applies evolutionary machine learning with genetic algorithms to the interpretation of flow cytometry data. The results from an initial attempt with flow cytometry data from normal and acute myeloid leukemia patients showed great discriminative power and hold great promise.
Financial support and sponsorship
Nil.
Conflicts of interest
There are no conflicts of interest.
Footnotes
Available FREE in open access from: http://www.jpathinformatics.org/text.asp?2018/9/1/16/230769.
REFERENCES
- 1.Virgo PF, Gibbs GJ. Flow cytometry in clinical pathology. Ann Clin Biochem. 2012;49:17–28. doi: 10.1258/acb.2011.011128. [DOI] [PubMed] [Google Scholar]
- 2.Adan A, Alizada G, Kiraz Y, Baran Y, Nalbant A. Flow cytometry: Basic principles and applications. Crit Rev Biotechnol. 2017;37:163–76. doi: 10.3109/07388551.2015.1128876. [DOI] [PubMed] [Google Scholar]
- 3.Costa ES, Arroyo ME, Pedreira CE, García-Marcos MA, Tabernero MD, Almeida J, et al. Anew automated flow cytometry data analysis approach for the diagnostic screening of neoplastic B-cell disorders in peripheral blood samples with absolute lymphocytosis. Leukemia. 2006;20:1221–30. doi: 10.1038/sj.leu.2404241. [DOI] [PubMed] [Google Scholar]
- 4.Dean PN, Bagwell CB, Lindmo T, Murphy RF, Salzman GC. Introduction to flow cytometry data file standard. Cytometry. 1990;11:321–2. doi: 10.1002/cyto.990110302. [DOI] [PubMed] [Google Scholar]
- 5.Wood BL, Arroz M, Barnett D, DiGiuseppe J, Greig B, Kussick SJ, et al. 2006 bethesda international consensus recommendations on the immunophenotypic analysis of hematolymphoid neoplasia by flow cytometry: Optimal reagents and reporting for the flow cytometric diagnosis of hematopoietic neoplasia. Cytometry B Clin Cytom. 2007;72(Suppl 1):S14–22. doi: 10.1002/cyto.b.20363. [DOI] [PubMed] [Google Scholar]
- 6.Di Palma S, Bodenmiller B. Unraveling cell populations in tumors by single-cell mass cytometry. Curr Opin Biotechnol. 2015;31:122–9. doi: 10.1016/j.copbio.2014.07.004. [DOI] [PubMed] [Google Scholar]
- 7.Fiegl C. Medicare revises 2017 discount on add-on codes. CAP Today. 2016;30:8. [Google Scholar]
- 8.Lugli E, Roederer M, Cossarizza A. Data analysis in flow cytometry: The future just started. Cytometry A. 2010;77:705–13. doi: 10.1002/cyto.a.20901. [DOI] [PMC free article] [PubMed] [Google Scholar]
- 9.Murphy RF. Automated identification of subpopulations in flow cytometric list mode data using cluster analysis. Cytometry. 1985;6:302–9. doi: 10.1002/cyto.990060405. [DOI] [PubMed] [Google Scholar]
- 10.Klinke DJ, 2nd, Brundage KM. Scalable analysis of flow cytometry data using R/Bioconductor. Cytometry A. 2009;75:699–706. doi: 10.1002/cyto.a.20746. [DOI] [PMC free article] [PubMed] [Google Scholar]
- 11.Toedling J, Rhein P, Ratei R, Karawajew L, Spang R. Automated in silico detection of cell populations in flow cytometry readouts and its application to leukemia disease monitoring. BMC Bioinformatics. 2006;7:282. doi: 10.1186/1471-2105-7-282. [DOI] [PMC free article] [PubMed] [Google Scholar]
- 12.Mitchell M. Cambridge, Mass: MIT Press; 1999. Genetic algorithms: An overview In:An Introduction to Genetic Algorithms; pp. 1–34. [Google Scholar]
- 13.Cox L, Davis L, Qiu Y. Dynamic anticipatory routing in circuit-switched telecommunications networks. In: Davis L, editor. Handbook of Genetic Algorithms. New York: Van Norstrand Reinhold; 1991. pp. 124–43. [Google Scholar]
- 14.Dandekar T, Argos P. Potential of genetic algorithms in protein folding and protein engineering simulations. Protein Eng. 1992;5:637–45. doi: 10.1093/protein/5.7.637. [DOI] [PubMed] [Google Scholar]
- 15.Bandyopadhyay S, Pal SK. Pixel classification using variable string genetic algorithms with chromosome differentiation. IEEE Trans Geosci Remote Sens. 2001;39:303–8. [Google Scholar]
- 16.Rizzardi AE, Johnson AT, Vogel RI, Pambuccian SE, Henriksen J, Skubitz AP, et al. Quantitative comparison of immunohistochemical staining measured by digital image analysis versus pathologist visual scoring. Diagn Pathol. 2012;7:42. doi: 10.1186/1746-1596-7-42. [DOI] [PMC free article] [PubMed] [Google Scholar]
- 17.Angeletti C, Harvey NR, Khomitch V, Fischer AH, Levenson RM, Rimm DL, et al. Detection of malignancy in cytology specimens using spectral-spatial analysis. Lab Invest. 2005;85:1555–64. doi: 10.1038/labinvest.3700357. [DOI] [PubMed] [Google Scholar]
- 18.Spidlen J, Breuer K, Rosenberg C, Kotecha N, Brinkman RR. FlowRepository: A resource of annotated flow cytometry datasets associated with peer-reviewed publications. Cytometry A. 2012;81:727–31. doi: 10.1002/cyto.a.22106. [DOI] [PubMed] [Google Scholar]
- 19. [Last accessed on 2017 Nov 16]. Available from: https://www.bioconductor.org/packages/release/bioc/html/prada.html .
- 20. [Last accessed on 2017 Nov 16]. Available from: http://www.rforge.net/tiff/files/
- 21. [Last accessed on 2017 Nov 16]. Available from: https://www.fits.gsfc.nasa.gov/fits_primer.html .
- 22.Brumby SP, Harvey NR, Perkins S, Porter RB, Szymanski JJ, Theiler J, et al. A genetic algorithm for combining new and existing image processing tools for multispectral imagery. Proc SPIE. 2000;4049:1–11. [Google Scholar]
- 23.Perkins S, Theiler J, Brumby SP, Harvey NR, Porter RB, Szymanski JJ, et al. GENIE – A hybrid genetic algorithm for feature classification of multi-spectral images. Proc SPIE. 2000;4120:52–62. [Google Scholar]
- 24. [Last accessed on 2017 Nov 16]. Available from: http://www.genie.lanl.gov//
- 25.Fukunaga K. Linear classifier design.In: Werner R, editor. Introduction to Statistical Pattern Recognition. Linear classifier design In: Werner R, editor Introduction to Statistical Pattern Recognition 2nd ed Ch 43 San Diego: Academy Press; 1990 p 131-6. [Google Scholar]
- 26.Holland JR. 1st ed. Cambridge Mass: MIT Press; 1992. Adaptation in Natural and Artificial Systems: An Introductory Analysis with Applications to Biology, Control and Artificial Intelligence. [Google Scholar]
- 27.Zhang D, Xiao J, Zhou N, Zheng M, Luo X, Jiang H, et al. Agenetic algorithm based support vector machine model for blood-brain barrier penetration prediction. Biomed Res Int. 2015;2015:292683. doi: 10.1155/2015/292683. [DOI] [PMC free article] [PubMed] [Google Scholar]
- 28.Larobina M, Murino L. Medical image file formats. J Digit Imaging. 2014;27:200–6. doi: 10.1007/s10278-013-9657-9. [DOI] [PMC free article] [PubMed] [Google Scholar]
- 29.Peters JM, Ansari MQ. Multiparameter flow cytometry in the diagnosis and management of acute leukemia. Arch Pathol Lab Med. 2011;135:44–54. doi: 10.5858/2010-0387-RAR.1. [DOI] [PubMed] [Google Scholar]
- 30.Aghaeepour N, Finak G, FlowCAP Consortium, DREAM Consortium, Hoos H, Mosmann TR, et al. Critical assessment of automated flow cytometry data analysis techniques. Nat Methods. 2013;10:228–38. doi: 10.1038/nmeth.2365. [DOI] [PMC free article] [PubMed] [Google Scholar]
- 31.Spidlen J, Breuer K, Brinkman R. Preparing a minimum information about a flow cytometry experiment (MIFlowCyt) compliant manuscript using the International Society for Advancement of Cytometry (ISAC) FCS file repository (FlowRepository.org) Curr Protoc Cytom. 2012;61:10. doi: 10.1002/0471142956.cy1018s61. 18.1-18.26. [DOI] [PubMed] [Google Scholar]
Associated Data
This section collects any data citations, data availability statements, or supplementary materials included in this article.


