Abstract
At concentrated electrolytes, the ion-ion electrostatic correlations effect is considered an important factor in electrokinetics. In this paper, we compute, in theory and simulation, the dipole moment for a spherical particle (charged, dielectric) under the action of an alternating electric field using the modified continuum Poisson-Nernst-Planck (PNP) model by Bazant et al. (Phys. Rev. Lett. 106, 2011).1 We investigate the dependency of the dipole moment in terms of the frequency and its variation with such quantities like zeta potential, electrostatic correlation length, and double layer thickness. With thin electric double layers, we develop simple models through performing an asymptotic analysis to the modified PNP model. We also present numerical results for an arbitrary Debye screening length and electrostatic correlation length. From the results, we find a complicated impact of electrostatic correlations on the dipole moment. For instance, with increasing the electrostatic correlation length, the dipole moment decreases and reaches a minimum, and then it goes up. This is because of initially decreasing of surface conduction and its finally increasing due to the impact of ion-ion electrostatic correlations on ion’s convection and migration. Also, we show that in contrast to the standard PNP model, the modified PNP model can qualitatively explain the data from the experimental results in multivalent electrolytes.
Graphical abstract
Introduction
Dielectrophoresis (DEP) becomes a promising technique for managing and manipulating particles in particle separation, particle assembly, and characterizing biomolecules.2–6 DEP can also be used to measure the magnitude and direction of particles’ forces.7,8 The DEP device cost is low, making it convenient for lab-on-a-chip systems. DEP finds important applications in different areas of the medical field or water managment.9–15
When a nonuniform electric field exists, a polarized particle tends to move so that it reaches to the base of the extreme electric field, which defines the DEP.7,8 The dipole moment can specify the direction and magnitude of the motion. When the ratio between the particle size and the characteristic length of the electric field is small, the dipole moment can estimate the DEP force. In electrolyte, the charged surface of the particle results in an electric double layer (EDL) with excess counterions. The external electric field in the electrolyte can affect the counterions as well, 16,17 causing them to migrate and induce an electro-osmotic flow. The double layer can be polarized with two kinds of mechanisms: migration and convection. This polarization can, in turn, redistribute the charge along the particle, resulting in the high-frequency dispersion. This charge redistribution inside the double layer can be approximated by a dipole moment. The migration and convection also create a bulk concentration gradient by repelling ions from the double layer and attracting ions into the double layer at various sides of the particle. At a frequency lower than the diffusion frequency, ions diffuse back in a direction opposite to the migration and/or convection. The dipole moment can be modified by the bulk diffusion as well, which leads to the low-frequency dispersion.
Basically, the dipole moment can be obtained from the classical Poisson-Nernst-Planck (PNP) equations. These equations deal with migration, convection, and diffusion and the dipole moment has been calculated for spherical,18–29 cylindrical,30, 31 soft,32 and porous particles.33 The standard PNP model can capture different frequency dispersions. A favorable agreement of the experimental results on the double-strand DNA molecules polarization in dilute solutions with the theoretical results from the PNP model has been obtained.31,33
In addition, under the thin EDL assumption, the surface conduction approximates the migration and convection. The PNP model can be reduced to a simple Maxwell-Wagner-O’konski (MWO) model.34 In this model diffusion does not take into consideration. Hence, it can only predict the high-frequency dispersion. To account for the diffusion, within the thin quasi-equilibrium EDL assumption, another simple theory named the Dukhin-Shilov (DS) model can be deduced from the PNP model and successfully captured the low-frequency dispersion.35, 36 In general, when the EDL is assumed to be thin, the combination of the MWO and DS models can adequately describe the polarization process.
Although the estimations from the standard PNP model are in fairly agreements with experiments, often, they underestimated the dipole moment amplitude.37–40 For example, recent experiments on estimating the tension inside actin filaments induced by the DEP suggest that this tension force is higher than the one obtained by the PNP model in a condensed electrolyte.6 In addition, in the existence of multivalent ions, the standard PNP model even cannot qualitatively predict the experimental results. For example, with divalent counterions (Mg2+), experiments showed that λ-DNA experienced negative DEP instead of positive DEP as with monovalent ions as estimated by the standard PNP model.41 In another set of experiments, in the presence of Ca2+, the DNA orientation anisotropy under the operation of the electric field, related to the polarizability, increased and then decreased as the concentration of Ca2+ increases.42 Again, this nonmonotonic relationship cannot be achieved through the standard PNP model. Similarly, experiments on electrophoresis of colloidal particles also observed mobility reversal at high salts and in multivalent electrolytes that again cannot be even qualitatively captured by the standard model.43–46
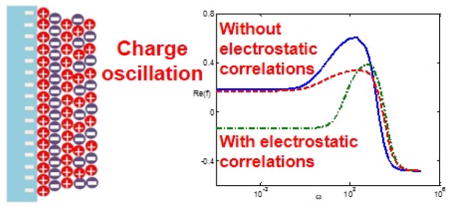
It is recognized that a phenomenon called overscreening exists in concentrated electrolytes and is prominent in the existence of multivalent ions.47 For overscreening, the first layer with excess counterions close the charged surface excessively compensates the charge of surface and results in a new layer with excess coions, which leads to one more separate layer of charge. This process continues until the charge is totally neutralized. This charge oscillation inside EDL is attributed to Coulomb short-range electrostatic correlations.48,49 Recently, to capture the electrostatic correlations, Bazant et al proposed a simple continuum model, Landau-Ginzburg-type. 1 The impact of the electrostatic correlations is included into the free energy using Cahn-Hilliard-gradient set expansions. By letting the free energy being minimal, a fourth-order modified Poisson equation was derived that can capture overscreening. Due to the simplicity of this model, it can be implemented numerically for electrokinetics. Indeed, this model was able to predict the electro-osmotic flow reversal near a flat surface50 and electrophoretic mobility reversal.51
Consider the significant discrepancies of the dipole moment between the predictions and experimental results in concentrated multivalent electrolytes and highly charged particles, where overscreening is most likely to happen. It is worthwhile to investigate the impact of electrostatic correlations on the dipole moment. Besides, if we assume a thin double layer thickness, we can also extend the standard MWO and DS models to account for the electrostatic correlations. These models can provide a simpler theoretical tool to understand and design experiments.
The outline of this article is mentioned here. The modified PNP model considering for electrostatic correlations as well as a perturbation theory are introduced first, respectively. Then the dipole moments for both high-frequency and low-frequency regimes, assuming that the double layer thickness is small, are derived, followed by the results and discussion. Finally, we conclude the paper.
The Modified Poisson-Nernst-Planck Model
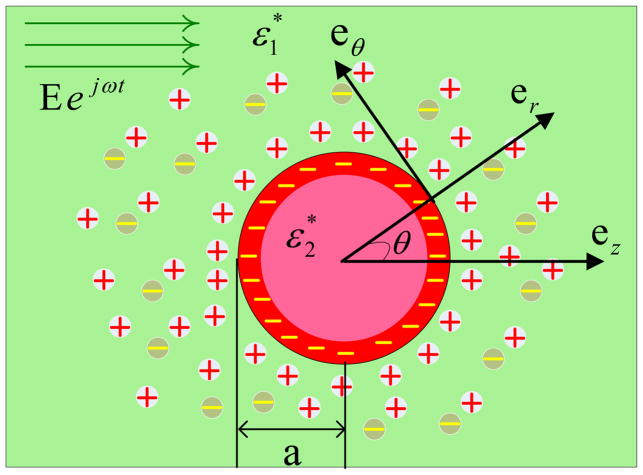
Fig. 1 depicts a spherical particle that is submerged into an electrolyte surrounded by a uniform AC electric field. The particle is dielectric and it is charged uniformly. a* is the radius of particle. is the particle’s dielectric permittivity. is the electrolyte’s dielectric permittivity. The particle undergoes an electrophoretic motion with a velocity U⃗(t) = U0eiωt. We will obtain the velocity of particle, U⃗ as a part of the solution process. To solve this problem, as shown in Fig. 1, we consider spherical coordinates (r, θ, ϕ) where the origin of the coordinates is in the center of the particle and the angle between two vectors er and ez is defined as θ.
Figure 1.
The schematics of the coordinates for a submerged particle in an electrolyte.
The counterions within the EDL react with the applied electric field to induce the electro-osmotic flow. Moreover, the electrophoretic motion of particle causes neighboring fluid to move as well. To characterize the fluid’s motion, due to the small Reynolds number, one can use the Stokes equation:
| (1) |
For the incompressible condition we have
| (2) |
where p and C± are the pressure, cation and anion concentration; E⃗ = −∇φ defines the electric field; subscript 1 defines the liquid and subscript 2 denotes the particle; and for the dimensionless Debye screening length , a* denotes the particle’s radius; denotes the solute’s cation bulk concentration; R* is related to the ideal gas constant; F* is related to the Faraday constant; T* defines the temperature. Variables with the superscript * show the dimensional form and those without the superscript * denote the dimensionless form. Here, length scale equals to a*; electric potential scale equals to ; velocity scale equals to ; concentration scale equals to ; time scale is ; pressure scale equals to ; and electric charge scale equals to . The dimensionless molecular diffusivities define as (i.e., D+ = 1). To make the calculations simple, let’s apply the condition of D+ = D−.
To describe the ion-ion electrostatic correlations, we consider the modified Poisson equation for φ inside the electrolyte as presented by Bazant et al.:1
| (3) |
where lc denotes the electrostatic correlation length. To facilitate the simulations, Eq. (3) can be split into two second-order equations:
| (4) |
and
| (5) |
The electric potential φ in the particle’s interior can be modeled by the Laplace equation:
| (6) |
The ions’ fluxes
| (7) |
obeys the Nernst-Planck equations:
| (8) |
Here is the mobility and μ* denotes the dynamic viscosity of solvent.
In a long distance from the particle,
| (9) |
where δ defines the correlation between the external electric field’s magnitude and the equilibrium EDL.
On the particle’s surface,
| (10) |
In the above, the relative permittivity is defined as , and n is defined as the outer normal to the surface.
Perturbation Expansion
This study is considering a non-conducting particle with a spherical shape that is surrounded by an applied low-intensity electric field. We assume that , so that the electric field of the equilibrium EDL is slightly perturbed by the external electric field. Considering these assumptions, the variables can be expressed via a regular perturbation expansion:
| (11) |
Here Re shows the complex variable’s real part and i denotes the unit complex value. To compute the particle’s mobility, we need the zero net force related to the particle.
The Zeroth Order Approach
The zeroth order concentrations can be obtained from the Boltzmann distribution as,
| (12) |
The zeroth order electric potential obeys the modified Poisson-Boltzmann equation, which is axisymmetric, only as a function of radial coordinate (r):
| (13) |
and
| (14) |
The corresponding boundary conditions are:
| (15) |
The First Order Equation
The imposed electric field just affects a little the EDL at equilibrium. The linearity of the first order equations of the imposed quantities makes the variables proportional to the forcing frequency.
By plugging series (11) into Eqs. (1)–(8) and using iω to substitute the time derivative, we get:
| (16) |
| (17) |
| (18) |
| (19) |
| (20) |
and
| (21) |
It is possible to further reduce Eqs. (16)–(21) to ordinary differential equations due to axisymmetry, which then is solvable by the commercial finite element software COSMOL 5.2® (Comsol is a product of Comsol™, Boston). The computing geometry contains an interval between R = 0 and R = 104 (Figure S1 in on-line supporting information). We increased R and found out that there is little variation in the results, indicating that R is large enough to lead to R-independent computational results. To capture the details of the EDL, an uneven mesh was selected and more condensed meshes were implemented close to the particle surface and inside the EDL. The mesh was refined to make sure to get the mesh-independent results (Figure S2 in on-line supporting information). The detailed solution procedures are similar to the one in [26], except that we add two new Eq. (13) and Eq. (18) which are the second-order equations with the standard boundary condition and readily implemented into Comsol.
The electric field is slightly perturbed by the particle and the EDL. Going away from the particle, the generated field behaves the same as the one caused by a dipole, which can be expressed as . The dipole moment coefficient is determined by the real part of f. This means that the dipole coefficient can be obtained by the electric potential from the first-order equations in the far field.
When lc = 0, Eq. (18) becomes the standard PNP model. Here we let lc ≪ 1 and estimated the dipole coefficient f for a variety of double layer thicknesses and zeta potentials. The comparisons between our modified model and the standard model are excellent (Figure S3 in on-line supporting information). In addition, dipole moments calculated this way agree with those from the simple models under the thin double layer assumption (see below), which again validated the computational algorithm.
The Maxwell-Wagner-O’Konski (MWO) Model
Under the thin double layer, the spherical particle’s dipole coefficient is obtained from the following equation introduced by O’Konski:34
| (22) |
Here , where defines the complex permittivity of the electrolyte and is the one for the particle. The conductivity of electrolyte is obtained from16 and the particle’s effective conductivity is where is the intrinsic conductivity of the particle and is the surface conductivity of the EDL.
For thin EDL (λD ≪ 1), we have,16
| (23) |
The Dukhin-Shilov (DS) Model
When the frequency is high, migration and convection dominate the diffusion. The MWO model is able to adequately estimate the dipole moment. At frequencies around , the surface conduction can create concentration polarization, inducing the diffusion process. The diffusion can impact both the electric current and dipole coefficient. Since the diffusion is performed through the opposite direction to the migration and convection, it reduces the dipole moment, resulting in low-frequency dispersion. We notice that since the diffusion doesn’t play a role in the MWO model, it cannot yield the dipole moment at low-frequency ranges.
For the case of thin EDL, to investigate the influence of the diffusion on the dipole coefficient, an asymptotic analysis was presented by Dukhin and Shilov.28,30,35,36 In short, outside the double layer, the respective φ and the bulk concentration satisfy the Laplace and diffusion equations. In terms of boundary conditions, one can assume that the chemical potential is not dependent on the (r) coordinate (the EDL is in local equilibrium). Selecting the proper effective boundary conditions, one can find the resulted dipole moment obtained from the electric potential in the far field as,
| (24) |
In the above,
| (25) |
| (26) |
and
| (27) |
Here, and g(s) = coshφ(0). The detailed derivation can be found in reference [28].
At high frequencies (ω ≫ 1), another form of Eq. (24) is,
| (28) |
In the above, to simplify the equation, we use the identify R+ + R− = 2Du. Hence, the high-frequency limit of the DS model converges to the low-frequency limit of the MWO model.
6. Results and Discussion
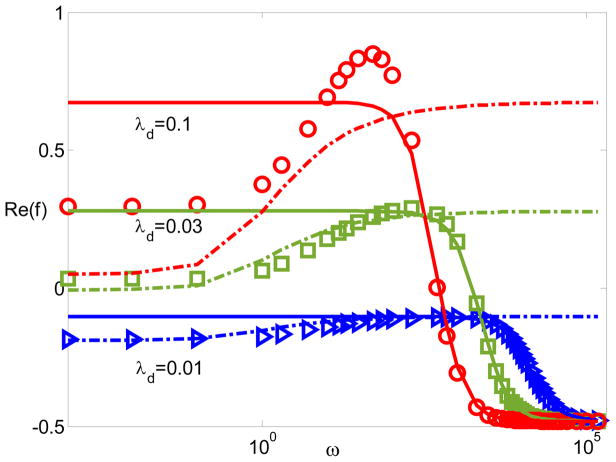
For typical dimensional units, the thickness of the double layer varies from nm to hundred nm. The electrostatic correlation length is in order of nm. The zeta potential is around hundred mV. Fig. 2 plots the dipole moment coefficient Re(f) with respect to frequency when ξ = −7 and δC = lc/λD = 0.1 for various λD. Here δC characterizes the relative importance of the electrostatic correlations. The solid lines represent MWO model. The dash-dotted lines represent the DS model. The symbols represent the modified PNP model. As anticipated, the MWO model is not able to recognize the dipole moment’s characteristics at low frequencies in which the diffusion is important. Also the DS model cannot predict the high-frequency dispersion where the EDL is not in local equilibrium. Moreover, the dipole coefficients obtained by these two simple models are in good agreements with the results from the modified PNP model at high and low frequencies. In addition, with increasing λD, the predictions from the simple models deviate from those by the modified PNP model since the simple models are derived under the thin double layer assumption.
Figure 2.
The dipole moment Re(f) with respect to frequency for ξ = −7 and δC = 0.1 for various λD. The solid lines represent MWO model; the dash-dotted lines represent the DS model; and the circles, squares, and triangles represent the modified PNP model.
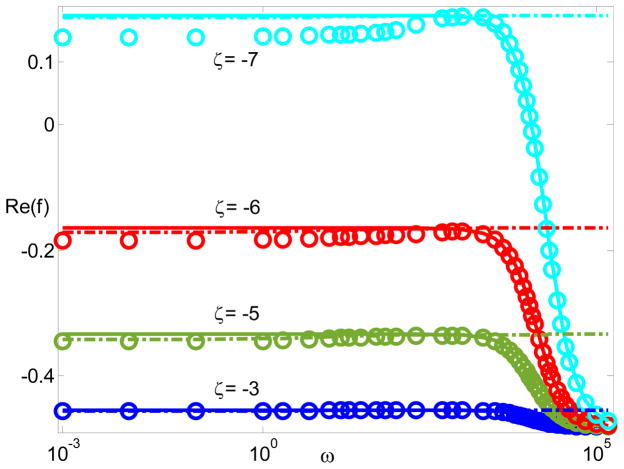
Fig. 3 plots the dipole moment Re(f) with respect to the frequency for various ζ when λD = 0.01 and δc = 1. For large zeta potentials, the estimations from the DS model do not match the ones predicted by the modified PNP model. Interestingly, the MWO model goes along with the modified PNP model at higher zeta potentials. The cause for this disagreement remains in the fact that the derivation of the DS model is under the local chemical equilibrium assumption for the double layer. This local equilibrium assumption was justified using the rigorous singular perturbation analysis, if .52 Clearly, the DS model does not work at higher zeta potentials which break the justification.
Figure 3.
The dipole moment Re(f) with respect to frequency for different zeta potentials when λD = 0.01, and δc = 1. The solid lines represent MWO model; the dash-dotted lines represent the DS model; and the circles, squares, and triangles represent the modified PNP model.
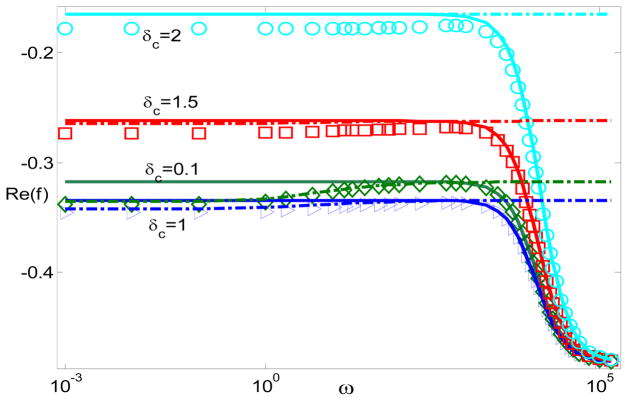
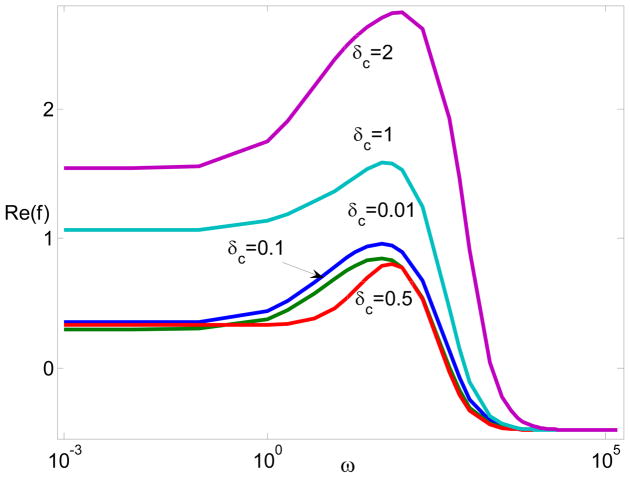
Fig. 2 and Fig. 3 are consistent with those from the standard MWO, DS, and PNP models though there are quantitative differences. The discussions on the frequency dependence have been documented in our previous works in details.27 Here, we do not repeat them. Instead, we focus on electrostatic correlations. In order to study the performance of electrostatic correlations in the particle polarization, Fig. 4 generates the dipole moment Re(f) with respect to the frequency for various δC when ξ = −5 and λD = 0.01. Interestingly, by increasing the correlation length, a non-monotonous relationship happens and causes a decrease in the dipole moment and an increase after that.
Figure 4.
The dipole moment Re(f) with respect to frequency for different δc when ξ = −5, λD = 0.01, and The solid lines represent MWO model; the dash-dotted lines represent the DS model; and the circles, squares, and triangles represent the modified PNP model.
Fig. 4 suggests a complicated influence of electrostatic correlations on the dipole moment. Inside the double layer, charge oscillation may decrease migration and convection due to the cancellation from different charges. On the other hand, electrostatic correlations can effectively extend the double layer thickness beyond the Debye screening length λD. In particular, at large δC, the double layer thickness is characterized by instead of λD.53 The increase of the double layer thickness can, in turn, increase the migration and convection. Indeed, studies show that the electro-osmotic mobility decreases, changes the sign (charge inversion), and then monotonously increases as the correlation length δC increases. 50
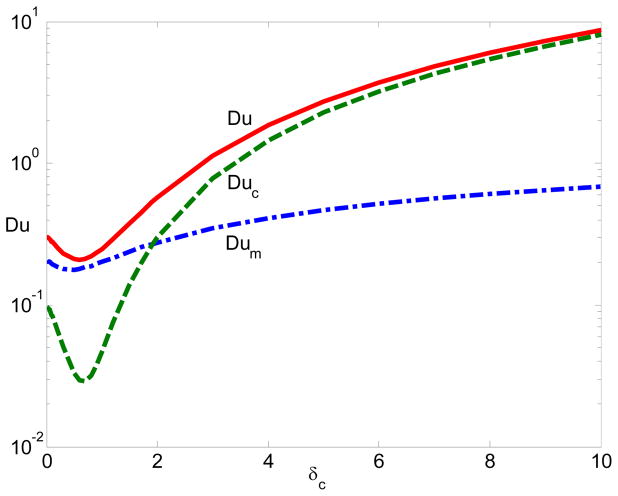
To quantitatively characterize the importance of electrostatic correlations on the surface conduction, Fig. 5 plots the Dukhin number as a function of δC when ξ = −5 and λD = 0.01. Here,
Figure 5.
The Dukhin Number with respect to the correlation length: The solid line represents the Du number, the dashed line represents the contribution from the convection (Duc), and the dash-dotted line represents the contribution from the migration (Dum) when ξ = −5 and λD = 0.01.
| (29) |
The surface conduction has both migration and convection component. The first term in Eq. (29) refers to ions’ migration contribution (Dum). The second term is the input from the convection (Duc). In Fig. 5 The solid line represents the Du number, the dashed line represents the contribution from the convection (Duc), and the dash-dotted line represents the contribution from the migration (Dum). Initially, the surface conduction decreases due to charge oscillation. Also the migration is dominant over convection. When δC increases, charge inversion occurs and the surface conduction begins to increase. Interestingly, convection contribution becomes larger than migration contribution. Eventually, the surface conduction is determined by the convection. The electro-osmotic mobility is proportional to δC when δC ≫ 1.50 Hence, it is not surprising that the surface conduction linearly increases at large δC as shown in Fig. 5.
For an arbitrary double layer thickness and correlation length, we can solve them numerically. Fig. 6 is showing various δC for the dipole coefficient Re(f) in terms of the frequency for the condition of ς = −7 and λD = 0.3. Similar to Fig. 4, the dipole moment decreases and then rises when the correlation length δC increases. If the double layer’s thickness increases, the trend of the impact of electrostatic correlations on the dipole moment qualitatively remains the same: the charge oscillation initially reduces the surface conduction inside the double layer until the occurrence of charge inversion. Once charge inversion is initiated, a further increase of electrostatic correlations begins to enhance convection prominently, leading to an increase of the dipole moment.
Figure 6.
The dipole moment Re(f) versus frequency for different δc when ξ = −7 and λD = 0.3.
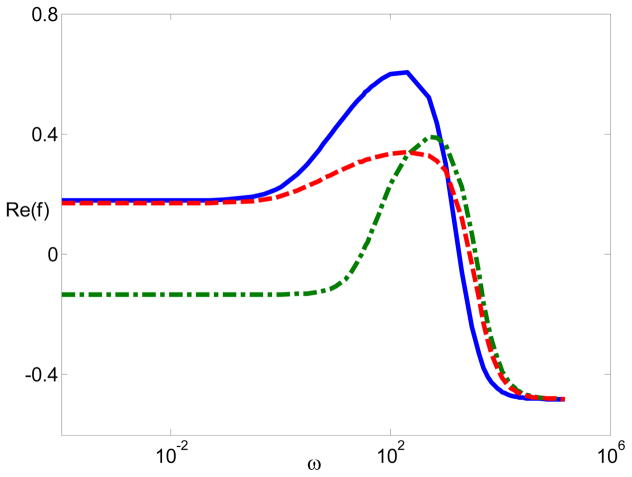
Next, we examine whether the modified PNP model accounting for electrostatic correlations can adequately explain experimental observations which are unable to be estimated by the standard PNP model. Recently, Gan41 measured the polarizability of λ-DNA using the insulated-based dielectrophoresis and found out that in the divalent buffer (Mg2+) (5 mM), at low frequencies (hundreds Hz), the λ-DNA experienced negative DEP. In contrast, in the monovalent buffer, the λ-DNA only showed positive DEP. Fig. 7 is showing the dipole moment coefficient as a function of the frequency when the surface charge density −0.16 mC/m2 (the DNA surface charge density), the particle radius is 20 nm, and the bulk concentration is 5 mM, the same as the experimental results. In Fig. 7, the solid line corresponds to the dipole moment with monovalent ions, the dash line corresponds the one with divalent ions in the absence of electrostatic correlations (lc = 0), and the dash-dotted line represents divalent ions when electrostatic correlations exist (lc = 1 nm). A constant surface charge is specified as in equation (15). The rest of equations and the boundary conditions do not change. Clearly, it is not possible to estimate the negative dipole moment of low frequencies when using the standard PNP model. In contrast, the modified model with electrostatic correlations can successfully predict the negative DEP, suggesting the importance of the electrostatic correlations in multivalent electrolytes.
Figure 7.
The dipole moment Re(f) with respect to frequency with the surface charge density −0.16 mC/m2, a = 20 nm, and C0 = 5 mM. The solid line represents the dipole moment with monovalent ions, the dash line represents the dipole moment with divalent ions (lc = 0), and the dash-dotted line represents the dipole moment with divalent ions (lc = 1 nm).
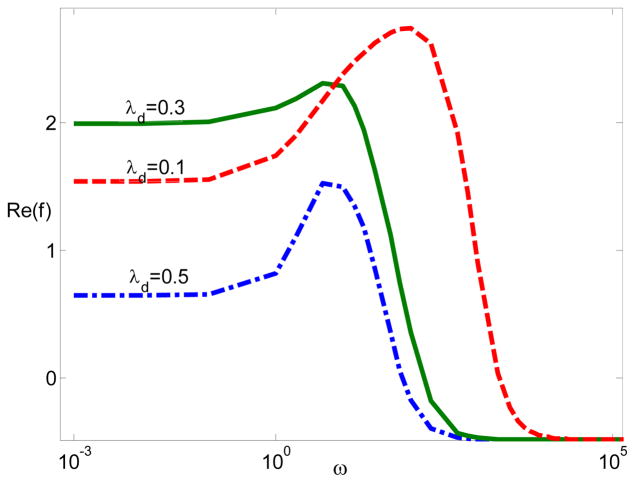
Finally, we fix the electrostatic correlation length lc and change the double layer thickness. Fig. 8 is plotting the dipole moment coefficient in terms of frequency for various λD when ξ = −7 and lc = 0.2. Fig. 8 suggests that the dipole moment increases, and then decreases by increasing EDL as a result of the electrostatic correlations. Interestingly, recent experiments on the DNA orientation anisotropy in the presence of divalent electrolytes showed a similar trend,42 which again cannot be captured by the standard PNP model. Interestingly, our modified PNP model accounting for electrostatic correlations is in qualitative agreements.
Figure 8.
The dipole moment Re(f) with respect to frequency for various λD when ξ = −7 and lc = 0.2.
7. Conclusion
Under the action of an external AC electric field, the impact of electrostatic correlations on the EDL polarization for a spherical particle was thoroughly investigated numerically by using a modified Poisson-Nernst-Planck equation unfolded by Bazant et al.1 In the condition of thin double layer thickness and small electrostatic correlation lengths, we derived the modified Maxwell-Wagner-O’Konski model for high frequency as well as the Dukhin-Shilov model for low frequency to account for electrostatic correlations. The computed dipole moments from these simple models were in favorable agreements with the numerical predictions obtained by the modified PNP model. Consistent with the standard DS model, at higher zeta potentials, the modified DS model deviated from the full modified PNP model, limiting its application to moderately charged particles.
The dipole moment’s frequency dependence was computed with respect to the zeta potential, the thickness of EDL, and electrostatic correlation length. The impacts of zeta potential and EDL thickness on the dipole moment under the influence of electrostatic correlations are similar to those without considering ion-ion electrostatic correlations. Electrostatic correlations are more prominent in concentrated multivalent electrolytes or near highly charged surfaces. Electrostatic correlations generally induce charge oscillation. The increase of the electrostatic correlation length can eventually lead to charge inversion. This phenomenon makes the dependence on electrostatic correlations complicated. Initially, due to charge oscillation, the surface conduction decreases as both migration and convection are reduced. However, once charge inversion occurs, the electro-osmotic mobility reverses and starts to increase as the electrostatic correlation length increases. Eventually, the contribution from convection to the surface conduction becomes dominant, which continuously increases with δC. Such enhancement leads to a high-level dipole coefficient over a broad spectrum of frequency.
Comparisons performed with the experimental data in multivalent electrolytes show that the modified PNP model accounting for electrostatic correlations can qualitatively explain the experimental results that the standard PNP model fails to predict, suggesting the importance of electrostatic correlations in multivalent electrolytes.
The electrostatic correlation length is around nanometers. For an electrolyte with a concentration larger than mM, δC is above 0.1 and the impact of electrostatic correlations becomes important. When the salt concentration further increases, the influence of electrostatic correlations is more prominent. However, when the salt concentration increases to a point that the double layer thickness is below the ion hydration, corresponding to the larger δC, i.e. δC = 10, ion steric effects (finite ion size) need to be taken into consideration. Additional improvement by including steric effects by the Bikerman’s model28 may further extend the applicability of the modified PNP model to even more highly concentrated electrolytes.
Supplementary Material
Acknowledgments
Research reported in this publication was supported by the National Institute of General Medical Sciences of the National Institutes of Health under Award Number R15GM116039. The content is solely the responsibility of the authors and does not necessarily represent the official views of the National Institutes of Health.
Footnotes
The supporting information is available free of charge on the ACS Publications website.
Additional figures on comparison with the standard model and mesh independence.
References
- 1.Bazant MZ, Storey BD, Kornyshev AA. Double Layer in Ionic Liquids: Overscreening versus Crowding. Phys Rev Lett. 2011;106:046102. doi: 10.1103/PhysRevLett.106.046102. [DOI] [PubMed] [Google Scholar]
- 2.Velev OD, Kaler EW. In Situ Assembly of Colloidal Particles into Miniaturized Biosensors. Langmuir. 1999;15:3693–3698. [Google Scholar]
- 3.Squires TM, Quake S. Microfluidics: Fluid Physics at the Nanoliter Scale. Rev Mod Phys. 2005;77:977–1026. [Google Scholar]
- 4.Schoch RB, Han J, Renaud P. Transport Phenomena in Nanofluidics. Rev Mod Phys. 2008;80:839–883. [Google Scholar]
- 5.Velev OD, Bhatt KH. On-chip Micromanipulation and Assembly of Colloidal Particles by Electric Fields. Soft Matt. 2006;2:738–750. doi: 10.1039/b605052b. [DOI] [PubMed] [Google Scholar]
- 6.Arsenault ME, Zhao H, Purohit PK, Goldman YE, Bau HH. Confinement and Manipulation of Actin Filaments by Electric Fields. Biophys J. 2007;93:L42–L44. doi: 10.1529/biophysj.107.114538. [DOI] [PMC free article] [PubMed] [Google Scholar]
- 7.Pohl HA. Dielectrophoresis. Cambridge University Press; New York, NY: 1978. [Google Scholar]
- 8.Jones TB. Electromechanics of Particles. Cambridge University Press; New York, NY: 1995. [Google Scholar]
- 9.Pethig R. Review Article—Dielectrophoresis: Status of the Theory, Technology, and Applications. Biomicrofluidics. 2010;4:022811. doi: 10.1063/1.3456626. [DOI] [PMC free article] [PubMed] [Google Scholar]
- 10.Lapizco-Encinas BH, Rito-Palomares MR. Dielectrophoresis for the Manipulation of Nanobioparticles. Electrophoresis. 2007;28:4521–4538. doi: 10.1002/elps.200700303. [DOI] [PubMed] [Google Scholar]
- 11.Nakano A, Camacho-Alanis F, Ros A. Insulator-based Dielectrophoresis with Proteins in Nanostructured Devices. Analyst. 2015;140:860–888. doi: 10.1039/c4an01503g. [DOI] [PMC free article] [PubMed] [Google Scholar]
- 12.Abdallah BG, Chao TC, Kupitz C, Fromme P, Ros A. Dielectrophoretic Sorting of Membrane Protein Nanocrystals. ACS Nano. 2013;7:10534–10543. doi: 10.1021/nn403760q. [DOI] [PMC free article] [PubMed] [Google Scholar]
- 13.Nakano A, Ros A. Protein Dielectrophoresis: Advances, Challenges and Applications. Electrophoresis. 2013;34:1085–1096. doi: 10.1002/elps.201200482. [DOI] [PMC free article] [PubMed] [Google Scholar]
- 14.Velev OD, Gupta S. Materials Fabricated by Micro- and Nanoparticle Assembly – The Challenging Path from Science to Engineering. Adv Mater. 2009;21:1897–1905. [Google Scholar]
- 15.Morgan H, Hughes MP, Green NG. Separation of Submicron Bioparticles by Dielectrophoresis. Biophys J. 1999;77:516–525. doi: 10.1016/S0006-3495(99)76908-0. [DOI] [PMC free article] [PubMed] [Google Scholar]
- 16.Lyklema J. Fundamentals of Interface and Colloid Science. Volume II: Solid-Liquid Interfaces. Academic Press; San Diego, CA: 1995. [Google Scholar]
- 17.Hunter RJ. Foundations of Colloid Science. Oxford University Press; New York, NY: 2001. [Google Scholar]
- 18.O’Brien RW. The Response of a Colloidal Suspension to an Alternating Electric Field. Adv Colloid Interface Sci. 1982;16:281–320. [Google Scholar]
- 19.Mangelsdorf CS, White LR. Dielectric Response of a Dilute Suspension of Spherical Colloidal Particles to an Oscillating Electric Field. J Chem Soc Faraday Trans. 1997;93:3145–154. [Google Scholar]
- 20.Pedrosa SE, Grosse C. Calculation of the Dielectric Increment and Characteristic Time of the LFDD in Colloidal Suspensions of Spheroidal Particles. J Colloid Interface Sci. 1999;219:37–47. doi: 10.1006/jcis.1999.6486. [DOI] [PubMed] [Google Scholar]
- 21.Lopez-Garcia JJ, Horno J, Gonzalez-Caballero F, Grosse C, Delgado AV. Dynamics of the Electric Double Layer: Analysis in the Frequency and Time Domains. J Colloid Interface Sci. 2000;228:95–104. doi: 10.1006/jcis.2000.6941. [DOI] [PubMed] [Google Scholar]
- 22.Shilov VN, Delgado AV, Gonzalez-Caballero F, Horno J, Lopez-Garcia JJ, Grosse C. Polarization of the Electrical Double Layer. Time Evolution after Application of an Electric Field. J Colloid Interface Sci. 2000;232:141–148. doi: 10.1006/jcis.2000.7152. [DOI] [PubMed] [Google Scholar]
- 23.Chassagne C, Bedeaux D, Koper GJM. Dielectric Enhancement of Charged Nanospheres Dispersed in an Electrolyte. J Phys Chem B. 2001;105:11743–11753. [Google Scholar]
- 24.Hill RJ, Saville DA, Russel WB. High-frequency Dielectric Relaxation of Spherical Colloidal Particles. Phys Chem Chem Phys. 2003;5:911–915. [Google Scholar]
- 25.Zhou H, Preston MA, Tilton RD, White LR. Calculation of the Electric Polarizability of a Charged Spherical Dielectric Particle by the Theory of Colloidal Electrokinetics. J Colloid Interface Sci. 2005;285:845–856. doi: 10.1016/j.jcis.2004.11.065. [DOI] [PubMed] [Google Scholar]
- 26.Zhao H, Bau HH. The Polarization of a Nanoparticle Surrounded by a Thick Electric Double Layer. J Colloid Interface Sci. 2009;333:663–671. doi: 10.1016/j.jcis.2009.01.056. [DOI] [PubMed] [Google Scholar]
- 27.Zhao H. Double Layer Polarization of a Non-conducting Particle in an Alternating Current Field with Applications to Dielectrophoresis. Electrophoresis. 2011;32:2232–2244. doi: 10.1002/elps.201100035. [DOI] [PubMed] [Google Scholar]
- 28.Zhao H. On the Influence of Ion Excluded Volume (Steric) Effects on the Double Layer Polarization of a Non-Conducting Nano Particle in an AC Field. J Phys Chem C. 2010;18:8389–8397. [Google Scholar]
- 29.Zhao H. On the Effect of Hydrodynamic Slip on the Polarization of a Non-conducting Spherical Particle in an AC Field. Phys Fluids. 2010;22:072004. [Google Scholar]
- 30.Zhao H, Bau HH. The Effect of Double Layer Polarization on the Forces that Act on a Nanosize Cylindrical Particle in an AC Electric Field. Langmuir. 2008;24:6050–6059. doi: 10.1021/la7030736. [DOI] [PubMed] [Google Scholar]
- 31.Zhao H, Bau HH. The Polarization of Nanorods Submerged in an Electrolyte Solution and Subjected to an AC Electric field. Langmuir. 2010;26:5412–5420. doi: 10.1021/la903842z. [DOI] [PubMed] [Google Scholar]
- 32.Uppapalli S, Zhao H. The Polarization of a Diffuse Soft Particle Subjected to an Alternating Current Field. Langmuir. 2012;28:11164–11172. doi: 10.1021/la301889e. [DOI] [PubMed] [Google Scholar]
- 33.Zhao H. The Role of Hydrodynamic Behavior of DNA Molecules in Dielectrophoretic Polarization under the Action of an Electric Field. Phys Rev E. 2011;84:021910. doi: 10.1103/PhysRevE.84.021910. [DOI] [PubMed] [Google Scholar]
- 34.O’Konski CT. Electric Properties of Macromolecules. V. Theory of Ionic Polarization in Polyelectrolytes. J Phys Chem. 1960;64:605–619. [Google Scholar]
- 35.Shilov VN, Dukhin SS. Theory of Low-frequency Dispersion of Dielectric Permittivity in Suspension of Spherical Colloidal Particles due to Double Layer Polarization. Colloid J USSR. 1970;32:293–300. [Google Scholar]
- 36.Grosse C, Shilov VN. Theory of Low-frequency Electrorotation of Polystyrene Particles in Electrolyte Solution. J Phys Chem. 1996;100:1771–1178. [Google Scholar]
- 37.Myers DF, Saville DA. Dielectric Spectroscopy of Colloidal Suspensions: II. Comparisons between Experiment and Theory. J Colloid Interface Sci. 1989;131:461–470. [Google Scholar]
- 38.Rosen LA, Saville DA. Dielectric Spectroscopy of Colloidal Dispersions: Comparisons between Experiment and Theory. Langmuir. 1991;7:36–42. [Google Scholar]
- 39.Dunstan DE. Electrophoretic Mobility and Dielectric Response Measurements of Colloidal Hematite. J Colloid Interface Sci. 1994;163:255–258. [Google Scholar]
- 40.Gan L, Camacho-Alanis F, Ros A. Polarizability of Six-helix Bundle and Triangle DNA Origami and Their Escape Characteristics from a Dielectrophoretic Trap. Anal Chem. 2015;87:12059–12064. doi: 10.1021/acs.analchem.5b02524. [DOI] [PubMed] [Google Scholar]
- 41.Gan L. PhD dissertation. Arizona State University; Insulated-based dielectrophoretic manipulation of DNA in a microfluidic device. [Google Scholar]
- 42.Suzuki S, Yamanashi T, Tazawa S. Quantitative analysis of DNA orientation in stationary AC electric fields using fluorescence anisotropy. IEEE Tran Industrial App. 1998;34:75–83. [Google Scholar]
- 43.Strauss UP, Gershfeld NL, Spiera H. Charge Reversal of Cationic Poly-4-vinylpyridine Derivatives in KBr Solutions. J Am Chem Soc. 1954;76:5909–5911. [Google Scholar]
- 44.Elimelech M, O’Melia CR. Effect of Electrolyte Type on the Electrophoretic Mobility of Polystyrene Latex Colloids. Colloid Surf. 1990;44:165–178. [Google Scholar]
- 45.Martín-Molina A, Quesada-Perez M, Galisteo-Gonzalez F, Hidalgo-Alvarez R. Looking into Overcharging in Model Colloids through Electrophoresis: Asymmetric Electrolytes. J Chem Phys. 2003;118:4183–4189. [Google Scholar]
- 46.Martín-Molina A, Rodriguez-Beas C, Hidalgo-Alvarez R, Quesada-Perez M. Effect of Surface Charge on Colloidal Charge Reversal. J Phys Chem B. 2009;113:6834–6839. doi: 10.1021/jp900959y. [DOI] [PubMed] [Google Scholar]
- 47.Mezger M, Schroder H, Reichert H, Schramm S, Okasinski JS, Schoder S, Honkimaki V, Deutsch M, Ocko BM, Ralston J, Rohwerder M, Stratmann M, Dosch H. Molecular layering of fluorinated ionic liquids at a charged sapphire (0001) surface. Science. 2008;322:424–428. doi: 10.1126/science.1164502. [DOI] [PubMed] [Google Scholar]
- 48.Levin Y. Electrostatic Correlations: from Plasma to Biology. Rep Prog Phys. 2002;65:1577–1632. [Google Scholar]
- 49.Skinner B, Loth MS, Shklovskii BI. Capacitance of the Double Layer Formed at the Metal/Ionic-conductor Interface: How Large can it be? Phys Rev Lett. 2010;104:128302. doi: 10.1103/PhysRevLett.104.128302. [DOI] [PubMed] [Google Scholar]
- 50.Storey BD, Bazant MZ. Effects of Electrostatic Correlations on Electrokinetic Phenomena. Phys Rev E. 2012;86:056303. doi: 10.1103/PhysRevE.86.056303. [DOI] [PubMed] [Google Scholar]
- 51.Stout RF, Khair AS. A Continuum Approach to Predicting Electrophoretic Mobility Reversals. J Fluid Mech. 2014;752:R1. [Google Scholar]
- 52.Chew WC. Dielectric Enhancement and Electrophoresis due to an Electrochemical Double Layer: a Uniform Approximation. J Chem Phys. 1984;80:4541–4552. [Google Scholar]
- 53.Zhao H. Diffuse-charge Dynamics of Ionic Liquids in Electrochemical Systems. Phys Rev E. 2011;84:051504. doi: 10.1103/PhysRevE.84.051504. [DOI] [PubMed] [Google Scholar]
Associated Data
This section collects any data citations, data availability statements, or supplementary materials included in this article.


