

Abstract
Diabetic peripheral neuropathy is the most common complication of diabetes and a source of considerable morbidity. Numerous molecular pathways are linked to neuropathic progression, but it is unclear whether these pathways are altered throughout the course of disease. Moreover, the methods by which these molecular pathways are analyzed can produce significantly different results; as such it is often unclear whether previously published pathways are viable targets for novel therapeutic approaches. In the current study we examine changes in gene expression patterns in the sciatic nerve (SCN) and dorsal root ganglia (DRG) of db/db diabetic mice at 8, 16, and 24 weeks of age using microarray analysis. Following the collection and verification of gene expression data, we utilized both self-organizing map (SOM) analysis and differentially expressed gene (DEG) analysis to detect pathways that were altered at all time points. Though there was some variability between SOM and DEG analyses, we consistently detected altered immune pathways in both the SCN and DRG over the course of disease. To support these results, we further used multiplex analysis to assess protein changes in the SCN of diabetic mice; we found that multiple immune molecules were upregulated at both early and later stages of disease. In particular, we found that matrix metalloproteinase-12 was highly upregulated in microarray and multiplex data sets suggesting it may play a role in disease progression.
Keywords: diabetes, diabetic peripheral neuropathy, microarray, gene expression analysis, self-organizing map, inflammation, immune system, mouse models, db/db
INTRODUCTION
Type 2 diabetes (T2D) is a metabolic disorder which arises primarily from obesity and is characterized by hyperglycemia, hyperlipidemia, and impaired insulin signaling. As T2D progresses, these factors lead to microvascular complications which significantly increase both the morbidity and the mortality of afflicted patients1, 2. In particular, diabetic peripheral neuropathy (DPN) is one of the most common diabetic complications, with 50% of T2D patients developing DPN3. DPN is characterized by progressive loss of sensation in the limbs, pain, and allodynia. It also increases infection risk and the rate of foot ulcers that can lead to amputation 3.
Despite the prevalence of T2D and the morbidity associated with DPN, the mechanisms of neurodegeneration are poorly understood. Numerous pathways, including inflammation 4, reactive oxygen species (ROS) formation5, 6, mitochondrial dysfunction 7, and endoplasmic reticulum stress 8 are implicated and may play a role in disease progression. To elucidate potential mechanisms, previous studies have utilized either microarray or RNA-Seq analyses to identify genes which are up- or downregulated in the peripheral nervous system during DPN9–14. However, these studies have focused on specific time frames and do not examine changes over the course of disease; pathways that are upregulated early or late in disease may not necessarily play an important role over the entirety of the disease course.
Using microarrays as a transcriptomic platform, we identified DPN-associated pathways in the sciatic nerve (SCN) and dorsal root ganglia (DRG) at 8, 16, and 24 weeks of age in the well characterized db/db mouse model of T2D and DPN. Previously published 16 and 24 wk transcriptomic datasets9, 11 were preprocessed with new datasets using a unified analysis pipeline. Two forms of data analyses were then used in parallel to identify altered molecular pathways in DPN. First, using Self-Organizing Map (SOM) analysis, pathways of interest were organized into distinct clusters which followed similar kinetic patterns over the course of disease. Next, Differential Expression Analysis was used to identify up- and downregulated differentially expressed genes (DEGs) at all three time points. By comparing both sets of analyses, we found that pathways associated with inflammation and immune regulation were altered at all time points in both the SCN and the DRG. To validate these data, multiplex analysis was used to assess protein changes in the SCN during early (8 wk) and late (24 wk) stages of DPN. Several pro- and anti-inflammatory markers, including interferon (IFN)-γ and interleukin (IL)-10, were upregulated over the course of disease. Also, consistent with our previous observations14, 15, we found that matrix metalloproteinase-12 (MMP-12) was highly upregulated in DPN. Together, these data suggest that the immune system plays a key role during DPN and that aspects of the immune system may represent a viable therapeutic target.
METHODS
Animals
Three cohorts of C57BLKS (BKS.Cg-m+/+Leprdb/J; stock number 000642, Jackson Laboratory, Bar Harbor, ME) db/db mice, a well-characterized murine model of T2D, were used for the study. Control (db/+) and diabetic (db/db) mice were fed a standard diet (5LOD, 13.4% kcal fat for 8/24 wk; or AIN76A, 11.5% kcal fat for 16 wk; Research Diets, New Brunswick, NJ). Mice were cared for in a pathogen-free environment by the University of Michigan Unit for Laboratory Animal Medicine. Mice were, euthanized at 8, 16 or 24 weeks of age using a lethal injection of pentobarbital (Vortech, Dearborn, MI). Animal protocols were approved by the University of Michigan University Committee on Use and Care of Animals.
Metabolic and Neuropathy Phenotyping
Control db/+ and db/db mice were phenotyped for body weight, fasting blood glucose (FBG), and glycated hemoglobin (GHb) levels (n = 5–6 for each group per time point). FBG levels were measured with an AlphaTrak Glucometer (Abbott Laboratories, Abbott Park, IL) for 8 and 16 wk mice and a standard Glucometer (OneTouch; LifeScan Inc., Milpitas, CA) for 24 wk mice. GHb levels were determined using a Glyco-Tek Affinity column (Helena Laboratories, Beaumont, TX) at the Michigan Diabetes Research and Training Center Chemistry Core. Peripheral nerve function was assessed at 8, 16, and 24 wk according to Diabetic Complications Consortium guidelines (https://www.diacomp.org/shared/protocols.aspx). Motor (sciatic) and sensory (sural) nerve conduction velocities (NCVs), hind-paw withdrawal latency from a thermal stimulus, and intraepidermal nerve fiber density were measured for large and small fiber nerve function, and small fiber loss using our previously published protocols16–19. Data from 16 wk and 24 wk cohorts are previously published9, 11.
Microarray Data Analyses
Lumbar DRG were harvested, and nerve roots removed under a dissecting microscope. A 15 mm segment of SCN was harvested immediately proximal to the sural/tibial/peroneal trifurcation, and adherent fat and connective tissue removed under a dissecting microscope. Total RNA was collected from SCN and DRG at 8 wk (db/+, n = 5; db/db, n = 6), 16 wk (db/+, n = 6; db/db, n = 6), and 24 wk (db/+, n = 6; db/db, n = 6) using the silica gel-based isolation protocol RNeasy Mini Kit (QIAGEN, Valencia, CA) at each time point. RNA quality was measured using a 2100 Bioanalyzer (Agilent Technologies, Santa Clara, CA). Samples meeting RNA quality criteria were analyzed by microarray as previously described 11. In brief, total RNA (75 ng) was amplified and biotin-labeled using the Ovation Biotin-RNA Amplification System (NuGEN Technologies Inc., San Carlos, CA) per the manufacturer’s protocol; amplification and hybridization were performed by the University of Michigan DNA Sequencing Core using the Affymetrix GeneChip® Mouse Genome 430 2.0 Array (Affymetrix, Santa Clara, CA). These studies include previously published transcriptomics datasets (16 wk SCN and DRG 9 ; 24 wk SCN11).
Quality Control
The quality of the microarray CEL files were assessed using the affyAnalysisQC R package (http://arrayanalysis.org) with Bioconductor (www.bioconductor.org). The Robust Multi-array Average method with the BrainArray Custom Chip Definition File version 19 20 was applied to normalize each group of microarray data using GenePattern (http://genepattern.broadinstitute.org/gp/).
Self-Organizing Map Analysis
Patterns of gene expression were identified during DPN progression in SCN and DRG in an unbiased manner using SOM analysis. To compare the gene expression changes across the groups, fold-change (FC) values of all genes at 8, 16, and 24 wk for each tissue were calculated. Due to biological and technical variation resulting from different harvest time points and microarray batches, a log2-transformed fold-change ratio between db/+ and db/db was used for SOM input data. To enhance the visualization of SOM algorithms, Melikerion (Version 1.2.1) software (http://www.finndiane.fi/software/melikerion/) was used with a 7×7 grid structure 21. Genes having a similar FC pattern across the groups were gathered together in cells called ‘modules’. Functional enrichment analysis using DAVID (http://david.abcc.ncifcrf.gov) based on Gene Ontology with a Benjamini-Hochberg (BH) corrected p-value (<0.05) identified the enriched functions in each module 22. Pathway enrichment analysis was then performed to identify significantly enriched canonical pathways with a BH corrected p-value (<0.05) for the clusters of interest using Ingenuity Pathway Analysis software (www.qiagen.com/ingenuity).
Differential Expression Analysis
Conventional differential analysis was performed by pairwise comparisons between groups (db/+ vs. db/db) for each group in SCN and DRG. DEGs were determined using the Significance Analysis of Microarrays tool 23 with an estimated false discovery rate of <0.05 on the basis of 1,000 permutations. Next, DEG sets were identified at each time point to identify unique and common DEG sets between time points. To functionally characterize DEG sets common between all three time points, pathway enrichment analysis was then performed to identify significantly enriched canonical pathways with a BH corrected p-value (<0.05) using Ingenuity Pathway Analysis software (www.qiagen.com/ingenuity).
Multiplex Analysis
Cytokine levels were analyzed in SCN from an additional cohort of 8- (n = 6 per group) and 24-wk (n = 6 per group) db/+ and db/db mice as previously described 15. Briefly, SCN samples were homogenized and cytokine concentrations in the lysate were analyzed using MILLIPLEX xMAP magnetic bead technology (Millipore, Billerica, MA) with an MMP-12 (MMMP3MAG-79K) and custom cytokine/chemokine panel (MCYTOMAG-70K). Multiplex assays were run on a Bio- Plex200 multiplex array system with Bio-Plex Manager™ 6.0 software (BioRad, Hercules, CA) according to the manufacturer’s instructions. Protein levels of 17 immune markers were determined: eotaxin, IFN-γ, IL-1α, IL-1β, IL-4, IL-6, IL-10, IL-13, IP-10, KC, MCP-1, MIG, MIP-1α, MIP-1β, RANTES, TNF-α, and MMP-12.
Statistical Analysis
F-tests were used to determine whether data sets were normally distributed. For phenotypic measurements, which were normally distributed, statistically significant differences were determined using a two-tailed t-test. For Multiplex assays, which were non-normally distributed, comparisons were performed using the non-parametric Mann-Whitney U test. All tests were performed using Prism 6 software (GraphPad Software, La Jolla, CA).
RESULTS
Project Workflow
We attempted to identify key pathways in DPN by assessing gene expression changes at multiple time points in the db/db mouse model of T2D (Figure 1). First, db/+ control mice and db/db diabetic mice were phenotyped at 8, 16, and 24 wk to verify metabolic changes and the development of DPN. Next, SCN and DRG were harvested at 8, 16, and 24 wk. Gene expression was assessed using microarray technology, and parallel analyses using SOM and DEG identified pathways of interest. Results were cross-referenced and changes in the immune system were validated using multiplex protein analysis.
Figure 1. Study workflow.
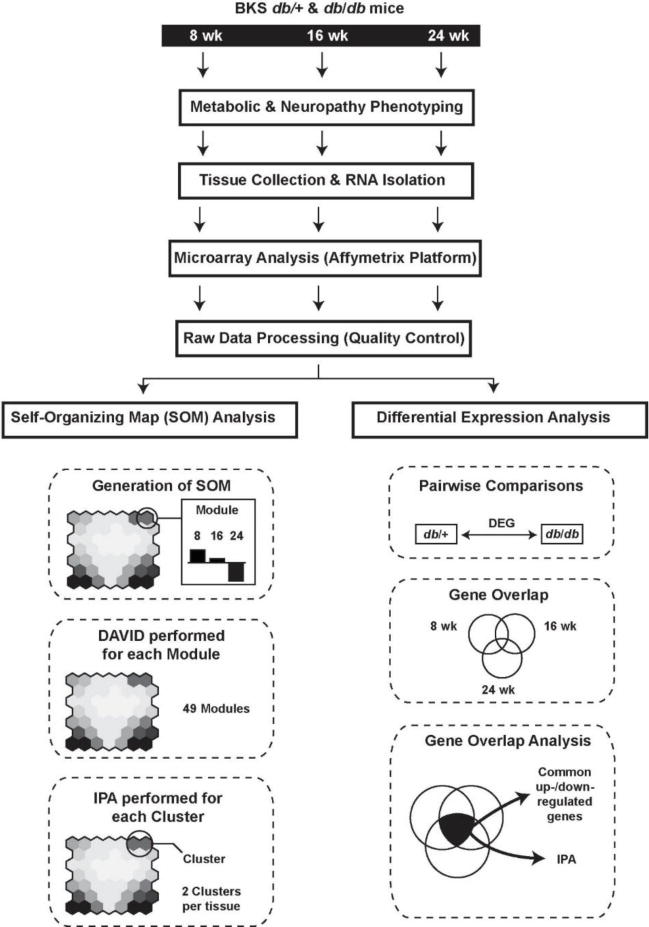
Control db/+ and diabetic db/db mice underwent phenotypic assessment at 8, 16, and 24 weeks of age. Mice were euthanized at each time point and the sciatic nerve and dorsal root ganglia collected; total RNA was collected from each tissue type, gene expression assessed using microarray, processed, and checked for quality. Processed data were then analyzed in parallel using SOM or DEG analysis. Functional enrichment and canonical molecular pathways associated with altered gene expression were identified using DAVID and IPA. Finally, multiplex was used to assess protein expression levels and validate pathways detected using SOM and DEG analyses.
Metabolic and Neuropathy Phenotyping
To verify that db/db mice develop long-term metabolic changes as well as DPN, body weights, and hyperglycemia for db/+ and db/db mice at 8, 16, and 24 wk of age were measured (Supplementary Figure 1). For all time points, db/db mice were significantly heavier than db/+ mice (Supplementary Figure 1A). FBG and GHb were significantly increased in db/db mice as well, particularly at later time points (Supplementary Figure 1B, 1C).
In parallel, we measured four standard metrics of neuropathy at 8, 16, and 24 weeks of age: sciatic motor NCV (Supplementary Figure 1D), sural NCV (Supplementary Figure 1E), hind-paw withdrawal latency (Supplementary Figure 1F), and intraepidermal nerve fiber density (IENFD) (Supplementary Figure 1G). IENFD was significantly reduced in 16 and 24 wk db/db mice compared to controls, while sural and sciatic NCVs were significantly reduced at all time points. Finally, hind-paw withdrawal latency was significantly increased at 16 and 24 wk of age. Together, these data indicate that db/db mice display metabolic changes over the course of their life and develop DPN that is particularly pronounced by 16 and 24 wk of age.
Self-Organizing Map Analysis
We next attempted to identify mechanistic pathways that are altered at all time points of DPN that can therefore serve as viable therapeutic targets. We used microarray technology to assess gene expression levels in the SCN and DRG of db/+ and db/db mice. First, to verify appropriate tissue dissections, we confirmed that expression levels of the skeletal muscle-specific transcript, myogenic differentiation 1 (Myod1) was negligible in DRG and SCN tissue, while positive controls were present in DRG (advillin, Avil) and SCN (peripheral myelin protein 22, Pmp22) (Supplementary Table 1). Using SOM analysis, we examined changes in gene expression patterns across the 8, 16, and 24 wk time points. For each tissue, the 17,856 genes detected were organized into a SOM consisting of 7×7 modules (Figure 2A, B). Each module represents a unique pattern of gene expression across the three time points. To visualize changes in gene expression in db/db mice compared to db/+ mice, modules with large expression changes are represented by red, whereas genes with smaller expression changes are blue. Each module was subjected to DAVID analysis to generate heat-maps for both SCN (Supplementary Figure 2) and DRG (Supplementary Figure 3). Adjacent modules with similar patterns and large changes in gene expression were grouped together into clusters. These clusters were then analyzed using IPA to identify canonical molecular pathways that were significantly altered in SCN and DRG (Tables 1–3).
Figure 2. Self-Organizing Map analysis.

SOM analysis was used to identify coherent patterns of gene expression in sciatic nerve (A) and dorsal root ganglia (C) at 8, 16, and 24 weeks of age. Genes with similar expression patterns were organized into modules; those with small expression changes relative to control mice organize into the center of the map (blue hexagons) while those with large changes organize in the corners (red hexagons). Modules with similar kinetic patterns were organized into clusters. Clusters from each tissue type were examined at 8, 16, and 24 weeks to determine how gene expression changed over the course of disease.
Table 1.
Pathway enrichment analysis of Sciatic Nerve Cluster 2. Significantly enriched canonical pathways among the shared genes in modules 7.6 and 7.7 from the SOM analysis using IPA*
| Ingenuity Canonical Pathways | p-value | Genes |
|---|---|---|
| TREM1 Signaling | .0380 | CXCL3, Naip1, TYROBP, TLR1, TLR7, LAT2, Tlr13, ITGAX |
| Granulocyte Adhesion and Diapedesis | .0380 | ITGB2, CXCL3, CLDN15, IL1RN, Ccl8, CCL3L3, MMP8, FPR2, CL17, CCL22, MMP12, IL18RAP |
| Primary Immunodeficiency Signaling | .0380 | IL7R, BLNK, PTPRC, ADA, IGHM, Ighg2b |
| Phagosome Formation | .0380 | CLEC7A, MSR1, TLR1, TLR7, PIK3R5, FCER1G, Tlr13, Ighg2b, FCGR3A/FCGR3B |
| Cell Cycle: G2/M DNA Damage Checkpoint Regulation | .0380 | TOP2A, CCNB2, BORA, PLK1, CDK1, CCNB1 |
| B Cell Development | .0380 | IL7R, PTPRC, SPN, IGHM, Ighg2b |
| Agranulocyte Adhesion and Diapedesis | .0430 | ITGB2, CXCL3, MYH2, CLDN15, IL1RN, Ccl8, CCL3L3, MMP8, MYL4, CCL17, CCL22, MMP12 |
| LPS/IL-1 Mediated Inhibition of RXR Function | .0470 | FMO2, APOC4, GSTA5, APOC2, GSTO1, IL18RAP, SLC27A5, ALDH1A1, IL1RN, CD14, ABCC3, FABP9, PPARGC1A |
| Leukocyte Extravasation Signaling | .0490 | ITGB2, RAC2, NCF1, SPN, ARHGAP9, CLDN15, TIMP1, MMP8, PIK3R5, CYBB, NCF4, MMP12 |
IPA: ingenuity pathway analysis; p-value: Benjamini-Hochberg (BH) corrected p-value.
Table 3.
Pathway enrichment analysis of Dorsal Root Ganglia Cluster 2. Significantly enriched canonical pathways among the shared genes in modules 1.6 and 1.7 from the SOM analysis using IPA*
| Ingenuity Canonical Pathways | p-value | Molecules |
|---|---|---|
| Granulocyte Adhesion and Diapedesis | < .0001 | CLDN11, SELL, CLDN15, MMP3, IL1RL1, Cldn13, IL1R2, CXCL13, CCL3L3, CXCR2, MMP8, Ccl6, HRH2, C5AR1, SDC1, Ppbp, FPR2, FPR1, SELPLG, Ccl9, IL18RAP, ITGB2, CLDN1, CLDN3, MMP9 |
| Leukocyte Extravasation Signaling | < .0001 | RAC2, CLDN11, SPN, MMP3, CLDN15, ARHGAP4, Cldn13, NCF4, SELPLG, BTK, ITGB2, TIMP4, NCF1, ARHGAP9, CLDN1, MMP8, CYBA, CYBB, VAV1, ACTG2, MMP9, CLDN3 |
| Agranulocyte Adhesion and Diapedesis | < .0001 | AOC3, CLDN11, SELL, C5AR1, CLDN15, MMP3, Ppbp, Cldn13, Ccl9, SELPLG, ITGB2, CXCL13, CLDN1, CXCR2, CCL3L3, MMP8, ACTG2, Ccl6, MMP9, CLDN3 |
| Atherosclerosis Signaling | .0001 | ALOX15, MMP3, CD36, APOC4, CMA1, APOC2, CCR2, PDGFC, TPSAB1/TPSB2, SELPLG, ITGB2, LYZ, S100A8, MMP9, RBP4 |
| LXR/RXR Activation | .0003 | TTR, IL1RL1, CD36, APOC4, APOC2, IL18RAP, IL1R2, LYZ, LY96, CD14, S100A8, LBP, MMP9, RBP4 |
| Coagulation System | .0019 | PLG, F10, F5, VWF, F13A1, TFPI, PLAT |
| Phagosome formation | .0081 | MRC1, CLEC7A, FCGR2A, TLR7, FCER1A, FCER1G, Tlr13, IGHG1, Ighg2b, FCGR3A/FCGR3B, INPP5D |
| FcÎ3 Receptor-mediated Phagocytosis in Macrophages and Monocytes | .0083 | PLD4, RAC2, NCF1, FCGR2A, HCK, VAV1, ACTG2, FCGR3A/FCGR3B, INPP5D, FGR |
| Complement System | .0145 | ITGB2, SERPING1, C5AR1, C1QC, CFH, C3AR1 |
| Role of Macrophages, Fibroblasts and Endothelial Cells in Rheumatoid Arthritis | .0145 | C5AR1, MMP3, IL1RL1, LTB, FZD9, IRAK3, IGHG1, PDGFC, IL18RAP, IL18R1, IL16, IL1R2, F2RL1, TLR7, Tlr13, Ighg2b, FZD2, FCGR3A/FCGR3B, IRAK2 |
| Extrinsic Prothrombin Activation Pathway | .0229 | F10, F5, F13A1, TFPI |
| LPS/IL-1 Mediated Inhibition of RXR Function | .0269 | CYP3A7, FMO2, SLC27A2, IL1RL1, APOC4, GSTA5, APOC2, ALAS1, IL18RAP, IL1R2, LY96, FABP4, CD14, ALDH3B1, LBP |
| Production of Nitric Oxide and Reactive Oxygen Species in Macrophages | .0309 | LYZ, NCF1, PTPN6, MPO, MAP3K6, CYBA, APOC4, CYBB, S100A8, APOC2, NCF4, SPI1, RBP4 |
| Hepatic Fibrosis/Hepatic Stellate Cell Activation | .0331 | CTGF, LEP, IL1RL1, PDGFC, IL18RAP, IL1R2, LY96, COL13A1, PDGFRA, CD14, LBP, MMP9, PDGFRB |
| Primary Immunodeficiency Signaling | .0398 | PTPRC, BTK, Igha, IGHG1, Ighg2b, AICDA |
| Inhibition of Angiogenesis by TSP1 | .0437 | SDC1, CD36, GUCY1A2, MMP9, GUCY1B3 |
| IL-10 Signaling | .0457 | IL1R2, CCR1, FCGR2A, IL1RL1, CD14, LBP, IL18RAP |
| B Cell Receptor Signaling | .0490 | PTPRC, BTK, RAC2, EBF1, PTPN6, APBB1IP, MAP3K6, FCGR2A, VAV1, IGHG1, Ighg2b, INPP5D |
| Communication Between Innate and Adaptive Immune Cells | .0490 | CCL3L3, Igha, TLR7, FCER1G, Tlr13, IGHG1, Ighg2b, Ccl9 |
| Natural Killer Cell Signaling | .0490 | RAC2, PTPN6, KLRD1, FCGR2A, TYROBP, FCER1G, VAV1, FCGR3A/FCGR3B, INPP5D |
IPA: ingenuity pathway analysis; p-value: Benjamini-Hochberg (BH) corrected p-value.
Within the SCN, IPA analysis of Cluster 1 detected changes in molecular pathways related to axonal loss, axonal and neuronal differentiation, neuronal projection development, and neurological system processing. These mechanisms were highly upregulated at 8 wk but downregulated by 24 wk (Figure 2B). Despite this, none of the canonical pathways identified using IPA reached the level of statistical significance at all three time points (data not shown). In contrast, pathways in Cluster 2 were upregulated at 8, 16, and 24 wk. Pathways that were significantly altered at all three time points were primarily associated with immune function including immune cell signaling, trafficking, and activity (Table 1).
Pathway changes were also detected in the DRG (Figure 2C). Cluster 1 contained pathways that were downregulated at all time points, particularly 8 and 24 wk (Figure 2D). Using IPA to detect enriched canonical pathways, we found that these downregulated pathways were related primarily to immune function, extracellular matrix function, and molecular signaling (Table 2). Pathways in Cluster 2 of the DRG paralleled those in the SCN: gene expression was upregulated at all time points (Figure 3D). Within Cluster 2 canonical pathways we observed upregulated genes primarily associated with immune functions (Table 3). In addition, several other enriched pathways, notably those related to the complement system and ROS production, play a central role in the immune response.
Table 2.
Pathway enrichment analysis of Dorsal Root Ganglia Cluster 1. Significantly enriched canonical pathways among the shared genes in modules 1.1 and 1.2 from the SOM analysis using IPA*
| Ingenuity Canonical Pathways | p-value | Genes |
|---|---|---|
| Hepatic Fibrosis/Hepatic Stellate Cell Activation | < .0001 | MYH4, ICAM1, MYL2, LEPR, COL2A1, COL8A1, MYH7, MMP2, IGFBP5, IL6, COL15A1, MET, COL1A1, COL6A3, CYP2E1, TGFB1, TIMP1, NGFR, COL6A5, COL18A1, STAT1, MYL3, COL3A1, MYH1 |
| Agranulocyte Adhesion and Diapedesis | .0002 | MYH4, ICAM1, MYL2, CLDN19, MMP16, MYH7, MMP2, CXCL16, HRH1, MMP23B, SELP, Ccl8, Ccl2, CXCL14, ACTC1, ACTA1, MYL3, Ccl7, MYH1, CCL1 |
| Calcium Signaling | .0028 | MYH4, TNNT1, MYL2, TNNI2, TNNT3, TNNC2, TNNC1, TRDN, MYH7, ATP2A1, CASQ1, RYR1, TNNI1, ACTC1, ACTA1, MYL3, MYH1 |
| Activation of IRF by Cytosolic Pattern Recognition Receptors | .0076 | IFIH1, IRF7, ZBP1, MAVS, STAT2, IRF9, IL6, STAT1, ADAR |
| Granulocyte Adhesion and Diapedesis | .0191 | ICAM1, CLDN19, MMP16, MMP2, ITGB3, CXCL16, HRH1, MMP23B, SELP, Ccl8, Ccl2, NGFR, CXCL14, Ccl7, CCL1 |
| Atherosclerosis Signaling | .0195 | COL1A1, PLA2G4A, PON1, ICAM1, LCAT, SELP, TGFB1, PLA2R1, COL2A1, IL6, COL18A1, COL3A1 |
| Death Receptor Signaling | .0209 | Naip1, PARP10, ZC3HAV1, APAF1, TNFSF10, PARP3, ACTC1, PARP9, ACTA1, PARP14 |
| Dendritic Cell Maturation | .0380 | COL1A1, ICAM1, DDR2, HLA-A, LEPR, NGFR, COL2A1, STAT2, IL6, COL18A1, STAT1, FCGR1A, HLA-DRB5, COL3A1 |
| Inhibition of Matrix Metalloproteases | .0389 | ADAM17, MMP23B, TIMP1, MMP16, MMP2, TFPI2 |
| Role of Pattern Recognition Receptors in Recognition of Bacteria and Viruses | .0417 | PTX3, IFIH1, IRF7, TGFB1, TLR1, CASP1, Oas1b, MAVS, IL6, OAS3, IL25 |
| ILK Signaling | .0417 | MYH4, MYL2, ACTN2, Actn3, MYH7, CCND1, ITGB3, PTGS2, PPP2R1B, ACTC1, Irs3, ACTA1, MYL3, MYH1 |
| Epithelial Adherens Junction Signaling | .0417 | MET, MYH4, RRAS2, TUBB6, MYL2, ACTN2, Actn3, MYH7, ACTC1, MYL3, ACTA1, MYH1 |
| Intrinsic Prothrombin Activation Pathway | .0437 | COL1A1, COL2A1, COL18A1, FGG, COL3A1 |
| HER-2 Signaling in Breast Cancer | .0490 | RRAS2, PARD6B, ERBB3, MMP2, ERBB2, CCND1, AREG, ITGB3 |
IPA: ingenuity pathway analysis; p-value: Benjamini-Hochberg (BH) corrected p-value.
Figure 3. Differential Expression Analysis.
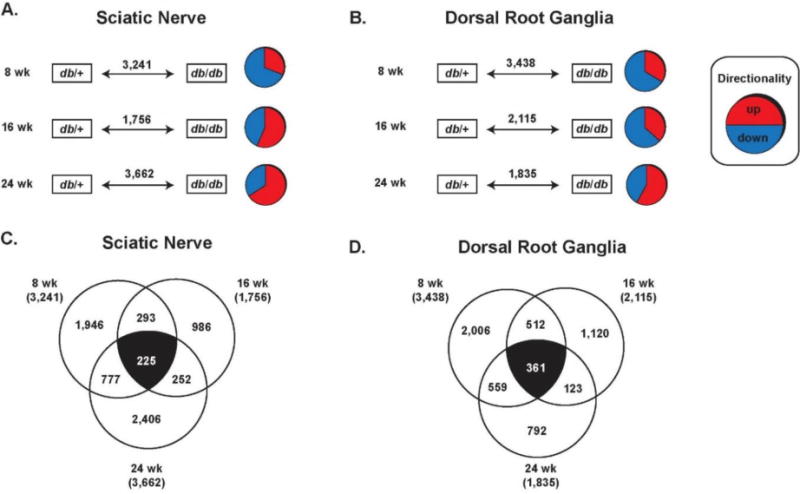
Gene expression from sciatic nerve (A, C) and dorsal root ganglia (B, D) were analyzed using differential expression analysis. (A, B) Significantly up- or down-regulated genes were detected in db/db mice (compared to db/+ control mice) at 8, 16, 24 weeks of age in both tissue types. (C, D) The number of genes that were significantly up- or down-regulated were compared between time points to identify genes that were altered over the entire course of DPN (white numbers).
Differential Expression Analysis
Results of microarray analyses can be highly variable, as different analyses can often yield very different results 24, 25. To complement our SOM analysis and strengthen these results, we also analyzed gene expression in SCN and DRG using Differentially Expressed Gene (DEG) analysis at 8, 16, and 24 wk and interpreted the resulting data using multiple techniques (Figure 1). We began by generating pairwise comparisons (db/+ vs. db/db) for each gene in the SCN and DRG at each time point (Figure 3A, 3B). For each comparison, if the difference between genes in db/+ vs. db/db mice are significantly different then they are considered to be differentially expressed. Thus, these genes are considered to be DEGs regardless of whether they are over- or under-expressed in db/db mice compared to controls. Using DEG analysis, we found that at 8 wk, 3,241 (SCN) and 3,438 (DRG) genes were significantly up- or down-regulated; at 16 wk, 1,756 (SCN) and 2,115 (DRG) DEGs were identified, while 3,662 (SCN) and 1,835 (DRG) DEGs were identified at 24 wk. Next, to determine which genes are differentially regulated throughout the course of disease, we compared the DEGs from all three time points in the SCN and in the DRG. Of the 8,659 DEGs detected in the SCN, we found that 225 genes were differentially expressed at all three time points (Figure 3C). Similarly, of the 7,388 DEGs in the DRG we identified 361 genes differentially expressed at 8, 16, and 24 wk (Figure 3D).
These two pools of genes (225 SCN, 361 DRG) were then analyzed using two separate methods to identify potential mechanisms of disease. First, a simple analysis was performed whereby the top 20 most upregulated and top 20 most downregulated genes were ranked for each tissue. In the SCN upregulated genes included those associated with bioenergetics but also with numerous aspects of the immune system, particularly Mmp12 (Supplementary Table 2). Downregulated genes included structural genes as well as several genes associated with immunity (Supplementary Table 3). Similarly, genes upregulated in the DRG were associated with immune function (Il1r2, Timp4) (Supplementary Table 4), while downregulated genes were associated with compromised lipid homeostasis (Them5, Pmp2) (Supplementary Table 5).
Next, IPA was used on both the SCN and DRG data sets to identify altered biological pathways within the DEGs at all three time points. Unsurprisingly, within the SCN the most highly enriched pathways were associated with atherosclerosis signaling and obesity-related leptin signaling. Also highly upregulated, however, were pathways associated with immune cell maturation, cytokine signaling, antigen presentation, the complement system, ROS, and graft-vs-host disease (Table 4). IPA analysis of DRG detected enriched pathways primarily related to biosynthesis (Table 5). However, the top enriched pathway was linked to the behavior of macrophages in rheumatoid arthritis, and several other immune-related pathways were detected including the fibrotic response, ROS activity, and pathogen-associated molecular pattern receptors. Together, these data support the SOM analysis and suggest that the immune system plays a role in DPN.
Table 4.
Pathway enrichment analysis of Sciatic Nerve DEGs. Significantly enriched canonical pathways among the shared DEGs at all time points using IPA*
| Ingenuity Canonical Pathways | p-value | Genes |
|---|---|---|
| Atherosclerosis Signaling | 5.13E-06 | Pon1, Pla2g2d, Il18, Apoc2, S100a8, Il1rn, Mmp9, Col2a1, Apoc4 |
| Leptin Signaling in Obesity | 1.05E-05 | Pik3r5, Adcy2, Pdia3, Lep, Lepr, Adcy8, Npy |
| Dendritic Cell Maturation | 1.45E-05 | Il18, Il1rn, Hla-Drb5, Hla-Dmb, Pik3r5, Pdia3, Col2a1, Lep, Lepr, Trem2 |
| LXR/RXR Activation | 2.45E-04 | Pon1, Il18, Apoc2, S100a8, Il1rn, Mmp9, Apoc4 |
| Hepatic Cholestasis | 2.63E-04 | Il18, Il1rn, Slco3a1, Adcy2, Prkch, Abcc3, Adcy8, Esr1 |
| Cellular Effects of Sildenafil (Viagra) | 3.63E-04 | Myl4, Prkg2, Adcy2, Pdia3, Myh10, Pde2a, Adcy8 |
| IL-12 Signaling and Production in Macrophages | 4.57E -04 | Apoc2, Pon1, Il18, S100a8, Pik3r5, Prkch, Apoc4 |
| Antigen Presentation Pathway | 5.37E-04 | Hla-Drb5, Hla-Dmb, Pdia3, Psmb9 |
| Complement System | 5.37E-04 | Itgax, Cfd, C6, C3ar1 |
| Hepatic Fibrosis/Hepatic Stellate Cell Activation | 5.89E -04 | Mmp9, Myl4, Igfbp3, Col2a1, Myh10, Lep, Lepr, Timp2 |
| P2Y Purigenic Receptor Signaling Pathway | 1.38E-03 | Gng4, Pik3r5, Adcy2, Pdia3, Prkch, Adcy8 |
| Graft-versus-Host Disease Signaling | 1.45E-03 | Il18, Il1rn, Hla-Drb5, Hla-Dmb |
| Sperm Motility | 1.51E-03 | Pla2g2d, Atp1a4, Prkg2, Pdia3, Prkch, Pde2a |
| GPCR-Mediated Nutrient Sensing in Enteroendocrine Cells | 1.70E-03 | Gng4, Adcy2, Pdia3, Prkch, Adcy8 |
| LPS/IL-1 Mediated Inhibition of RXR Function | 1.86E-03 | Il18, Apoc2, Gsto1, Il1rn, Fabp9, Slc27a3, Apoc4, Abcc3 |
| Relaxin Signaling | 2.63E-03 | Mmp9, Gng4, Pik3r5, Adcy2, Pde2a, Adcy8 |
| IL-8 Signaling | 2.88E-03 | Mmp9, Gng4, Pik3r5, Cstb, Itgax, Angpt1, Prkch |
| Clathrin-mediated Endocytosis Signaling | 2.95E-03 | Pon1, Apoc2, S100a8, Ubd, Pik3r5, Fgf18, Apoc4 |
| Thrombin Signaling | 3.55E-03 | Myl4, Gng4, Pik3r5, Adcy2, Pdia3, Prkch, Adcy8 |
| Nitric Oxide Signaling in the Cardiovascular System | 3.63E-03 | Adrb3, Prkg2, Pik3r5, Prkch, Pde2a |
IPA: ingenuity pathway analysis; p-value: Benjamini-Hochberg (BH) corrected p-value.
Table 5.
Pathway enrichment analysis of Dorsal Root Ganglia DEGs. Significantly enriched canonical pathways among the shared DEGs at all time points using IPA*
| Ingenuity Canonical Pathways | p-value | Genes |
|---|---|---|
| Role of Macrophages, Fibroblasts and Endothelial Cells in Rheumatoid Arthritis | 1.51E-03 | Sfrp5, F2rl1, Tlr7, Ccnd1, Il18rap, Lta, Prkcb, Pdia3, Il1r2, Frzb, Il6st, Pdgfc |
| Hepatic Fibrosis/Hepatic Cell Activation Stellate | 1.58E-03 | Agtr1b, Stat1, Il18rap, Il1r2, Lep, Myh8, Col13a1, Agtr1, Pdgfc |
| Tetrapyrrole Biosynthesis II | 2.09E-03 | Uros, Alas2 |
| Superoxide Radicals Degradation | 5.62E-03 | Gpx7, Nqo1 |
| Heme Biosynthesis II | 7.24E-03 | Uros, Alas2 |
| Retinol Biosynthesis | 1.23E-02 | Lrat, Esd, Lipg |
| Lanosterol Biosynthesis | 1.48E-02 | Lss |
| Chondroitin Sulfate Degradation (Metazoa) | 2.00E-02 | Chil3/Chil4, Mgea5 |
| The Visual Cycle | 2.00E-02 | Lrat, Rlbp1 |
| Neuroprotective Role of THOP1 in Alzheimer’s Disease | 2.09E-02 | Hla-A, Nfya, Mapt |
| Dermatan Sulfate Degradation (Metazoa) | 2.24E-02 | Chil3/Chil4, Mgea5 |
| S-methyl-5-thio-α-D-ribose 1-phosphate Degradation | 2.88E-02 | Apip |
| Formaldehyde Oxidation II (Glutathione-dependent) | 2.88E-02 | Esd |
| p70S6K Signaling | 3.09E-02 | F2rl1, Prkcb, Pdia3, Mapt, Agtr1 |
| GADD45 Signaling | 3.09E-02 | Ccnd1, Gadd45b |
| Protein Ubiquitination Pathway | 3.55E-02 | Usp1, Hspa1a/Hspa1b, HlaA, Usp54, Hsph1, Hspa4l, Usp18, Usp48 |
| Role of Pattern Recognition Receptors in Recognition of Bacteria and Viruses | 3.80E-02 | Tlr7, Lta, Oas2, Prkcb, Oas1b |
| UVA-Induced MAPK Signaling | 4.07E-02 | Stat1, Pdia3, Parp14, Smpd4 |
| Inosine-5′-phosphate Biosynthesis II | 4.37E-02 | Atic |
IPA: ingenuity pathway analysis; p-value: Benjamini-Hochberg (BH) corrected p-value.
We cannot exclude the possibility that genetic disruption of leptin signaling contributes to DPN progression in the db/db mouse. A comparison of Lep/Lepr gene regulation between the db/db model and non-genetic models of DPN could address this issue.
Multiplex Chemokine/Cytokine Analysis
To confirm that changes in the immune system occur in DPN, we used multiplex analysis to assess chemokine/cytokine protein levels in the SCN during early (8 wk) and late (24 wk) time points in both db/+ and db/db mice (Table 6). Consistent with our SOM and DEG analyses, we observed significant increases in immune markers, such as IL-10, eotaxin (also known as CCL11) at 24 wk, IFN-γ, and MMP-12. We next compared these increases to those observed in our microarray analysis (Figure 4). While we observed negligible increases or minor decreases in eotaxin, Ifng, and early Il10 gene expression in our micro array data sets, we observed increased gene expression of Il10 at 24 wk and increased Mmp12 expression during early and late DPN. These data further support a central role for the immune system in DPN and highlight several potential therapeutic targets.
Table 6.
Protein Expression in Sciatic Nerve During Early and Late Disease
| 8 Weeks of Age | 24 Weeks of Age | |||||
|---|---|---|---|---|---|---|
| Immune Marker | db/+ | db/db | p-value | db/+ | db/db | p-value |
| Eotaxin (CCL11) | 282.5 ± 61.87 | 382.2 ± 101.6 | 0.132 | 115.1 ± 21.7 | 168.7 ± 60.3 | *0.0379 |
| IFN-γ | 0 | 13.4 ± 12.4 | 0.606 | 0 | 6.4 ± 12.7 | 0.4615 |
| IL-1α | 0 | 10.4 ± 16.5 | 0.4545 | 0 | 5.8 ± 15.2 | 0.9999 |
| IL-1β | 14.3 ± 12.7 | 10.8 ± 12.9 | 0.8052 | 0 | 7.0 16.2 | 0.4615 |
| IL-4 | 0.8 ± 1.6 | 0.8 ± 1.8 | 0.9999 | 0.02 ± 0.1 | 2.0 ± 3.7 | 0.4615 |
| IL-6 | 17.7 ± 28.9 | 39.3 ± 36 | 0.1277 | 0 | 14.4 ± 27.6 | 0.4615 |
| IL-10 | 49.7 ± 8.3 | 97.1 ± 10.7 | **0.0099 | 55.3 ± 12.1 | 80.1 ± 17.6 | ** 0.0099 |
| IL-13 | 0 | 7.882 ± 19.3 | 0.9999 | 0 | 0 | NA |
| IP-10 (CXCL10) | 113.6 ± 19.0 | 124.0 ± 15.4 | 0.4848 | 65.8 ± 12.4 | 85.2 ± 23.2 | 0.1649 |
| KC (CXCL1) | 116.0 ± 23.2 | 98.3 ± 12.2 | 0.3095 | 42.3 ± 7.2 | 42.1 ± 7.6 | 0.9015 |
| MCP-1 | 92.1 ± 33.5 | 103.7 ± 7.8 | 0.3939 | 0.8 ± 0.8 | 2.0 ± 1.9 | 0.6807 |
| MIG (CXCL9) | 144.0 ± 32.1 | 164.5 ± 22.6 | 0.2403 | 79.9 ± 26.6 | 87.5 ± 19.5 | 0.3179 |
| MIP-1α | 42.6 ± 48.5 | 72.4 ± 15.1 | 0.0649 | 0 | 13.3 ± 19.3 | 0.1923 |
| MIP-1β | 36.4 ± 26.9 | 35.5 ± 5.5 | 0.132 | 0 | 4.1 ± 7.3 | 0.4615 |
| RANTES (CCL5) | 0 | 0 | NA | 0 | 0 | NA |
| TNF-α | 0 | 0 | NA | 0 | 3.6 ± 9.5 | 0.9999 |
| MMP-12 | 3.5 ± 6.8 | 334.6 ± 130.5 | **0.0022 | 6.9 ± 8.6 | 38.4 ±14.6 | **0.0012 |
Units = pg cytokine/chemokine per mg total protein lysate; data expressed as mean ± SD; comparisons made using Mann-Whitney,
p < 0.05,
p < 0.01;
NA = not applicable
Figure 4. Comparison of microarray and multiplex analyses.
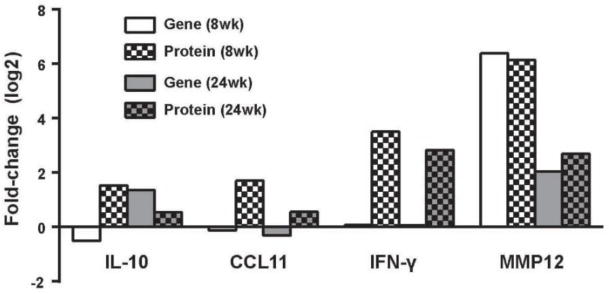
Protein expression patterns of four upregulated immune markers were examined at 8 and 24 weeks of age in sciatic nerve using multiplex analysis, and compared to gene expression levels generated using microarray. Columns represent the log2 fold-change in gene expression (solid bars) or protein (checkered bars) compared to control mice at the same time point.
DISCUSSION
Previous studies have examined molecular pathways associated with DPN progression; however, they have done so by examining gene expression during specific intervals. As molecular pathways involved in DPN may be altered during specific time windows, it is therefore important to examine pathway alterations across the entire disease course. Importantly, pathways commonly regulated at all stages of DPN would represent promising therapeutic targets, and the identification of these pathways thus formed the basis of the current study. In order to identify potential pathways of interest, we compared gene expression in the SCN and DRG of control db/+ and diabetic db/db mice at 8, 16, and 24 weeks of age using microarray. Data were then analyzed using two separate methods – SOM and DEG – and functional enrichment and canonical molecular pathways were identified using DAVID and IPA. Finally, gene expression data were verified using multiplex analysis to assess immune protein levels in the SCN at early (8 wk) and late (24 wk) stages of disease.
Metabolic and neuropathic phenotyping of control and diabetic mice demonstrated significant changes in db/db mice compared to controls at every time point. SOM and DEG analysis found increases in immune-associated pathways in both SCN and DRG across all time points. Subsequent protein quantification in SCN using multiplex analysis further found that IFN-γ, IL-10, and MMP-12 are all upregulated during early and late DPN. Together, these data indicate that the immune system is involved at all stages of DPN.
Inflammation is linked to obesity, with markers of inflammation upregulated in mouse models of disease as well as in diabetic patients 15, 26–32. Moreover, altering specific immune pathways can ameliorate insulin resistance and obesity in T2D 33–37. The role of immunity in diabetic neuropathy in Type 1 Diabetes Mellitus (T1D) has been established as well 38–40, and involvement of the immune system likely extends to DPN in T2D 4, 15, 31, 41, 42. T2D patients with DPN have higher levels of circulating inflammatory cytokines than both control patients and diabetic patients lacking neuropathy 43; immune cells such as monocytes – which are already more activated in patients with T2D 44–46 – traffic at increased rates to non-adipose tissue 47. However, the exact role of the immune system in DPN is not clear, as the immune system can protect or damage sensitive neuronal tissue depending on the local immune environment 48. Moreover, in the case of chronic inflammation, increased levels of both pro- and anti-inflammatory signals are often present simultaneously, further complicating our understanding of potential mechanisms 49.
The current study suggests a similar complex role for the immune system in DPN. Our SOM analysis – as well as increased eotaxin protein levels in SCN during late disease – suggests that immune cell recruitment is central to pathology. This is consistent with previous reports demonstrating that obesity results in increased levels of immune chemoattractants 36, 50 and that immune trafficking promotes diabetic complications including neuropathy 15 and nephropathy 51. Alternatively, the immune system may be playing – or attempting to play – a role in neuronal repair during DPN. SOM analysis and multiplex revealed that IL-10 production and associated pathways are upregulated in db/db mice during early and later stages of disease, and eotaxin – a Th2-associated chemokine – is upregulated at 24 wk as well. Both IL-10 and the Th2 response are associated with protection and tissue repair. Similarly, macrophages and neutrophils are centrally involved in neuronal repair 52–54 and myelin remodeling 55,56.
Involvement of macrophages in DPN is supported by previous studies as well our pathway analyses showing increased phagosome formation. Inflammation in obesity is based on the innate immune system 57, with monocyte-derived macrophages as the primary drivers of adipose tissue inflammation 26. Previous studies have found that monocytes from T2D patients have a pro-inflammatory profile 44–46, 58, that high glucose levels induce monocyte production of inflammatory signals 59, that depletion of macrophages can ameliorate neuropathic pain 60, and that macrophages are responsible for clearing debris from dying neurons 61 and injured peripheral nerves 62. In addition to phagocytosis of neuronal debris, macrophages are also necessary for the growth of new axons 63 and play a key role in suppressing local inflammation during the repair process via IL-10 production 64. Combined with our analyses highlighting phagosome-associated pathways, these observations suggest that macrophages are an important component in DPN pathogenesis, though their exact role is unclear.
Similarly, neutrophils can serve multiple functions, and their involvement in DPN is supported by our pathway analyses which highlight granulocyte adhesion and diapedesis as a major factor in DPN. Though commonly associated with pro-inflammatory defense against pathogens, neutrophils have been linked to inflammation in obesity 65. They are also key cells in initiating the repair response in neuronal tissue 53, 54. Their involvement in DPN may explain the discrepancy we observed between gene expression levels and protein levels: neutrophil granules contain a broad spectrum of cytokines, chemokines, and other immune factors that can be deployed quickly without requiring de novo synthesis 66. This aids in the rapid response to pathogens and may explain why we were able to detect increases in specific immune markers with multiplex and not microarray.
The role of innate immune cells such as macrophages and neutrophils in DPN is further reinforced by alterations in pathways associated with toll-like receptor (TLR) signaling. TLRs are used by immune cells to sense the local environment 67 and are often upregulated in patients with neuropathy or metabolic syndrome 68, 69. Receptor binding can mediate phagocytosis, and its expression can be induced on monocytes by high glucose levels 70. Moreover, saturated fatty acids can activate innate immune cells via TLRs 71–73 supporting the idea that innate immune cells are being differentially affected in the nervous tissue of db/db mice. However, TLRs are produced by and modulate the activity of a number of cell types, including DRG 74 and Schwann cells 75–77, so their role in DPN may not be limited entirely to the immune system.
Significant changes in soluble immune markers were also observed in SCN of diabetic mice during multiple stages of DPN. These changes are particularly important, as immune cell activity is strongly influenced by the local cytokine milieu 48. During both early and late time points, we observed increased levels of IL-10 which is consistent with the SOM analysis. IL-10 is typically associated with a protective immune function, but in neuropathy it can also associated with hyperalgesia 78, 79. Interestingly, we did not see any significant changes in SCN tumor necrosis factor (TNF)-α levels despite previous evidence associating elevated plasma TNF-α with obesity and T2D, and DPN. 68, 80–83 There are several possible reasons for this lack of expression. First, although TNF-α is involved in acute hyperalgesia and painful peripheral neuropathy 84, 85, peripheral nerve TNF-α levels do not directly associate with peripheral pain phenotypes across rodent models. Jolivalt et al. reported decreased SCN levels in allodynic, hyperalgesic STZ-rats,86 while Saleh et al. reported decreased DRG levels in hypoalgesic STZ-rats. 87 Similarly, TNF-α inhibition for 4 weeks in a prevention paradigm improved DPN phenotypes in a rat model of HFD-STZ neuropathy. 88 Second, many previous studies linking TNF-α to DPN were conducted in the streptozotocin-induced rodent 39, 86, 87, 89 which models autoimmune-driven T1D. Finally, TNF-α can drive neurite outgrowth 87, and its absence may be a sign of reduced neuronal repair in DPN.
Finally, we also found that MMP-12 was highly elevated in db/db mice. These changes were observed at the gene expression and protein levels and are consistent with our previous observations 14, 15. We also have preliminary data on MMP12 function, with in situ zymography data indicating an increase in MMP12 activity in the diabetic nerve environment (data not shown). MMP-12 can play multiple roles – both positive and negative – in neuronal tissue depending on the context 90. It has been shown to regulate both insulin sensitivity and inducible nitric oxide synthase (iNOS) 91 – an immune-mediated source of ROS – and can exacerbate existing tissue damage 92. The involvement of ROS would be consistent with our RNA data as well as previous studies 5, 93. However, the absence of MMP-12 also delays myelin formation 94 and can exacerbate damage to the nervous system in mouse models of multiple sclerosis 95. Thus, whether MMP-12 is playing a protective or destructive role in DPN is unclear. One hypothesis is that diabetes causes upregulation of plasminogen activator inhibitor-1 and MMPs, resulting in extracellular matrix remodeling and basement membrane thickening, leading to fibrosis and nerve dysfunction. Further investigation is needed to fully understand the role of MMP12 in DPN.
Together, our data point to the immune system as a major factor in DPN, with innate immune cells likely playing a central role. Multiple forms of analysis – SOM, DEG, and multiplex – all detected upregulated markers of immunity in DPN, and this involvement is consistent during all stages of disease. Interestingly, we observed that the local neuronal immune environment does not necessarily reflect previously reported global immune changes in diabetes. The exact role of the immune response in DPN therefore requires future study. However, the continued involvement of the immune system during all stages of DPN suggests that immune modification may be a viable therapeutic strategy.
Supplementary Material
Highlights.
We examined longitudinal transcriptomics patterns in SCN and DRG of db/db mice
Genes/pathways regulated across all stages of DPN are promising therapeutic targets
Immune-associated pathways were increased in both SCN and DRG at all time points
IFN-γ, IL-10, and MMP-12 proteins were upregulated in SCN during early and late DPN
These data indicate specific immune system involvement at all stages of DPN
Acknowledgments
The authors acknowledge the technical expertise of Mrs. Carey Backus and Mr. John M. Hayes at the University of Michigan, Ann Arbor, Michigan in conducting animal experiments. The authors thank Dr. Kelli A. Sullivan at the University of Michigan for performing comprehensive literature searches. This work utilized the Michigan Diabetes Research and Training Center at the University of Michigan, Ann Arbor, Michigan for GHb measurements (P30DK020572). The authors also thank the University of Michigan DNA Sequencing Core’s Affymetrix and Microarray Core Group for performing gene expression analysis.
Funding was provided by the National Institutes of Health (R24 DK082841, R01 DK107956 to ELF; T32 1T32DK101357-01 to AER), Novo Nordisk Foundation (NNF14SA0006 to E.L.F.), the American Diabetes Association postdoctoral award to M.P.), the Program for Neurology Research & Discovery, the Milstein, Nathan and Rose Research Fund; Sinai Medical Staff Foundation and the A. Alfred Taubman Medical Research Institute.
Footnotes
Publisher's Disclaimer: This is a PDF file of an unedited manuscript that has been accepted for publication. As a service to our customers we are providing this early version of the manuscript. The manuscript will undergo copyediting, typesetting, and review of the resulting proof before it is published in its final citable form. Please note that during the production process errors may be discovered which could affect the content, and all legal disclaimers that apply to the journal pertain.
CONFLICTS OF INTEREST
The author declare that they have no conflicts of interest.
References
- 1.Kim B, McLean LL, Philip SS, Feldman EL. Hyperinsulinemia induces insulin resistance in dorsal root ganglion neurons. Endocrinology. 2011;152:3638–47. doi: 10.1210/en.2011-0029. [DOI] [PMC free article] [PubMed] [Google Scholar]
- 2.Edwards JL, Vincent AM, Cheng HT, Feldman EL. Diabetic neuropathy: mechanisms to management. Pharmacol Ther. 2008;120:1–34. doi: 10.1016/j.pharmthera.2008.05.005. [DOI] [PMC free article] [PubMed] [Google Scholar]
- 3.Callaghan BC, Price RS, Feldman EL. Distal Symmetric Polyneuropathy: A Review. Jama. 2015;314:2172–81. doi: 10.1001/jama.2015.13611. [DOI] [PMC free article] [PubMed] [Google Scholar]
- 4.Pop-Busui R, Ang L, Holmes C, Gallagher K, Feldman EL. Inflammation as a Therapeutic Target for Diabetic Neuropathies. Current diabetes reports. 2016;16:29. doi: 10.1007/s11892-016-0727-5. [DOI] [PMC free article] [PubMed] [Google Scholar]
- 5.Hur J, Sullivan KA, Schuyler AD, Hong Y, Pande M, States DJ, Jagadish HV, Feldman EL. Literature -based discovery of diabetes- and ROS-related targets. BMC medical genomics. 2010;3:49. doi: 10.1186/1755-8794-3-49. [DOI] [PMC free article] [PubMed] [Google Scholar]
- 6.Hinder LM, Vivekanandan-Giri A, McLean LL, Pennathur S, Feldman EL. Decreased glycolytic and tricarboxylic acid cycle intermediates coincide with peripheral nervous system oxidative stress in a murine model of type 2 diabetes. J Endocrinol. 2013;216:1–11. doi: 10.1530/JOE-12-0356. [DOI] [PMC free article] [PubMed] [Google Scholar]
- 7.Hinder LM, Figueroa-Romero C, Pacut C, Hong Y, Vivekanandan-Giri A, Pennathur S, Feldman EL. Long-chain acyl coenzyme A synthetase 1 overexpression in primary cultured Schwann cells prevents long chain fatty acid-induced oxidative stress and mitochondrial dysfunction. Antioxid Redox Signal. 2014;21:588–600. doi: 10.1089/ars.2013.5248. [DOI] [PMC free article] [PubMed] [Google Scholar]
- 8.O’Brien PD, Hinder LM, Sakowski SA, Feldman EL. ER stress in diabetic peripheral neuropathy: A new therapeutic target. Antioxid Redox Signal. 2014;21:621–33. doi: 10.1089/ars.2013.5807. [DOI] [PubMed] [Google Scholar]
- 9.Hur J, Dauch JR, Hinder LM, Hayes JM, Backus C, Pennathur S, Kretzler M, Brosius FC, 3rd, Feldman EL. The Metabolic Syndrome and Microvascular Complications in a Murine Model of Type 2 Diabetes. Diabetes. 2015;64:3294–304. doi: 10.2337/db15-0133. [DOI] [PMC free article] [PubMed] [Google Scholar]
- 10.Wiggin TD, Kretzler M, Pennathur S, Sullivan KA, Brosius FC, Feldman EL. Rosiglitazone treatment reduces diabetic neuropathy in streptozotocin-treated DBA/2J mice. Endocrinology. 2008;149:4928–37. doi: 10.1210/en.2008-0869. [DOI] [PMC free article] [PubMed] [Google Scholar]
- 11.Pande M, Hur J, Hong Y, Backus C, Hayes JM, Oh SS, Kretzler M, Feldman EL. Transcriptional Profiling of Diabetic Neuropathy in the BKS db/db Mouse: A Model of Type 2 Diabetes. Diabetes. 2011;60:1981–9. doi: 10.2337/db10-1541. [DOI] [PMC free article] [PubMed] [Google Scholar]
- 12.Hur J, O’Brien PD, Nair V, Hinder LM, McGregor BA, Jagadish HV, Kretzler M, Brosius FC, 3rd, Feldman EL. Transcriptional networks of murine diabetic peripheral neuropathy and nephropathy: common and distinct gene expression patterns. Diabetologia. 2016;59:1297–306. doi: 10.1007/s00125-016-3913-8. [DOI] [PMC free article] [PubMed] [Google Scholar]
- 13.Hur J, Sullivan KA, Pande M, Hong Y, Sima AA, Jagadish HV, Kretzler M, Feldman EL. The identification of gene expression profiles associated with progression of human diabetic neuropathy. Brain. 2011;134:3222–35. doi: 10.1093/brain/awr228. [DOI] [PMC free article] [PubMed] [Google Scholar]
- 14.Hinder LM, Park M, Rumora AE, Hur J, Eichinger F, Pennathur S, Kretzler M, Brosius FC, 3rd, Feldman EL. Comparative RNA-Seq transcriptome analyses reveal distinct metabolic pathways in diabetic nerve and kidney disease. J Cell Mol Med. 2017;21:2140–52. doi: 10.1111/jcmm.13136. [DOI] [PMC free article] [PubMed] [Google Scholar]
- 15.O’Brien PD, Hur J, Hayes JM, Backus C, Sakowski SA, Feldman EL. BTBR ob/ob mice as a novel diabetic neuropathy model: Neurological characterization and gene expression analyses. Neurobiol Dis. 2015;73:348–55. doi: 10.1016/j.nbd.2014.10.015. [DOI] [PMC free article] [PubMed] [Google Scholar]
- 16.Oh SS, Hayes JM, Sims-Robinson C, Sullivan KA, Feldman EL. The effects of anesthesia on measures of nerve conduction velocity in male C57Bl6/J mice. Neurosci Lett. 2010;483:127–31. doi: 10.1016/j.neulet.2010.07.076. [DOI] [PMC free article] [PubMed] [Google Scholar]
- 17.Cheng HT, Dauch JR, Hayes JM, Hong Y, Feldman EL. Nerve growth factor mediates mechanical allodynia in a mouse model of type 2 diabetes. J Neuropathol Exp Neurol. 2009;68:1229–43. doi: 10.1097/NEN.0b013e3181bef710. [DOI] [PMC free article] [PubMed] [Google Scholar]
- 18.Cheng HT, Dauch JR, Hayes JM, Yanik BM, Feldman EL. Nerve growth factor/p38 signaling increases intraepidermal nerve fiber densities in painful neuropathy of type 2 diabetes. Neurobiol Dis. 2012;45:280–7. doi: 10.1016/j.nbd.2011.08.011. [DOI] [PMC free article] [PubMed] [Google Scholar]
- 19.Hinder LM, O’Brien PD, Hayes JM, Backus C, Solway AP, Sims-Robinson C, Feldman EL. Dietary reversal of neuropathy in a murine model of prediabetes and the metabolic syndrome. Dis Model Mech. 2017 doi: 10.1242/dmm.028530. [DOI] [PMC free article] [PubMed] [Google Scholar]
- 20.Dai M, Wang P, Boyd AD, Kostov G, Athey B, Jones EG, Bunney WE, Myers RM, Speed TP, Akil H, Watson SJ, Meng F. Evolving gene/transcript definitions significantly alter the interpretation of GeneChip data. Nucleic acids research. 2005;33:e175. doi: 10.1093/nar/gni179. [DOI] [PMC free article] [PubMed] [Google Scholar]
- 21.Makinen VP, Forsblom C, Thorn LM, Waden J, Gordin D, Heikkila O, Hietala K, Kyllonen L, Kyto J, Rosengard-Barlund M, Saraheimo M, Tolonen N, Parkkonen M, Kaski K, Ala-Korpela M, Groop PH, FinnDiane Study G Metabolic phenotypes, vascular complications, and premature deaths in a population of 4,197 patients with type 1 diabetes. Diabetes. 2008;57:2480–7. doi: 10.2337/db08-0332. [DOI] [PMC free article] [PubMed] [Google Scholar]
- 22.da Huang W, Sherman BT, Lempicki RA. Systematic and integrative analysis of large gene lists using DAVID bioinformatics resources. Nature protocols. 2009;4:44–57. doi: 10.1038/nprot.2008.211. [DOI] [PubMed] [Google Scholar]
- 23.Tusher VG, Tibshirani R, Chu G. Significance analysis of microarrays applied to the ionizing radiation response. Proc Natl Acad Sci U S A. 2001;98:5116–21. doi: 10.1073/pnas.091062498. [DOI] [PMC free article] [PubMed] [Google Scholar]
- 24.Rapaport F, Khanin R, Liang Y, Pirun M, Krek A, Zumbo P, Mason CE, Socci ND, Betel D. Comprehensive evaluation of differential gene expression analysis methods for RNA-seq data. Genome biology. 2013;14:R95. doi: 10.1186/gb-2013-14-9-r95. [DOI] [PMC free article] [PubMed] [Google Scholar]
- 25.Soneson C, Delorenzi M. A comparison of methods for differential expression analysis of RNA -seq data. BMC bioinformatics. 2013;14:91. doi: 10.1186/1471-2105-14-91. [DOI] [PMC free article] [PubMed] [Google Scholar]
- 26.Lumeng CN, Bodzin JL, Saltiel AR. Obesity induces a phenotypic switch in adipose tissue macrophage polarization. The Journal of clinical investigation. 2007;117:175–84. doi: 10.1172/JCI29881. [DOI] [PMC free article] [PubMed] [Google Scholar]
- 27.Lumeng CN. Innate immune activation in obesity. Molecular aspects of medicine. 2013;34:12–29. doi: 10.1016/j.mam.2012.10.002. [DOI] [PMC free article] [PubMed] [Google Scholar]
- 28.Lumeng CN, DelProposto JB, Westcott DJ, Saltiel AR. Phenotypic switching of adipose tissue macrophages with obesity is generated by spatiotemporal differences in macrophage subtypes. Diabetes. 2008;57:3239–46. doi: 10.2337/db08-0872. [DOI] [PMC free article] [PubMed] [Google Scholar]
- 29.O’Rourke RW, Lumeng CN. Obesity heats up adipose tissue lymphocytes. Gastroenterology. 2013;145:282–5. doi: 10.1053/j.gastro.2013.06.026. [DOI] [PMC free article] [PubMed] [Google Scholar]
- 30.Singer K, Lumeng CN. The initiation of metabolic inflammation in childhood obesity. J Clin Invest. 2017;127:65–73. doi: 10.1172/JCI88882. [DOI] [PMC free article] [PubMed] [Google Scholar]
- 31.O’Brien PD, Hinder LM, Callaghan BC, Feldman EL. Neurological consequences of obesity. Lancet Neurol. 2017;16:465–77. doi: 10.1016/S1474-4422(17)30084-4. [DOI] [PMC free article] [PubMed] [Google Scholar]
- 32.Cooper MA, Ryals JM, Wu PY, Wright KD, Walter KR, Wright DE. Modulation of diet-induced mechanical allodynia by metabolic parameters and inflammation. Journal of the peripheral nervous system : JPNS. 2017;22:39–46. doi: 10.1111/jns.12199. [DOI] [PMC free article] [PubMed] [Google Scholar]
- 33.Xu J, Morinaga H, Oh D, Li P, Chen A, Talukdar S, Mamane Y, Mancini JA, Nawrocki AR, Lazarowski E, Olefsky JM, Kim JJ. GPR105 ablation prevents inflammation and improves insulin sensitivity in mice with diet-induced obesity. Journal of immunology. 2012;189:1992–9. doi: 10.4049/jimmunol.1103207. [DOI] [PMC free article] [PubMed] [Google Scholar]
- 34.Zlotnikov-Klionsky Y, Nathansohn-Levi B, Shezen E, Rosen C, Kagan S, Bar-On L, Jung S, Shifrut E, Reich-Zeliger S, Friedman N, Aharoni R, Arnon R, Yifa O, Aronovich A, Reisner Y. Perforin-Positive Dendritic Cells Exhibit an Immuno-regulatory Role in Metabolic Syndrome and Autoimmunity. Immunity. 2015;43:776–87. doi: 10.1016/j.immuni.2015.08.015. [DOI] [PubMed] [Google Scholar]
- 35.Osborn O, Oh DY, McNelis J, Sanchez-Alavez M, Talukdar S, Lu M, Li P, Thiede L, Morinaga H, Kim JJ, Heinrichsdorff J, Nalbandian S, Ofrecio JM, Scadeng M, Schenk S, Hadcock J, Bartfai T, Olefsky JM. G protein-coupled receptor 21 deletion improves insulin sensitivity in diet-induced obese mice. The Journal of clinical investigation. 2012;122:2444–53. doi: 10.1172/JCI61953. [DOI] [PMC free article] [PubMed] [Google Scholar]
- 36.Li P, Oh DY, Bandyopadhyay G, Lagakos WS, Talukdar S, Osborn O, Johnson A, Chung H, Mayoral R, Maris M, Ofrecio JM, Taguchi S, Lu M, Olefsky JM. LTB4 promotes insulin resistance in obese mice by acting on macrophages, hepatocytes and myocytes. Nature medicine. 2015;21:239–47. doi: 10.1038/nm.3800. [DOI] [PMC free article] [PubMed] [Google Scholar]
- 37.Kleinridders A, Schenten D, Konner AC, Belgardt BF, Mauer J, Okamura T, Wunderlich FT, Medzhitov R, Bruning JC. MyD88 signaling in the CNS is required for development of fatty acid-induced leptin resistance and diet-induced obesity. Cell metabolism. 2009;10:249–59. doi: 10.1016/j.cmet.2009.08.013. [DOI] [PMC free article] [PubMed] [Google Scholar]
- 38.Urabe H, Terashima T, Kojima H, Chan L. Ablation of a small subpopulation of diabetes-specific bone marrow-derived cells in mice protects against diabetic neuropathy. American journal of physiology Endocrinology and metabolism. 2016;310:E269–75. doi: 10.1152/ajpendo.00381.2015. [DOI] [PMC free article] [PubMed] [Google Scholar]
- 39.Urabe H, Terashima T, Lin F, Kojima H, Chan L. Bone marrow-derived TNF-alpha causes diabetic neuropathy in mice. Diabetologia. 2015;58:402–10. doi: 10.1007/s00125-014-3440-4. [DOI] [PMC free article] [PubMed] [Google Scholar]
- 40.Zochodne DW, Ho LT. The influence of sulindac on experimental streptozotocin-induced diabetic neuropathy. The Canadian journal of neurological sciences Le journal canadien des sciences neurologiques. 1994;21:194–202. doi: 10.1017/s0317167100041160. [DOI] [PubMed] [Google Scholar]
- 41.Zhou J, Zhou S. Inflammation: therapeutic targets for diabetic neuropathy. Mol Neurobiol. 2014;49:536–46. doi: 10.1007/s12035-013-8537-0. [DOI] [PubMed] [Google Scholar]
- 42.O’Brien PD, Hinder LM, Parlee SD, Hayes JM, Backus C, Zhang H, Ma L, Sakowski SA, Brosius FC, 3rd, Feldman EL. Dual CCR2/CCR5 antagonist treatment attenuates adipose inflammation, but not microvascular complications in ob/ob mice. Diabetes Obes Metab. 2017;19:1468–72. doi: 10.1111/dom.12950. [DOI] [PMC free article] [PubMed] [Google Scholar]
- 43.Doupis J, Lyons TE, Wu S, Gnardellis C, Dinh T, Veves A. Microvascular reactivity and inflammatory cytokines in painful and painless peripheral diabetic neuropathy. The Journal of clinical endocrinology and metabolism. 2009;94:2157–63. doi: 10.1210/jc.2008-2385. [DOI] [PMC free article] [PubMed] [Google Scholar]
- 44.Giulietti A, Stoffels K, Decallonne B, Overbergh L, Mathieu C. Monocytic expression behavior of cytokines in diabetic patients upon inflammatory stimulation. Annals of the New York Academy of Sciences. 2004;1037:74–8. doi: 10.1196/annals.1337.011. [DOI] [PubMed] [Google Scholar]
- 45.Giulietti A, van Etten E, Overbergh L, Stoffels K, Bouillon R, Mathieu C. Monocytes from type 2 diabetic patients have a pro-inflammatory profile. 1,25-Dihydroxyvitamin D(3) works as anti-inflammatory. Diabetes Res Clin Pract. 2007;77:47–57. doi: 10.1016/j.diabres.2006.10.007. [DOI] [PubMed] [Google Scholar]
- 46.Omoto S, Nomura S, Shouzu A, Nishikawa M, Fukuhara S, Iwasaka T. Detection of monocyte-derived microparticles in patients with Type II diabetes mellitus. Diabetologia. 2002;45:550–5. doi: 10.1007/s00125-001-0772-7. [DOI] [PubMed] [Google Scholar]
- 47.Obstfeld AE, Sugaru E, Thearle M, Francisco AM, Gayet C, Ginsberg HN, Ables EV, Ferrante AW., Jr C-C chemokine receptor 2 (CCR2) regulates the hepatic recruitment of myeloid cells that promote obesity-induced hepatic steatosis. Diabetes. 2010;59:916–25. doi: 10.2337/db09-1403. [DOI] [PMC free article] [PubMed] [Google Scholar]
- 48.Davis MJ, Tsang TM, Qiu Y, Dayrit JK, Freij JB, Huffnagle GB, Olszewski MA. Macrophage M1/M2 polarization dynamically adapts to changes in cytokine microenvironments in Cryptococcus neoformans infection. mBio. 2013;4:e00264–13. doi: 10.1128/mBio.00264-13. [DOI] [PMC free article] [PubMed] [Google Scholar]
- 49.Murdock BJ, Shreiner AB, McDonald RA, Osterholzer JJ, White ES, Toews GB, Huffnagle GB. Coevolution of TH1, TH2, and TH17 responses during repeated pulmonary exposure to Aspergillus fumigatus conidia. Infection and immunity. 2011;79:125–35. doi: 10.1128/IAI.00508-10. [DOI] [PMC free article] [PubMed] [Google Scholar]
- 50.Guan R, Purohit S, Wang H, Bode B, Reed JC, Steed RD, Anderson SW, Steed L, Hopkins D, Xia C, She JX. Chemokine (C-C motif) ligand 2 (CCL2) in sera of patients with type 1 diabetes and diabetic complications. PloS one. 2011;6:e17822. doi: 10.1371/journal.pone.0017822. [DOI] [PMC free article] [PubMed] [Google Scholar]
- 51.Chow FY, Nikolic-Paterson DJ, Ozols E, Atkins RC, Tesch GH. Intercellular adhesion molecule-1 deficiency is protective against nephropathy in type 2 diabetic db/db mice. Journal of the American Society of Nephrology : JASN. 2005;16:1711–22. doi: 10.1681/ASN.2004070612. [DOI] [PubMed] [Google Scholar]
- 52.London A, Cohen M, Schwartz M. Microglia and monocyte-derived macrophages: functionally distinct populations that act in concert in CNS plasticity and repair. Frontiers in cellular neuroscience. 2013;7:34. doi: 10.3389/fncel.2013.00034. [DOI] [PMC free article] [PubMed] [Google Scholar]
- 53.Butterfield TA, Best TM, Merrick MA. The dual roles of neutrophils and macrophages in inflammation: a critical balance between tissue damage and repair. Journal of athletic training. 2006;41:457–65. [PMC free article] [PubMed] [Google Scholar]
- 54.Kurimoto T, Yin Y, Habboub G, Gilbert HY, Li Y, Nakao S, Hafezi-Moghadam A, Benowitz LI. Neutrophils express oncomodulin and promote optic nerve regeneration. The Journal of neuroscience : the official journal of the Society for Neuroscience. 2013;33:14816–24. doi: 10.1523/JNEUROSCI.5511-12.2013. [DOI] [PMC free article] [PubMed] [Google Scholar]
- 55.Rawji KS, Mishra MK, Yong VW. Regenerative Capacity of Macrophages for Remyelination. Front Cell Dev Biol. 2016;4:47. doi: 10.3389/fcell.2016.00047. [DOI] [PMC free article] [PubMed] [Google Scholar]
- 56.Martini R, Fischer S, Lopez-Vales R, David S. Interactions between Schwann cells and macrophages in injury and inherited demyelinating disease. Glia. 2008;56:1566–77. doi: 10.1002/glia.20766. [DOI] [PubMed] [Google Scholar]
- 57.Subramanian M, Ozcan L, Ghorpade DS, Ferrante AW, Jr, Tabas I. Suppression of Adaptive Immune Cell Activation Does Not Alter Innate Immune Adipose Inflammation or Insulin Resistance in Obesity. PloS one. 2015;10:e0135842. doi: 10.1371/journal.pone.0135842. [DOI] [PMC free article] [PubMed] [Google Scholar]
- 58.Yang M, Gan H, Shen Q, Tang W, Du X, Chen D. Proinflammatory CD14+CD16+ monocytes are associated with microinflammation in patients with type 2 diabetes mellitus and diabetic nephropathy uremia. Inflammation. 2012;35:388–96. doi: 10.1007/s10753-011-9374-9. [DOI] [PubMed] [Google Scholar]
- 59.Shanmugam N, Reddy MA, Guha M, Natarajan R. High glucose-induced expression of proinflammatory cytokine and chemokine genes in monocytic cells. Diabetes. 2003;52:1256–64. doi: 10.2337/diabetes.52.5.1256. [DOI] [PubMed] [Google Scholar]
- 60.Willemen HL, Eijkelkamp N, Garza Carbajal A, Wang H, Mack M, Zijlstra J, Heijnen CJ, Kavelaars A. Monocytes/Macrophages control resolution of transient inflammatory pain. The journal of pain : official journal of the American Pain Society. 2014;15:496–506. doi: 10.1016/j.jpain.2014.01.491. [DOI] [PMC free article] [PubMed] [Google Scholar]
- 61.Pope HM, Voigt MM. Peripheral glia have a pivotal role in the initial response to axon degeneration of peripheral sensory neurons in zebrafish. PloS one. 2014;9:e103283. doi: 10.1371/journal.pone.0103283. [DOI] [PMC free article] [PubMed] [Google Scholar]
- 62.Chen P, Piao X, Bonaldo P. Role of macrophages in Wallerian degeneration and axonal regeneration after peripheral nerve injury. Acta neuropathologica. 2015;130:605–18. doi: 10.1007/s00401-015-1482-4. [DOI] [PubMed] [Google Scholar]
- 63.Niemi JP, DeFrancesco-Lisowitz A, Roldan-Hernandez L, Lindborg JA, Mandell D, Zigmond RE. A critical role for macrophages near axotomized neuronal cell bodies in stimulating nerve regeneration. The Journal of neuroscience : the official journal of the Society for Neuroscience. 2013;33:16236–48. doi: 10.1523/JNEUROSCI.3319-12.2013. [DOI] [PMC free article] [PubMed] [Google Scholar]
- 64.Shechter R, London A, Varol C, Raposo C, Cusimano M, Yovel G, Rolls A, Mack M, Pluchino S, Martino G, Jung S, Schwartz M. Infiltrating blood-derived macrophages are vital cells playing an anti-inflammatory role in recovery from spinal cord injury in mice. PLoS medicine. 2009;6:e1000113. doi: 10.1371/journal.pmed.1000113. [DOI] [PMC free article] [PubMed] [Google Scholar]
- 65.Brotfain E, Hadad N, Shapira Y, Avinoah E, Zlotnik A, Raichel L, Levy R. Neutrophil functions in morbidly obese subjects. Clinical and experimental immunology. 2015;181:156–63. doi: 10.1111/cei.12631. [DOI] [PMC free article] [PubMed] [Google Scholar]
- 66.Borregaard N, Sorensen OE, Theilgaard-Monch K. Neutrophil granules: a library of innate immunity proteins. Trends in immunology. 2007;28:340–5. doi: 10.1016/j.it.2007.06.002. [DOI] [PubMed] [Google Scholar]
- 67.Akira S, Takeda K. Toll-like receptor signalling. Nature reviews Immunology. 2004;4:499–511. doi: 10.1038/nri1391. [DOI] [PubMed] [Google Scholar]
- 68.Zhu T, Meng Q, Ji J, Lou X, Zhang L. Toll-like receptor 4 and tumor necrosis factor-alpha as diagnostic biomarkers for diabetic peripheral neuropathy. Neuroscience letters. 2015;585:28–32. doi: 10.1016/j.neulet.2014.11.020. [DOI] [PubMed] [Google Scholar]
- 69.Jialal I, Huet BA, Kaur H, Chien A, Devaraj S. Increased toll-like receptor activity in patients with metabolic syndrome. Diabetes care. 2012;35:900–4. doi: 10.2337/dc11-2375. [DOI] [PMC free article] [PubMed] [Google Scholar]
- 70.Dasu MR, Devaraj S, Zhao L, Hwang DH, Jialal I. High glucose induces toll-like receptor expression in human monocytes: mechanism of activation. Diabetes. 2008;57:3090–8. doi: 10.2337/db08-0564. [DOI] [PMC free article] [PubMed] [Google Scholar]
- 71.Huang S, Rutkowsky JM, Snodgrass RG, Ono-Moore KD, Schneider DA, Newman JW, Adams SH, Hwang DH. Saturated fatty acids activate TLR-mediated proinflammatory signaling pathways. Journal of lipid research. 2012;53:2002–13. doi: 10.1194/jlr.D029546. [DOI] [PMC free article] [PubMed] [Google Scholar]
- 72.Lee JY, Sohn KH, Rhee SH, Hwang D. Saturated fatty acids, but not unsaturated fatty acids, induce the expression of cyclooxygenase-2 mediated through Toll-like receptor 4. The Journal of biological chemistry. 2001;276:16683–9. doi: 10.1074/jbc.M011695200. [DOI] [PubMed] [Google Scholar]
- 73.Lee JY, Zhao L, Youn HS, Weatherill AR, Tapping R, Feng L, Lee WH, Fitzgerald KA, Hwang DH. Saturated fatty acid activates but polyunsaturated fatty acid inhibits Toll-like receptor 2 dimerized with Toll-like receptor 6 or 1. The Journal of biological chemistry. 2004;279:16971–9. doi: 10.1074/jbc.M312990200. [DOI] [PubMed] [Google Scholar]
- 74.Nowicki M, Muller K, Serke H, Kosacka J, Vilser C, Ricken A, Spanel-Borowski K. Oxidized low-density lipoprotein (oxLDL)-induced cell death in dorsal root ganglion cell cultures depends not on the lectin-like oxLDL receptor-1 but on the toll-like receptor-4. Journal of neuroscience research. 2010;88:403–12. doi: 10.1002/jnr.22205. [DOI] [PubMed] [Google Scholar]
- 75.Cheng C, Qin Y, Shao X, Wang H, Gao Y, Cheng M, Shen A. Induction of TNF-alpha by LPS in Schwann cell is regulated by MAPK activation signals. Cellular and molecular neurobiology. 2007;27:909–21. doi: 10.1007/s10571-007-9215-4. [DOI] [PMC free article] [PubMed] [Google Scholar]
- 76.Oliveira RB, Ochoa MT, Sieling PA, Rea TH, Rambukkana A, Sarno EN, Modlin RL. Expression of Toll-like receptor 2 on human Schwann cells: a mechanism of nerve damage in leprosy. Infection and immunity. 2003;71:1427–33. doi: 10.1128/IAI.71.3.1427-1433.2003. [DOI] [PMC free article] [PubMed] [Google Scholar]
- 77.Lee H, Jo EK, Choi SY, Oh SB, Park K, Kim JS, Lee SJ. Necrotic neuronal cells induce inflammatory Schwann cell activation via TLR2 and TLR3: implication in Wallerian degeneration. Biochemical and biophysical research communications. 2006;350:742–7. doi: 10.1016/j.bbrc.2006.09.108. [DOI] [PubMed] [Google Scholar]
- 78.Uceyler N, Riediger N, Kafke W, Sommer C. Differential gene expression of cytokines and neurotrophic factors in nerve and skin of patients with peripheral neuropathies. Journal of neurology. 2015;262:203–12. doi: 10.1007/s00415-014-7556-8. [DOI] [PubMed] [Google Scholar]
- 79.Wagner R, Janjigian M, Myers RR. Anti-inflammatory interleukin-10 therapy in CCI neuropathy decreases thermal hyperalgesia, macrophage recruitment, and endoneurial TNF-alpha expression. Pain. 1998;74:35–42. doi: 10.1016/S0304-3959(97)00148-6. [DOI] [PubMed] [Google Scholar]
- 80.Duksal T, Tiftikcioglu BI, Bilgin S, Kose S, Zorlu Y. Role of inflammation in sensory neuropathy in prediabetes or diabetes. Acta neurologica Scandinavica. 2015 doi: 10.1111/ane.12474. [DOI] [PubMed] [Google Scholar]
- 81.Mu ZP, Wang YG, Li CQ, Lv WS, Wang B, Jing ZH, Song XJ, Lun Y, Qiu MY, Ma XL. Association Between Tumor Necrosis Factor-alpha and Diabetic Peripheral Neuropathy in Patients with Type 2 Diabetes: a Meta-Analysis. Molecular neurobiology. 2017;54:983–96. doi: 10.1007/s12035-016-9702-z. [DOI] [PubMed] [Google Scholar]
- 82.Hussain G, Rizvi SA, Singhal S, Zubair M, Ahmad J. Serum levels of TNF-alpha in peripheral neuropathy patients and its correlation with nerve conduction velocity in type 2 diabetes mellitus. Diabetes Metab Syndr. 2013;7:238–42. doi: 10.1016/j.dsx.2013.02.005. [DOI] [PubMed] [Google Scholar]
- 83.Roman-Pintos LM, Villegas-Rivera G, Rodriguez-Carrizalez AD, Miranda-Diaz AG, Cardona-Munoz EG. Diabetic Polyneuropathy in Type 2 Diabetes Mellitus: Inflammation, Oxidative Stress, and Mitochondrial Function. J Diabetes Res. 2016;2016:3425617. doi: 10.1155/2016/3425617. [DOI] [PMC free article] [PubMed] [Google Scholar]
- 84.Cuellar JM, Montesano PX, Carstens E. Role of TNF-alpha in sensitization of nociceptive dorsal horn neurons induced by application of nucleus pulposus to L5 dorsal root ganglion in rats. Pain. 2004;110:578–87. doi: 10.1016/j.pain.2004.03.029. [DOI] [PubMed] [Google Scholar]
- 85.Martini R, Willison H. Neuroinflammation in the peripheral nerve: Cause, modulator, or bystander in peripheral neuropathies? Glia. 2016;64:475–86. doi: 10.1002/glia.22899. [DOI] [PMC free article] [PubMed] [Google Scholar]
- 86.Jolivalt CG, Mizisin LM, Nelson A, Cunha JM, Ramos KM, Bonke D, Calcutt NA. B vitamins alleviate indices of neuropathic pain in diabetic rats. Eur J Pharmacol. 2009;612:41–7. doi: 10.1016/j.ejphar.2009.04.028. [DOI] [PubMed] [Google Scholar]
- 87.Saleh A, Smith DR, Balakrishnan S, Dunn L, Martens C, Tweed CW, Fernyhough P. Tumor necrosis factor-alpha elevates neurite outgrowth through an NF-kappaB-dependent pathway in cultured adult sensory neurons: Diminished expression in diabetes may contribute to sensory neuropathy. Brain research. 2011;1423:87–95. doi: 10.1016/j.brainres.2011.09.029. [DOI] [PubMed] [Google Scholar]
- 88.Shi X, Chen Y, Nadeem L, Xu G. Beneficial effect of TNF-alpha inhibition on diabetic peripheral neuropathy. J Neuroinflammation. 2013;10:69. doi: 10.1186/1742-2094-10-69. [DOI] [PMC free article] [PubMed] [Google Scholar]
- 89.Yamakawa I, Kojima H, Terashima T, Katagi M, Oi J, Urabe H, Sanada M, Kawai H, Chan L, Yasuda H, Maegawa H, Kimura H. Inactivation of TNF-alpha ameliorates diabetic neuropathy in mice. Am J Physiol Endocrinol Metab. 2011;301:E844–52. doi: 10.1152/ajpendo.00029.2011. [DOI] [PMC free article] [PubMed] [Google Scholar]
- 90.Agrawal SM, Lau L, Yong VW. MMPs in the central nervous system: where the good guys go bad. Seminars in cell & developmental biology. 2008;19:42–51. doi: 10.1016/j.semcdb.2007.06.003. [DOI] [PubMed] [Google Scholar]
- 91.Lee JT, Pamir N, Liu NC, Kirk EA, Averill MM, Becker L, Larson I, Hagman DK, Foster-Schubert KE, van Yserloo B, Bornfeldt KE, LeBoeuf RC, Kratz M, Heinecke JW. Macrophage metalloelastase (MMP12) regulates adipose tissue expansion, insulin sensitivity, and expression of inducible nitric oxide synthase. Endocrinology. 2014;155:3409–20. doi: 10.1210/en.2014-1037. [DOI] [PMC free article] [PubMed] [Google Scholar]
- 92.Wells JE, Biernaskie J, Szymanska A, Larsen PH, Yong VW, Corbett D. Matrix metalloproteinase (MMP)-12 expression has a negative impact on sensorimotor function following intracerebral haemorrhage in mice. The European journal of neuroscience. 2005;21:187–96. doi: 10.1111/j.1460-9568.2004.03829.x. [DOI] [PubMed] [Google Scholar]
- 93.Sandireddy R, Yerra VG, Areti A, Komirishetty P, Kumar A. Neuroinflammation and oxidative stress in diabetic neuropathy: futuristic strategies based on these targets. International journal of endocrinology. 2014;2014:674987. doi: 10.1155/2014/674987. [DOI] [PMC free article] [PubMed] [Google Scholar]
- 94.Larsen PH, DaSilva AG, Conant K, Yong VW. Myelin formation during development of the CNS is delayed in matrix metalloproteinase-9 and -12 null mice. The Journal of neuroscience : the official journal of the Society for Neuroscience. 2006;26:2207–14. doi: 10.1523/JNEUROSCI.1880-05.2006. [DOI] [PMC free article] [PubMed] [Google Scholar]
- 95.Goncalves DaSilva A, Yong VW. Matrix metalloproteinase-12 deficiency worsens relapsing-remitting experimental autoimmune encephalomyelitis in association with cytokine and chemokine dysregulation. The American journal of pathology. 2009;174:898–909. doi: 10.2353/ajpath.2009.080952. [DOI] [PMC free article] [PubMed] [Google Scholar]
Associated Data
This section collects any data citations, data availability statements, or supplementary materials included in this article.