

SUMMARY
Defects in patterning during human embryonic development frequently result in craniofacial abnormalities. The gene regulatory programs that build the craniofacial complex are likely controlled by information located between genes and within intronic sequences. However, systematic identification of regulatory sequences important for forming the human face has not been performed. Here, we describe comprehensive epigenomic annotations from human embryonic craniofacial tissues and systematic comparisons with multiple tissues and cell types. We identified thousands of tissue-specific craniofacial regulatory sequences and likely causal regions for rare craniofacial abnormalities. We demonstrate significant enrichment of common variants associated with orofacial clefting in enhancers active early in embryonic development, while those associated with normal facial variation are enriched near the end of the embryonic period. These data are provided in easily accessible formats for both craniofacial researchers and clinicians to aid future experimental design and interpretation of noncoding variation in those affected by craniofacial abnormalities.
In Brief
Wilderman et al. report the global identification of gene regulatory sequences active in early human craniofacial development. Systematic comparisons with over 120 different human tissues and cell types reveal shared and craniofacial-specific enhancers. Craniofacial enhancers are enriched with genetic associations for both orofacial clefting risk and face shape.
INTRODUCTION
Formation of the craniofacial complex is an intricate process of precisely timed events that occurs relatively early in vertebrate embryonic development. For example, in human embryonic development, the majority of the events that lead to the formation of the human face and skull occur during the first 10 weeks of gestation (Schoenwolf et al., 2009). Defects in the orchestration of these events result in several different congenital abnormalities, including orofacial clefting and craniosynostosis. Worldwide, orofacial clefting is one of the most common birth defects, affecting ~1 in 700 live births (World Health Organization, 2003). The majority of those affected with these types of clefting do not have defects in other tissues or organ systems, and, thus, they are referred to as non-syndromic (Mossey and Modell, 2012). While these birth defects are largely repairable through surgical means, the financial, sociological, and psychological effects have a much broader impact and represent a significant public health burden (Boulet et al., 2009; Wehby and Cassell, 2010; Wehby et al., 2011, 2012). Screening, prevention, and non-surgical therapeutic options are thus highly desirable. The high heritability of such disorders suggests a major genetic component (Grosen et al., 2010, 2011); however, causative genetic changes have only been identified in a fraction of those affected (Beaty et al., 2016; Thieme and Ludwig, 2017).
In the past decade, numerous genome-wide association studies, copy number variant analyses, and whole-exome sequencing studies have sought to identify genetic sources of risk for craniofacial defects and normal human facial variation (Beaty et al., 2010; Bureau et al., 2014; Camargo et al., 2012; Claes et al., 2018; Conte et al., 2016; Leslie et al., 2017; Letra et al., 2010; Lidral et al., 2015; Ludwig et al., 2012, 2016, 2017; Mangold et al., 2010, 2016; Mostowska et al., 2018; Yu et al., 2017; Yuan et al., 2011). These studies identified common and rare variants associated with these phenotypes, but most are located in noncoding portions of the genome preventing functional interpretation and prioritization. Our genomes are littered with gene regulatory sequences, located primarily in intronic and intergenic sequences, which are active in a small number of tissues and/or developmental stages in humans (Roadmap Epigenomics Consortium et al., 2015). While the regulatory potential of the human genome is still not completely understood, defects in regulatory sequences can cause non-syndromic developmental defects in humans and mice (Lettice et al., 2003; Petit et al., 2016; Sagai et al., 2005; Weedon et al., 2014). Of particular interest for craniofacial abnormalities, recurrent deletions of noncoding DNA near the SOST and SOX9 genes have been implicated in Van Buchem disease and Pierre Robin sequence, respectively (Balemans et al., 2002; Benko et al., 2009). These findings, coupled with the non-syndromic nature of most orofacial clefting and craniosynostosis cases (Leslie and Marazita, 2015; Timberlake et al., 2016), suggest defective gene regulatory sequences may underlie much of the incidence of craniofacial abnormalities.
Despite the common nature of such birth defects and defined windows of embryonic development in which they likely occur, mapping of chromatin states and identification of craniofacial-specific regulatory sequences have not been addressed by large functional genomics efforts such as Encyclopedia of DNA Elements (ENCODE) and Roadmap Epigenome (Roadmap Epigenomics Consortium et al., 2015). These large-scale projects have profiled chromatin states in cultured cell types derived in vitro from embryonic stem cells, fetal tissues from greater than 90 days of gestation, or adult post mortem samples, but they have not examined primary embryonic tissues. The embryonic period of human development, the first 8 weeks of gestation when much of craniofacial development occurs (Schoenwolf et al., 2009), has thus far been only characterized with a smaller number of functional genomics experiments in the developing limb and cortex and cultured cranial neural crest cells (CNCCs) (Prescott et al., 2015). Particularly, comparisons of epigenomic signals in human and chimp CNCCs revealed differential utilization of regulatory sequences that may play roles in the normal formation and evolution of the human face. However, it is unclear how closely these culture models recapitulate early human craniofacial development.
The lack of primary, tissue-specific genomic annotations from this critical period of human development has impeded the identification of regulatory circuitry important for human craniofacial development, and it has prevented accurate interpretation of clinical genetic findings in patients with craniofacial disorders (Thieme and Ludwig, 2017). Without sufficient biological context, prioritization and developing of hypotheses to test genetic associations with craniofacial abnormalities are hindered (Dixon et al., 2011; Khandelwal et al., 2013; Leslie and Marazita, 2015; Rahimov et al., 2012). Here, we present a comprehensive resource of functional genomics data and predicted chromatin states for critical stages of early human craniofacial development. We have profiled multiple biochemical marks of chromatin activity in developing human craniofacial tissue samples encompassing 4.5–8 post-conception weeks. We have comprehensively compared these data with publicly available functional genomics data from 127 epigenomes. We provide annotations consistent with large consortia efforts (Roadmap Epigenomics Consortium et al., 2015) in formats easily loadable into modern genome browsers to enable exploration by other researchers without large computational effort. In total, our analyses have identified thousands of previously unknown craniofacial enhancer sequences that will enable future experimental testing of enhancer-target gene interactions in developing craniofacial tissues. More importantly, this resource will facilitate future clinical interpretation of genetic variation in the context of congenital craniofacial defects that lack clear changes in the copy number or coding sequence of genes.
RESULTS
Profiling of Histone Modifications in Developing Human Embryonic Craniofacial Tissue
Chromatin immunoprecipitation of post-translational histone modifications coupled with next-generation sequencing (ChIP-seq) is a powerful method to identify active regulatory sequences in a global fashion from a wide variety of biological contexts (Roadmap Epigenomics Consortium et al., 2015). Many of the regulatory elements identified by this method are specific to the biological context queried (Visel et al., 2009; Zhu et al., 2013) (i.e., tissue type or developmental stage), and they are enriched for genetic associations with disease in a relevant tissue (i.e., immune-related disorder associations in immune cell-specific enhancers) (Farh et al., 2015; Pasquali et al., 2014).
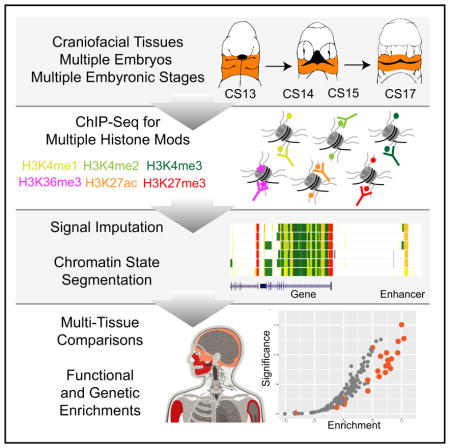
To identify regulatory sequences important for human craniofacial development, we utilized ChIP-seq of six post-translational histone modifications across multiple stages and multiple biological replicates of early human craniofacial development. We focused our efforts on histone modifications profiled by large consortia and strongly associated with multiple states of chromatin activity. We performed parallel ChIP-seq experiments on craniofacial tissues obtained from 17 individual human embryos spanning a critical window for the formation of the human orofacial apparatus (Figure 1A). Specifically, we profiled marks ranging from those associated with repression (H3K27me3), promoter activation (H3K4me3), active transcription (H3K36me3), and various states of enhancer activation (H3K4me1, H3K4me2, and H3K27ac) (Figure 1B) (Ernst et al., 2011). We profiled at least three individual human embryonic craniofacial samples from each of four distinct Carnegie stages (CSs) (CS13, CS14, CS15, and CS17) encompassing 4.5 post-conception weeks (pcw) to 6 pcw (Schoenwolf et al., 2009). We also profiled single biological samples from CS20 (8-pcw) and 10-pcw embryos (Figure 1C). We obtained over 5.3 billion ChIP-seq reads across a total of 106 datasets, with mean total reads and uniquely aligned reads per sample of 50.3 and 37.3 million, respectively, meeting guidelines proposed by ENCODE (Landt et al., 2012) (Table S1).
Figure 1. Overview of Epigenomic Profiling of Early Human Craniofacial Development.

(A) Stages and craniofacial tissues (orange shading) of human embryonic development sampled in this study, indicated as individual Carnegie stages (CSs) or approximate post-conception weeks (pcw). Voids or cleavages in the embryo are indicated by black-shaded regions and do not indicate deformities.
(B) Six post-translational modifications of histones were profiled in parallel from individual human embryos via ChIP-seq.
(C) Signals from primary ChIP-seq data were imputed using ChromImpute (Ernst and Kellis, 2015) to match the 12 epigenomic signals profiled by Roadmap Epigenome (Roadmap Epigenomics Consortium et al., 2015). Asterisks indicate signals containing only imputed data. These imputed datasets were then used to predict chromatin states using a Hidden Markov Model approach (ChromHMM) (Ernst and Kellis, 2012) across the genome for each craniofacial tissue sample. These chromatin states were then used for downstream functional analyses to determine relevance for craniofacial biology and disease. (See also Figure S1 and Table S1.)
Overall the samples correlated well by mark and stage of development (Figures 2A, S1A, and S1B). We uniformly processed these data to identify reproducibly enriched regions for each mark within each stage. The genomic features identified by each set of enriched regions closely mirror what has previously been reported for each of these post-translational marks (Figures 2B and S1C) (Ernst et al., 2011; Zhu et al., 2013). For example, we observed very strong enrichment of H3K4me3 at promoters of genes, and we identified a large number of intronic or intergenic regions enriched for H3K27ac. When we examined all the samples for a given CS, we identified thousands of enriched regions, at each stage for each mark, that were found in at least two biological replicates (Figure 2C). Combined, these results indicated that our ChIP-seq data from primary human embryonic tissues were of high quality, reflected the previously described nature of these marks, and were likely to identify tissue-specific regulatory sequences.
Figure 2. Histone Modification Profiles in Human Craniofacial Development.

(A) Heatmap and hierarchical clustering of pairwise Pearson correlations for non-overlapping 10-kb bins across the human genome for 114 individual histone modification profiles from human craniofacial tissues. Relatedness of epigenomic profiles by sample is indicated by dendrogram along the vertical axes of the heatmap. Darker orange indicates positive correlation between datasets.
(B) Genomic feature annotations identified by peak calls from six histone modification profiles from the same tissue sample plotted as cumulative percentage of total peaks. Peak enrichments and genomic annotations were performed using HOMER (Heinz et al., 2010).
(C) Histone modification peaks identified in at least two separate tissue samples from the same developmental stage and annotated into three broad categories: promoter (2 kb upstream of transcription start site [TSS]), exons, and all other intronic or intergenic locations. (See also Figure S1 and Table S1.)
Generation of Human Craniofacial Chromatin State Segmentations
Defining enriched regions for a single histone modification such as H3K27ac has been utilized to identify active regulatory sequences from a variety of tissues, biological contexts, and different species (Cotney et al., 2013; Dickel et al., 2016; Nord et al., 2013; Reilly et al., 2015; Villar et al., 2015). However, in the absence of H3K27ac, other marks can identify active regulatory sequences, and low levels of H3K27ac may be present at enhancers that are either about to become active or are no longer active (Bonn et al., 2012; Cotney et al., 2012; Kumar et al., 2016). More advanced methods, such as using machine-learning techniques and integrating multiple chromatin signals from a single tissue, allow segmentation of the genome into a more complex array of biological states (Ernst and Kellis, 2012; Hoffman et al., 2012). These techniques can identify tissue-specific and disease-relevant regulatory information in heterogenous tissues that might not be readily apparent from gene expression data or analysis of promoter activation states (Ernst et al., 2011; Hoffman et al., 2013).
To leverage such available data to identify regulatory information likely to be critical for craniofacial development, we processed our data in a uniform fashion to match those generated by Roadmap Epigenome (Roadmap Epigenomics Consortium et al., 2015). We first generated p value-based signals calculated on enrichment versus paired-input controls (Feng et al., 2012; Landt et al., 2012) for each of the six epigenomic marks we assayed. Then, using the same type of signals for 12 epigenomic marks for 127 tissues and cell types generated by Roadmap Epigenome, we imputed our data to create a uniform, directly comparable dataset of ChIP-seq signals (Ernst and Kellis, 2015). The imputed samples’ signals correlated well with their primary signals and clustered generally by mark and biological function (Figures 3A, S1D, and S1E). Using the imputed craniofacial data, we then segmented the genome using ChromHMM for each embryonic sample based on previously generated models of 15, 18, and 25 states of chromatin activity (Roadmap Epigenomics Consortium et al., 2015). We identified similar numbers and proportions of segments in each state in our tissues (Figures 3B and S2). The 25-state model results showed the most similar trends across these measures, and they utilized all of the primary data generated in our study when compared to those previously generated by Roadmap Epigenome (Figures 3C, 3D, and S2); therefore, we focused our downstream analyses on these segmentations.
Figure 3. Imputation of Craniofacial Epigenomic Signals and Chromatin State Segmentation.

(A) Principal-component analysis projection of first two component dimensions for 252 imputed and 114 primary epigenomic profiles for human craniofacial samples across non-overlapping 10-kb bins. Samples are color coded by epigenomic mark and shapes indicate primary versus imputed data types. Samples generally cluster into three broad categories of activity: repression, regulatory element activation, and transcription regulation. (See also Figures S1D and S1E.)
(B) Numbers of individual chromatin state segments identified by each of the color-coded 25 states of chromatin activity based on imputed epigenomic signals for each of the 21 tissue samples profiled.
(C) Comparison of cumulative percentage of each chromatin state between craniofacial samples profiled here and 127 segmentations generated by Roadmap Epigenome (Roadmap Epigenomics Consortium et al., 2015).
(D) Mean numbers of segments annotated in each of the 25 states across 21 craniofacial samples (orange) and 127 Roadmap Epigenomes (gray). Error bars represent SD. Overall chromatin state segmentation in craniofacial samples identifies similar numbers and percentages of each of 25 states published by Roadmap Epigenome (Roadmap Epigenomics Consortium et al., 2015). (See also Figure S2.)
Large active chromatin domains over the promoters of genes have been shown to identify critical regulators in developing tissues and differentiation models (Bernstein et al., 2006; Cotney et al., 2012; Rada-Iglesias et al., 2012; Whyte et al., 2013). Additionally, overlapping domains of activation and repressive-associated signals (H3K27ac, H3K4me3, and H3K27ame3) are potent identifiers of genes poised for activation in embryonic stem cells, or they display restricted domains or gradients of expression in heterogenous embryonic tissue samples (Bernstein et al., 2006; Cotney et al., 2012; Rada-Iglesias et al., 2012; Rada-Iglesias and Wysocka, 2011). These bivalent signals were originally identified in embryonic stem cell cultures (Bernstein et al., 2006), but they were most recently reported in developing mouse pharyngeal arch tissue as important markers for the regulation of neural crest positional identity, and they were shown to play important roles in Drosophila development (Kang et al., 2017; Minoux et al., 2017). These findings emphasize the biological importance of such chromatin states in developmental patterning, and they indicate that genes marked with such states are likely important for proper craniofacial development. These overlapping signals were annotated by a bivalent state in the 25-state model (23_PromBiv) and identified 957 genes with bivalent promoters. The genes identified by this bivalent state were strongly enriched for DNA-binding proteins, most significantly homeobox-containing transcription factors, and enriched for factors previously identified to play a role in embryonic cranial skeleton morphogenesis, such as the gene pair DLX5 and DLX6 (Figures 4A and S3) (Robledo et al., 2002).
Figure 4. Large Bivalent Domains at Gene Pair DLX5 and DLX6.

(A) UCSC Genome Browser shot of locus encompassing the DLX5/DLX6 locus. At top are chromatin state segmentations for all tissue samples. Purple states indicate bivalent regions. Imputed signals and peak calls for representative samples from each stage and for each indicated histone mark are shown below.
(B) DNA-binding proteins identified as having a bivalent promoter state in human embryonic craniofacial development. Genes in bold were also identified as having bivalent status during early mouse craniofacial development (Minoux et al., 2017). (See also Figure S3 and Table S2.)
In total, we identified 189 DNA-binding factors likely to be critical regulators of craniofacial development based on chromatin states (Table S2). Because of the important role ascribed to genes with bivalent status, as mentioned above, we sought to determine if any of the bivalent marks we identified were shared with previous data or specific for craniofacial tissue. To address this, we overlapped our bivalent state calls with the same bivalent state calls from all samples profiled by Roadmap Epigenome. Of the 957 genes identified above, only 7 genes were shown to have bivalent regions within 5 kb of their transcription start site (Table S2). In particular, we identified EGR1 and COX7A1 with a bivalent chromatin status not previously observed in Roadmap Epigenome. EGR1 has been implicated in cranial cartilage development in zebrafish and expressed in early cartilage in mice (McMahon et al., 1990), while COX7A1 was shown to be differentially expressed in samples from patients with cleft lip only versus cleft lip and palate (Jakobsen et al., 2009). When we analyzed genes reported to have bivalent status in mouse craniofacial tissues (Minoux et al., 2017), 106 of 708 genes shared this status between human and mouse. Of these 106, 62 were DNA-binding proteins identified in our data, representing a significant enrichment in this class of protein among all bivalent genes (2.77-fold increase, Fisher p < 0.0001; Figure 4B; Table S2).
Lastly, to determine if this trend extends beyond chromatin marks to regions actively engaged by both activating and repressing complexes, we interrogated genes cobound in HUES64 human embryonic stem cells (ESCs) by BRD1, a component of the MOZ/MORF acetyltransferase complex, and RING1B, a component of Polycomb Repressive Complex 1 (PRC1) (Kang et al., 2017). We observed 134 genes of 609 cobound by these complexes had bivalent status in our data, the majority being DNA-binding factors (n = 92; 2.2-fold enrichment, Fisher p < 0.0001; Table S2). Follow-up studies of these bivalent genes, especially the DNA-binding proteins, and the complexes that generate these states in a craniofacial context may reveal previously unknown roles in normal formation of the mammalian face and skull.
Identification of Craniofacial-Specific Enhancers and Craniofacial Super-enhancers
Having shown that our segmentations identify activation and/or poising of promoters important for craniofacial development, we next turned to regulatory portions of the genome. Using the 25-state segmentations, we reproducibly identified 75,928 segments in our craniofacial sample from at least one of six enhancer categories defined by Roadmap Epigenome (EnhA1, EnhA2, EnhAF, EnhW1, EnhW2, and EnhAc). To determine if our chromatin state segmentations identify bona fide craniofacial enhancers, we first compared craniofacial enhancer segments with H3K27ac ChIP-seq peak calls previously identified in cultured CNCCs (Prescott et al., 2015). We found 30-fold (p < 10−4) and 12-fold (p < 10−4) enrichment of overlaps with the top 5,000 active CNCC enhancers and the top 1,000 human-biased CNCC enhancers, respectively (Figures S4A and S4B).
We then turned to a large catalog of experimentally validated developmental enhancers tested in mouse embryos and available in the Vista Enhancer Browser (Visel et al., 2007). We identified over 80% of all craniofacial-positive enhancers in this database (n = 170). Moreover, our enhancer annotations were significantly enriched for craniofacial enhancers versus those that lacked craniofacial activity (p = 3.28 × 10⁻¹⁴) (Figures 5A, 5B, and S4C). While these results are encouraging, namely, that our data identified true craniofacial developmental enhancers, the chromatin state annotations alone do not reveal the specificity of individual regulatory regions nor do they identify target genes. To initially address this question, we quantitatively compared enhancer-associated H3K27ac signals at 425,380 enhancers from our craniofacial segmentations and 127 segmentations from Roadmap Epigenome. Both hierarchical clustering and principal-component analysis showed that our samples were well correlated with one another in this multi-tissue context (Figures 5C and S5). They were most similar to ESCs and cell types derived from them (embryonic stem cell-derived; ESDR), but they were distinct from fetal and adult samples present in Roadmap Epigenome data, suggesting our annotations harbor regulatory information not previously annotated by Roadmap Epigenome. We also uniformly processed raw epigenomic data from human CNCCs (Prescott et al., 2015) with our alignment, imputation, and segmentation pipeline. We found that the chromatin state segmentations for CNCC samples showed significant differences in the overall number and size of all chromatin states versus our data as well as Roadmap Epigenome (Figures S2I and S2J). Additionally, principal-component analysis of H3K27ac signal showed these cell types formed a cluster distinct from both the other ESDR types and our craniofacial samples (Figure 5C). These results are likely due to differences in sequencing depth, the host of marks profiled, or distinct differences in the derivation of these cell types versus primary tissues that we cannot tease apart in this study. We therefore excluded chromatin state segmentations from these cell types from downstream multi-tissue comparisons.
Figure 5. Chromatin State Segmentations Identify Craniofacial-Specific Regulatory Sequences.

(A) Percentage of in vivo-validated embryonic enhancers with (orange) or without (gray) craniofacial activity from the Vista Enhancer Browser (Visel et al., 2007) identified by craniofacial chromatin segments annotated as enhancer states. Significance was determined by Fisher’s exact test.
(B) Selected validated enhancers with craniofacial activity identified by this study from the Vista Enhancer Browser. (See also Figure S4.)
(C) Principal-component analysis projection of second and third component dimensions for 149 H3K27ac profiles at 425,568 regions annotated as enhancer segments in any of the samples profiled here or by Roadmap Epigenome. Samples are color coded by group annotations assigned by Roadmap Epigenome or craniofacial samples from this study. Percentages of variance across samples explained by each component are indicated along each axis. (See also Figure S5.)
(D) Transcription factor position weight matrices identified by HOMER (Heinz et al., 2010) as enriched in craniofacial-specific enhancer segments. (See also Table S3.)
(E) Significant enrichments of human disease phenotypes for genes assigned to craniofacial-specific enhancer segments, as reported by GREAT (McLean et al., 2010). (See also Figures S6 and S7.)
(F) Enrichment of anatomical expression of transcription factors identified as potentially regulated by craniofacial-specific enhancer segments, as reported by GeneORGANizer (Gokhman et al., 2017). Heat indicates fold enrichment of expression in individual anatomical region or organ. Craniofacial and appendicular skeleton showed the most significant enrichments.
Due to the isolated, tissue-specific nature of many craniofacial defects, we hypothesized that enhancers identified only in developing craniofacial tissues would be enriched near genes implicated in craniofacial abnormalities. To identify such enhancers in craniofacial tissue, we determined if any of our enhancer segments were ever annotated in Roadmap Epigenome. Overlaying our segmentations on those from 127 samples identified 6,651 enhancer segments specific for craniofacial development (8.7% of total craniofacial enhancer segments) (Table S1; Figure S6). To determine if these sites are relevant for craniofacial development or represent spurious segmentations in our data, we analyzed sequence content of these regions and functional enrichments of genes potentially regulated by these regions. When we assessed the craniofacial-specific enhancers for enrichment of transcription factor-binding sites, we identified motifs matching those of TWIST2, LMX1B, SIX1, NKX6.1, multiple members of the LHX and HOX families, and TCF12, all of which have been implicated in craniofacial and skeletal development (Brunskill et al., 2014; Chen et al., 1998; Gendron-Maguire et al., 1993; Laclef et al., 2003; Marchegiani et al., 2015; Sharma et al., 2013; Zhao et al., 1999; Figure 5D; Table S3). Utilizing the Genomic Regions Enrichment of Annotations Tool (GREAT) (McLean et al., 2010), we found significant enrichment of craniofacial-specific enhancers assigned to genes associated with craniofacial abnormalities, such as cleft palate in both humans and mice (Figure 5E). Interestingly, we also identified more general categories of enrichment among the putative gene targets, including general transcriptional activators (Table S3). When we interrogated this list of transcription factors for tissue-specific biology (Gokhman et al., 2017), we found significant enrichment for phenotypes related to craniofacial and appendicular skeleton (Figure 5F).
The above analyses focused on the annotation and activation state of individual genome segments. However, these enhancers likely do not operate in isolation, and clusters of enhancers activated in concert have been shown to be powerful regulators of important genes for a given tissue or cell type (Whyte et al., 2013). To identify such enhancer clusters, we applied the rank order of super enhancers (ROSE) (Whyte et al., 2013) algorithm for identifying super-enhancers as well as a sliding window approach to detect enrichment of craniofacial enhancer states relative to both randomly chosen sequences as well as those identified by Roadmap Epigenome. We identified 581 regions across the genome that demonstrated enrichment for craniofacial enhancers or identified as a super-enhancer region (Table S4). These windows had an average size of ~400 kb but ranged up to 2 Mb in length. In many cell types, these clusters of enhancers are embedded in the genome both surrounding and within the introns of their likely tissue-specific target (Hnisz et al., 2013). Indeed, most of the super-enhancer regions and enhancer-enriched windows we identified contained multiple genes (mean of 4.7 genes per window) and were enriched for developmental genes, including multiple FZD, WNT, ALX, DLX, and TBX family members (Table S4). These super-enhancer regions encompass virtually all of the same bivalent domains identified above (951 of 957), suggesting they have complex, concerted activation by regulatory elements throughout the developing craniofacial complex.
The most significantly enriched super-enhancer region based on both fractions of bases annotated as an enhancer state and H3K27ac signals across all craniofacial samples encompassed the PRDM16 gene. The promoter of this gene is identified as a bivalent region, and both the large noncoding region upstream and large intronic sequences are littered with strongly active enhancers (Figure S7). Work in mice has identified point mutations in Prdm16 that give rise to cleft palate, but a role for this gene in human craniofacial abnormalities has not been concretely identified (Bjork et al., 2010). The PRDM16 protein has been implicated in the methylation of H3K9, suggesting this protein could also be involved in maintaining bivalent states described above (Pinheiro et al., 2012). The strong epigenomic signals we identified in primary tissue surrounding this gene, its bivalent promoter, and reported histone modification activity suggest this gene may contribute to the regulation of many genes in craniofacial development.
Enrichment of Orofacial Clefting and Facial Variation Genetic Associations in Craniofacial Enhancers
The results above suggest that many of the craniofacial enhancers we identified are likely to play a direct role in the patterning of bones of the face, jaws, and portions of the skull. However, it is unclear whether they are directly involved in human craniofacial abnormalities. To begin to explore whether the enhancers we identified play a role in craniofacial abnormalities, we first turned to regulatory regions previously identified as causative in two distinct craniofacial syndromes. Van Buchem disease is a rare disorder characterized by bone overgrowth in the jaws and skull (Van Hul et al., 1998). A large noncoding deletion was identified in a Dutch family between the MEOX1 and SOST genes (Balemans et al., 2002). All of our chromatin state segmentations identified several strong enhancer states in this window, including at least one region previously tested in the developing mouse based on conservation (Loots et al., 2005). However, we also identified a craniofacial-specific enhancer state overlapping a deeply conserved sequence (ERC7) as well as enhancers that lacked significant conservation in this interval that could play a role in Van Buchem disease (Figure 6A). We then turned to Pierre Robin sequence (PRS), a syndrome characterized by a reduced lower jaw, misplacement of the tongue, and frequent occurrence of cleft palate (Tan and Farlie, 2013). Genetic mapping in several multi-generational families affected by PRS identified recurrent deletions and translocations in a 2.46-Mb noncoding region between KCNJ2 and SOX9 (Benko et al., 2009; Gordon et al., 2014). Our data identified numerous shared and craniofacial-specific enhancers throughout this region (Figure 6B). Most importantly, for two families with overlapping genetic changes, we identified craniofacial-specific enhancers within this region, including one overlapping the 200-bp sequence hypothesized to be causative in at least one of these families (F1 and F2 from Benko et al., 2009). Our craniofacial-specific segmentations also identified at least two other highly conserved regions upstream of the originally tested sequence, one of which showed craniofacial regulatory capacity (Figure 6C) (Gordon et al., 2014).
Figure 6. Human Craniofacial Enhancers Identify Regions Important for Van Buchem Disease and Pierre Robin Sequence.

(A) UCSC Genome Browser shot of locus encompassing the large noncoding region flanked by MEOX1 and SOST. Region deleted in a Dutch family affected by Van Buchem disease is indicated by the black bar. Conserved regions (ERC) tested by Loots et al. (2005) are indicated above conservation tracks. Craniofacial-specific enhancer near ERC7 is indicated in orange. Additional regions annotated with strong craniofacial enhancer states but with relatively low conservation in the Van Buchem interval are indicated by purple box.
(B) UCSC Genome Browser shot of locus encompassing the large noncoding region flanked by KCNJ2 and SOX9 and associated with Pierre Robin sequence (PRS). Black bars indicate intervals altered in PRS families as previously reported by Benko et al. (2009). Region encompassing the F2 mutation is highlighted in the following panel.
(C) Enlarged view of F1 deletion region and conserved noncoding element affected by F2 mutation (HCNE-F2). Craniofacial-specific enhancer regions are indicated by orange bars. A portion of one of these regions was tested in the Vista Enhancer Browser (mm628). Inset panel shows enhancer activity of mm628 in embryonic day (E) 11.5 mouse embryos from the Vista Enhancer Browser. (See also Figures S8 and S10–S17.)
The first genome-wide association for non-syndromic cleft lip and/or palate was identified at the 8q24 locus encompassing a 640-kb noncoding region downstream of the MYC gene (Figure S8A) (Birnbaum et al., 2009). This region has a very significant impact on nonsyndromic cleft lip and/or palate (NSCLP) risk, the rs987525 SNP in this region yielding odds ratios ranging from 2.07 to 4.68 (Ludwig et al., 2012). While we did not annotate an enhancer directly overlapping this SNP position, we did identify a craniofacial enhancer state in all of our samples ~2 kb downstream (Figure S8B). Additionally, this large noncoding region has been studied with a number of mouse deletion lines (Uslu et al., 2014). Overlapping deletions revealed a 280-kb region dubbed a medionasal enhancer region (MNE) and a 106-kb nasal epithelial enhancer region (NEE) in the developing mouse. Deletion of the MNE resulted in lower Myc expression in multiple developing mouse tissues and an elevated incidence of cleft lip and palate. Inspection of these orthologous regions in the human genome revealed multiple craniofacial enhancers active across multiple states, several of which were more strongly active later in development. In particular, the only strong enhancer states annotated in each region were located near the center of both deletion intervals (Figures S8C and S8D). Our data support the findings reported for this region in the mouse for orofacial clefting, but our annotations narrow the search for causative regulatory regions within these still relatively large regions to less than 5 kb.
We next turned to the most recent genome-wide associations from several comprehensive meta-analyses focused on orofacial clefting (Leslie et al., 2017; Ludwig et al., 2017; Yu et al., 2017). We overlaid associations from these studies along with SNPs in strong linkage disequilibrium with each of the segmentation maps from our data, as well as data from Roadmap Epigenome, and we assessed enrichment using genomic regulatory elements and GWAS overlap algorithm (GREGOR) (Schmidt et al., 2015). As a control, we also interrogated associations for Crohn’s disease for enrichment in our enhancers (Welter et al., 2014). We did not observe any significant enrichment of Crohn’s-associated SNPs in our craniofacial segmentations. However, we did observe strong enrichment among enhancers identified in immune-related cell types and tissues. This result agreed with previous findings, and it validated our approach for assessing enrichment of genetic associations (Figure S9A) (Lee et al., 2017). When we analyzed associations for orofacial clefting, we observed significant enrichment of SNPs reported from all three studies in our craniofacial enhancers. The most significant findings in our data were consistently observed from SNPs reported by Yu et al. (2017) (Figures 7A, S9B, and S9C). However, only the credible SNPs for 24 regions based on imputation of genotyping data showed enrichment in our much smaller number of craniofacial-specific enhancers relative to total enhancers in each segmentation (Figure S9C) (Ludwig et al., 2017).
Figure 7. Enrichment of Orofacial Clefting and Cranio-facial Measure Associations in Craniofacial Enhancers.
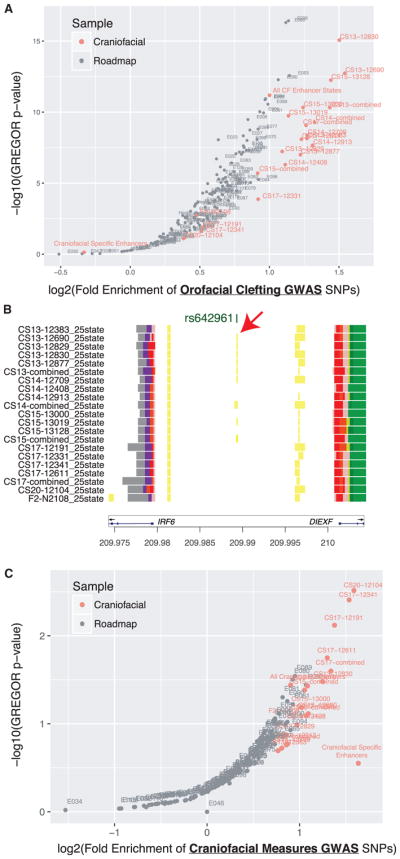
(A) Enrichment of orofacial cleft GWAS tag SNPs identified by Yu et al. (2017) in enhancer segmentations was assessed using GREGOR (Schmidt et al., 2015). Orange circles indicate craniofacial enhancer annotations identified by a 25-state chromatin model from this study, while gray circles indicate those previously published by Roadmap Epigenome (Roadmap Epigenomics Consortium et al., 2015).
(B) Enhancer state analysis permits placement of a potentially causative allele for non-syndromic CL/P (rs642961) (Rahimov et al., 2008) within a predicted early development enhancer state. This enhancer state is located between IRF6 and DIEXF and may influence expression of IRF6. (See also Table S4.)
(C) Same analysis as in (A) using GWAS tag SNPs reported for craniofacial measures by Claes et al. (2018). (See also Figure S9.)
Interestingly, for all three orofacial clefting studies, enhancer segmentations from our early samples (CS13–CS15) showed the most significant enrichments. These results suggested defective patterning events during early embryonic development drive these abnormalities. For example, we identified a discrete enhancer state in the noncoding region between IRF6 and DIEXF that contains a tag SNP previously associated with non-syndromic cleft lip and palate (Zucchero et al., 2004; Figure 7B). This particular enhancer region has been reported to influence IRF6 expression, and it is potentially causative for orofacial clefting, particularly cases of cleft lip without cleft palate (Rahimov et al., 2008). In our data, we observe an enhancer state from CS13 to CS15, but not in samples from CS17 and beyond. This finding would agree with the stronger genetic associations for this region with cleft lip alone as the external features of the human face, particularly the lip, close earlier in human development than the palate (Schoenwolf et al., 2009). Our data may also be informative for other large loci previously implicated in orofacial clefting. Inspection of several of these loci, including 1p22, 1p36, 10q25, 15q13, 17q22, and 20q12, identified craniofacial enhancer states near tag SNPs previously reported (Leslie et al., 2015, 2017; Ludwig et al., 2017; Mangold et al., 2016; Yu et al., 2017). However, our annotations also identified regulatory regions some distance away, near bivalent genes or the proposed target gene in these intervals that may also be important and potentially harbor rare variation not detectable in a genome-wide association study (GWAS) (Figures S10–S17).
Finally, while the regulatory regions identified here were enriched for associations with craniofacial abnormalities, it is unclear if these regions were also informative for understating the wide variety of craniofacial shapes and appearances among humans. Recent GWAS searching for genetic associations with variability in multiple measures of facial shape identified 38 loci in those of European ancestry (Claes et al., 2018). These loci were reported to be enriched near regions with elevated H3K27ac signals in cultured human CNCCs. Indeed, when we interrogated our enhancer segmentations with the craniofacial measure SNPs using the same approach as above for orofacial clefting SNPs, we also observed significant enrichment (Figure 7C). However, unlike the orofacial clefting associations, the craniofacial measure associations were most strongly enriched in enhancers from later stages of our cohort, particularly CS17 and beyond. This would suggest regulatory events in late embryonic and early fetal development contribute to human facial variation. In summary, these results demonstrate that our chromatin state maps are enriched for genetic information necessary for normal craniofacial development and will be extremely useful in identifying and prioritizing causative variation in patients affected by craniofacial abnormalities as well as understanding normal human facial variation.
DISCUSSION
Recent large consortia efforts to identify the genetics of common disease have gained traction utilizing tissue-specific annotations of the genome to identify potential regulatory regions and overlying genetic associations (Farh et al., 2015; Pasquali et al., 2014). Such genetic association data exist for craniofacial abnormalities, but the lack of craniofacial-specific annotations of regulatory function has prevented systematic identification of causal genetic changes. We have addressed this need by generating an extensive resource of functional genomics data obtained directly from human craniofacial tissues during important stages of formation of the orofacial apparatus. We have uniformly processed our data to allow integration of these data with similarly generated signals from a variety of human tissues and developmental stages. These analyses have allowed us to generate craniofacial-specific annotations of chromatin states across the human genome. These chromatin state segmentations reveal tens of thousands of regions with potential gene regulatory activity in craniofacial development.
Our analyses identified a significant proportion of previously known genes and loci important for normal craniofacial development in mice and humans. Specifically, our bivalent promoter and super-enhancer annotations identified key developmental transcription factors as well as large noncoding regions that showed extensive activation during early craniofacial development. The bivalent promoters most likely reflect two possibilities: genes that have restricted patterns of expression in the developing craniofacial tissues or poised genes that can be rapidly activated during development. Due to the heterogeneous nature of the tissue and processing in bulk, it is difficult to determine between these two possibilities. Further efforts using gene expression data, such as single-cell RNA-seq, a battery of in situ hybridizations, or sequential ChIP-seq experiments, will be required to elucidate the exact nature of chromatin at these genes and determine the contributions that genes identified here make to normal craniofacial development.
The systematic localization of SNPs associated with orofacial clefting and normal facial variation in our craniofacial enhancer annotations agrees with previous work from other human fetal tissues (Maurano et al., 2012), but it extends this to a tissue/disease-specific context. Specifically, our results support the idea that common variants associated with risk for orofacial clefting, particularly in the case of the cleft lip association for an enhancer of IRF6, manifest early in embryonic development, likely in the first 3–5 weeks of gestation. This is in contrast to our results from analyzing craniofacial measure associations. These genetic associations were most strongly enriched in samples from 6 to 9 weeks of gestation, implicating fine-tuning of craniofacial appearance after most of the external features have been established.
Related to this idea, we processed previously published epigenomic data from cultured CNCCs (Prescott et al., 2015). We observed significant overlaps between our craniofacial enhancer segments and CNCC H3K27ac peak calls as well as human-biased CNCC H3K27ac regions. These findings suggest that we have identified regulatory information that is important for the evolution of the human face and that culture models may reflect some of the regulatory architecture of primary human craniofacial development. However, upon further interrogation with our uniform pipeline, we found that the chromatin state segmentations for CNCC samples showed distinct differences in the overall number and size of all chromatin states versus our data as well as Roadmap Epigenome (Figures S2I and S2J). This is potentially due to differences in depth of sequencing, the collection of histone modifications profiled, or the derivation of these cell types versus normal embryonic development. On this last point, enrichment of craniofacial measure associations in enhancers at later stages of development would indicate that the CNCC system generates cells much more differentiated or derived than previously appreciated. This also challenges the previous interpretation that normal variation of the human face is influenced strongly by early embryonic cell types (Claes et al., 2018). Instead, our findings support the idea that these variations result from fine-tuning of the structures after the basic structure of the face has been patterned. Further global characterization of culture models of early craniofacial development, using our epigenomic data as a guide, will be necessary to generate conditions that yield differentiation schemes more reflective of the primary tissue environment. Such systems will be necessary to perform systematic genome modification experiments (deletions, rearrangements, etc.) targeting the regions we have identified to understand their function.
Our data represent one of the most comprehensive epigenetic profiles of primary tissue from the embryonic period of human development. Over 6,000 of the enhancer segments we defined are newly identified, and, as we have shown, they reveal regions with functional contribution to genetic variation associated with disease and facial shape. These regions are strongly enriched near genes implicated in craniofacial development, and they would have remained unknown to craniofacial researchers relying solely on the current state of genome annotations. Indeed, recent targeted sequencing of GWAS intervals at 13 loci in patients affected by craniofacial abnormalities likely included many inert regions but also excluded important craniofacial regulatory regions due to the lack of appropriate chromatin state annotations (Leslie et al., 2015) (top black bars in Figures S6B, S10, S12, S13, S14, S16, and S17). These results illuminate that our current understanding of the regulatory information our genomes encode is incomplete and reinforce the need for more, higher-resolution, tissue-specific profiling of multiple epigenomic marks to yield comparable chromatin state annotations from primary tissues.
We provide all our craniofacial functional genomics data and resulting chromatin state segmentations totaling 1,978 tracks in several standard formats as well as a complete catalog of tracks that can be easily loaded into many modern genome browsers. Our data are listed in the public track hub section of the University of California, Santa Cruz (UCSC) Genome Browser as well as the Track Hub Registry (http://trackhubregistry.org/). Additionally, we have preloaded our annotations and chromatin signals at multiple genes implicated in craniofacial abnormalities in the UCSC Genome Browser that can be opened with a single click on links found at our laboratory website (https://cotney.research.uchc.edu/data/). In total, this resource will allow the craniofacial community and other developmental biologists to develop hypotheses that are rooted in human craniofacial biology instead of using chromatin state annotations from other tissues not directly related to the tissue of interest. This work brings the craniofacial research world firmly into the functional genomics era, advances our understanding of these disorders from a regulatory perspective, and provides tools for clinicians and researchers seeking to diagnose patients utilizing whole-genome sequencing.
EXPERIMENTAL PROCEDURES
Further details and an outline of resources used in this work can be found in the Supplemental Experimental Procedures.
Tissue Collection and Fixation
Use of human fetal tissue was reviewd and approved by the Human Subjects Protection Program at UConn Health (UCHC 710-2-13-14-03). Human embryonic craniofacial tissue was collected, staged, and provided by the Joint MRC/ Wellcome Trust Human Developmental Biology Resource (www.hdbr.org). Information describing the developmental stage, termination method, collection site, and karyotype of each embryo is found in Table S1. Tissues were flash frozen upon collection and stored at −80°C. Fixation for ChIP-seq was performed as described in Cotney and Noonan (2015). Fixed tissue pellets were stored at −80°C until batch processing for ChIP.
Quantification and Statistical Analysis
ChIP-Seq
Fixed tissue pellets were processed for ChIP as previously described (Cotney and Noonan, 2015). Antibodies used in this study were as follows: anti-H3K27ac (ab4729, Abcam), anti-H3K4me1 (ab8895, Abcam), anti-H3K4me2 (ab7766, Abcam), anti-H3K4me3 (ab8580, Abcam), anti-H3K27me3 (07-449, EMD Millipore), and anti-H3K36me3 (ab9050, Abcam). ChIP-seq libraries were quantified by qPCR (NEBNext Library Quant Kit for Illumina), multiplexed, and sequenced for 75 cycles across multiple flow cells on an Illumina NextSeq 500 instrument.
Primary ChIP-Seq Data Analysis
ChIP-seq reads were aligned to the human genome (hg19) using Bowtie2 (version [v.] 2.2.5) (Langmead and Salzberg, 2012). Fragment sizes of each library were estimated using PhantomPeakQualTools (v.1.14) (Landt et al., 2012). Histone modification-enriched regions were identified and annotated using Hypergeometric Optimization of Motif Enrichment (HOMER, v.4.8.3) (Heinz et al., 2010). Reproducibly enriched regions were determined by creating a union of all enriched regions for a respective histone modification from all replicates of a single CS and filtering for regions identified in at least two biological replicates using BEDtools (v.2.25.0) (Quinlan and Hall, 2010). We then generated p value-based signal tracks relative to appropriate input controls based on estimated library fragment size using MACS2 (2.1.1.20160309) (Feng et al., 2012). All signal and enriched region files were converted for display in the UCSC Genome Browser using the Kent Source Tools (v.329) (Kent et al., 2002). Correlations of ChIP-seq signals and principal-component analysis across samples and markfs were calculated in non-overlapping 10-kb windows using deepTools2 (v.2.5.0.1) (Ramírez et al., 2014).
DATA AND SOFTWARE AVAILABILITY
The accession number for the ChIP-seq signals, peak calls, and chromatin state segmentations reported in this paper is GEO: GSE97752.
All data can be visualized in the UCSC Genome Browser using publicly available track hub functionality. Hub files and interesting browser examples can be found on our website (https://cotney.research.uchc.edu/data/).
All generic scripts used in processing ChIP-seq and generating chromatin states are available on GitHub (https://github.com/cotneylab/ChIP-Seq).
Supplementary Material
Highlights.
Global profiling of histone modifications across early human craniofacial development
Chromatin state segmentation reveals enhancers with craniofacial-specific activation
Early craniofacial enhancers enriched with genetic associations for orofacial clefting
Late craniofacial enhancers enriched with genetic associations for normal facial shape
Acknowledgments
We would like to thank the donors to HDBR, as without them this resource would not be possible. Funding support was provided by an R00 award (DE024194-04) from NIDCR to J.C.
Footnotes
DECLARATION OF INTERESTS
The authors declare no competing interests.
Supplemental Information includes Supplemental Experimental Procedures, 17 figures, and four tables and can be found with this article online at https://doi.org/10.1016/j.celrep.2018.03.129.
AUTHOR CONTRIBUTIONS
Conceptualization, J.P.N. and J.C.; Methodology, A.W. and J.C.; Investigation, A.W. and J.C.; Visualization, A.W., J.V., and J.C.; Writing – Original Draft, A.W. and J.C.; Writing – Review & Editing, A.W., J.V., J.P.N., and J.C.; Funding Acquisition, J.C.; Resources, J.K.; Supervision, J.C.
References
- Balemans W, Patel N, Ebeling M, Van Hul E, Wuyts W, Lacza C, Dioszegi M, Dikkers FG, Hildering P, Willems PJ, et al. Identification of a 52 kb deletion downstream of the SOST gene in patients with van Buchem disease. J Med Genet. 2002;39:91–97. doi: 10.1136/jmg.39.2.91. [DOI] [PMC free article] [PubMed] [Google Scholar]
- Beaty TH, Murray JC, Marazita ML, Munger RG, Ruczinski I, Hetmanski JB, Liang KY, Wu T, Murray T, Fallin MD, et al. A genome-wide association study of cleft lip with and without cleft palate identifies risk variants near MAFB and ABCA4. Nat Genet. 2010;42:525–529. doi: 10.1038/ng.580. [DOI] [PMC free article] [PubMed] [Google Scholar]
- Beaty TH, Marazita ML, Leslie EJ. Genetic factors influencing risk to orofacial clefts: today’s challenges and tomorrow’s opportunities. F1000Res. 2016;5:2800. doi: 10.12688/f1000research.9503.1. [DOI] [PMC free article] [PubMed] [Google Scholar]
- Benko S, Fantes JA, Amiel J, Kleinjan DJ, Thomas S, Ramsay J, Jamshidi N, Essafi A, Heaney S, Gordon CT, et al. Highly conserved non-coding elements on either side of SOX9 associated with Pierre Robin sequence. Nat Genet. 2009;41:359–364. doi: 10.1038/ng.329. [DOI] [PubMed] [Google Scholar]
- Bernstein BE, Mikkelsen TS, Xie X, Kamal M, Huebert DJ, Cuff J, Fry B, Meissner A, Wernig M, Plath K, et al. A bivalent chromatin structure marks key developmental genes in embryonic stem cells. Cell. 2006;125:315–326. doi: 10.1016/j.cell.2006.02.041. [DOI] [PubMed] [Google Scholar]
- Birnbaum S, Ludwig KU, Reutter H, Herms S, Steffens M, Rubini M, Baluardo C, Ferrian M, Almeida de Assis N, Alblas MA, et al. Key susceptibility locus for nonsyndromic cleft lip with or without cleft palate on chromosome 8q24. Nat Genet. 2009;41:473–477. doi: 10.1038/ng.333. [DOI] [PubMed] [Google Scholar]
- Bjork BC, Turbe-Doan A, Prysak M, Herron BJ, Beier DR. Prdm16 is required for normal palatogenesis in mice. Hum Mol Genet. 2010;19:774–789. doi: 10.1093/hmg/ddp543. [DOI] [PMC free article] [PubMed] [Google Scholar]
- Bonn S, Zinzen RP, Girardot C, Gustafson EH, Perez-Gonzalez A, Delhomme N, Ghavi-Helm Y, Wilczyński B, Riddell A, Furlong EE. Tissue-specific analysis of chromatin state identifies temporal signatures of enhancer activity during embryonic development. Nat Genet. 2012;44:148–156. doi: 10.1038/ng.1064. [DOI] [PubMed] [Google Scholar]
- Boulet SL, Grosse SD, Honein MA, Correa-Villaseñor A. Children with orofacial clefts: health-care use and costs among a privately insured population. Public Health Rep. 2009;124:447–453. doi: 10.1177/003335490912400315. [DOI] [PMC free article] [PubMed] [Google Scholar]
- Brunskill EW, Potter AS, Distasio A, Dexheimer P, Plassard A, Aronow BJ, Potter SS. A gene expression atlas of early craniofacial development. Dev Biol. 2014;391:133–146. doi: 10.1016/j.ydbio.2014.04.016. [DOI] [PMC free article] [PubMed] [Google Scholar]
- Bureau A, Parker MM, Ruczinski I, Taub MA, Marazita ML, Murray JC, Mangold E, Noethen MM, Ludwig KU, Hetmanski JB, et al. Whole exome sequencing of distant relatives in multiplex families implicates rare variants in candidate genes for oral clefts. Genetics. 2014;197:1039–1044. doi: 10.1534/genetics.114.165225. [DOI] [PMC free article] [PubMed] [Google Scholar]
- Camargo M, Rivera D, Moreno L, Lidral AC, Harper U, Jones M, Solomon BD, Roessler E, Vélez JI, Martinez AF, et al. GWAS reveals new recessive loci associated with non-syndromic facial clefting. Eur J Med Genet. 2012;55:510–514. doi: 10.1016/j.ejmg.2012.06.005. [DOI] [PMC free article] [PubMed] [Google Scholar]
- Chen H, Ovchinnikov D, Pressman CL, Aulehla A, Lun Y, Johnson RL. Multiple calvarial defects in lmx1b mutant mice. Dev Genet. 1998;22:314–320. doi: 10.1002/(SICI)1520-6408(1998)22:4<314::AID-DVG2>3.0.CO;2-9. [DOI] [PubMed] [Google Scholar]
- Claes P, Roosenboom J, White JD, Swigut T, Sero D, Li J, Lee MK, Zaidi A, Mattern BC, Liebowitz C, et al. Genome-wide mapping of global-to-local genetic effects on human facial shape. Nat Genet. 2018;50:414–423. doi: 10.1038/s41588-018-0057-4. [DOI] [PMC free article] [PubMed] [Google Scholar]
- Conte F, Oti M, Dixon J, Carels CE, Rubini M, Zhou H. Systematic analysis of copy number variants of a large cohort of orofacial cleft patients identifies candidate genes for orofacial clefts. Hum Genet. 2016;135:41–59. doi: 10.1007/s00439-015-1606-x. [DOI] [PMC free article] [PubMed] [Google Scholar]
- Cotney JL, Noonan JP. Chromatin immunoprecipitation with fixed animal tissues and preparation for high-throughput sequencing. Cold Spring Harb Protoc. 2015;2015:191–199. doi: 10.1101/pdb.prot084848. [DOI] [PubMed] [Google Scholar]
- Cotney J, Leng J, Oh S, DeMare LE, Reilly SK, Gerstein MB, Noonan JP. Chromatin state signatures associated with tissue-specific gene expression and enhancer activity in the embryonic limb. Genome Res. 2012;22:1069–1080. doi: 10.1101/gr.129817.111. [DOI] [PMC free article] [PubMed] [Google Scholar]
- Cotney J, Leng J, Yin J, Reilly SK, DeMare LE, Emera D, Ayoub AE, Rakic P, Noonan JP. The evolution of lineage-specific regulatory activities in the human embryonic limb. Cell. 2013;154:185–196. doi: 10.1016/j.cell.2013.05.056. [DOI] [PMC free article] [PubMed] [Google Scholar]
- Dickel DE, Barozzi I, Zhu Y, Fukuda-Yuzawa Y, Osterwalder M, Mannion BJ, May D, Spurrell CH, Plajzer-Frick I, Pickle CS, et al. Genome-wide compendium and functional assessment of in vivo heart enhancers. Nat Commun. 2016;7:12923. doi: 10.1038/ncomms12923. [DOI] [PMC free article] [PubMed] [Google Scholar]
- Dixon MJ, Marazita ML, Beaty TH, Murray JC. Cleft lip and palate: understanding genetic and environmental influences. Nat Rev Genet. 2011;12:167–178. doi: 10.1038/nrg2933. [DOI] [PMC free article] [PubMed] [Google Scholar]
- Ernst J, Kellis M. ChromHMM: automating chromatin-state discovery and characterization. Nat Methods. 2012;9:215–216. doi: 10.1038/nmeth.1906. [DOI] [PMC free article] [PubMed] [Google Scholar]
- Ernst J, Kellis M. Large-scale imputation of epigenomic datasets for systematic annotation of diverse human tissues. Nat Biotechnol. 2015;33:364–376. doi: 10.1038/nbt.3157. [DOI] [PMC free article] [PubMed] [Google Scholar]
- Ernst J, Kheradpour P, Mikkelsen TS, Shoresh N, Ward LD, Epstein CB, Zhang X, Wang L, Issner R, Coyne M, et al. Mapping and analysis of chromatin state dynamics in nine human cell types. Nature. 2011;473:43–49. doi: 10.1038/nature09906. [DOI] [PMC free article] [PubMed] [Google Scholar]
- Farh KK, Marson A, Zhu J, Kleinewietfeld M, Housley WJ, Beik S, Shoresh N, Whitton H, Ryan RJ, Shishkin AA, et al. Genetic and epigenetic fine mapping of causal autoimmune disease variants. Nature. 2015;518:337–343. doi: 10.1038/nature13835. [DOI] [PMC free article] [PubMed] [Google Scholar]
- Feng J, Liu T, Qin B, Zhang Y, Liu XS. Identifying ChIP-seq enrichment using MACS. Nat Protoc. 2012;7:1728–1740. doi: 10.1038/nprot.2012.101. [DOI] [PMC free article] [PubMed] [Google Scholar]
- Gendron-Maguire M, Mallo M, Zhang M, Gridley T. Hoxa-2 mutant mice exhibit homeotic transformation of skeletal elements derived from cranial neural crest. Cell. 1993;75:1317–1331. doi: 10.1016/0092-8674(93)90619-2. [DOI] [PubMed] [Google Scholar]
- Gokhman D, Kelman G, Amartely A, Gershon G, Tsur S, Carmel L. Gene ORGANizer: linking genes to the organs they affect. Nucleic Acids Res. 2017;45(W1):W138–W145. doi: 10.1093/nar/gkx302. [DOI] [PMC free article] [PubMed] [Google Scholar]
- Gordon CT, Attanasio C, Bhatia S, Benko S, Ansari M, Tan TY, Munnich A, Pennacchio LA, Abadie V, Temple IK, et al. Identification of novel craniofacial regulatory domains located far upstream of SOX9 and disrupted in Pierre Robin sequence. Hum Mutat. 2014;35:1011–1020. doi: 10.1002/humu.22606. [DOI] [PMC free article] [PubMed] [Google Scholar]
- Grosen D, Chevrier C, Skytthe A, Bille C, Mølsted K, Sivertsen A, Murray JC, Christensen K. A cohort study of recurrence patterns among more than 54,000 relatives of oral cleft cases in Denmark: support for the multifactorial threshold model of inheritance. J Med Genet. 2010;47:162–168. doi: 10.1136/jmg.2009.069385. [DOI] [PMC free article] [PubMed] [Google Scholar]
- Grosen D, Bille C, Petersen I, Skytthe A, Hjelmborg Jv, Pedersen JK, Murray JC, Christensen K. Risk of oral clefts in twins. Epidemiology. 2011;22:313–319. doi: 10.1097/EDE.0b013e3182125f9c. [DOI] [PMC free article] [PubMed] [Google Scholar]
- Heinz S, Benner C, Spann N, Bertolino E, Lin YC, Laslo P, Cheng JX, Murre C, Singh H, Glass CK. Simple combinations of lineage-determining transcription factors prime cis-regulatory elements required for macrophage and B cell identities. Mol Cell. 2010;38:576–589. doi: 10.1016/j.molcel.2010.05.004. [DOI] [PMC free article] [PubMed] [Google Scholar]
- Hnisz D, Abraham BJ, Lee TI, Lau A, Saint-André V, Sigova AA, Hoke HA, Young RA. Super-enhancers in the control of cell identity and disease. Cell. 2013;155:934–947. doi: 10.1016/j.cell.2013.09.053. [DOI] [PMC free article] [PubMed] [Google Scholar]
- Hoffman MM, Buske OJ, Wang J, Weng Z, Bilmes JA, Noble WS. Unsupervised pattern discovery in human chromatin structure through genomic segmentation. Nat Methods. 2012;9:473–476. doi: 10.1038/nmeth.1937. [DOI] [PMC free article] [PubMed] [Google Scholar]
- Hoffman MM, Ernst J, Wilder SP, Kundaje A, Harris RS, Libbrecht M, Giardine B, Ellenbogen PM, Bilmes JA, Birney E, et al. Integrative annotation of chromatin elements from ENCODE data. Nucleic Acids Res. 2013;41:827–841. doi: 10.1093/nar/gks1284. [DOI] [PMC free article] [PubMed] [Google Scholar]
- Jakobsen LP, Borup R, Vestergaard J, Larsen LA, Lage K, Maroun LL, Kjaer I, Niemann CU, Andersen M, Knudsen MA, et al. Expression analyses of human cleft palate tissue suggest a role for osteopontin and immune related factors in palatal development. Exp Mol Med. 2009;41:77–85. doi: 10.3858/emm.2009.41.2.010. [DOI] [PMC free article] [PubMed] [Google Scholar]
- Kang H, Jung YL, McElroy KA, Zee BM, Wallace HA, Woolnough JL, Park PJ, Kuroda MI. Bivalent complexes of PRC1 with orthologs of BRD4 and MOZ/MORF target developmental genes in Drosophila. Genes Dev. 2017;31:1988–2002. doi: 10.1101/gad.305987.117. [DOI] [PMC free article] [PubMed] [Google Scholar]
- Kent WJ, Sugnet CW, Furey TS, Roskin KM, Pringle TH, Zahler AM, Haussler D. The human genome browser at UCSC. Genome Res. 2002;12:996–1006. doi: 10.1101/gr.229102. [DOI] [PMC free article] [PubMed] [Google Scholar]
- Khandelwal KD, van Bokhoven H, Roscioli T, Carels CE, Zhou H. Genomic approaches for studying craniofacial disorders. Am J Med Genet C Semin Med Genet. 2013;163C:218–231. doi: 10.1002/ajmg.c.31379. [DOI] [PubMed] [Google Scholar]
- Kumar V, Rayan NA, Muratani M, Lim S, Elanggovan B, Xin L, Lu T, Makhija H, Poschmann J, Lufkin T, et al. Comprehensive benchmarking reveals H2BK20 acetylation as a distinctive signature of cell-state-specific enhancers and promoters. Genome Res. 2016;26:612–623. doi: 10.1101/gr.201038.115. [DOI] [PMC free article] [PubMed] [Google Scholar]
- Roadmap Epigenomics Consortium; Kundaje A. Meuleman W, Ernst J, Bilenky M, Yen A, Heravi-Moussavi A, Kheradpour P, Zhang Z, Wang J, Ziller MJ, et al. Integrative analysis of 111 reference human epigenomes. Nature. 2015;518:317–330. doi: 10.1038/nature14248. [DOI] [PMC free article] [PubMed] [Google Scholar]
- Laclef C, Souil E, Demignon J, Maire P. Thymus, kidney and craniofacial abnormalities in Six 1 deficient mice. Mech Dev. 2003;120:669–679. doi: 10.1016/s0925-4773(03)00065-0. [DOI] [PubMed] [Google Scholar]
- Landt SG, Marinov GK, Kundaje A, Kheradpour P, Pauli F, Batzoglou S, Bernstein BE, Bickel P, Brown JB, Cayting P, et al. ChIP-seq guidelines and practices of the ENCODE and modENCODE consortia. Genome Res. 2012;22:1813–1831. doi: 10.1101/gr.136184.111. [DOI] [PMC free article] [PubMed] [Google Scholar]
- Langmead B, Salzberg SL. Fast gapped-read alignment with Bowtie 2. Nat Methods. 2012;9:357–359. doi: 10.1038/nmeth.1923. [DOI] [PMC free article] [PubMed] [Google Scholar]
- Lee JC, Biasci D, Roberts R, Gearry RB, Mansfield JC, Ahmad T, Prescott NJ, Satsangi J, Wilson DC, Jostins L, et al. UK IBD Genetics Consortium. Genome-wide association study identifies distinct genetic contributions to prognosis and susceptibility in Crohn’s disease. Nat Genet. 2017;49:262–268. doi: 10.1038/ng.3755. [DOI] [PMC free article] [PubMed] [Google Scholar]
- Leslie EJ, Marazita ML. Genetics of Orofacial Cleft Birth Defects. Curr Genet Med Rep. 2015;3:118–126. [Google Scholar]
- Leslie EJ, Taub MA, Liu H, Steinberg KM, Koboldt DC, Zhang Q, Carlson JC, Hetmanski JB, Wang H, Larson DE, et al. Identification of functional variants for cleft lip with or without cleft palate in or near PAX7, FGFR2, and NOG by targeted sequencing of GWAS loci. Am J Hum Genet. 2015;96:397–411. doi: 10.1016/j.ajhg.2015.01.004. [DOI] [PMC free article] [PubMed] [Google Scholar]
- Leslie EJ, Carlson JC, Shaffer JR, Butali A, Buxó CJ, Castilla EE, Christensen K, Deleyiannis FWB, Leigh Field L, Hecht JT, et al. Genome-wide meta-analyses of nonsyndromic orofacial clefts identify novel associations between FOXE1 and all orofacial clefts, and TP63 and cleft lip with or without cleft palate. Hum Genet. 2017;136:275–286. doi: 10.1007/s00439-016-1754-7. [DOI] [PMC free article] [PubMed] [Google Scholar]
- Letra A, Menezes R, Fonseca RF, Govil M, McHenry T, Murphy MJ, Hennebold JD, Granjeiro JM, Castilla EE, Orioli IM, et al. Novel cleft susceptibility genes in chromosome 6q. J Dent Res. 2010;89:927–932. doi: 10.1177/0022034510370004. [DOI] [PMC free article] [PubMed] [Google Scholar]
- Lettice LA, Heaney SJ, Purdie LA, Li L, de Beer P, Oostra BA, Goode D, Elgar G, Hill RE, de Graaff E. A long-range Shh enhancer regulates expression in the developing limb and fin and is associated with preaxial polydactyly. Hum Mol Genet. 2003;12:1725–1735. doi: 10.1093/hmg/ddg180. [DOI] [PubMed] [Google Scholar]
- Lidral AC, Liu H, Bullard SA, Bonde G, Machida J, Visel A, Uribe LM, Li X, Amendt B, Cornell RA. A single nucleotide polymorphism associated with isolated cleft lip and palate, thyroid cancer and hypothyroidism alters the activity of an oral epithelium and thyroid enhancer near FOXE1. Hum Mol Genet. 2015;24:3895–3907. doi: 10.1093/hmg/ddv047. [DOI] [PMC free article] [PubMed] [Google Scholar]
- Loots GG, Kneissel M, Keller H, Baptist M, Chang J, Collette NM, Ovcharenko D, Plajzer-Frick I, Rubin EM. Genomic deletion of a long-range bone enhancer misregulates sclerostin in Van Buchem disease. Genome Res. 2005;15:928–935. doi: 10.1101/gr.3437105. [DOI] [PMC free article] [PubMed] [Google Scholar]
- Ludwig KU, Mangold E, Herms S, Nowak S, Reutter H, Paul A, Becker J, Herberz R, AlChawa T, Nasser E, et al. Genome-wide meta-analyses of nonsyndromic cleft lip with or without cleft palate identify six new risk loci. Nat Genet. 2012;44:968–971. doi: 10.1038/ng.2360. [DOI] [PMC free article] [PubMed] [Google Scholar]
- Ludwig KU, Ahmed ST, Böhmer AC, Sangani NB, Varghese S, Klamt J, Schuenke H, Gultepe P, Hofmann A, Rubini M, et al. Meta-analysis Reveals Genome-Wide Significance at 15q13 for Nonsyndromic Clefting of Both the Lip and the Palate, and Functional Analyses Implicate GREM1 As a Plausible Causative Gene. PLoS Genet. 2016;12:e1005914. doi: 10.1371/journal.pgen.1005914. [DOI] [PMC free article] [PubMed] [Google Scholar]
- Ludwig KU, Böhmer AC, Bowes J, Nikolic M, Ishorst N, Wyatt N, Hammond NL, Gölz L, Thieme F, Barth S, et al. Imputation of orofacial clefting data identifies novel risk loci and sheds light on the genetic background of cleft lip ± cleft palate and cleft palate only. Hum Mol Genet. 2017;26:829–842. doi: 10.1093/hmg/ddx012. [DOI] [PMC free article] [PubMed] [Google Scholar]
- Mangold E, Ludwig KU, Birnbaum S, Baluardo C, Ferrian M, Herms S, Reutter H, de Assis NA, Chawa TA, Mattheisen M, et al. Genome-wide association study identifies two susceptibility loci for nonsyndromic cleft lip with or without cleft palate. Nat Genet. 2010;42:24–26. doi: 10.1038/ng.506. [DOI] [PubMed] [Google Scholar]
- Mangold E, Böhmer AC, Ishorst N, Hoebel AK, Gultepe P, Schuenke H, Klamt J, Hofmann A, Gölz L, Raff R, et al. Sequencing the GRHL3 Coding Region Reveals Rare Truncating Mutations and a Common Susceptibility Variant for Nonsyndromic Cleft Palate. Am J Hum Genet. 2016;98:755–762. doi: 10.1016/j.ajhg.2016.02.013. [DOI] [PMC free article] [PubMed] [Google Scholar]
- Marchegiani S, Davis T, Tessadori F, van Haaften G, Brancati F, Hoischen A, Huang H, Valkanas E, Pusey B, Schanze D, et al. Recurrent Mutations in the Basic Domain of TWIST2 Cause Ablepharon Mac-rostomia and Barber-Say Syndromes. Am J Hum Genet. 2015;97:99–110. doi: 10.1016/j.ajhg.2015.05.017. [DOI] [PMC free article] [PubMed] [Google Scholar]
- Maurano MT, Humbert R, Rynes E, Thurman RE, Haugen E, Wang H, Reynolds AP, Sandstrom R, Qu H, Brody J, et al. Systematic localization of common disease-associated variation in regulatory DNA. Science. 2012;337:1190–1195. doi: 10.1126/science.1222794. [DOI] [PMC free article] [PubMed] [Google Scholar]
- McLean CY, Bristor D, Hiller M, Clarke SL, Schaar BT, Lowe CB, Wenger AM, Bejerano G. GREAT improves functional interpretation of cis-regulatory regions. Nat Biotechnol. 2010;28:495–501. doi: 10.1038/nbt.1630. [DOI] [PMC free article] [PubMed] [Google Scholar]
- McMahon AP, Champion JE, McMahon JA, Sukhatme VP. Developmental expression of the putative transcription factor Egr-1 suggests that Egr-1 and c-fos are coregulated in some tissues. Development. 1990;108:281–287. doi: 10.1242/dev.108.2.281. [DOI] [PubMed] [Google Scholar]
- Minoux M, Holwerda S, Vitobello A, Kitazawa T, Kohler H, Stadler MB, Rijli FM. Gene bivalency at Polycomb domains regulates cranial neural crest positional identity. Science. 2017;355:eaal2913. doi: 10.1126/science.aal2913. [DOI] [PubMed] [Google Scholar]
- Mossey PA, Modell B. Epidemiology of oral clefts 2012: an international perspective. Front Oral Biol. 2012;16:1–18. doi: 10.1159/000337464. [DOI] [PubMed] [Google Scholar]
- Mostowska A, Gaczkowska A, Żukowski K, Ludwig KU, Hozyasz KK, Wójcicki P, Mangold E, Böhmer AC, Heilmann-Heimbach S, Knapp M, et al. Common variants in DLG1 locus are associated with non-syndromic cleft lip with or without cleft palate. Clin Genet. 2018;93:784–793. doi: 10.1111/cge.13141. [DOI] [PubMed] [Google Scholar]
- Nord AS, Blow MJ, Attanasio C, Akiyama JA, Holt A, Hosseini R, Phouanenavong S, Plajzer-Frick I, Shoukry M, Afzal V, et al. Rapid and pervasive changes in genome-wide enhancer usage during mammalian development. Cell. 2013;155:1521–1531. doi: 10.1016/j.cell.2013.11.033. [DOI] [PMC free article] [PubMed] [Google Scholar]
- Pasquali L, Gaulton KJ, Rodríguez-Seguí SA, Mularoni L, Miguel-Escalada I, Akerman İ, Tena JJ, Morán I, Gómez-Marín C, van de Bunt M, et al. Pancreatic islet enhancer clusters enriched in type 2 diabetes risk-associated variants. Nat Genet. 2014;46:136–143. doi: 10.1038/ng.2870. [DOI] [PMC free article] [PubMed] [Google Scholar]
- Petit F, Jourdain AS, Holder-Espinasse M, Keren B, Andrieux J, Duterque-Coquillaud M, Porchet N, Manouvrier-Hanu S, Escande F. The disruption of a novel limb cis-regulatory element of SHH is associated with autosomal dominant preaxial polydactyly-hypertrichosis. Eur J Hum Genet. 2016;24:37–43. doi: 10.1038/ejhg.2015.53. [DOI] [PMC free article] [PubMed] [Google Scholar]
- Pinheiro I, Margueron R, Shukeir N, Eisold M, Fritzsch C, Richter FM, Mittler G, Genoud C, Goyama S, Kurokawa M, et al. Prdm3 and Prdm16 are H3K9me1 methyltransferases required for mammalian hetero-chromatin integrity. Cell. 2012;150:948–960. doi: 10.1016/j.cell.2012.06.048. [DOI] [PubMed] [Google Scholar]
- Prescott SL, Srinivasan R, Marchetto MC, Grishina I, Narvaiza I, Selleri L, Gage FH, Swigut T, Wysocka J. Enhancer divergence and cis-regulatory evolution in the human and chimp neural crest. Cell. 2015;163:68–83. doi: 10.1016/j.cell.2015.08.036. [DOI] [PMC free article] [PubMed] [Google Scholar]
- Quinlan AR, Hall IM. BEDTools: a flexible suite of utilities for comparing genomic features. Bioinformatics. 2010;26:841–842. doi: 10.1093/bioinformatics/btq033. [DOI] [PMC free article] [PubMed] [Google Scholar]
- Rada-Iglesias A, Wysocka J. Epigenomics of human embryonic stem cells and induced pluripotent stem cells: insights into pluripotency and implications for disease. Genome Med. 2011;3:36. doi: 10.1186/gm252. [DOI] [PMC free article] [PubMed] [Google Scholar]
- Rada-Iglesias A, Bajpai R, Prescott S, Brugmann SA, Swigut T, Wysocka J. Epigenomic annotation of enhancers predicts transcriptional regulators of human neural crest. Cell Stem Cell. 2012;11:633–648. doi: 10.1016/j.stem.2012.07.006. [DOI] [PMC free article] [PubMed] [Google Scholar]
- Rahimov F, Marazita ML, Visel A, Cooper ME, Hitchler MJ, Rubini M, Domann FE, Govil M, Christensen K, Bille C, et al. Disruption of an AP-2alpha binding site in an IRF6 enhancer is associated with cleft lip. Nat Genet. 2008;40:1341–1347. doi: 10.1038/ng.242. [DOI] [PMC free article] [PubMed] [Google Scholar]
- Rahimov F, Jugessur A, Murray JC. Genetics of nonsyndromic orofacial clefts. Cleft Palate Craniofac J. 2012;49:73–91. doi: 10.1597/10-178. [DOI] [PMC free article] [PubMed] [Google Scholar]
- Ramírez F, Dundar F, Diehl S, Gruning BA, Manke T. deep-Tools: a flexible platform for exploring deep-sequencing data. Nucleic Acids Res. 2014;42:W187–W191. doi: 10.1093/nar/gku365. [DOI] [PMC free article] [PubMed] [Google Scholar]
- Reilly SK, Yin J, Ayoub AE, Emera D, Leng J, Cotney J, Sarro R, Rakic P, Noonan JP. Evolutionary genomics. Evolutionary changes in promoter and enhancer activity during human corticogenesis. Science. 2015;347:1155–1159. doi: 10.1126/science.1260943. [DOI] [PMC free article] [PubMed] [Google Scholar]
- Robledo RF, Rajan L, Li X, Lufkin T. The Dlx5 and Dlx6 homeobox genes are essential for craniofacial, axial, and appendicular skeletal development. Genes Dev. 2002;16:1089–1101. doi: 10.1101/gad.988402. [DOI] [PMC free article] [PubMed] [Google Scholar]
- Sagai T, Hosoya M, Mizushina Y, Tamura M, Shiroishi T. Elimination of a long-range cis-regulatory module causes complete loss of limb-specific Shh expression and truncation of the mouse limb. Development. 2005;132:797–803. doi: 10.1242/dev.01613. [DOI] [PubMed] [Google Scholar]
- Schmidt EM, Zhang J, Zhou W, Chen J, Mohlke KL, Chen YE, Willer CJ. GREGOR: evaluating global enrichment of trait-associated variants in epigenomic features using a systematic, data-driven approach. Bioinformatics. 2015;31:2601–2606. doi: 10.1093/bioinformatics/btv201. [DOI] [PMC free article] [PubMed] [Google Scholar]
- Schoenwolf GC, Bleyl SB, Brauer PR, Francis-West PH. Larsen’s Human Embryology. 4. Ann Arbor, MI: Churchill Living-stone/Elsevier; 2009. [Google Scholar]
- Sharma VP, Fenwick AL, Brockop MS, McGowan SJ, Goos JAC, Hoogeboom AJM, Brady AF, Jeelani NO, Lynch SA, Mulliken JB, et al. 500 Whole-Genome Sequences (WGS500) Consortium. Mutations in TCF12, encoding a basic helix-loop-helix partner of TWIST1, are a frequent cause of coronal craniosynostosis. Nat Genet. 2013;45:304–307. doi: 10.1038/ng.2531. [DOI] [PMC free article] [PubMed] [Google Scholar]
- Tan TY, Farlie PG. Rare syndromes of the head and face-Pierre Robin sequence. Wiley Interdiscip Rev Dev Biol. 2013;2:369–377. doi: 10.1002/wdev.69. [DOI] [PubMed] [Google Scholar]
- Thieme F, Ludwig KU. The Role of Noncoding Genetic Variation in Isolated Orofacial Clefts. J Dent Res. 2017;96:1238–1247. doi: 10.1177/0022034517720403. [DOI] [PubMed] [Google Scholar]
- Timberlake AT, Choi J, Zaidi S, Lu Q, Nelson-Williams C, Brooks ED, Bilguvar K, Tikhonova I, Mane S, Yang JF, et al. Two locus inheritance of non-syndromic midline craniosynostosis via rareSMAD6and commonBMP2alleles. eLife. 2016;5:e20125. doi: 10.7554/eLife.20125. [DOI] [PMC free article] [PubMed] [Google Scholar]
- Uslu VV, Petretich M, Ruf S, Langenfeld K, Fonseca NA, Marioni JC, Spitz F. Long-range enhancers regulating Myc expression are required for normal facial morphogenesis. Nat Genet. 2014;46:753–758. doi: 10.1038/ng.2971. [DOI] [PubMed] [Google Scholar]
- Van Hul W, Balemans W, Van Hul E, Dikkers FG, Obee H, Stokroos RJ, Hildering P, Vanhoenacker F, Van Camp G, Willems PJ. Van Buchem disease (hyperostosis corticalis generalisata) maps to chromosome 17q12-q21. Am J Hum Genet. 1998;62:391–399. doi: 10.1086/301721. [DOI] [PMC free article] [PubMed] [Google Scholar]
- Villar D, Berthelot C, Aldridge S, Rayner TF, Lukk M, Pignatelli M, Park TJ, Deaville R, Erichsen JT, Jasinska AJ, et al. Enhancer evolution across 20 mammalian species. Cell. 2015;160:554–566. doi: 10.1016/j.cell.2015.01.006. [DOI] [PMC free article] [PubMed] [Google Scholar]
- Visel A, Minovitsky S, Dubchak I, Pennacchio LA. VISTA Enhancer Browser–a database of tissue-specific human enhancers. Nucleic Acids Res. 2007;35:D88–D92. doi: 10.1093/nar/gkl822. [DOI] [PMC free article] [PubMed] [Google Scholar]
- Visel A, Blow MJ, Li Z, Zhang T, Akiyama JA, Holt A, Plajzer-Frick I, Shoukry M, Wright C, Chen F, et al. ChIP-seq accurately predicts tissue-specific activity of enhancers. Nature. 2009;457:854–858. doi: 10.1038/nature07730. [DOI] [PMC free article] [PubMed] [Google Scholar]
- Weedon MN, Cebola I, Patch AM, Flanagan SE, De Franco E, Caswell R, Rodríguez-Seguí SA, Shaw-Smith C, Cho CHH, Allen HL, et al. International Pancreatic Agenesis Consortium. Recessive mutations in a distal PTF1A enhancer cause isolated pancreatic agenesis. Nat Genet. 2014;46:61–64. doi: 10.1038/ng.2826. [DOI] [PMC free article] [PubMed] [Google Scholar]
- Wehby GL, Cassell CH. The impact of orofacial clefts on quality of life and healthcare use and costs. Oral Dis. 2010;16:3–10. doi: 10.1111/j.1601-0825.2009.01588.x. [DOI] [PMC free article] [PubMed] [Google Scholar]
- Wehby GL, Castilla EE, Goco N, Rittler M, Cosentino V, Javois L, Kindem M, Chakraborty H, Dutra G, López-Camelo JS, et al. The effect of systematic pediatric care on neonatal mortality and hospitalizations of infants born with oral clefts. BMC Pediatr. 2011;11:121. doi: 10.1186/1471-2431-11-121. [DOI] [PMC free article] [PubMed] [Google Scholar]
- Wehby GL, Pedersen DA, Murray JC, Christensen K. The effects of oral clefts on hospital use throughout the lifespan. BMC Health Serv Res. 2012;12:58. doi: 10.1186/1472-6963-12-58. [DOI] [PMC free article] [PubMed] [Google Scholar]
- Welter D, MacArthur J, Morales J, Burdett T, Hall P, Junkins H, Klemm A, Flicek P, Manolio T, Hindorff L, Parkinson H. The NHGRI GWAS Catalog, a curated resource of SNP-trait associations. Nucleic Acids Res. 2014;42:D1001–D1006. doi: 10.1093/nar/gkt1229. [DOI] [PMC free article] [PubMed] [Google Scholar]
- Whyte WA, Orlando DA, Hnisz D, Abraham BJ, Lin CY, Kagey MH, Rahl PB, Lee TI, Young RA. Master transcription factors and mediator establish super-enhancers at key cell identity genes. Cell. 2013;153:307–319. doi: 10.1016/j.cell.2013.03.035. [DOI] [PMC free article] [PubMed] [Google Scholar]
- World Health Organization. World Atlas of Birth Defects. 2. Geneva, Switzerland: World Health Organization; 2003. [Google Scholar]
- Yu Y, Zuo X, He M, Gao J, Fu Y, Qin C, Meng L, Wang W, Song Y, Cheng Y, et al. Genome-wide analyses of non-syndromic cleft lip with palate identify 14 novel loci and genetic heterogeneity. Nat Commun. 2017;8:14364. doi: 10.1038/ncomms14364. [DOI] [PMC free article] [PubMed] [Google Scholar]
- Yuan Q, Blanton SH, Hecht JT. Association of ABCA4 and MAFB with non-syndromic cleft lip with or without cleft palate. Am J Med Genet A. 2011;155A:1469–1471. doi: 10.1002/ajmg.a.33940. [DOI] [PMC free article] [PubMed] [Google Scholar]
- Zhao Y, Guo YJ, Tomac AC, Taylor NR, Grinberg A, Lee EJ, Huang S, Westphal H. Isolated cleft palate in mice with a targeted mutation of the LIM homeobox gene lhx8. Proc Natl Acad Sci USA. 1999;96:15002–15006. doi: 10.1073/pnas.96.26.15002. [DOI] [PMC free article] [PubMed] [Google Scholar]
- Zhu J, Adli M, Zou JY, Verstappen G, Coyne M, Zhang X, Durham T, Miri M, Deshpande V, De Jager PL, et al. Genome-wide chromatin state transitions associated with developmental and environmental cues. Cell. 2013;152:642–654. doi: 10.1016/j.cell.2012.12.033. [DOI] [PMC free article] [PubMed] [Google Scholar]
- Zucchero TM, Cooper ME, Maher BS, Daack-Hirsch S, Nepomuceno B, Ribeiro L, Caprau D, Christensen K, Suzuki Y, Machida J, et al. Interferon regulatory factor 6 (IRF6) gene variants and the risk of isolated cleft lip or palate. N Engl J Med. 2004;351:769–780. doi: 10.1056/NEJMoa032909. [DOI] [PubMed] [Google Scholar]
Associated Data
This section collects any data citations, data availability statements, or supplementary materials included in this article.