

Summary
Transcription is a highly regulated and inherently stochastic process. The complexity of signal transduction and gene regulation makes it challenging to analyze how the dynamic activity of transcriptional regulators affects stochastic transcription. By combining a fast-acting, photo-regulatable transcription factor with nascent RNA quantification in live cells and an experimental setup for precise spatiotemporal delivery of light inputs, we constructed a platform for the real-time, single-cell interrogation of transcription in Saccharomyces cerevisiae. We show that transcriptional activation and deactivation are fast and memoryless. By analyzing the temporal activity of individual cells, we found that transcription occurs in bursts, whose duration and timing are modulated by transcription factor activity. Using our platform, we regulated transcription via light-driven feedback loops at the single-cell level. Feedback markedly reduced cell-to-cell variability and led to qualitative differences in cellular transcriptional dynamics. Our platform establishes a flexible method for studying transcriptional dynamics in single cells.
Keywords: optogenetics, cybergenetics, feedback regulation, single cell, transcription, stochasticity, transcriptional bursting, PP7, EL222
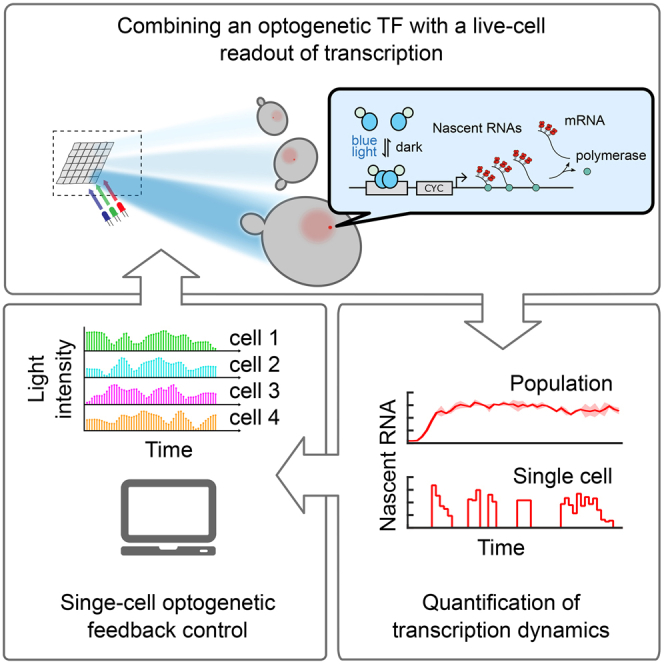
Graphical Abstract
Highlights
-
•
Live single-cell quantification of light-activated transcriptional bursts in yeast
-
•
A platform for precise light targeting enables single-cell dynamic feedback control
-
•
Single-cell regulation markedly reduces cell-to-cell variability
-
•
Transcription factor activity modulates burst timing and duration
Rullan et al. develop an optogenetic framework for elucidating stochastic transcription at the single-cell level. Combining live-cell nascent RNA quantification with optogenetic transcription in an automated setup for spatiotemporal light delivery, the authors establish real-time light-based feedback control in single cells. The method is used to study transcriptional burst dynamics.
Introduction
Precise regulation of gene expression plays a major role in many biological processes, such as the cellular response to environmental stimuli. On the transcriptional level, gene expression is often regulated by the activity of specific transcription factors (TFs). In recent years, single-cell studies have greatly increased our understanding of transcription and its regulation. For example, it was shown that upon stimulation, signaling molecules and TFs often display dynamic patterns of activity, such as oscillations (Purvis and Lahav, 2013). Furthermore, single-cell analysis revealed that cells of isogenic populations show substantial amounts of expression heterogeneity (Raj and van Oudenaarden, 2008). In eukaryotic cells, the transcription of many genes was observed to occur in stochastic, pulsatile bursts (Chubb et al., 2006, Raj et al., 2006, Zenklusen et al., 2008). While the dynamics of TF activity and transcription have each been studied extensively, a quantitative understanding of how stochastic transcription is influenced by the abundance and dynamics of upstream regulators is just starting to emerge (Larson et al., 2013, Molina et al., 2013, Neuert et al., 2013, Senecal et al., 2014).
To date, regulation of stochastic transcription has mainly been analyzed by measuring the gene expression response to natural stimuli, such as growth factors (Molina et al., 2013, Neuert et al., 2013, Senecal et al., 2014). Such stimuli can simultaneously activate a variety of signaling pathways, blurring the causal link between the activity of individual TFs and gene expression responses. Thus, the ability to control the activity of transcriptional regulators precisely and dynamically has the potential to lead to new insights into gene expression regulation (Toettcher et al., 2011). For many natural systems, performing precise perturbations may be challenging due to the inherent dynamic interplay of their components (Purvis et al., 2012). A promising, complementary strategy is the use of (semi-)synthetic systems to study general properties of transcriptional processes in a bottom-up fashion (Khalil et al., 2012, Senecal et al., 2014).
Here, following the latter approach, we set out to develop a versatile framework for the interrogation of transcriptional activity in single, live cells. We combine a photosensitive TF with fast kinetics with a real-time nascent RNA readout, enabling simultaneous regulation of an upstream effector and visualization of its effect on transcriptional dynamics. To achieve independent photoinduction and quantification of gene expression in hundreds of single yeast cells in parallel, we built a low-cost experimental platform based on a Digital Micromirror Device (DMD) projector and a powerful image processing software pipeline to automatically track, target with light, and quantify the responses of single cells over long timespans. Using a combination of different light perturbations and feedback control of transcription in single cells, we are able to explore in depth the TF-mediated modulation of transcriptional bursting in Saccharomyces cerevisiae. By analyzing how different features of the single-cell responses are affected by the abundance and dynamics of active TF, we show that the amount of active TF mainly determines the propensity of transcriptional bursts as well as their duration, and we propose a molecular mechanism able to reproduce these results. Additionally, we show that variability in transcription levels can be compensated by tuning the input each cell receives. Given that different effectors of gene expression can be fused with light-sensitive DNA-binding domains, our results demonstrate a powerful and generally applicable approach for the study of transcription at the single-cell level.
Design
To effectively analyze the effects of upstream regulators on downstream transcriptional dynamics, an experimental system should meet the following design requirements: (1) reversible and fast modulation of TF activity, (2) visualization of transcriptional response in real time, and (3) independent regulation and quantification of several cell responses in parallel.
Recruitment of transcriptional regulators using small-molecule responsive DNA-binding proteins was previously employed to analyze transcriptional regulation at the single-cell level (Janicki et al., 2004). However, for such tools the speed of regulation is limited by cellular uptake and release of the inducer. Given that in natural systems TF activity can vary on a timescale of minutes (Cai et al., 2008), an ideal tool for the analysis of transcriptional regulation would show similarly fast activation and deactivation kinetics. In contrast to small molecules, light can be administered to single cells with unprecedented spatiotemporal resolution and is thus an ideal input for our framework. In recent years, optogenetic tools have been developed that enable fast and reversible control of many cellular processes, including gene expression (Müller et al., 2015, Toettcher et al., 2011). However, these tools have not yet been extensively applied to study transcription stochasticity. A first step in this direction was made by Larson et al. (2013), who employed a photocaged steroid receptor ligand to induce a pulse of steroid receptor activity in single cells.
To meet the speed and reversibility requirements, we employed a previously described photosensitive TF consisting of a nuclear localization signal (NLS), the VP16 transactivation domain (AD), and the bacterially derived LOV-domain protein EL222 (VP-EL222) (Motta-Mena et al., 2014, Nash et al., 2011). Blue light stimulation induces structural changes in EL222 in a matter of seconds, leading to homodimerization and binding to its cognate promoter sequence (Figure 1A). In the absence of blue light, VP-EL222 deactivates within 1 min and shows minimal DNA-binding activity (Motta-Mena et al., 2014). Thus, non-induced VP-EL222 does not affect the promoter state, e.g., nucleosome positioning, allowing early promoter remodeling to be investigated.
Figure 1.

Experimental Setup for Optogenetic Feedback Control of Single Cells
(A) Optogenetic induction of transcription and RNA labeling. VP-EL222 homodimerizes in presence of blue light, exposing its DNA-binding domain (Nash et al., 2011). The dimer then binds to its cognate promoter, a fusion of five EL222-binding sites (EL-bs) to the truncated CYC1 promoter (CYC180), stimulating the expression of a downstream gene. The regulated gene contains stem-loops recognized and bound by a reporter protein (tdPCP-tdmRuby3), enabling the visualization of the produced RNAs in live cells.
(B) Nascent RNA visualization and depiction of transcriptional bursting. Top: the accumulation of fluorescently labeled nascent RNAs at the transcription site generates a diffraction-limited fluorescent nuclear spot clearly visible under the microscope. Bottom: illustration of the nascent RNA profile in two cells exposed to a constant stimulus. The cellular response to the stimulus shows that transcription takes place in bursts.
(C) Experimental feedback loop for optogenetic single-cell control. Light-responsive cells are grown under a microscope and periodically imaged. The images are read by a computer in charge of cell segmentation and tracking, and quantification of the cellular readouts. The results are provided to feedback controllers (each assigned to a single cell), which compute the light intensity to be projected onto each cell at the next time point, in order to attain a pre-specified behavior in the individual cells. The calculated inputs are passed to a DMD projector, responsible for precisely targeting light onto the cells.
(D) Optogenetic induction of transcription in single cells. Top: yeast cells densely growing in a monolayer are illuminated through the DMD projector (blue) in the pattern of a number “10.” The active transcription site of each cell (imaged in the fluorescence channel) is marked by a red spot (see Video S1 for time course and Figure S1C for unprocessed data). Bottom: bright-field and fluorescence images of yeast cells selectively targeted with blue light.
(E) Pipeline for the quantification of nascent RNAs. Fluorescent images are taken at five different z-plane positions to capture the entirety of the cell. The images are then processed to yield the nascent RNA count per cell (STAR Methods).
In order to thoroughly investigate transcriptional dynamics in response to TF inputs, a fast readout at the single-cell level is also required. Protein stability and maturation delays preclude the analysis of the underlying variability and kinetics of transcription using fluorescent proteins (FPs). The MS2/PP7 RNA detection system bypasses these problems to provide real-time readouts of transcriptional activity (Bertrand et al., 1998, Larson et al., 2011). In this system, RNAs are visualized by the introduction of multiple stem-loop sequences (MS2/PP7-SL). The stem-loops are bound by FP-labeled MS2/PP7 coat proteins shortly after being transcribed (Figure 1A). Due to the accumulation of FPs at the transcription site, nascent RNAs can be detected as diffraction-limited fluorescent spots in induced cells, allowing for their quantification (Figure 1B). Recently, optogenetic protein regulation was combined with transcription visualization approaches in mammalian cells (Rademacher et al., 2017, Wilson et al., 2017). Here, we combine a light-sensitive TF and a transcription visualization system with an experimental platform for single-cell photostimulation.
The stimulation of individual cells based on readouts of their physiological or morphological state can guide the investigation of biochemical network topologies at a much greater level of detail. For example, it can enable the detection of previously unobserved factors influencing the cellular responses (Toettcher et al., 2013), or allow the investigation of emergent population-level behaviors based on interactions between cells and their environment (Chait et al., 2017). Independent photostimulation of cells requires hardware for patterned illumination at the microscope sample plane. Additionally, to precisely target the desired cells during time course experiments, cell segmentation and tracking are needed to locate each cell and to follow it over time. Commercial solutions for the delivery of light to restricted regions of the field of view are nowadays available. However, such devices are costly and not easily interfaceable to external software. Instead, they are typically operated manually, making experiments in which illuminated regions change dynamically extremely challenging. To avoid these problems, we constructed a custom light delivery platform (Figure 1C), built from easily available components, with a cost of around $1,000 US. Our solution is fully integrated with freely available microscope control software (Lang et al., 2012) and can be easily interfaced with external programming languages for increased flexibility.
Results
An Experimental Setup for Single-Cell Optogenetics
We built an experimental platform tailored for independent photoinduction of gene expression or signaling in hundreds of single yeast cells in parallel (Figure 1C). To stimulate cells with light, we made use of a DMD projector (Zhu et al., 2012) (STAR Methods). The DMD contains an array of about a million individual micromirrors, with each mirror being independently switchable between an “on” and an “off” position. When “on,” the mirror reflects the light of an LED source onto the specimen, while intermediate light intensities can be achieved by fast pulse-width modulation of the mirror position. Coupled with a microscope at sufficient magnification (Figure S1A), the high pixel density of the DMD projector can thus achieve micrometer spatial resolution. This in turn enables the generation of light patterns that can precisely target individual yeast cells within a tightly packed micro-colony with inputs of arbitrary duration and intensity (Figure 1D). To constrain the cells onto a single plane (necessary to maintain the DMD projector precisely focused on the colony), a previously introduced microfluidic chip that enables long-term observation of growing microcolonies was used (Frey et al., 2015).
Parallel, single-cell optogenetic stimulation across a fast-growing cellular population poses challenges with respect to cell segmentation and tracking. Cell positions must be precisely extracted to accurately target each cell with light, and cell identity across frames must be known. We therefore constructed a software pipeline for imaging automation, real-time image processing, and light input application (STAR Methods). With this setup, pre-specified temporal and spatial light patterns can be applied to individually tracked cells or cell groups (open-loop operation). Furthermore, monitoring transcriptional activity within each cell with an RNA detection system (see below) allows the calculation of light inputs based on the current and past measurements from each cell, in order to achieve a prespecified target activity level (closed-loop operation). This further required the addition of computational algorithms to quantify the cellular readouts and compute the necessary light input adjustments within our software pipeline (Figures 1E and S6C).
Thanks to the careful optimization of all hardware and software components, our system is capable of updating the light inputs to ∼100 tracked yeast cells every 2 min—a frequency that allows real-time feedback regulation of fast cellular processes such as transcription or signaling. When operating in the less demanding open-loop mode, the system has been used to simultaneously perturb transcription dynamics in more than 500 cells (Figure S3E).
Optogenetic Characterization of Transcriptional Activation and Memory
In order to manipulate and measure transcriptional activity at the single-cell level, we combined the light-sensitive transcription factor VP-EL222 with real-time observation of transcription using the PP7 system (Larson et al., 2011). Specifically, we engineered a reporter gene by introducing a VP-EL222 responsive promoter, consisting of five EL222-binding sites and a truncated CYC1 promoter (Benzinger and Khammash, 2018), as well as a sequence encoding 24 copies of the PP7 stem-loop upstream of the endogenous GLT1 open reading frame (ORF) (Figure 1A). A constitutively expressed fusion protein, consisting of a PP7 bacteriophage coat protein tandem dimer fused to an NLS and two copies of the red fluorescent protein mRuby3 (tdPCP-tdmRuby3), binds to these stem-loops, allowing for the visualization of nascent RNAs as a fluorescent diffraction-limited spot in the nucleus. We performed single-molecule fluorescent in situ hybridization (smFISH) measurements to relate the quantified spot fluorescence values to numbers of nascent RNAs at the transcription site (STAR Methods; Figure S2).
Activation of VP-EL222 was shown to occur within seconds after blue light illumination (Motta-Mena et al., 2014, Nash et al., 2011). This property enables the precise quantification of transcriptional activation kinetics by measuring reporter gene transcription in response to a constant light input. We found that nascent RNAs were detectable in single cells as soon as 2 min after light exposure (Figure S3A; peak wavelength, 450 nm; spectrum, Figure S1B). In the population average, half-maximal average nascent RNA counts were reached 8–9 min after induction (Figure 2A). While different levels of constant light intensity affected the steady-state nascent RNA counts and thus the average transcription rate of the population, they did not strongly affect the transient dynamics of the average RNA count (Figure 2A). Importantly, light-dependent induction of transcription required the expression of the full VP-EL222 protein as well as the presence of its cognate binding sites in the promoter region (Figure S2B).
Figure 2.

Optogenetic Characterization of Transcriptional Activation and Memory
(A) Temporal transcriptional response of cells exposed to constant light. Mean transcriptional response of yeast cells (bottom) exposed to high (red) and low (orange) blue light intensity (top). Colored lines represent the mean and the shaded regions represent the SD of two independent experiments (mean transcriptional response of each experiment is shown in Figure S3F). The time at which half-maximal average nascent RNA counts are reached (t½) is depicted on the graph.
(B) Transcriptional response to a sequence of light pulses. Cells were exposed to pulses of high- (red) and low- (red) intensity blue light with a duration and an interpulse interval of 10 min (top). Colored lines represent the mean and the shaded regions represent the SD of three independent experiments (transcriptional responses from each experiment are shown in Figure S3G).
(C) Lack of memory in the transcriptional response. Top: distributions of single-cell responses do not differ between two consecutive light pulses. The x-coordinate of each point represents the transcriptional response of an individual cell, computed by adding up the nascent RNA measurements taken during the application of the first light pulse and the subsequent dark period. The y-coordinates denote the transcriptional responses of the same cells to the second light pulse. Marginal distributions of single-cell responses are shown at the respective axis. The data correspond to the pulse experiment with high light intensity shown in (B) and were normalized to the maximal response. Bottom: the table shows the percentage of cells that responded to neither the first nor the second light pulse, to both of them, or to only one of the light pulses. The data indicate that the transcriptional response of the cells is not strongly affected by previous light pulses.
We next sought to use the fast deactivation kinetics of VP-EL222 (Motta-Mena et al., 2014, Nash et al., 2011) to analyze potential short-term transcriptional memory. To this end, we measured the transcriptional response to a series of light pulses. The average nascent RNA count started to decrease between 2 and 4 min after light withdrawal and returned to pre-induction levels after 10 min (Figure 2B). This confirms the fast deactivation kinetics of VP-EL222 and further shows that transcription initiation ceases directly with or shortly after VP-EL222 deactivation. The response of the cell population to the different pulses was almost identical (Figures 2B and 2C). Furthermore, the transcriptional output of individual cells to two consecutive pulses was symmetric (Figure 2C): cells presented on average a similar response to both pulses, indicating that the first pulse did not influence the cell’s response to the second pulse. Thus, VP-EL222-mediated transcriptional activation does not lead to lasting changes in the promoter state.
Characterization of TF-Mediated Transcriptional Bursting
Examination of single-cell traces from the experiment shown in Figure 2A revealed that transcription of the reporter gene occurs in bursts, with periods of high transcriptional activity and periods of inactivity in which no nascent RNAs are detectable (Figure 3A; see Figure S2A for smFISH data). Many studies rely on a model-based analysis of smFISH snapshot data to infer transcriptional dynamics (Neuert et al., 2013, Raj et al., 2006). In contrast, the combination of a live-cell readout of transcription with a controllable TF enabled us to directly quantify how bursting behavior is modulated by TF activity (Larson et al., 2013). To quantify the transcriptional dynamics of single cells, we defined the following metrics on individual cell traces (schematically illustrated in Figure 3B): the fraction of time a cell is actively transcribing (activity ratio), the duration of the bursts (burst duration), the time in between bursts (inter-burst duration), and the median number of nascent RNAs being transcribed at a given time for each burst (burst intensity).
Figure 3.

Characterization of Transcriptional Dynamics on the Single-Cell Level
(A) Examples of transcriptional bursting at different light intensities. Traces show the temporal evolution of nascent RNA counts for two individual cells exposed to constant low- (orange, bottom) and high- (red, top) intensity blue light. Traces were taken from the experiments shown in Figure 2A.
(B) Schematic representation of burst metrics used in this study.
(C) Modulation of burst metrics by light intensity. Metrics described in (B) were calculated for each cell trace derived from the experiments shown in Figure 2A (STAR Methods). The data shown represent the value of each burst metric averaged over all cells exposed to a given light intensity. Error bars indicate SD of two independent experiments.
(D) Effects of inputs on burst metrics in a simple two-state promoter model. Top: model describing gene activation and deactivation (rate kON and kOFF), nascent RNA production (rate kr), and escape of nascent RNAs from the transcription site (modeled to occur 2 min after the transcription initiation event). Bottom: elevated TF activity (induced by a higher light intensity) is assumed to increase kON and decrease kOFF. Single-cell trajectories were simulated for low and high light intensities, and burst metrics were calculated as for the experimental data. The sensitivities of the defined burst metrics to changes in model parameters kON, kOFF, and kr can be found in Figure S3B.
The analysis of cell traces revealed that the light-induced increase in transcription rate shown in Figure 2A resulted primarily from changes in the activity ratio, while burst intensity only increased slightly with light intensity (Figure 3C). The increase in the activity ratio was a result of both an increase in burst duration and a decrease in inter-burst duration (Figure 3C). To get an intuitive understanding of how the concentration of active TF affects transcription, we considered a simple two-state promoter model consisting of three parameters: kON and kOFF, which determine the rates at which the promoter switches between states, and kr, the RNA production rate when the promoter is in its active configuration. Nascent RNAs were modeled to have a fixed time interval for the completion of transcription. After analyzing the effect of the three parameters on the burst metrics (Figure S3B), we found that the model best fits the experimental results when the abundance of active TF affects both kON and kOFF, in opposite directions (Figure 3D). Therefore, a light intensity increase seems to cause a similar increase in the propensity of the promoter to transition to its “on” configuration, and to decrease the propensity it switches back “off.” There did not seem to be a direct effect of active TF abundance on kr, the parameter that primarily influences burst intensity (Figure S3B).
Single-Cell Feedback Control Reduces Cell-to-Cell Differences in Transcriptional Output
The application of constant light inputs has shown that, on average, the propensity of transcriptional bursts and their duration increases together with light intensity (Figure 3C). However, the time-averaged transcriptional output of single cells varies significantly among the cell population (Figure S4A). Previous research has shown that one approach cells take to mitigate variations in key cellular properties is feedback (Becskei and Serrano, 2000). By providing cells with light inputs based on their past transcriptional state (single-cell feedback, described below in detail), we sought to investigate to what extent feedback can reduce cell-to-cell variability in transcriptional output, and how this regulation shapes transcriptional bursting. Multiple feedback architectures have been shown to provide adaptation (Ferrell, 2016), wherein a controlled variable in the cell, such as a protein abundance, is kept near its desired value, or setpoint, even in the presence of disturbances. We here used integral feedback (Franklin et al., 2015), which has been shown to be necessary to eliminate any mismatch between the controlled variable and the setpoint at steady state (perfect adaptation) (Yi et al., 2000). By taking the measurement of nascent RNA count in a given cell as our controlled variable and using integral feedback to modulate the illumination of that same cell, we expect cells to achieve a pre-specified average transcription rate. Therefore, the independent closed-loop control of several such cells (single-cell control) should in principle reduce cell-to-cell variability in their average transcriptional output.
To test this prediction, we capitalized on the capabilities of our experimental platform to observe, quantify, and regulate transcription in individual live cells. This enabled the implementation of in silico single-cell feedback control of gene transcription: the nascent RNA count in each cell is measured and the result fed into an integral controller implemented in a computer. The controller then computes the light input to be applied to each individual cell at the next time point, given a pre-specified setpoint (Figure 4A). An alternative approach to single-cell control is the feedback regulation of a population-averaged cellular readout with a common control input applied to all cells (population control; Figure 4A). To compare the performance of single-cell and population control, we regulated the average nascent RNA count to the same level using the two control strategies (Figure 4B, left). We found that a large part of the cell-to-cell variation in the average transcriptional output could indeed be reduced by single-cell control in comparison to population control (Figure 4B, right). Finally, we tested our platform’s ability to direct the cells to different transcriptional levels. The results in Figure 4C demonstrate that this can indeed be achieved, verifying the tunability of average transcriptional output.
Figure 4.

Single-Cell Feedback Control Reduces Cell-to-Cell Differences in Transcriptional Output
(A) Two alternative feedback control strategies considered in this work. Left: population control pools together measurements from all cells, generating a measure of average cell behavior. This bulk signal is then fed to a controller, which determines a common input to be applied to all cells. In contrast, single-cell control (right) generates an independent feedback loop for each cell.
(B) Comparison of population (red) and single-cell control (blue) performance. The goal of population control is to attain a desired population-averaged count of nascent RNAs (black dashed line). Single-cell control aims to regulate the nascent RNA count of each cell to the same target value. The two control strategies share the same control parameterization and reference value. Left: thick lines represent the average behavior of each experiment (88 cells for population control; 114 cells for single-cell control), and thin lines represent single-cell cumulative moving averages of nascent RNA counts (the average of all data up until the current time point, for each cell trace). The applied light input profiles can be found in Figure S4E. Right: distribution of time-averaged nascent RNA counts over the experiment duration for each cell.
(C) Tracking of constant output reference profiles with single-cell control. Left: three feedback control experiments with different reference values (dashed lines) were performed. Thin lines represent time averages of nascent RNA counts in individual cells, while thick lines indicate the average behavior of the population of cells. The applied light input profiles can be found in Figure S4F. Right: distribution of time-averaged nascent RNA counts over the experiment duration for each cell.
Feedback Strategy Choice Strongly Impacts Transcriptional Dynamics
Given that previous experimental and theoretical work suggests that dynamic (feedback) regulation may affect bursting behavior (Cai et al., 2008, Zambrano et al., 2015), we next asked how transcriptional dynamics are shaped by the population-level and single-cell control strategies. Analysis of the previously introduced burst metrics showed that single-cell control most strongly reduced cell-to-cell variability in the activity ratio in comparison to population control, while it had no noticeable effect on burst intensity (Figures 5A and S4D). Interestingly, the correlation between burst duration and inter-burst length differed starkly between the two control strategies: these two burst metrics were positively correlated for single-cell control and negatively correlated for population control (Figure 5B).
Figure 5.

Effect of Population and Single-Cell Feedback Control on Transcriptional Dynamics
(A and B) Effect of the two alternative control strategies on the burst metrics of single cells. Each dot corresponds to statistics of a single cell trace, and color-coded circles indicate the cell traces shown in (C). Experimental data (top) and results of simulations based on the two-state promoter model (bottom; STAR Methods) are shown.
(A) Single-cell control reduces cell-to-cell differences in activity ratio, but not in burst intensity (Figure S4D). Color intensity indicates mean burst duration.
(B) Cells under population control present a negative correlation between burst duration and inter-burst duration, while cells under single-cell control show a positive correlation. Color intensity is proportional to the local density of dots in the plot.
(C) Example cell traces from single-cell and population control experiments. Time course of nascent RNA count (top and middle) in single cells, together with the applied light input (bottom). Left: population control provides one common, slow-varying input to the cell population. Right: single-cell control administers highly dynamic light inputs, tailored to the response of each individual cell.
To test whether our stochastic model of the system predicts these same patterns, we extended the model equations from Figure 3D to include VP-EL222 and the feedback dynamics (STAR Methods). Simulations of population-level control could not reproduce the correlation between burst duration and inter-burst length observed experimentally (Figure S4H), suggesting the need to further extend the model. TF variability has previously been reported to strongly contribute to variability in gene expression (Pedraza and van Oudenaarden, 2005, Volfson et al., 2006). We therefore introduced cell-to-cell differences in VP-EL222 abundance to the model (STAR Methods). Simulations of this extended model reproduced the experimental results nicely (Figures 5A, 5B, and S4C).
To understand the differences in transcriptional dynamics between the feedback strategies, it is instructive to compare the light inputs seen by the cells. In population control, cells receive a common, relatively constant input (Figure 5C, left). Exploring the effect of applying constant light of different intensities on the predefined burst metrics (Figures 2A and 3) led us to conclude that cell populations with a larger amount of active TF (cells exposed to light inputs of higher intensity) presented increased burst times and decreased inter-burst times (Figure 3C). Therefore, assuming that TF abundance varies among the cells, we would expect cells with higher amounts of the regulator to experience longer bursts and shorter inter-burst intervals, explaining the negative correlation found between the two burst metrics in population control.
In contrast to the relatively static light inputs of population control, cells under single-cell feedback control receive more dynamic inputs, due to the controller reacting to the stochasticity of transcriptional activity. In this control strategy, the input dynamics are thus dictated by each cell’s burst statistics: cells presenting short bursts will require more frequent light stimulation to achieve the same average expression as cells displaying long bursts (Figure 5C, right). In the latter case, the controller will turn off the light input to the cells for longer periods of time to avoid surpassing the target expression level. Importantly, single-cell feedback resulted in a subset of cells displaying bursting statistics not found to occur in cells of the population control experiments (Figure 5B), highlighting the ability of dynamic single-cell inputs to shape the endogenous transcription statistics in individual cells.
Toward a Mechanistic Understanding of Transcriptional Bursting and Its Modulation
The two-state promoter model used above (Figure 3D) showed that the abundance of active TF must affect both promoter activation and inactivation rates to achieve the measured burst modulation. However, these modeling heuristics are not easily linked to biological phenomena. We thus next asked whether we can find a potential physical mechanism and an accompanying model that can explain the observed data. Analysis of the burst duration in cells exposed to light pulses (Figure 2B) showed that bursts initiated during the first 4 min of the 10 min pulse were significantly longer than bursts initiated within 2 min of pulse cessation (Figure 6A), indicating that inactive TF cannot bind to its target site once it unbinds, resulting in burst termination.
Figure 6.

TF-Binding Dynamics and Transcriptional Bursting
(A) Removal of light input after the start of a transcriptional burst reduces burst duration. The transcriptional response of cells exposed to 10 min light pulses (experimental data from Figure 2B) was analyzed by selecting transcriptional bursts that start up to 4 min after the beginning of the light pulse (early bursts), and bursts that start up to 2 min prior to the end of the light pulse (late bursts). The average duration of bursts of these categories is shown on the right (nine repetitions performed in three experimental replicates, for each condition). Error bars denote the SD of each set of bursts.
(B) Quantifying the residence time of fluorescently tagged VP-EL222AQTrip at a cognate binding site array using FRAP. VP-EL222 was activated by blue light illumination, resulting in the formation of fluorescent spots at the array site. Spots were bleached at t = 0 s and fluorescence images were acquired at 20 s intervals to quantify fluorescence recovery. Top: fluorescent microscopy images of a representative FRAP experiment and schematic representation of fluorescent spots. Images were normalized to compensate for photobleaching (see Figure S5C for non-normalized data). Bottom: time course of spot fluorescence relative to the pre-bleach value (see Figures S5C and S5D and STAR Methods for details on image analysis). Experimental data (points, mean and SEM of 19 cells measured on 3 separate days) and fit of an ODE model describing the experiment (line; see STAR Methods and Figures S5E and S5F for modeling details) are shown.
(C) Schematic representation of a promoter model that explicitly accounts for (non-processive) TF binding. The model consists of six states (circles) representing an unbound promoter (red) and a promoter bound by one to five TFs (green, number of bound TFs is indicated). Transitions between states represent binding and unbinding events to and from one of the five binding sites of the promoter. Transcription occurs with rate kr if one or more TFs are bound (green states).
(D) Comparison of observed burst duration modulation to model predictions. Stochastic simulations of the model shown in (C) were performed using the experimentally determined value for koff and varying values for kon. The black line shows model simulation in which the rate of TF binding is independent of the current promoter state (kon’ = kon). The green lines correspond to model simulations in which the rate of the first TF-binding event was decreased to different degrees (kon’ = kon/kc). The experimental data (points) represent the mean and SEM of the average burst duration of cell traces from Figure 2A, which were binned by their activity ratio.
To investigate whether TF binding dynamics are sufficient to explain the experimental data, we first measured the residence time of red fluorescent protein-tagged VP-EL222 (mScarletI-VP-EL222) (Bindels et al., 2017) at a genomically integrated array of 80 VP-EL222-binding sites by performing a fluorescence recovery after photobleaching (FRAP) experiment. Blue light exposure led to the accumulation of mScarletI-VP-EL222 molecules at the array, which resulted in easily detectable fluorescent foci (Figures S5A and S5B) that were subsequently bleached. In order to prevent dark-state reversion of activated VP-EL222 during the FRAP experiment, we used an EL222 mutant with a stabilized photoactivated state (AQTrip; Zoltowski et al., 2013; Figure S5B). We found that the fluorescence of photobleached foci recovered on a timescale of a few minutes (Figures 6B, S5C, and S5D). By using a simple ordinary differential equation model that describes binding and unbinding of fluorescent and bleached mScarletI-VP-EL222 (Figure S5E; STAR Methods), we estimated that VP-EL222 has an average residence time at its cognate binding site of 40 s (unbinding rate, 0.018 s−1; Figure S5F).
Next, we investigated the expected characteristics of bursts originating from independent TFs binding at multiple sites on the promoter. We used a simple model of a promoter with five binding sites, in which the binding (with rate kon) and/or unbinding (with rate koff) of single VP-EL222 dimers are modeled as state transitions, and transcription is assumed to take place (with rate kr) when one or more VP-EL222 dimers are bound (Figure 6C). We fixed koff to the experimentally determined value and performed stochastic simulations of this system for different values of kon, which is equivalent to changing the concentration of active VP-EL222 molecules. The simulated single-cell trajectories were then analyzed using the previously defined burst metrics (Figure 3B). In stark contrast to the experimental observations, we found that this model predicts relatively constant and short transcription burst durations for a large range of burst fractions (black line, Figure 6D). Thus, our analysis excludes independent TF binding to multiple binding sites as a potential mechanism behind the observed transcription dynamics.
In the cellular environment, TF-binding sites may by occluded by nucleosomes (Radman-Livaja and Rando, 2010). Competition for DNA binding between histones and TFs can reduce the binding rate of the first TF, while subsequent binding events may be facilitated by TF-mediated chromatin remodeling, a fact neglected by the simple model above (Miller and Widom, 2003, Neely et al., 1999, Radman-Livaja and Rando, 2010). We modeled this potential scenario by reducing the rate of the first TF-binding event by the factor kc (colored lines, Figure 6D). We found that by solely adjusting this free parameter, the modified model could reproduce very well the dynamics of transcriptional bursting observed in vivo (Figures 6D and S5G), suggesting that a slow binding step for the first TF may be a potential mechanism for the generation of the observed bursting behavior. In contrast to the two-state model, this mechanism does not require TF activity to directly modify the promoter inactivation rate.
Discussion
We presented an experimental framework for the real-time visualization and optogenetic regulation of transcription at the single-cell level, based on the combination of a light-sensitive TF, the PP7 system for RNA detection, and an experimental platform (hardware and software) for precise spatiotemporal delivery of light inputs. This framework enables the analysis of various aspects of TF-mediated transcriptional regulation. The rapid activation and deactivation kinetics of EL222 allow the investigation of transcriptional activation dynamics and memory. Furthermore, the fast readout of transcriptional activity enables the quantification of how active TF abundance affects the dynamics and stochasticity of transcriptional bursts. Finally, the ability to not only specify the input strength in time but also in space allows for the closed-loop regulation of individual cells. Feedback regulation can compensate the high cell-to-cell variability observed in transcription, providing insights into possible mechanisms cells use to tune their gene expression dynamics.
Transcriptional Bursting and Its Modulation
Transcriptional bursting in yeast had been previously inferred from smFISH analysis for the PDR5 gene (Larson et al., 2011, Zenklusen et al., 2008) and was recently directly observed for the GAL10 gene (Lenstra et al., 2015). However, it was suggested that a variety of genes in S. cerevisiae are transcribed based on uncorrelated, single-initiation events (Larson et al., 2011, Zenklusen et al., 2008). Here, we found that transcription from the VP-EL222 target promoter occurs in bursts with a duration in the order of minutes. We found that elevated TF activity significantly increases burst duration and reduces the inter-burst duration, leaving burst frequency (number of bursts per unit of time) largely unchanged (Figure S3C). In contrast to these findings, frequency modulation appears to be a widespread scheme in mammalian gene regulation (Larson et al., 2013, Senecal et al., 2014, Nicolas et al., 2017). However, experiments using other physiological stimuli show that gene induction can also be achieved by increases in burst intensity and duration in mammalian cells (Dar et al., 2012, Molina et al., 2013).
We found that input-mediated changes in promoter state are highly transient. This result is consistent with previous studies in S. cerevisiae (Aymoz et al., 2016) but stands in contrast to mammalian cells where many genes were shown to display a refractory period after induction (Suter et al., 2011). Furthermore, the use of pulsed inputs indicated that TF-binding dynamics could be crucial for transcriptional bursting. This fact was previously suggested by observations that binding site multiplicity results in increased burst duration and/or burst intensity (Raj et al., 2006, Senecal et al., 2014, Suter et al., 2011).
By combining measurements of VP-EL222-binding kinetics with a mathematical model of promoter binding and transcription, we found that binding site multiplicity can reproduce the experimentally observed bursting behavior when the first binding event is rate limiting, but not when binding events are assumed to be independent. This modeling choice is consistent with previous studies that exemplify the effect of nucleosome positioning and remodeling on noisy gene expression (Radman-Livaja and Rando, 2010). However, gene transcription requires a sequence of additional reactions that can be affected by TF concentration and may give rise to a similar model architecture (Corrigan et al., 2016, Mao et al., 2010). For example, state transitions could represent TF-mediated nucleosome disassembly followed by assembly of the preinitiation complex (Mao et al., 2010).
Future studies are required to evaluate the proposed TF-binding model of transcriptional bursting. The mechanistic model can be used to guide future experiments, especially when combined with an easily modifiable synthetic system. For example, in order to test model predictions, target promoters with defined properties, such as nucleosome occupancy and number of binding sites, can be engineered. Furthermore, VP16 can be exchanged with other ADs and chromatin regulators (Keung et al., 2014), whose effects on stochastic gene expression are still largely unknown.
Dynamics of Gene Regulation Affect Transcription Statistics
Using the capabilities of single-cell observation, quantification, and actuation that our experimental platform offers, we could reduce cell-to-cell variability in the average transcriptional response (Figure 4B). In accordance with the results obtained from applying constant illumination to a cell population, analysis of single-cell control experiments showed that active TFs mainly affected burst duration and the timing between bursts. Consequently, the cells’ activity ratio was also changed (Figures 5A and 5B). Moreover, transcriptional dynamics of cells controlled individually differed starkly from cells exposed to constant light (Figure 5B), highlighting the ability of cellular feedback to modulate gene expression dynamics (Zambrano et al., 2015). Cells could in principle modulate the dynamics of upstream regulators (e.g., constitutive expression and feedback regulation) to tune the noise statistics of structurally similar promoters.
More broadly, dynamic stimulation of single cells based on their current physiological state (e.g., cell-cycle stage) can provide rich information on the different roles of upstream processes in the regulation of a downstream response (Toettcher et al., 2013). Given that the feedback law is implemented in a computer, biological regulatory motifs can be easily implemented and tested (Milias-Argeitis et al., 2016), giving insights into the different effects they have on the controlled network.
Further Fields of Application for the Optogenetic Platform
In addition to the interrogation of transcriptional regulation, our experimental framework is well suited for the study of a broad range of scientific questions. The platform is a unique tool to evaluate the effects of different cellular feedback strategies on gene expression. More generally, the hardware and software pipeline described here, with its ability to precisely control the abundance or activity of proteins (or RNA), can be used to study gene expression networks. Finally, one can envision the use of single-cell feedback for the spatial control of multicellular systems, such as the targeted differentiation of mammalian cells for tissue regeneration, or the analysis of spatial structures in microbial populations.
Limitations
As demonstrated above, our experimental platform enables the regulation and observation of transcription in yeast cells for periods of several hours. However, as transcription dynamics are relatively fast, this requires frequent imaging of the cells. For the quantification of nascent RNA, each imaging cycle involves taking images at various z-plane positions to span the whole cell volume in search of the transcription site. The long exposures to high-intensity light may cause fluorophore bleaching and phototoxicity. To limit these negative effects, the light exposure time necessary to achieve a sufficient signal-to-noise ratio must be explored and optimized.
One limitation of transcription quantification through the PP7 system is the need to introduce multiple copies of the PP7-SL into the RNA sequence. Recent studies have shown that this procedure can affect the processing and subcellular localization of RNAs (Heinrich et al., 2017). However, for our framework the identity of the target RNA is not of major importance and measurements are mainly affected by transcript length, which influences the dwell time of nascent RNAs. Note that we found cells with strong cytoplasmic fluorescent spots in isolated experiments. We opted to remove these experiments from our analysis as this behavior could be a result of stressful environmental conditions (Heinrich et al., 2017).
Previous studies have shown that the activity of VP-EL222 may decline during constant illumination (Motta-Mena et al., 2014, Reade et al., 2017). In accordance, we find a decrease of nascent RNA counts over time under uniform illumination conditions (Figures 2A and S3F). Thus, for experiments that require long-term measurements, experimental procedures may need to be optimized or VP-EL222 exchanged for another light-sensitive TF.
STAR★Methods
Key Resources Table
| REAGENT or RESOURCE | SOURCE | IDENTIFIER |
|---|---|---|
| Experimental Models: Organisms/Strains | ||
| S. cerevisiae: BY4741: MATa his3Δ1 leu2Δ0 met15Δ0 ura3Δ0 | EUROSCARF | ACCNO: Y00000 |
| S. cerevisiae: BY4742: MATalpha his3Δ1 leu2Δ0 lys2Δ0 ura3Δ0 | EUROSCARF | ACCNO: Y10000 |
| DBY41: BY4741, LEU2::ACT1pr-VPEL222-CYC1term(pDB58) | Benzinger and Khammash, 2018 | N/A |
| DBY80: DBY41, GLT1prΔ::HIS3-5xELbs-CYC180pr-24xPP7SL(pDB96) | This paper | N/A |
| DBY91: BY4742, URA3::MET25pr-tdPCP-NLS-tdmRuby3-CYC1term(pDB97) | This paper | N/A |
| DBY96: DBY80 mated with DBY91 | This paper | N/A |
| DBY132: BY4741, GLT1prΔ::URA3MX-CYC180pr-24xPP7SL, LEU2::ACT1pr-VPEL222-CYC1term | This paper | N/A |
| DBY133: BY4741, GLT1prΔ::HIS3-5xELbs-CYC180pr-24xPP7SL(pDB96), LEU2::ACT1pr-NLS-URA3MX-CYC1term | This paper | N/A |
| DBY134: DBY91, LEU2::ACT1pr-VPEL222-CYC1term(pDB58) | This paper | N/A |
| DBY135: DBY91, LEU2::ACT1pr-NLS-VP16-CYC1term(pDB147) | This paper | N/A |
| DBY136: DBY91, LEU2::ACT1pr-NLS-EL222-CYC1term(pDB148) | This paper | N/A |
| DBY138: DBY132 mated with DBY91 | This paper | N/A |
| DBY139: DBY133 mated with DBY91 | This paper | N/A |
| DBY140: DBY133 mated with DBY134 | This paper | N/A |
| DBY141: DBY133 mated with DBY135 | This paper | N/A |
| DBY142: DBY133 mated with DBY136 | This paper | N/A |
| DBY30: BY4742, LEU2::80-EL-BS-Array(pDB30) | This paper | N/A |
| DBY144: DB30, URA3::ACT1pr-mScarletI-VPEL-CYC1term(pDB145) | This paper | N/A |
| DBY145: DB30, URA3::ACT1pr-mScarletI-VPEL(AQTrip)-CYC1term(pDB146) | This paper | N/A |
| DBY146: DBY4741, URA3::ACT1pr-mScarletI-VPEL(AQTrip)-CYC1term(pDB146) | This paper | N/A |
| Oligonucleotides | ||
| PP7 probe 1: [CY3]TTCTAGGCAATTAGGTACCTTA | IDT DNA, (Ochiai et al., 2014) | N/A |
| PP7 probe 2: [CY3]TTTCTAGAGTCGACCTGCAG | IDT DNA, (Ochiai et al., 2014) | N/A |
| PP7 probe 3: [CY3]AATGAACCCGGGAATACTGCAG | IDT DNA, (Ochiai et al., 2014) | N/A |
| Primer BS-deletion_fwd: TTAATCAATTCTTATATCTTACTTGATAACACACCAAA CTAATCGTCTCCgtttagcttgcctcgtcc |
IDT DNA | N/A |
| Primer BS-deletion_rv: ATGATCATGTGTCGTCGCACACATATATATATGCCTGT ATGTGTCAGCACgttttcgacactggatggc |
IDT DNA | N/A |
| Primer VPEL-deletion_fwd: AATTTACTGAATTAACAACTAGTATGGGCCCTAAA AAGAAGCGTAAAGTCgtttagcttgcctcgtcc |
IDT DNA | N/A |
| Primer VPEL-deletion_rv: ATAACTAATTACATGATATAGACAAAGGAAAAGGGGCCTGTCTCGAGTTAg ttttcgacactggatggc |
IDT DNA | N/A |
| Recombinant DNA | ||
| pDB58: pKERG105/ACT1pr-VPEL222-CYC1term | Benzinger and Khammash, 2018 | N/A |
| pDB96: pDZ306/GLT1-5xELbs-CYC180pr-24xPP7SL | This paper | N/A |
| pDB97: pRG205/MET25pr-tdPCP-NLS-tdmRuby3-CYC1term | This paper | N/A |
| pDB81: pKERG105/80-EL-BS-Array | This paper | N/A |
| pDB145: pKERG106/ACT1pr-mScarletI-CYC1term | This paper | N/A |
| pDB146: pKERG106/ACT1pr-mScarletI-VPEL222(AQTrip)-CYC1term | This paper | N/A |
| pDB147: pKERG105/ACT1pr-NLS-VP16-CYC1term | This paper | N/A |
| pDB148: pKERG105/ACT1pr-NLS-EL222-CYC1term | This paper | N/A |
| Software and Algorithms | ||
| YouScope | Lang et al., 2012 | http://langmo.github.io/youscope/ |
| CellX | Dimopoulos et al., 2014 | http://www.csb.ethz.ch/tools/software/cellx.html |
Contact for Reagent and Resource Sharing
Further information and requests for reagents may be directed to and will be fulfilled by the Lead Contact, Mustafa Khammash (mustafa.khammash@bsse.ethz.ch).
Method Details
Plasmid construction
E. coli TOP10 cells (Invitrogen) were used for plasmid cloning and propagation. Plasmids were constructed by restriction-ligation cloning using enzymes from New England Biolabs (USA). All plasmids used in this study are summarized in Table S1. Sequences and details of all DNA constructs used in this study can be found in Table S5.
All PCRs were performed using Phusion Polymerase. Plasmid pDB96 was used to insert an EL222-responsive promoter and 24 PP7 stem-loops in front of the genomic GLT1 ORF and was constructed by replacing the POL1 promoter in pDZ306 (Larson et al., 2011) with the synthetic, EL222-responsive promoter 5xELbs-CYC180 (described and characterized in Benzinger and Khammash, 2018). A construct containing two copies of PCP, the SV40 NLS, and two copies of mRuby3 (Bajar et al., 2016) (tdPCP-NLS-tdmRuby3) under the control of the MET25 promoter was inserted into the integrating plasmid pRG206 (Gnügge et al., 2016) (pDB97). Plasmid pDB58 is an integrative plasmid (LEU2 marker) based on the pRS vector series containing the VP-EL222 sequence under control of the ACT1 promoter (Benzinger and Khammash, 2018). Variants of this plasmid carrying a deletion of the VP16 or the EL222 domain were constructed by PCR amplification from pDB58 and insertion into the same plasmid backbone (pDB147/148). pDB81, an integrative plasmid (LEU2 marker) containing an array of 80 VP-EL222 binding sites, was constructed by amplifying a sequence containing 5 binding sites from pcDNA-C120-mCherry and iteratively duplicating the sequence using restriction ligation cloning using XbaI/PstI and SpeI/PstI digestion and subsequent ligation (see Table S5 for the initial sequence). Plasmids pDB145 and pDB146 contain the mScarletI coding sequence directly upstream of VP-EL222 and a VP-EL222 mutant with a stabilized photoactivated state (AQTrip; Zoltowski et al., 2013), respectively. The sequence containing EL222 with the four AQTrip mutations was synthesized by idt and inserted into the VP-EL222-bearing plasmid using restriction ligation. All constructs were verified by Sanger sequencing (Microsynth AG, Switzerland).
Yeast strain construction
All strains are derived from BY4741 and BY4742 (Euroscarf, Germany). All strains used in this study are summarized in Table S2. Transformations were performed with the standard lithium acetate method (Gietz and Woods, 2002) and selection was performed on appropriate selection plates. DBY80, containing an EL222-responsive promoter and 24 PP7 stem-loops upstream of the GLT1 ORF, was constructed by transforming the PacI digested plasmid pDB96 into DBY41 (BY4741 expressing VP-EL222 from the ACT1 promoter (pDB58), construction and characterization are described in another manuscript, under preparation). A strain expressing the tdPCP-NLS-tdmRuby3 construct was generated by transforming AscI digested plasmid pDB97 into BY4742. DBY96, the strain used for most experiments in this study, was generated by mating DBY80 and DBY91. Diploid cells were selected by growth on SD plates lacking both L-Lysine and L-Methionine. To construct strains used as negative control (Figure S2B), EL222 binding sites or VP-EL222 were replaced in DBY80 by a URA3MX marker amplified from a pAG60 (Goldstein et al., 1999) derived plasmid using primer pairs BS-deletion-fwd/rv and VPEL-deletion-fwd/rv respectively and the resulting strains (DBY132 and DBY133) were mated with DBY91 (resulting in DBY138 and DBY139). Further, DBY91 was transformed with PacI digested plasmids pDB58, pDB147, or pDB148 resulting in strains expressing either VP-EL222, NLS-VP16, or NLS-EL222 (DBY134/135/136) in addition to tdPCP-NLS-tdmRuby3. These strains were mated with DBY133 resulting in DBY140/141/142. DBY30, containing a genomically integrated array of 80 VP-EL222 binding sites, was constructed by transforming BY4742 with PacI digested pDB81. Strains expressing mScarletI tagged VP-EL222 were generated by transformation of PacI digested pDB145 or pDB146 (AQTrip mutant).
Culture media
Cells were grown in SD dropout medium (2% Glucose, low fluorescence yeast nitrogen base (ForMedium), 5 g/L ammonium sulfate) with a methionine concentration of 32 mg/L. The medium’s pH was set to 5.8.
Single molecule FISH experiments
For single molecule FISH (smFISH) experiments DBY96 was grown from a single colony to saturation in SD medium (32 mg/L, L-Methionine) at 30°C. Cultures were diluted to reach an optical density at 700 nm (OD700) of 0.4 at the start of the experiment, the next day. For each experimental condition, 4 mL of cell culture were transferred to 25 ml glass centrifuge tubes (Schott 2160114, Duran) stirred with 3 × 8 mm magnetic stir bars (13.1120.02, Huberlab). Illumination at two different blue light intensities (210 and 420 μW/cm2, measured at 4 cm distance from the LED light source using a NOVA power meter and a PD300 photodiode sensor (Ophir Optronics)) was performed continuously using a setup comprised of a water bath (ED (v.2) THERM60, Julabo) set to 30°C, a multi position magnetic stirrer (Telesystem 15, Thermo Scientific), a laser-cut, custom-made 15-tube holder, and custom-made LED pads located underneath the culture tubes. Cultures were diluted 1:1 in fresh medium after 2h.
Cell fixation and probe hybridization was performed as described previously (McIsaac et al., 2013). Briefly, after 0, 1, 2, and 4 h of illumination, cells were fixated for 45 min after adding 400 μl of 37% formaldehyde (Sigma Aldrich) to the culture medium. Spheroplasting was performed using a final Lyticase (Sigma-Aldrich) concentration of 50 Units/ml. The progress of spheroplasting was monitored under the microscope. Cells were stored in 70% ethanol at 4°C overnight. Hybridization was performed using multiple probes complementary to the PP7 stem-loop and singly labeled with CY3 at a 0.1 μM concentration (synthesized by Integrated DNA Technologies, sequences are listed in Table S5) (Raj et al., 2008). Cells were stained with DAPI (0.1 μg/ml in PBS, Sigma-Aldrich), attached to Poly-D-Lysine treated coverslips, and coverslips were mounted on slides using Prolong Gold mounting medium (Invitrogen).
Growth conditions and loading to microfluidic chip
Cell initialization protocol
Cell cultures were started from a −80°C glycerol stock at least 24 h prior to the experiment, and kept at OD600 < 0.2 for the last 12h leading to the experiment.
Microfluidic chip loading protocol
The cell culture was concentrated to an OD600 ∼2 by centrifuging the sample at 3000 g for 6 min, and discarding the appropriate volume of supernatant to reach the targeted OD600. Meanwhile, the PDMS device and cover glass (Menzel-Glaser, Germany) were rinsed with acetone, isopropanol, deionized water and dried using an air gun. The cells were then resuspended and 0.4 μl of cell solution was loaded into each chamber of the clean microfluidic chip, using a conventional pipette. The cover glass was placed on top of the PDMS device and slightly pressed down, allowing the PDMS and glass to bond electrostatically.
The loaded microfluidic chip was placed onto a custom-built microscope holder, inside the microscope’s environmental box (Life Imaging Services, Switzerland). A flow of media of at least 10 μl/min was supplied through the device via gravity flow, and the cells were allowed to settle in the new conditions for 2 hours prior to the start of any experiment.
Image acquisition
All images were taken with a Nikon Ti-Eclipse inverted microscope (Nikon Instruments), equipped with a 40x, oil-immersion objective (MRH01401, Nikon AG, Egg, Switzerland), Spectra X Light Engine fluorescence excitation light source (Lumencor, Beaverton, USA), pE-100 bright-field light source (CoolLED, UK), and CMOS camera ORCA-Flash4.0 (Hamamatsu Photonic, Solothurn, Switzerland). The camera was water-cooled with a refrigerated bath circulator (A25 Refrigerated Circulator, Thermo Scientific). The temperature was regulated to 30°C by an opaque environmental box (Life Imaging Services, Switzerland), which also shielded the cell sample from external light. The microscope was operated by the open-source software YouScope (Lang et al., 2012).
All measurements were run with a diffusor and a green interference filter placed in the bright-field light path. The perfect focus system of the microscope was enabled for all measurements.
Fluorescence imaging
Excitation of mRuby3 was performed by the 550/15 nm line from the fluorescence light source. The filter-cube used had excitation filter 561/4 nm, beam splitter HC-BS573, and emission filter 605/40nm, all from AHF Analysetechnik AG (Tubingen, Germany). Z stacks consisting of 5 images with a step size of approximately 0.5 μm were taken with an exposure time of 300 ms per image. With these imaging settings, images could be taken every 2 min for a period up to 4 h without bleaching more than 15% of the initial cell fluorescence (Figure S3D).
Microscopy setting for smFISH
smFISH images were acquired using a Plan Apo Lambda 100X Oil objective (Nikon Instruments). Z stacks consisting of 31 images with a step size of 0.1 μm were taken for CY3 (Excitation: 542/33, Emission: 595/50) and DAPI (Excitation: 390/22, Emission: 460/50). Phase contrast images were taken at the reference point of the Z stacks to allow for cell segmentation.
FRAP experiments and analysis
The strain DBY145 was used for FRAP analysis. DBY145 contains a genomically integrated array of 80 EL222 binding sites and expresses a fusion between the FP mScarletI (Bindels et al., 2017) and a VP-EL222-AQTrip that exhibits a stabilized photoactivated state (Zoltowski et al., 2013). This mutant was chosen to prevent extensive photoreversion during the FRAP experiment (Figure S5B).
Initial characterization experiments were performed using the microscopy setup described above with a 100x Plan Apo Lambda Oil objective (Nikon Instruments) (Figure S4B). Fluorescence recovery after photobleaching (FRAP) experiments were performed using a Leica SP5 Point Scanning Confocal Microscope (Leica Microsystems) equipped with a 63x/1.40 HC PL APO CS2 oil-immersion objective (Leica Microsystems) at room temperature (23.5°C).
DBY145 was grown to an OD700 of roughly 0.1 in SD medium, and then transferred to a Concanavilin A (Sigma-Aldrich) treated 8-well chambered coverslip slide (ibidi), where cells were allowed to attach and grow for at least 2 h at room temperature before experiments. VP-EL222 was activated by a 20 s blue-light pulse (Leica EL6000 external light source (mercury lamp), 470/40 510 emission filter) and binding of VPEL to the array was allowed for 3 min before performing the FRAP experiment. Image stacks (9 focal planes with 200 nm z-step size) were collected every 20 s (twice before bleaching and for 180 s post-bleaching) using a 561 nm laser line at low laser intensity (3%) for excitation and a Leica HyD detector for emission measurement from 580 - 680 nm. Bleaching was performed in a circular region with a 0.5 μm diameter centered around the fluorescent foci (561 nm laser, 100% intensity).
Image analysis was performed based on maximum z-projections. Mean spot fluorescence was measured in a manually selected, circular area with 0.56 μm diameter centered around the fluorescent spot as well as in a non-overlapping control area with 1.12 μm diameter. To correct for photobleaching, the mean spot fluorescence was divided by the mean control area fluorescence (see Figures S5C and S5D for example data). The resulting values were normalized by the value in the pre-bleach image.
A simple ODE model describing the binding and unbinding of fluorescent and dark VP-EL222 to its binding sites (BS) was used to estimate the unbinding rate (koff) (Figures S5E and S5F). The model describes the time evolution of the free and DNA-bound fluorescent VP-EL222 abundance (Vfluor and Cfluor, respectively), as well as the free and DNA-bound dark (photobleached) VP-EL222 abundance (Vdark and Cdark, respectively):
To simulate photobleaching, we first let Cfluor settle to its pre-bleach steady state and then converted Cfluor to Cdark to match the relative fluorescence derived from experimental spot data pre- and post-bleaching. For comparison to the FRAP experiment the pre-bleach value of Cfluor was then scaled to 1 in accordance to the treatment of the experimental data. For all simulations, BS was set to 80. The model was simulated for values of kon and koff ranging over 3 orders of magnitude and simulations were compared to the experimental data based on the sum of squared errors (Figure S5F). The initial condition for Vfluor was varied around an estimated value and was found to have little effect on the estimated value of koff (Figure S5F).
Image analysis
Cell segmentation and tracking
Bright-field images below and above the focal plane (Nikon Perfect Focus System, +/− 5 AU) were acquired for cell segmentation and tracking. The image above the focal plane was divided by the one below the focal plane to eliminate uneven illumination and enhance the border of the cells. Segmentation was performed on the resulting image using MATLAB (MathWorks) code extracted from the CellX software tool (Dimopoulos et al., 2014). Cell tracking from frame to frame was accomplished with MATLAB scripts based on Ricicova et al. (2013).
Quantification of nascent RNAs
In our experimental setup, nascent RNAs can be visualized in the Cy3 fluorescence channel, and appear as a diffraction-limited spot, as they accumulate at the transcription site. The fluorescence intensity of a diffraction-limited spot can be described by an Airy pattern, whose central lobe is well approximated by a Gaussian function. Under this approximation, the volume of the Gaussian function is proportional to the number of nascent RNAs constituting the fluorescent spot.
To quantify the number of nascent RNAs in each cell we take a z stack of fluorescent images, spanning the whole cell volume. For each captured image, we perform the following analysis:
-
1.
We first remove the fluorescent background signal by means of a Gaussian filter. The Gaussian filter clears features smaller than its standard deviation.
-
2.
Next we subtract the original image by the filtered image, obtaining a third image where the fluorescent background has been removed, while preserving features of the size of the fluorescent spots we wish to quantify.
-
3.
Finally, we fit a 2D Gaussian function to the pixel intensity surface of each cell (Figure S6C). Two measures of the goodness of fit of the fitted Gaussian function, as well as its standard deviation and amplitude are used to classify a cell as either being transcriptionally-active or inactive (Figure S6C).
Multiple diffraction-limited spots can be detected in one cell, because of the signal overlap between consecutive fluorescent images in the z stack. If this happens, the spot with the highest signal is taken as the measurement of nascent RNA for that cell.
Calibration of spot intensities to nascent RNA counts
The conversion factor between fluorescent spot intensity (a.u.) and nascent RNA count was computed following Corrigan et al. (2016). The spot intensity distribution obtained from live cells were aligned to the quantiles of the nascent RNA count distribution as quantified by smFISH. Both experiments were performed on the same yeast strain, exposed to constant light intensities that elicited a similar transcriptional response. The percentiles of each distribution were used as calibration points for the alignment (Figure S2G).
Computation of burst metrics
Burst metrics were extracted from individual cell traces of nascent RNA counts. The traces were first smoothed with a moving average filter (sample window of 2 time points) in order to mitigate the effect of nascent RNA quantification errors. Bursts were located by searching for sequences of at least two consecutive time points where the transcription site contained a minimum of 10 nascent RNAs, the detection limit of our system. Burst duration and inter-burst duration were computed by counting the number of time points present in each burst, or between bursts, respectively, and multiplying the resulting number by the measurement frequency (2 min for all experiments). Burst intensity was computed by taking the mean of the nascent RNA count in all time points composing the burst. The burst intensity, burst duration, and inter-burst duration of all transcriptional bursts found in a particular cell trace were then averaged to obtain the transcriptional burst metrics of that cell. Activity ratio was quantified by dividing the number of time points classified as belonging to a burst by the total number of time points in the cell trace.
Light-delivery system
Hardware
Optogenetic stimulation was done with a DMD projector (DLP LightCrafter 4500, Texas Instruments) mounted on an optical table, together with the necessary optical elements to focus the emitted light at the focal plane of the microscope’s objective. A schematic of the setup, together with a list of components is provided in Figure S1A and Table S3, respectively. The light intensity at the specimen and the blue-light spectra is shown in Figure S1B.
Projection image correction
The light-delivery system was aligned to the microscope camera prior to the start of each experiment. This procedure consists of finding the correspondence between DMD projector pixels and camera pixels. The knowledge of this mapping is required to precisely target with light the cells in the field-of-view. The calibration procedure is described in Figure S6B.
Fabrication of microfluidic device
The microfluidic chip, adapted from Frey et al. (2015) was fabricated as described. The chip is a single layer poly(dimethylsiloxane) (PDMS, Sylgard 184, Dow Corning, USA) device, attached to a cover glass (thickness: 150 μm, size: 24 mm x 60 mm).
Modeling
Two-state gene expression model
We model transcription using a two-state promoter model (Kepler and Elston, 2001, Peccoud and Ycart, 1995, Raser and O’Shea, 2004), as described in Figure 3D.
The model used to obtain Figures 5A and 5B, has been extended by replacing reaction rates kON and kOFF by Hill functions dependent on active TF abundance (Figure S4B), as our results suggest that the two parameters are influenced by the concentration of the regulator (Figures 3C and 3D). The fraction of active transcription factor depends on the input u(t) given to the system. Additionally, extrinsic variation is introduced into the model by assigning different total amounts of transcription factor, TFtot, to each cell. TF abundance is drawn from a Gaussian distribution (parameters μ and σ specified in Table S4), and is set to remain constant for the duration of the experiment. As the external input u(t) determines the fraction of active TF, cells with more TFtot will present a stronger response to a given input.
For the closed-loop simulations, the light input u(t) was updated every 2 min (the measurement frequency used in the feedback control experiments). For population control, the readouts of all simulated cells were averaged and fed into a common controller, while single-cell control was simulated by creating an integral controller for each cell trace. To simulate the 2 min delay between measurement acquisition and light input update present in the actual experiments, we added a delay to the closed-loop simulations. The controller output u(t-2) was applied at time t.
All parameters used in simulations are found in Table S4, and were obtained through manual fitting of the transcription metrics obtained experimentally.
Mechanistic gene expression model
The model introduced in Figures 6C and 6D was simulated with rates kr = 40 and koff = 1.08 min-1, while kon was varied over a range of values. Each simulation was run for a duration of 90 min (model time), the same duration as the experimental data (Figure 2A). The simulation results were processed to extract the number of nascent RNAs present in each cell trace at 2 min intervals. These simulated cell traces were then analyzed in the same way as the experimental data in order to extract the burst metrics of each simulated cell.
Stochastic simulations
All simulations were performed with MATLAB (MathWorks), using the Random Time Change (RTC) algorithm (Rathinam et al., 2010).
Description of control algorithms
To regulate the number of nascent RNAs to a desired constant reference value, we used integral feedback controllers (Franklin et al., 2015) both for single-cell and population control. In integral control, the input applied to the controlled system is proportional to the integral of the output error. In our experiments, the controller output (applied blue light intensity) is updated once a new output measurement becomes available, and is held constant between measurement times.
More specifically, given the system output at measurement time , , and the desired output reference value , the error is formed and the controller output, is defined as , where denotes the controller gain. By adjusting this parameter, the controller can be tuned to respond more or less aggressively to output deviations from the desired reference. In our experiments, the controller gain was chosen through manual tuning and kept the same for the two control strategies.
Due to the fact that negative inputs have no physical meaning and the DMD projector output has an upper power limit, the applied input to the system at time , is given by
where 1 corresponds to the maximum (scaled) light intensity that the DMD projector can provide.
In the case of single-cell control, and correspond to the output and applied input of a single cell respectively, since each cell is controlled by a separate integral controller. For population control, the individual cell outputs over the cell population are pooled together and averaged. The computed mean is then fed to a single integral controller which computes one common input for all cells.
It is a well-known fact in automatic control theory that in a stable deterministic feedback loop containing an integral controller, the steady-state system output will be equal to the reference value (Franklin et al., 2015). This can be easily seen by the fact that will stop changing only when the error converges to zero. This analysis is applicable in the case of population control, where the population mean is the controlled output and follows deterministic dynamics.
When the controlled system is stochastic (as in the case of single-cell feedback), provided the closed-loop system converges to a unique stationary distribution (the equivalent of a unique stable equilibrium point for deterministic systems) then the output mean should again be equal to the reference. In the opposite case, the average error would be non-zero and the controller output would not be stationary.
Acknowledgments
The authors would like to thank Fabian Rudolf (ETH Zurich) for the cell tracking code and plasmids, and Erica Montani (ETH Zurich) for assistance with the FRAP experiment. We would also like to thank Michael Lin (Stanford University), Robert H. Singer (Albert Einstein College of Medicine), Daniel Zenklusen (Université de Montréal), Kevin Gardner (City University of New York), and Theodorus W.J. Gadella, Jr. (University of Amsterdam) for providing plasmids. This project has received funding from the European Research Council (ERC) under the European Union’s Horizon 2020 research and innovation programme grant agreement no. 743269 (CyberGenetics project), and from the European Union’s Horizon 2020 research and innovation programme under grant agreement no. 766840 (COSY-BIO project).
Author Contributions
M.K., A.M.-A., and D.B. conceived the project. M.R. developed the automation and control software, built the experimental platform, and performed the experiments. M.R. and D.B. analyzed the data. D.B. designed, built, and initially characterized plasmids and strains and performed smFISH and FRAP experiments. G.W.S. designed and produced the microfluidic chip. M.K. and A.M.-A. supervised the project. M.R., D.B., M.K., and A.M.-A. wrote the manuscript.
Declaration of Interests
The authors declare no competing financial interests.
Published: May 17, 2018
Footnotes
Supplemental Information includes six figures, five tables, and one video and can be found with this article online at https://doi.org/10.1016/j.molcel.2018.04.012.
Contributor Information
Andreas Milias-Argeitis, Email: a.milias.argeitis@rug.nl.
Mustafa Khammash, Email: mustafa.khammash@bsse.ethz.ch.
Supporting Citations
The following reference appears in the Supplemental Information: Hocine et al. (2013).
Supplemental Information
Time-course of yeast cells densely growing in a monolayer illuminated through the DMD projector (blue) in the pattern of a number “10.” Active transcription start sites are marked with a red spot. Images taken every 2 min.
References
- Aymoz D., Wosika V., Durandau E., Pelet S. Real-time quantification of protein expression at the single-cell level via dynamic protein synthesis translocation reporters. Nat. Commun. 2016;7:11304. doi: 10.1038/ncomms11304. [DOI] [PMC free article] [PubMed] [Google Scholar]
- Bajar B.T., Wang E.S., Lam A.J., Kim B.B., Jacobs C.L., Howe E.S., Davidson M.W., Lin M.Z., Chu J. Improving brightness and photostability of green and red fluorescent proteins for live cell imaging and FRET reporting. Sci. Rep. 2016;6:20889. doi: 10.1038/srep20889. [DOI] [PMC free article] [PubMed] [Google Scholar]
- Becskei A., Serrano L. Engineering stability in gene networks by autoregulation. Nature. 2000;405:590–593. doi: 10.1038/35014651. [DOI] [PubMed] [Google Scholar]
- Benzinger D., Khammash M. Tuning gene expression variability and multi-gene regulation by dynamic transcription factor control. bioRxiv. 2018 [Google Scholar]
- Bertrand E., Chartrand P., Schaefer M., Shenoy S.M., Singer R.H., Long R.M. Localization of ASH1 mRNA particles in living yeast. Mol. Cell. 1998;2:437–445. doi: 10.1016/s1097-2765(00)80143-4. [DOI] [PubMed] [Google Scholar]
- Bindels D.S., Haarbosch L., van Weeren L., Postma M., Wiese K.E., Mastop M., Aumonier S., Gotthard G., Royant A., Hink M.A., Gadella T.W., Jr. mScarlet: a bright monomeric red fluorescent protein for cellular imaging. Nat. Methods. 2017;14:53–56. doi: 10.1038/nmeth.4074. [DOI] [PubMed] [Google Scholar]
- Cai L., Dalal C.K., Elowitz M.B. Frequency-modulated nuclear localization bursts coordinate gene regulation. Nature. 2008;455:485–490. doi: 10.1038/nature07292. [DOI] [PMC free article] [PubMed] [Google Scholar]
- Chait R., Ruess J., Bergmiller T., Tkačik G., Guet C.C. Shaping bacterial population behavior through computer-interfaced control of individual cells. Nat. Commun. 2017;8:1535. doi: 10.1038/s41467-017-01683-1. [DOI] [PMC free article] [PubMed] [Google Scholar]
- Chubb J.R., Trcek T., Shenoy S.M., Singer R.H. Transcriptional pulsing of a developmental gene. Curr. Biol. 2006;16:1018–1025. doi: 10.1016/j.cub.2006.03.092. [DOI] [PMC free article] [PubMed] [Google Scholar]
- Corrigan A.M., Tunnacliffe E., Cannon D., Chubb J.R. A continuum model of transcriptional bursting. eLife. 2016;5 doi: 10.7554/eLife.13051. [DOI] [PMC free article] [PubMed] [Google Scholar]
- Dar R.D., Razooky B.S., Singh A., Trimeloni T.V., McCollum J.M., Cox C.D., Simpson M.L., Weinberger L.S. Transcriptional burst frequency and burst size are equally modulated across the human genome. Proc. Natl. Acad. Sci. USA. 2012;109:17454–17459. doi: 10.1073/pnas.1213530109. [DOI] [PMC free article] [PubMed] [Google Scholar]
- Dimopoulos S., Mayer C.E., Rudolf F., Stelling J. Accurate cell segmentation in microscopy images using membrane patterns. Bioinformatics. 2014;30:2644–2651. doi: 10.1093/bioinformatics/btu302. [DOI] [PubMed] [Google Scholar]
- Ferrell J.E., Jr. Perfect and near-perfect adaptation in cell signaling. Cell Syst. 2016;2:62–67. doi: 10.1016/j.cels.2016.02.006. [DOI] [PubMed] [Google Scholar]
- Franklin G.F., Powell J., Emami-Naeini A. Pearson; 2015. Feedback Control of Dynamic Systems, Global Edition. [Google Scholar]
- Frey O., Rudolf F., Schmidt G.W., Hierlemann A. Versatile, simple-to-use microfluidic cell-culturing chip for long-term, high-resolution, time-lapse imaging. Anal. Chem. 2015;87:4144–4151. doi: 10.1021/ac504611t. [DOI] [PMC free article] [PubMed] [Google Scholar]
- Gietz R.D., Woods R.A. Transformation of yeast by lithium acetate/single-stranded carrier DNA/polyethylene glycol method. Methods Enzymol. 2002;350:87–96. doi: 10.1016/s0076-6879(02)50957-5. [DOI] [PubMed] [Google Scholar]
- Gnügge R., Liphardt T., Rudolf F. A shuttle vector series for precise genetic engineering of Saccharomyces cerevisiae. Yeast. 2016;33:83–98. doi: 10.1002/yea.3144. [DOI] [PubMed] [Google Scholar]
- Goldstein A.L., Pan X., McCusker J.H. Heterologous URA3MX cassettes for gene replacement in Saccharomyces cerevisiae. Yeast. 1999;15:507–511. doi: 10.1002/(SICI)1097-0061(199904)15:6<507::AID-YEA369>3.0.CO;2-P. [DOI] [PubMed] [Google Scholar]
- Heinrich S., Sidler C.L., Azzalin C.M., Weis K. Stem-loop RNA labeling can affect nuclear and cytoplasmic mRNA processing. RNA. 2017;23:134–141. doi: 10.1261/rna.057786.116. [DOI] [PMC free article] [PubMed] [Google Scholar]
- Hocine S., Raymond P., Zenklusen D., Chao J.A., Singer R.H. Single-molecule analysis of gene expression using two-color RNA labeling in live yeast. Nat. Methods. 2013;10:119–121. doi: 10.1038/nmeth.2305. [DOI] [PMC free article] [PubMed] [Google Scholar]
- Janicki S.M., Tsukamoto T., Salghetti S.E., Tansey W.P., Sachidanandam R., Prasanth K.V., Ried T., Shav-Tal Y., Bertrand E., Singer R.H., Spector D.L. From silencing to gene expression: real-time analysis in single cells. Cell. 2004;116:683–698. doi: 10.1016/s0092-8674(04)00171-0. [DOI] [PMC free article] [PubMed] [Google Scholar]
- Kepler T.B., Elston T.C. Stochasticity in transcriptional regulation: origins, consequences, and mathematical representations. Biophys. J. 2001;81:3116–3136. doi: 10.1016/S0006-3495(01)75949-8. [DOI] [PMC free article] [PubMed] [Google Scholar]
- Keung A.J., Bashor C.J., Kiriakov S., Collins J.J., Khalil A.S. Using targeted chromatin regulators to engineer combinatorial and spatial transcriptional regulation. Cell. 2014;158:110–120. doi: 10.1016/j.cell.2014.04.047. [DOI] [PMC free article] [PubMed] [Google Scholar]
- Khalil A.S., Lu T.K., Bashor C.J., Ramirez C.L., Pyenson N.C., Joung J.K., Collins J.J. A synthetic biology framework for programming eukaryotic transcription functions. Cell. 2012;150:647–658. doi: 10.1016/j.cell.2012.05.045. [DOI] [PMC free article] [PubMed] [Google Scholar]
- Lang M., Rudolf F., Stelling J. Use of YouScope to implement systematic microscopy protocols. Curr. Protoc. Mol. Biol. 2012;Chapter 14:1–23. doi: 10.1002/0471142727.mb1421s98. [DOI] [PubMed] [Google Scholar]
- Larson D.R., Zenklusen D., Wu B., Chao J.A., Singer R.H. Real-time observation of transcription initiation and elongation on an endogenous yeast gene. Science. 2011;332:475–478. doi: 10.1126/science.1202142. [DOI] [PMC free article] [PubMed] [Google Scholar]
- Larson D.R., Fritzsch C., Sun L., Meng X., Lawrence D.S., Singer R.H. Direct observation of frequency modulated transcription in single cells using light activation. eLife. 2013;2:e00750. doi: 10.7554/eLife.00750. [DOI] [PMC free article] [PubMed] [Google Scholar]
- Lenstra T.L., Coulon A., Chow C.C., Larson D.R. Single-molecule imaging reveals a switch between spurious and functional ncRNA transcription. Mol. Cell. 2015;60:597–610. doi: 10.1016/j.molcel.2015.09.028. [DOI] [PMC free article] [PubMed] [Google Scholar]
- Mao C., Brown C.R., Falkovskaia E., Dong S., Hrabeta-Robinson E., Wenger L., Boeger H. Quantitative analysis of the transcription control mechanism. Mol. Syst. Biol. 2010;6:431. doi: 10.1038/msb.2010.83. [DOI] [PMC free article] [PubMed] [Google Scholar]
- McIsaac R.S., Silverman S.J., Parsons L., Xu P., Briehof R., McClean M.N., Botstein D. Visualization and analysis of mRNA molecules using fluorescence in situ hybridization in Saccharomyces cerevisiae. J. Vis. Exp. 2013;(76):e50382. doi: 10.3791/50382. [DOI] [PMC free article] [PubMed] [Google Scholar]
- Milias-Argeitis A., Rullan M., Aoki S.K., Buchmann P., Khammash M. Automated optogenetic feedback control for precise and robust regulation of gene expression and cell growth. Nat. Commun. 2016;7:12546. doi: 10.1038/ncomms12546. [DOI] [PMC free article] [PubMed] [Google Scholar]
- Miller J.A., Widom J. Collaborative competition mechanism for gene activation in vivo. Mol. Cell. Biol. 2003;23:1623–1632. doi: 10.1128/MCB.23.5.1623-1632.2003. [DOI] [PMC free article] [PubMed] [Google Scholar]
- Molina N., Suter D.M., Cannavo R., Zoller B., Gotic I., Naef F. Stimulus-induced modulation of transcriptional bursting in a single mammalian gene. Proc. Natl. Acad. Sci. USA. 2013;110:20563–20568. doi: 10.1073/pnas.1312310110. [DOI] [PMC free article] [PubMed] [Google Scholar]
- Motta-Mena L.B., Reade A., Mallory M.J., Glantz S., Weiner O.D., Lynch K.W., Gardner K.H. An optogenetic gene expression system with rapid activation and deactivation kinetics. Nat. Chem. Biol. 2014;10:196–202. doi: 10.1038/nchembio.1430. [DOI] [PMC free article] [PubMed] [Google Scholar]
- Müller K., Naumann S., Weber W., Zurbriggen M.D. Optogenetics for gene expression in mammalian cells. Biol. Chem. 2015;396:145–152. doi: 10.1515/hsz-2014-0199. [DOI] [PubMed] [Google Scholar]
- Nash A.I., McNulty R., Shillito M.E., Swartz T.E., Bogomolni R.A., Luecke H., Gardner K.H. Structural basis of photosensitivity in a bacterial light-oxygen-voltage/helix-turn-helix (LOV-HTH) DNA-binding protein. Proc. Natl. Acad. Sci. USA. 2011;108:9449–9454. doi: 10.1073/pnas.1100262108. [DOI] [PMC free article] [PubMed] [Google Scholar]
- Neely K.E., Hassan A.H., Wallberg A.E., Steger D.J., Cairns B.R., Wright A.P., Workman J.L. Activation domain-mediated targeting of the SWI/SNF complex to promoters stimulates transcription from nucleosome arrays. Mol. Cell. 1999;4:649–655. doi: 10.1016/s1097-2765(00)80216-6. [DOI] [PubMed] [Google Scholar]
- Neuert G., Munsky B., Tan R.Z., Teytelman L., Khammash M., van Oudenaarden A. Systematic identification of signal-activated stochastic gene regulation. Science. 2013;339:584–587. doi: 10.1126/science.1231456. [DOI] [PMC free article] [PubMed] [Google Scholar]
- Nicolas D., Phillips N.E., Naef F. What shapes eukaryotic transcriptional bursting? Mol. Biosyst. 2017;13:1280–1290. doi: 10.1039/c7mb00154a. [DOI] [PubMed] [Google Scholar]
- Ochiai H., Sugawara T., Sakuma T., Yamamoto T. Stochastic promoter activation affects Nanog expression variability in mouse embryonic stem cells. Sci. Rep. 2014;4:7125. doi: 10.1038/srep07125. [DOI] [PMC free article] [PubMed] [Google Scholar]
- Peccoud J., Ycart B. Markovian modeling of gene-product synthesis. Theor. Popul. Biol. 1995;48:222–234. [Google Scholar]
- Pedraza J.M., van Oudenaarden A. Noise propagation in gene networks. Science. 2005;307:1965–1969. doi: 10.1126/science.1109090. [DOI] [PubMed] [Google Scholar]
- Purvis J.E., Lahav G. Encoding and decoding cellular information through signaling dynamics. Cell. 2013;152:945–956. doi: 10.1016/j.cell.2013.02.005. [DOI] [PMC free article] [PubMed] [Google Scholar]
- Purvis J.E., Karhohs K.W., Mock C., Batchelor E., Loewer A., Lahav G. p53 dynamics control cell fate. Science. 2012;336:1440–1444. doi: 10.1126/science.1218351. [DOI] [PMC free article] [PubMed] [Google Scholar]
- Rademacher A., Erdel F., Trojanowski J., Schumacher S., Rippe K. Real-time observation of light-controlled transcription in living cells. J. Cell Sci. 2017;130:4213–4224. doi: 10.1242/jcs.205534. [DOI] [PubMed] [Google Scholar]
- Radman-Livaja M., Rando O.J. Nucleosome positioning: how is it established, and why does it matter? Dev. Biol. 2010;339:258–266. doi: 10.1016/j.ydbio.2009.06.012. [DOI] [PMC free article] [PubMed] [Google Scholar]
- Raj A., van Oudenaarden A. Nature, nurture, or chance: stochastic gene expression and its consequences. Cell. 2008;135:216–226. doi: 10.1016/j.cell.2008.09.050. [DOI] [PMC free article] [PubMed] [Google Scholar]
- Raj A., Peskin C.S., Tranchina D., Vargas D.Y., Tyagi S. Stochastic mRNA synthesis in mammalian cells. PLoS Biol. 2006;4:e309. doi: 10.1371/journal.pbio.0040309. [DOI] [PMC free article] [PubMed] [Google Scholar]
- Raj A., van den Bogaard P., Rifkin S.A., van Oudenaarden A., Tyagi S. Imaging individual mRNA molecules using multiple singly labeled probes. Nat. Methods. 2008;5:877–879. doi: 10.1038/nmeth.1253. [DOI] [PMC free article] [PubMed] [Google Scholar]
- Raser J.M., O’Shea E.K. Control of stochasticity in eukaryotic gene expression. Science. 2004;304:1811–1814. doi: 10.1126/science.1098641. [DOI] [PMC free article] [PubMed] [Google Scholar]
- Rathinam M., Sheppard P.W., Khammash M. Efficient computation of parameter sensitivities of discrete stochastic chemical reaction networks. J. Chem. Phys. 2010;132:034103. doi: 10.1063/1.3280166. [DOI] [PMC free article] [PubMed] [Google Scholar]
- Reade A., Motta-Mena L.B., Gardner K.H., Stainier D.Y., Weiner O.D., Woo S. TAEL: a zebrafish-optimized optogenetic gene expression system with fine spatial and temporal control. Development. 2017;144:345–355. doi: 10.1242/dev.139238. [DOI] [PMC free article] [PubMed] [Google Scholar]
- Ricicova M., Hamidi M., Quiring A., Niemistö A., Emberly E., Hansen C.L. Dissecting genealogy and cell cycle as sources of cell-to-cell variability in MAPK signaling using high-throughput lineage tracking. Proc. Natl. Acad. Sci. USA. 2013;110:11403–11408. doi: 10.1073/pnas.1215850110. [DOI] [PMC free article] [PubMed] [Google Scholar]
- Senecal A., Munsky B., Proux F., Ly N., Braye F.E., Zimmer C., Mueller F., Darzacq X. Transcription factors modulate c-Fos transcriptional bursts. Cell Rep. 2014;8:75–83. doi: 10.1016/j.celrep.2014.05.053. [DOI] [PMC free article] [PubMed] [Google Scholar]
- Suter D.M., Molina N., Gatfield D., Schneider K., Schibler U., Naef F. Mammalian genes are transcribed with widely different bursting kinetics. Science. 2011;332:472–474. doi: 10.1126/science.1198817. [DOI] [PubMed] [Google Scholar]
- Toettcher J.E., Voigt C.A., Weiner O.D., Lim W.A. The promise of optogenetics in cell biology: interrogating molecular circuits in space and time. Nat. Methods. 2011;8:35–38. doi: 10.1038/nmeth.f.326. [DOI] [PMC free article] [PubMed] [Google Scholar]
- Toettcher J.E., Weiner O.D., Lim W.A. Using optogenetics to interrogate the dynamic control of signal transmission by the Ras/Erk module. Cell. 2013;155:1422–1434. doi: 10.1016/j.cell.2013.11.004. [DOI] [PMC free article] [PubMed] [Google Scholar]
- Volfson D., Marciniak J., Blake W.J., Ostroff N., Tsimring L.S., Hasty J. Origins of extrinsic variability in eukaryotic gene expression. Nature. 2006;439:861–864. doi: 10.1038/nature04281. [DOI] [PubMed] [Google Scholar]
- Wilson M.Z., Ravindran P.T., Lim W.A., Toettcher J.E. Tracing information flow from Erk to target gene induction reveals mechanisms of dynamic and combinatorial control. Mol. Cell. 2017;67:757–769.e5. doi: 10.1016/j.molcel.2017.07.016. [DOI] [PMC free article] [PubMed] [Google Scholar]
- Yi T.M., Huang Y., Simon M.I., Doyle J. Robust perfect adaptation in bacterial chemotaxis through integral feedback control. Proc. Natl. Acad. Sci. USA. 2000;97:4649–4653. doi: 10.1073/pnas.97.9.4649. [DOI] [PMC free article] [PubMed] [Google Scholar]
- Zambrano S., Bianchi M.E., Agresti A., Molina N. Interplay between stochasticity and negative feedback leads to pulsed dynamics and distinct gene activity patterns. Phys. Rev. E Stat. Nonlin. Soft Matter Physiol. 2015;92:022711. doi: 10.1103/PhysRevE.92.022711. [DOI] [PubMed] [Google Scholar]
- Zenklusen D., Larson D.R., Singer R.H. Single-RNA counting reveals alternative modes of gene expression in yeast. Nat. Struct. Mol. Biol. 2008;15:1263–1271. doi: 10.1038/nsmb.1514. [DOI] [PMC free article] [PubMed] [Google Scholar]
- Zhu P., Fajardo O., Shum J., Zhang Schärer Y.-P., Friedrich R.W. High-resolution optical control of spatiotemporal neuronal activity patterns in zebrafish using a digital micromirror device. Nat. Protoc. 2012;7:1410–1425. doi: 10.1038/nprot.2012.072. [DOI] [PubMed] [Google Scholar]
- Zoltowski B.D., Motta-Mena L.B., Gardner K.H. Blue light-induced dimerization of a bacterial LOV-HTH DNA-binding protein. Biochemistry. 2013;52:6653–6661. doi: 10.1021/bi401040m. [DOI] [PMC free article] [PubMed] [Google Scholar]
Associated Data
This section collects any data citations, data availability statements, or supplementary materials included in this article.
Supplementary Materials
Time-course of yeast cells densely growing in a monolayer illuminated through the DMD projector (blue) in the pattern of a number “10.” Active transcription start sites are marked with a red spot. Images taken every 2 min.