

Summary
Genetic changes causing brain size expansion in human evolution have remained elusive. Notch signaling is essential for radial glia stem cell proliferation and is a determinant of neuronal number in the mammalian cortex. We find three paralogs of human-specific NOTCH2NL are highly expressed in radial glia. Functional analysis reveals different alleles of NOTCH2NL have varying potencies to enhance Notch signaling by interacting directly with NOTCH receptors. Consistent with a role in Notch signaling, NOTCH2NL ectopic expression delays differentiation of neuronal progenitors, while deletion accelerates differentiation into cortical neurons. Furthermore, NOTCH2NL genes provide the breakpoints in 1q21.1 distal deletion/duplication syndrome, where duplications are associated with macrocephaly and autism, and deletions with microcephaly and schizophrenia. Thus, the emergence of human-specific NOTCH2NL genes may have contributed to the rapid evolution of the larger human neocortex accompanied by loss of genomic stability at the 1q21.1 locus and resulting recurrent neurodevelopmental disorders.
ETOC
Human-specific Notch paralogs are expressed in radial glia, enhance Notch signaling and impact neuronal differentiation.
Introduction
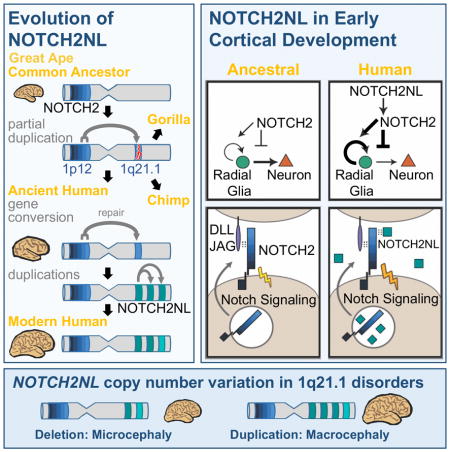
Human brains are characterized by a large neocortex that forms the substrate for the development of human-specific cognitive functions (Molnar et al., 2006), but evolutionary changes to our genome underlying this increase in size and complexity are poorly understood (Varki et al., 2008). Structural genomic variants account for 80% of human-specific base pairs (Cheng et al., 2005). Of particular interest are loci where segmental duplications have created entirely new human-specific gene paralogs associated with cortical development, such as SRGAP2C, ARHGAP11B and TBC1D3 (Reviewed in Dennis and Eichler, 2016). Human-specific duplicated genes are often located within segmental duplications that mediate recurrent rearrangements associated with human disease (Stankiewicz and Lupski, 2010; Popesco et al., 2006). One such region lies on human chromosome band 1q21, which was subject to a large pericentric inversion involving considerable gene loss and duplication during human evolution (Szamalek et al., 2006). The 1q21 locus contains a disproportionate number of human-specific genes (O’Bleness et al., 2012), and also contains the 1q21.1 distal deletion/duplication syndrome interval (Mefford et al., 2008; Brunetti-Pierri et al., 2008). De novo deletion of one copy frequently leads to brain size reduction (microcephaly) and duplication to brain size increase (macrocephaly), among other symptoms.
1q21.1 was incorrectly assembled in the human reference genome until the most recent version, GRCh38, (Steinberg et al., 2014). In the revised assembly this locus harbors three human-specific NOTCH2-derived genes we call NOTCH2NLA, NOTCH2NLB and NOTCH2NLC, which are highly expressed in human cortical progenitors but were never considered candidates for the 1q21.1 syndromes. Notch signaling is central to brain development, determining the timing and duration of neuronal progenitor proliferation and neuronal differentiation (Hansen et al., 2010). It is active in outer radial glia (oRG), a cell type hypothesized to generate the majority of primate cortical neurons and to contribute to human-specific cortical expansion (Lui, et al., 2011). Through functional, genomic, and evolutionary analysis, we find evidence that with the creation of the modern forms of NOTCH2NL genes in the last few million years after divergence from chimpanzees, humans gained new, secreted NOTCH-like proteins that can enhance Notch signaling and may prolong cortical neurogenesis by delaying differentiation of neural progenitors. Our data suggest the emergence of NOTCH2NL genes in humans may have contributed to the increase in size and complexity of the human neocortex at the expense of susceptibility to 1q21.1 distal duplication/deletion syndrome.
Results
NOTCH2NL is a novel NOTCH-like gene
NOTCH2NL was originally described in blood cells as a secreted peptide similar to the N-terminal portion of NOTCH2 (Duan et al., 2004). The gene annotated as NOTCH2NL on human genome assembly GRCh37 resides on human chromosome 1 in the 1q21.1 locus. Resequencing the pericentric region of chromosome 1 in a haploid human cell line finally resolved previously unmapped regions and led to a revised assembly of 1q21.1, which is incorporated in human genome assembly GRCh38 (Steinberg et al., 2014). This improved assembly reveals the presence of four paralogous NOTCH2NL-like genes (Figure 1A): NOTCH2NLA, NOTCH2NLB and NOTCH2NLC reside in the 1q21.1 locus, and a fourth quite different paralog, NOTCH2NLR (NOTCH2NL-Related) is located near NOTCH2 on the p-arm of chromosome 1. The greater than 100 kb genomic regions spanning each NOTCH2NL gene show >99.1% sequence identity to NOTCH2 (Figure S1A), suggesting that NOTCH2NL paralogs were created within the last few million years, in the same time frame as SRGAP2 and HYDIN2 (Dennis et al., 2012; Dougherty et al., 2017).
Figure 1. NOTCH2NL is located in a neurodevelopmental disease locus and exhibits variable gene and protein features.

(A) Location of NOTCH2NL genes (red) and additional genes derived from human segmental duplication (light blue). TAR syn=Thrombocytopenia Absent Radius syndrome. (B) Gene and protein features of NOTCH2 and NOTCH2NL. (C) De novo assembly result of NOTCH2NL loci for H9 human ESCs and relative allele expression from week 5 cortical organoids. *Not enough nucleotide differences present to distinguish between the two NOTCH2NLsh-2ntdel alleles. (D) Observed NOTCH2NL paratypes in 15 individuals. See also Fig. S1, S3, Table S1, S4.
NOTCH2NL results from a partial duplication of NOTCH2. The duplicated segment includes the NOTCH2 promoter and six N-terminal EGF-like domains from NOTCH2 exons 1–4, but excludes the transmembrane and cytoplasmic domains. NOTCH2NL genes contain a fifth exon derived from NOTCH2 intronic sequence that provides NOTCH2NL with 20 unique amino acids (Figure 1B, Figure S3C). In NOTCH2NLA, NOTCH2NLB and NOTCH2NLC, the 5th exon has a 4 bp deletion compared to the corresponding sequence in NOTCH2. Mutational analysis of NOTCH2NL cDNAs shows this 4 bp deletion is essential for NOTCH2NL protein expression (Figure S1B–E). NOTCH2NLR lacks the 4 bp deletion and contains many coding variants relative to NOTCH2 and the other NOTCH2NL paralogs, including a still segregating variant (Figure S3C). Analysis of human genome sequence data from the Simons diversity project (N=266) (Mallick et al., 2016) reveals 14% of the population lack NOTCH2NLR (Figure. S1G). Together these results suggest but do not confirm that NOTCH2NLR is a non-functional pseudogene.
Despite the high sequence homology of the NOTCH2NL-gene loci, each NOTCH2NL paralog has distinguishing features (Figure 1D). GRCh38-NOTCH2NLA has an ATG→ATA mutation in the NOTCH2 start codon, and lacks the N-terminal 39 amino acids encoding the NOTCH2 secretory pathway signal peptide. We term this allele “short NOTCH2NL” (NOTCH2NLSh). GRCh38-NOTCH2NLB retains the NOTCH2 signal peptide, while carrying a Thr→Ile substitution in a conserved fucosylation site. GRCh38-NOTCH2NLB is named “long NOTCH2NL with Thr→Ile substitution” (NOTCH2NLL,T197I). GRCh38-NOTCH2NLC contains a 2 bp deletion just downstream of the NOTCH2 start codon (NOTCH2NLSh-2ntdel), and like NOTCH2NLSh lacks the N-terminal signal peptide.
To explore the spectrum of NOTCH2NL alleles in the human population we developed an assembly-by-phasing approach (STAR Methods) and used it with deep sequencing to fully resolve the NOTCH2NL haplotypes in 8 normal individuals and 6 patient samples. (Figure S3C, Table S1). This analysis revealed recent, likely ongoing, ectopic gene conversion occurring between NOTCH2NLA and NOTCH2NLB that is so extensive that NOTCH2NLA and NOTCH2NLB essentially act as a single gene with 4 alleles (Figure S1F). This makes it nearly impossible to assign individual alleles to a specific locus.
Focusing on assembly of the H9 human embryonic stem cell (hESC) line, we identified three additional NOTCH2NL alleles (Figure 1C, Figure S1F): a short version with Thr→Ile (NOTCH2NLSh,T197I), a long version without Thr→Ile (NOTCH2NLL) and an additional long version with a SNP (rs140871032) creating a premature stop codon at position 113, as well as an Ala→Thr SNP (rs76765512) in EGF-like repeat 3 (NOTCH2NLL,R113*,A154T). The Ala→Thr SNP was also found in a short allele (NOTCH2NLSh,A154T) in NA12878 (Table S1). Conversely, the premature stop codon appears without the Ala→Thr SNP (NOTCH2NLL,R113*) in one patient genome.
RNA-seq analysis on H9 hESC-derived cortical organoids, confirmed that all the H9 NOTCH2NL alleles are expressed (Figure 1C). NOTCH2NLL,R113*,A154T represents only about 3.5% of the NOTCH2NL transcripts, possibly due to nonsense-mediated decay of the premature stop codon-containing transcript. The low level of expression and the truncated protein structure of R113* containing variants suggest they are non-functional.
Altogether, we identified 8 NOTCH2NL alleles producing distinct protein or protein abundance variants of the 3 NOTCH2NL genes in the 1q21 locus in 15 genomes we analyzed (Figure 1D, Figure S1I). From here on, we refer to these NOTCH2NL alleles as paratypes since their physical location can vary among paralogous locations and therefore they do not conform to standard haplotypes. A typical NOTCH2NL genotype consists of 6 NOTCH2NL paratypes (Figure 1C), rather than two haplotypes as for most genes. We expect more variants will be found when additional genomes are analyzed (Figure 1D, Table S1, S4).
Analysis of Singly-Unique Nucleotides (SUNs) in 2,531 low coverage genome sequencing data sets from the 1000 Genomes Project (Genomes Project et al., 2015) and 266 high coverage genomes from the Simons Diversity Project (Mallick et al., 2016, Nothaft, 2017) revealed the combined copy number of NOTCH2NLA- and NOTCH2NLB-like paratypes is remarkably stable. We found evidence for a combined copy number of 4 in all individuals after accounting for gene conversion. This suggests total dosage of NOTCH2NLA- and NOTCH2NLB-like paratypes may be important. In contrast, the NOTCH2NLC-like paratype, NOTCH2NLSh-2ntdel, has variable copy number, with the frequency of 0, 1 and 2 copies being 0.4%, 6% and 92% respectively in the Simons Diversity dataset, indicating it may not be essential.
Multiple rounds of gene duplication and gene conversion led to functional NOTCH2NL genes only in humans
To explore the evolutionary history of NOTCH2NL genes, we assessed the presence and structure of NOTCH2NL genes in other primates. Based on alignment of genomic DNA-reads matching the parental NOTCH2 locus, we established that NOTCH2NL emerged by a partial duplication of NOTCH2 prior to the last common ancestor (LCA) of human, chimpanzee and gorilla (Figure 2). Unlike human, both chimpanzee and gorilla have variable read depth over the region encompassing their NOTCH2NL-like sequences. This pattern suggests the existence of multiple versions of truncated NOTCH2NL-like genes in these species (Figure 2A). Consistent with this, we identified several different transcribed NOTCH2NL-like genes in chimpanzee. However, sequencing revealed that none of these genes encode NOTCH2-related proteins (Figure 2B, Figure S2). We found four chimpanzee NOTCH2NL-like pseudogenes which lack a 52 kb region including exon 2 (NOTCH2NL-like Δexon2), encoding a protein of 88 amino acids with no homology to human NOTCH2NL (Figure S2D, F). Four additional chimpanzee NOTCH2NL-like pseudogenes lack either exon 1 or exons 1–2, and are fused to various 3′ truncated genes with the following configurations: PDE4DIPexon1–27-NOTCH2NLexon2–5, TXNIPexon1-NOTCH2NLexon2–5 MAGI3exon1-NOTCH2NLexon3–5, and MAGI3exon1–14-NOTCH2NLexon3–5 (Figure 2B, S2A). Sequencing of transcripts derived from these NOTCH2NL-fusion pseudogenes established that the NOTCH2NL exons in all of them were out of frame with the upstream exons (Figure S2E). Finally, we do not detect NOTCH2NL in protein extracts from chimpanzee stem cell-derived cortical tissues under the same conditions where we detect human NOTCH2NL protein (Figure 2C). Overall, our analysis suggests chimpanzees lack a functional NOTCH2NL gene, but instead harbor a total of 8 NOTCH2NL pseudogenes.
Figure 2. Evolutionary analysis of NOTCH2NL-like genes reveals only human NOTCH2NL genes encode NOTCH-related proteins.

(A) Coverage of genome sequencing reads mapped to the NOTCH2 locus (B) Schematic of NOTCH2NL-containing genes. (C) NOTCH2/NOTCH2NL immunoblot of human (“H”) and chimpanzee (“C”) cortical organoids. ECD: extracellular domain FL: full length. (D) Evolutionary history of NOTCH2NL genes in the great ape lineage. (E) Endocranial volume of archaic human fossils versus time (Holloway, et al., 2004). See also Figure S2.
In gorilla, three NOTCH2NL-fusion pseudogenes were identified (Figure S2B) of which two were similar to NOTCH2NL-fusion pseudogenes found in chimpanzee: PDE4DIPexon1–27-NOTCH2NLexon2–5 and MAGI3exon1–14-NOTCH2NLexon3–5. Transcript support was obtained for BRD9-NOTCH2NL and PDE4DIPexon1–27-NOTCH2NLexon2–5 using RNA from gorilla iPSCs (Ramsay et al., 2017) (Figure S2C). The presence of two nearly identical fusion pseudogenes in gorilla and chimpanzee suggests that these were formed in the LCA of human, chimp and gorilla. However, neither are found in the human genome. Human NOTCH2NL genes are all in the vicinity of PDE4DIP, but human NOTCH2NL genes have a 5′ genomic structure highly similar to NOTCH2. This suggests a plausible evolutionary history of NOTCH2NL genes as follows (Figure 2D): Both the PDE4DIP-NOTCH2NL and MAGI3-NOTCH2NL fusion pseudogenes were present in the LCA of human, chimp, and gorilla. Then, only in the human lineage, the ancestral PDE4DIP-NOTCH2NL fusion gene was ‘revived’ by NOTCH2 through ectopic gene conversion. With the acquisition of exon 1 and the upstream promoter, a viable NOTCH2NL gene encoding a stable NOTCH2-related protein was created. Because no remnants of a MAGI3-NOTCH2NL fusion pseudogene are found in the human genome, it must have been lost, perhaps in the upheaval of the pericentric inversion on chromosome 1 and subsequent large-scale copy number changes (Szamalek et al., 2006). The revived human NOTCH2NL subsequently duplicated twice more to form three nearly identical NOTCH2NL genes in the 1q21.1 locus. Chimpanzee and gorilla had additional, species-specific duplications involving NOTCH2NL-related sequence, but none produced functional genes.
Based on comparative genome analysis of archaic humans (Lazaridis et al., 2014), Neanderthals (Prufer et al., 2017; Prufer et al., 2014) and Denisovans (Meyer et al., 2012), the number of substitutions between NOTCH2 and NOTCH2NL and the analysis in Figure 2A, we estimate the gene conversion event generating a functional NOTCH2NL happened between 4 and 3 MYA. This corresponds to a time just before or during the early stages of the expansion of the human neocortex (Holloway et al., 2004) (Figure 2E). Our proposed scenario of NOTCH2NL evolution involves multiple lineage-specific gene duplications, rearrangements, losses and ectopic gene conversion, consistent with what has been previously reported for this locus (Nuttle et al., 2013; O’Bleness et al., 2012). This propensity for repeated complex genomic alterations is characteristic of what have been called duplication hubs in the ape genomes (Bailey and Eichler, 2006). NOTCH2NL appears to be part of such a hub.
NOTCH2NL is expressed in Radial Glia neural stem cells during human cortical development
We examined NOTCH2NL expression in 3,466 single cells derived from human fetal brains ranging in age from 11 to 21.5 gestational weeks that were sampled from multiple regions of the dorsal and ventral telencephalon (Nowakowski, et al., 2017) (Figure 3). This data set contains a broad diversity of cell types including radial glia (RG) neural stem cells, intermediate progenitor cells (IPC), excitatory and inhibitory neurons, oligodendrocyte progenitors (OPC), astrocytes and microglia. The NOTCH2NL expression pattern closely resembles that of NOTCH2 and is highest in various RG populations, including oRG, as well as astrocytes and microglia (Figure 3, Figure S3).
Figure 3. Radial glia-specific expression of NOTCH2NL in human fetal brain samples.

Scatterplot of 3466 fetal brain cells after single cell RNA-Seq principal components analysis and t-stochastic neighbor embedding (tSNE) as described in Nowakowski, et al., 2017. Cells are colored by annotated cell type clusters (A), NOTCH2NL expression (B) and NOTCH2 expression (C). See also Figure S3.
We also estimated the relative expression of the H9 hESC paratypes of NOTCH2NL in undifferentiated H9 hESCs and week 5 hESC-derived cortical organoids. Illumina short-read RNA-seq data suggests that NOTCH2NLL has the highest expression, and the other NOTCH2NL paratypes are expressed at levels 20–60% of NOTCH2NLL (Figure S3B). As a more precise approach, we sequenced a full-length cDNA library enriched for NOTCH2NL transcripts by MinION nanopore. The results confirmed that NOTCH2NLL has the highest expression, accounting for 43.6% of the transcripts, and indicated that the other paratypes have expression levels between ~8% and 40% of NOTCH2NLL (Figure 1C).
Ectopic expression of NOTCH2NL delays mouse cortical neuron differentiation
To investigate the role of NOTCH2NL in RG and neuronal differentiation, we assessed the effects of ectopic NOTCH2NL expression in mouse cortical organoids. We generated a stable mouse ESC line ectopically expressing human NOTCH2NLSh,T197I, along with an empty vector (EV) control cell line, which were used to generate cortical organoids (Eiraku et al., 2008) (Figure 4A). NOTCH2NL expressing organoids did not show gross differences compared to the EV controls (Figure S4D–E). At day 6, a stage where most cells express the radial glial cell markers Pax6 and Sox2, samples were harvested for RNA-seq. 147 differentially expressed (DE) genes were found (p-adj<0.05, Figure S4A–B, Table S2). NOTCH2NL expressing organoids showed increased expression of genes involved in negative regulation of neuron differentiation, such as Foxg1, Id4, Fezf2, Sox3 and Six3 (Figure 4B). Id4 is particularly interesting as it is a downstream effector of Notch signaling that mediates the effect of NOTCH activation on neuronal progenitor fate decisions (Boareto et al., 2017). Several genes associated with neuronal differentiation were downregulated, including Cntn2, Nefl, Gap43, and Sox10 (Figure 4C, Figure S4C). These results suggest ectopic expression of NOTCH2NL in mouse organoids delays differentiation of neuronal progenitor cells.
Figure 4. Ectopic expression of NOTCH2NL delays neuronal differentiation.

(A) Overview of mouse cortical organoid differentiation protocol. Genes upregulated (B) or downregulated (C) in mouse organoids ectopically expressing NOTCH2NLSh,T197I compared to EV. Green asterisk; radial glia associated genes. Red asterisk; neuron differentiation genes. See also Figure S4 and Table S2.
Deletion of NOTCH2NL affects human cortical organoid development
To explore the functional role of NOTCH2NL in human cortical neurogenesis, we used CRISPR/Cas9 to delete NOTCH2NL genes in hESCs producing a clone with a homozygous deletion of both NOTCH2NLA and NOTCH2NLB and a heterozygous deletion of NOTCH2NLC (Figure S5B). NOTCH2 and NOTCH2NLR were unaffected. This clone is denoted H9NOTCH2NLΔ (Figure 5A–B). As a control, another clone was selected that went through the same CRISPR/Cas9 transfection and selection process, but for which we did not detect deletions in NOTCH2 or NOTCH2NL loci (denoted H9*). Cortical tissues were generated from these clones by directed differentiation (Eiraku et al., 2008; Figure 5C–D). hESC-derived cortical organoids resemble early developmental stages of primate cortex development (Figure 5E–I), displaying neural rosette structures of radially organized RG cells giving rise to cortical neurons (Figure 5E–F). RNA-seq analysis of cortical organoids isolated at weekly time points reveals H9 hESC-derived cortical organoids display efficient and selective induction of dorsal forebrain marker genes, highly resembling the expression pattern during early stages (8–9 post conception weeks) of human dorsal forebrain development in vivo (Figure S5A, Table S2). Throughout the experiment, H9NOTCH2NLΔ organoids were smaller in size compared to control (H9*) organoids (Figure S5C–D). To analyze the effect of NOTCH2NL deletion on gene expression, we performed RNA-seq analysis on cortical organoids isolated at week 4 (w4) and discovered DE genes between H9NOTCH2NLΔ and H9*. Gene expression of the top 250 up- and down-regulated DE genes was correlated to previously generated RNA-seq profiles of H9 w3, w4 and w5 cortical organoids. This analysis revealed that differentially expressed genes in w4 H9* correlate best with w4 H9 cortical organoids. Strikingly, w4 H9NOTCH2NLΔ showed a better correlation with w5 H9 cortical organoids (Figure 5J). This indicates that w4 H9NOTCH2NLΔ organoids prematurely display characteristics of w5 organoids and are advanced in their development compared to H9* organoids. GO-term enrichment analysis for the 212 genes DE genes in H9NOTCH2NLΔ that correlate better with w5 than w4 H9 organoids (Figure 5K) showed enrichment for genes involved in neuron differentiation, including key regulators of neuron differentiation such as the cortical layer V marker BCL11B (CTIP2), DLX1, SEMA3A, UNC5D and FGFR2. Immunofluorescent staining of multiple week 4 organoids supported these findings: W4 H9NOTCH2NLΔ organoids display similar capacities to form SOX2-positive neural rosettes as H9* (Figure S5E–G). However, there was an increase in CTIP2 protein levels in w4 H9NOTCH2NLΔ organoids compared to w4 H9* organoids (Figure S5H–J), similar to the w4-w5 transition in previously analyzed H9 organoids (Figure 5H–I). This further supports that NOTCH2NL has a role in delaying differentiation of neuronal progenitors in human cortical organoids.
Figure 5. Cortical organoids from hESCs lacking NOTCH2NL show premature neuronal maturation.

(A,B) Schematic of NOTCH2NL alleles (A) and UCSC genome browser view of NOTCH2 and NOTCH2NL loci showing normalized genome sequencing coverage (B) in control (H9*) and NOTCH2NL mutant (H9NOTCH2NLΔ) cell lines. Cortical organoid protocol schematic (C) with bright field images (D) and cell types generated (E). (F–I) Immunofluorescence staining of cortical organoids with markers of radial glia (PAX6, BLBP), intermediate progenitors (TBR2) and layer V cortical neurons (CTIP2). Scale bar=50 μm. (J) Spearman’s rank correlation using the top 250 upregulated and downregulated genes (H9NOTCH2NLΔ / H9*), and data from previously generated W3, W4 and W5 H9 organoids. (K) Heatmap showing expression for a selection of genes in the significantly enriched GO cluster ‘neuron differentiation’. See also Figure S5 and Table S2.
NOTCH2NL interacts with NOTCH receptors and enhances Notch-signaling
We next tested whether NOTCH2NL can influence Notch signaling. The six N-terminal EGF-like domains encoded in NOTCH2NL, also present in NOTCH2 receptors, do not have a clearly described function in Notch signaling. Yet they are conserved from Drosophila to human, indicating an important functional role. There is evidence that N-terminal EGF-like domains are involved in dimerization of NOTCH receptors, and that receptor dimerization modulates NOTCH activity (Duering et al., 2011; Nichols et al., 2007). For example, in a hereditary stroke disorder called CADASIL, mutations in the five N-terminal EGF-like domains of NOTCH3 cause aberrant aggregation and dysfunction of NOTCH3 receptors (Karlstrom et al., 2002).
Consistent with a role of the N-terminal EGF-like domains in dimerization of NOTCH receptors, we were able to co-immunoprecipitate NOTCH2NL with NOTCH2 and vice versa, suggesting NOTCH2NL and NOTCH2 can physically interact (Figure 6A). Under these co-IP conditions, we did not find detectable interactions of NOTCH2NL with EGFR and PDGFRB, other EGF-like domain containing proteins. (Figure S6A–B).
Figure 6. NOTCH2NL paratypes interact with NOTCH receptors and enhance Notch signaling.

(A) Co-immunoprecipitation of NOTCH2 and NOTCH2NL analyzed by immunoblot. IP=Immunoprecipitation, N2NL=NOTCH2NL (B,C) Co-transfection of NOTCH2-GAL4 and NOTCH2NL in the pGL3-UAS reporter assay in co-culture with U2OS cells (B) or U2OS-JAG2 cells (C), n = 24 in 4 experiments. (D) Immunoblot showing immunoprecipitated NOTCH2NL in the medium of mouse ESCs ectopically expressing NOTCH2NL. (E) Effect of NOTCH2NL-conditioned medium in NOTCH reporter assay, n = 7 in 2 experiments. One-way anova with Tukey’s HSD (* p<10−4). (F–G) NOTCH reporter assay using the NOTCH1 receptor in conjunction with NOTCH2NL. (H–K) Assessment of common NOTCH2NL variants in reporter assay. (H–I) n = 12 in 2 experiments. (J–K) n = 6 in 1 experiment, t-test with Holm-Bonferroni correction (* p<0.05, ** p<10−3), error bars indicate SD. Data is analyzed using Two-way anova with Tukey’s HSD (* p<10−4, ** p<10−8, *** p<10−12). Error bars indicate SEM, unless otherwise specified. See also Figure S6.
To assess the influence of NOTCH2NL on NOTCH2 receptor activation, a luciferase reporter assay was used in which the intracellular DNA binding domain (NOTCH2-ICD) was replaced with a GAL4 domain (NOTCH2-GAL4) and coupled with a pGL3-UAS luciferase reporter. This experimental setup allows for precise measurements of NOTCH2 activation, without secondary effects from other NOTCH receptors or other interacting pathways (Habets et al., 2015; Groot et al., 2014). Co-transfection of NOTCH2NLSh or NOTCH2NLL,T197I with NOTCH2-GAL4 in U2OS cells increased pGL3-UAS reporter activity by 24% and 63% respectively (Figure 6B), indicating both short and long forms of NOTCH2NL can enhance NOTCH2 activation. Next, we co-cultured U2OS cells transfected with NOTCH2-GAL4 and either EV, NOTCH2NLSh or NOTCH2NLL,T197I on top of a layer of cells expressing the canonical NOTCH ligand Jagged 2 (JAG2) (U2OS-JAG2) or control (U2OS) cells. Under these ligand-mediated conditions where the baseline NOTCH2 activation was ~10 fold higher, NOTCH2NLsh and NOTCH2NLL,T197I still increased NOTCH2 activation by 23% and 21% respectively. This demonstrates that even under high-signaling conditions NOTCH2NL can enhance Notch signaling (Figure 6C).
NOTCH2NL is secreted by cells that express it (Duan et al., 2004) (Figure 6D). Conditioned medium from cells transfected with EV, NOTCH2NLSh or NOTCH2NLL,T197I was added for 24 hours to cells transfected with only NOTCH2-GAL4 and the luciferase reporter. Both NOTCH2NLSh- and NOTCH2NLL,T197I-conditioned medium increased reporter activity by 24% and 22% respectively (Figure 6E). This indicates that secreted NOTCH2NLsh and NOTCH2NLL,T197I can enhance NOTCH2 activation, despite their different N-terminal structures (Figure 1C) and suggests NOTCH2NLSh is secreted by an unconventional pathway (Rabouille, 2017). In the co-transfection experiments NOTCH2NLL,T197I was clearly more potent than NOTCH2NLL,T197I-conditioned medium, whereas NOTCH2NLsh had similar potency in both settings (Figure 6B). This suggests NOTCH2NLL,T197I can enhance Notch signaling through both intracellular and extracellular mechanisms whereas NOTCH2NLsh acts primarily through extracellular mechanisms in these assays.
We found that the ability of NOTCH2NL to enhance NOTCH activation is not limited to NOTCH2. NOTCH2NLSh and NOTCH2NLL,T197I were able to activate NOTCH1-GAL4 and NOTCH3-GAL4 constructs alone or under ligand-stimulated conditions, at similar levels to NOTCH2-GAL4 (Figure 6F–G, Figure S6C). We also found that NOTCH2NLSh and NOTCH2NLL,T197I enhance NOTCH2 activity when stimulated by other NOTCH ligands, DLL1 (Figure S6D) and DLL4 (Figure S6E). Thus, the potency of NOTCH2NL to enhance NOTCH receptor activation is not restricted to specific NOTCH paralogs or NOTCH-ligands.
Our paratype analysis revealed that both NOTCH2NLSh and NOTCH2NLL exist as paratypes with and without a T197I substitution (Figure 1C). This substitution disrupts a conserved fucosylation site. Interestingly, the single amino acid changes had subtle but significant influences on NOTCH2 activation. NOTCH2NLSh and NOTCH2NLSh,T197I performed similar under baseline conditions (29% and 31% increase, respectively, Figure 6H). However, with JAG2 co-culture, NOTCH2NLSh,T197I was more potent than NOTCH2NLSh (53% and 25% increase respectively, Figure 6I). Under baseline conditions, NOTCH2NLL,T197I was a more potent activator than NOTCH2NLL (63% and 21% increase, respectively, Figure 6J) while under ligand stimulated conditions NOTCH2NLL,T197I had less effect than NOTCH2NLL (17% and 38% increase, respectively, Figure 6K). These data are striking in that they show single amino acid changes between NOTCH2NL paratypes which segregate in the human population have subtle but significant differences in their potency to enhance NOTCH2 activation.
Deletions and duplications of NOTCH2NL genes are associated with neurodevelopmental phenotypes
The 1q21.1 locus has been associated with a developmental disorder called 1q21.1 distal deletion/duplication syndrome (Mefford et al., 2008; Rosenfeld et al., 2012) (Figure S7). Supporting the high recurrence frequency of the event, 18–50% of distal duplications and deletions are de novo (Haldeman-Englert and Jewett, 1993). Not all individuals are symptomatic. The carrier frequency of the deletion in the European general population has been estimated at 0.03% and the duplication at 0.05% (Mace et al., 2017).
When present, common neurological symptoms include microcephaly/macrocephaly (Mefford et al., 2008; Rosenfeld et al., 2012), schizophrenia (International Schizophrenia Consortium, 2008; Mace et al., 2017;) and autism (Bernier et al., 2016). In patients ascertained as part of the Simons Variation in Individuals (VIP) autism study, 1q21.1 distal duplication probands exhibited ADHD (29%), behavior disorder (18%), autism spectrum disorder (41%), developmental coordination disorder (23%), intellectual disability (29%), while deletion probands exhibited these symptoms at lower frequencies, but with a relatively high percentage (26%) exhibiting anxiety and mood disorders (Bernier et al., 2016).
NOTCH2NL was never considered a candidate for the 1q21.1 distal syndrome, because in the GRCh37 assembly, which was used for the studies that mapped 1q21.1 copy number variations (CNVs), NOTCH2NL was incorrectly positioned. We reanalyzed CNV microarray data derived from 11 patients previously characterized with 1q21.1 CNV-associated microcephaly or macrocephaly by remapping to GRCh38. The results suggest that NOTCH2NLA and NOTCH2NLB are located inside the 1q21.1 distal deletion/duplication locus of these patients (Figure S7). All nine microcephaly cases were consistent with NOTCH2NLA and/or NOTCH2NLB deletion and both macrocephaly cases were consistent with NOTCH2NLA and/or NOTCH2NLB duplication. In at least one out of nine microcephaly patients, the HYDIN2 locus exhibits a normal copy number, consistent with previous findings (Dougherty et al., 2017).
The sparsity of unique probes in the highly repetitive 1q21.1 region precludes a precise breakpoint analysis of these older data. To more accurately map the CNV breakpoints in 1q21.1 patients, we obtained primary fibroblasts from six autism patients in the Simons VIP project (Bernier et al., 2016); one patient with a 1q21.1 distal duplication and five with distal deletions (Figure 7, Table S3). Deep sequencing coverage analysis of array-enriched 10x Genomics Chromium data demonstrates that all of the Simons 1q21.1 patients have deletion/duplication breakpoints within or close to the genomic coordinates containing NOTCH2NLA and NOTCH2NLB giving a deleted/duplicated region of ~2.4 megabases (Figure 7A).
Figure 7. Patients with 1q21.1 Distal Deletion/Duplication Syndrome show breakpoints and CNV in NOTCH2NLA and NOTCH2NLB.

(A) UCSC Genome Browser screenshot from GRCh38. The duplication depth track indicates duplicated genome sequences as colored bars: white (single copy, N=1), orange (N=2–4), green (N=5), black (N>5). DNA sequence coverage tracks were generated in three ways. (1) Normalized read depth was calculated based on the entire region (red) or (2) by segmenting into 5 subregions: centromeric to NOTCH2NLA, NOTCH2NLA, between NOTCH2NLA and NOTCH2NLB, NOTCH2NLB, and telomeric to NOTCH2NLB (green) (STAR Methods). (3) Average coverage for breakpoints within NOTCH2NLA and NOTCH2NLB is shown as step function (blue). Where all models agree, the colors combine to black. (B) Schematic of the NOTCH2NL chromosomal configuration before and after a duplication or deletion event. See also Figure S7, Table S3–S4.
In 1q21.1 deletions we see normal copy number 2 for unique DNA outside of the locus and copy number 1 for unique DNA inside the locus. On the positions of NOTCH2NLA and NOTCH2NLB we observe a copy number of roughly 1.5. This is consistent with a scenario where a homology-driven deletion with breakpoints inside or adjacent to NOTCH2NA and NOTCH2NLB on one of the chromosomes leaves a single hybrid NOTCH2NLA/B gene (Figure 7B). Likewise, in the case of 1q21.1 duplication, a copy number of roughly 2.5 is observed, consistent with the presence of an additional hybrid NOTCH2NLA/B allele.
Assembly of NOTCH2NL paratypes in the sequencing data derived from these patients confirmed that indeed all of the deletion samples have three NOTCH2NLA/B alleles and the duplication sample has five. In all but one sample (SV788) we could determine all of the hybrid NOTCH2NLA/B paratypes (Figure 7, Table S1). Our data suggests that the typical 1q21.1 distal deletions/duplications are caused by non-allelic homologous recombination between the highly homologous NOTCH2NLA and NOTCH2NLB loci, and these events produce NOTCH2NL copy number change.
Discussion
NOTCH2NL joins ARHGAP11B (Florio et al., 2015) and BOLA2 (Nuttle et al., 2016) as a third example of the concomitant emergence of a potential adaptive evolutionary innovation and susceptibility to a recurrent genomic disorder from chromosomal instability mediated by human-specific duplication hubs. Such hubs are an important reservoir of new genes, carrying with them the potential to rapidly change the structure of the genome via non-allelic homologous recombination. Promising genes recently implicated in human brain evolution including SRGAP2C and TBC1D3 map to regions of human-specific structural variation (Dennis et al., 2016).
The peculiar evolutionary history of NOTCH2NL includes a series of genomic reorganization events resulting in three functional NOTCH-related genes only in humans. The most plausible scenario is that in a common ancestor of humans, Neanderthals and Denisovans, the ancestral PDE4DIP-NOTCH2NL pseudogene was repaired by ectopic gene conversion from NOTCH2. This event may have been crucial to human evolution, marking the birth of a novel human-specific NOTCH-related gene involved in differentiation of neuronal progenitor cells. NOTCH2NL likely functions to delay, yet eventually increase production of neurons from radial glia during fetal brain development. This may represent a new mechanism for neoteny in human neurodevelopment, along with that hypothesized for delayed and ultimately increased development of dendritic spines (Charrier et al., 2012).
NOTCH2NL is expressed in the germinal zones of the developing human cortex. Of particular interest is its expression in outer radial glia cells, thought to be involved in the evolutionary expansion of the human cortex (Hansen et al., 2010; Lui et al., 2011). It has remained elusive how the loosely organized oRG cells maintain their sustained capacity for self-renewal and proliferation. Recent work suggests that oRG cells directly contribute to a stem cell niche in the outer subventricular zone through increased expression of extracellular matrix proteins and growth signal factors (Pollen et al., 2015) and that Notch signaling is essential for oRG cell self-renewal (Hansen et al., 2010). Our findings that NOTCH2NL has an enhancing effect on NOTCH activation and delays differentiation of neuronal progenitors in organoids raises the possibility that NOTCH2NL may be one of the factors that evolved to support oRG cell self-renewal.
In modern humans, three NOTCH2NL genes exist as at least eight different “paratypes”. NOTCH2NL function in any particular genotype may depend on the combined expression pattern of structurally distinct NOTCH2NL paratypes. Our data suggest that the short forms of NOTCH2NL may act primarily in an extracellular context and are likely secreted by unconventional secretion pathways due to the lack of a signal peptide. In contrast, the long forms of NOTCH2NL contain the signal peptide required to enter the canonical secretory pathway, where they encounter NOTCH receptors and ligands in secretory vesicles before they are transported out of the cell. The different paratypes of NOTCH2NL have different potencies to enhance NOTCH activity, and are possibly the product of ongoing evolutionary gene-dosage optimization of NOTCH pathway modulation.
Despite increased structural variation in the region, the overall copy number of NOTCH2NLA and NOTCH2NLB is remarkably stable at a combined copy number 4 in all individuals analyzed for the current human population, suggesting selection. However, we find normal individuals with 1 (31/266) or even 2 (4/266) NOTCH2NL paratypes containing the premature stop encoding SNP (R113*). This, combined with the different effects of the NOTCH2NL protein variants, makes it difficult to argue for intensive ongoing selection for either overall dosage or for dosages of a specific combination of allele types. Many more individual genomes need to be fully resolved with regards to the organization of NOTCH2NL paratypes to disentangle the selective forces on NOTCH2NL genotypes, which for now remain mysterious. Is the physiological system robust to NOTCH2NL paratype differences, or has the optimal balance of NOTCH2NL alleles not been fixed in the population?
Based on our study, NOTCH2NLA and NOTCH2NLB should be considered new candidates for contributing to the neurological phenotypes of 1q21.1 distal deletion/duplication syndrome. However, they are not the only genes whose copy number is changed. Protein coding genes between NOTCH2NLA and NOTCH2NLB include HYDIN2, CHD1L, BCL9, GJA5, GJA8, PRKAB2, FMO5, ACP6, PPIAL4G, GPR89B, and DUF1220-domain containing NBPF paralogs. The progressive increase in number of DUF1220 domains in primate genomes was shown to correlate with the evolutionary expansion of the neocortex (Popesco et al., 2006). CHD1L is amplified in many solid tumors and promotes tumor growth (Cheng et al., 2013), suggesting a role in cell proliferation. HYDIN2 was a strong candidate, but recent work found 6 symptomatic patients with atypical breakpoints excluding HYDIN2, thus eliminating it as a likely driver (Dougherty et al., 2017). Mapping of these atypical patients indicates that the NOTCH2NLB locus was fully duplicated in all three atypical duplication cases (all macrocephalic), and fully deleted in all three atypical deletion cases (all microcephalic). Therefore, these cases are consistent with a contribution of NOTCH2NL to 1q21.1 deletion/duplication syndrome. There are scattered reports of patients with smaller duplications or deletions, including neither NOTCH2NLA nor NOTCH2NLB (Girirajan et al., 2013; Van Dijck et al., 2015). These studies have variously pointed to CHD1L, BCL9 or LINC00624 as causative genes. However, no mechanistic explanation for the possible association of these genes with neurodevelopmental changes has been established. Thus, multiple genes may contribute, but by providing the substrates for non-allelic homologous recombination, NOTCH2NL genes clearly enable the 1q21.1 distal deletion/duplication syndrome.
The strong directional association of 1q21.1 distal deletion/duplication syndrome with brain size, with duplications tending to cause macrocephaly and deletions microcephaly, is most intriguing from a NOTCH2NL evolutionary perspective: Duplications are associated with increased NOTCH2NL dosage, which in ex vivo experiments delays differentiation of neuronal progenitor cells allowing for a longer period of proliferation. In support of our findings, a companion study by Suzuki et al., 2018 provides evidence that ectopic NOTCH2NLL,T197I can increase the expansion of radial glia and long term neuronal output. Conversely, deletions decrease NOTCH2NL dosage, which in ex vivo experiments promotes premature differentiation of human neuronal progenitor cells into cortical neurons. While still preliminary, these data support a role of NOTCH2NL genes not only in the cognitive and brain size symptoms of 1q21.1 distal deletion/duplication syndrome, but also in the evolution of the human-specific larger brain size. A delay in cortical maturation, coupled with a net increase in the size of the neocortex, in large part from sustained activity of outer radial glia progenitor cells, is characteristic of human brain development. Humans may in fact be caught in an evolutionary compromise in which having multiple copies of NOTCH2NL provides a neurodevelopmental function we need, while at the same time predisposing our species to recurrent de novo non-allelic homologous recombination events that underlie a neurodevelopmental syndrome and contribute to our overall genetic load. Given the many different alleles (“paratypes”) of NOTCH2NL we observe segregating in the current human population, the tension caused by this compromise may still be a factor in our ongoing evolution.
STAR Methods
CONTACT FOR REAGENT AND RESOURCE SHARING
Further information and requests for resources and reagents should be directed to and will be fulfilled by the Lead Contact, David Haussler (haussler@soe.ucsc.edu).
EXPERIMENTAL MODEL AND SUBJECT DETAILS
Mouse cell culture
Mouse 46C ESCs (Ying et al., 2003) were obtained from Austin Smith and cultured, on 0.1% gelatin coated plates in GMEM (Thermofisher) with 10% HIFBS, 2 mM L-Glutamine, 1x NEAA, 1x NaPyr, 100 μM 2-mercaptoethanol and 1x P/S. ESGRO LIF (Millipore) was added fresh daily. Phenotypic analysis confirmed the presence of the Sox1-GFP reporter in this cell line.
Human cell culture
H9 embryonic stem cells
H9 human embryonic stem cells (female, WA09, WiCell), were cultured in W0 medium: DMEM/F12 (Thermofisher) with 20% KnockOut serum replacement (KOSR, Thermofisher), 2 mM L-glutamine (Thermofisher), 1x non-essential amino acids (NEAA, Thermofisher), 100 uM 2-mercaptoethanol (Thermofisher) and 1x P/S (Thermofisher). W0 was freshly supplemented daily with 8 ng/ml FGF2 (Sigma). H9 hESCs (WA09, WiCell Research Institute) were grown on MEF feeder layers, and manually passaged every 5–6 days when colonies reached approximately 2 mm in diameter. Mitomycin-C treated mouse embryonic fibroblasts (MEFs, GlobalStem) were seeded on 0.1% gelatin coated plates at a density of 35.000 cell/cm2. MEFs were cultured in DMEM, 4.5 g/l glucose + GlutaMax (Thermofisher, 10% heat inactivated fetal bovine serum (HIFBS, Thermofisher), 1x Penicillin/Streptomycin (P/S, Thermofisher) and 1x sodium pyruvate (NaPyr, Thermofisher). Karyoptype of our H9 culture was confirmed by Cell Line Genetics before initiating CRISPR experiments.
HEK293T cells
HEK293T (ATCC) cells were cultured according to standard protocol in DMEM, 4.5 g/l glucose + GlutaMax, 10% HIFBS and 1x P/S. For co-IP experiments, HEK293T cells were transfected in T25 flasks at 50% confluency.
NOTCH reporter cell line culture
U2OS cells and U2OS-JAG2 (Myc-tagged) cells (gifts of Arjan Groot and Marc Vooijs, MAASTRO lab, Maastricht University) were cultured in DMEM, 4.5 g/l glucose + GlutaMax, 10% HIFBS and 1x P/S. U2OS-JAG2 cells were supplemented with 2 μg/ml puromycin. OP9 cells and OP9-DLL1 cells (gifts of Bianca Blom, Academic Medical Center Amsterdam) were cultured in MEMα without nucleosides (Thermofisher), 2mM L-glutamine, 20% HIFBS, 100 μM 2-mercaptoethanol and 1x P/S. For routine culturing, cells were passaged every 3–4 days using 0.25% Trypsin (Thermofisher) + 0.5 mM EDTA (Sigma) in PBS at densities of 1/8 to 1/10 (U2OS), or 1/4 to 1/6 (OP9).
Great ape iPSC cultures
Chimpanzee iPSC line 8919 was generated by an integration-free episomal protocol by Applied StemCell (Menlo Park, CA) from S008919 primary fibroblasts (Yerkes Primates, Coriell) as described in Field, et. al., bioRxiv 232553; doi: https://doi.org/10.1101/232553. Normal 48/XX karyotype was confirmed through passage 32 by Cell Line Genetics or the Coriell Institute for Medical Research. A male Gorilla iPSC line, 00053-cA3, was a gift from Carol Marchetto and Fred Gage and is described in (Ramsay, et al., 2017). No validation of this line was done in our lab. Chimp and gorilla iPSCs were maintained under feeder free conditions on Matrigel (Corning) with mTeSR-1 (STEMCELL Techonolgies).
METHOD DETAILS
Mouse ESC stable cell line generation and organoid differentiation
To generate stable cell lines, 46C cells seeded on 100 mm plates and were transfected with 24 μg of linearized pCIG-NOTCH2NLSh,T197I-ires-GFP or empty pCIG-ires-GFP vector, using lipofectamine 2000 (Thermofisher). After 36 hours, GFP-positive cells were sorted using a FACSAria III (BD Biosciences) and recovered for further culturing. After 4 passages sorting was repeated and GFP-positive cells that had stably integrated the plasmid DNA in their genome were recovered for expansion and further culturing. We verified continued stable expression of NOTCH2NLSh,T197I-ires-GFP or empty vector (Supplemental Figure S4). Mouse 46C ESC organoid differentiation was performed as described previously (Eiraku et al., 2008). Briefly, cells were seeded in ultra low attachment U-shaped 96 wells plates (Corning) at 6000 cells per well. Cells were in mouse ESC medium without LIF and supplemented with 3 μM IWR-1-Endo (Sigma) and 10 μM SB431542 (Sigma). Medium was replaced every other day. At day 7, medium was changed to Neurobasal/N2 medium. Three pools of 16 organoids were isolated in TRIzol after 6 days of differentiation for EV and NOTCH2NLSh,T197 organoids.
Human cortical organoid differentiation
For organoid differentiation, medium was replaced with W0 medium + 1x NaPyr without FGF2 (Differentiation medium). Colonies of 2–3 mm in diameter were manually lifted using a cell lifter, and transferred to an ultra-low attachment 60mm dish (Corning). After 24 hours (day 0) embryoid bodies had formed, and 50% of medium was replaced with Differentiation medium supplemented with small molecule inhibitors and recombinant proteins to the following final concentrations: 500 ng/ml DKK1 (peprotech), 500 ng/ml NOGGIN (R&D Systems), 10 μM SB431542 (Sigma) and 1 μM Cyclopamine V. californicum (VWR). Medium was then replaced every other day until harvest. On day 8, organoids were transferred to ultra-low attachment U-shaped bottom 96 well plates (Corning). On day 18, medium was changed to Neurobasal/N2 medium: Neurobasal (Thermofisher), 1x N2 supplement (Thermofisher), 2 mM L-Glutamine, 1x P/S, supplemented with 1 μM Cyclopamine. From day 26 on, Cyclopamine was not supplemented anymore. Organoids were harvested in TRIzol at weekly time points. Total-transcriptome strand-specific RNA sequencing libraries were generated using dUTP for second strand synthesis on Ribo-zero (Epicentre) depleted total RNA. Double stranded cDNA was used for library preparation following the Low Throughput guidelines of the TruSeq DNA Sample Preparation kit (Illumina). For organoid formation of H9 hESC CRISPR/Cas9 NOTCH2NL knockout lines, an updated protocol was used: Differentiation medium was supplemented with 10 μM SB431542 (Sigma), 1 μM Dorsomorphin (Sigma), 3 μM IWR-1-Endo (Sigma) and 1 μM Cyclopamine (Sigma). Medium was then replaced every other day until harvest. On day 4, 60 mm dishes with organoids were placed on a hi/lo rocker in the incubator. From day 18 on, medium is replaced with Neurobasal/N2 medium. From day 24 on, Cyclopamine was not added anymore. Three pools of 5–10 organoids per condition were harvested in TRIzol at day 28 for RNA extraction.
RNA-Sequencing Analysis
Paired-end Illumina reads were trimmed from the 3′ end of read1 and read2 to 100×100 bp for human. Bowtie2 v2.2.1 (Langmead and Salzberg, 2012) was used with the “--very-sensitive” parameter to filter reads against the RepeatMasker library (http://www.repeatmasker.org) which were removed from further analysis. STAR v2.5.1b (Dobin et al., 2013) was used to map RNA-seq reads to the human reference genome GRCh37. STAR was run with the default parameters with the following exceptions: --outFilterMismatchNmax 999, --outFilterMismatchNoverLmax 0.04, --alignIntronMin 20, --alignIntronMax 1000000, and --alignMatesGapMax 1000000. STAR alignments were converted to genomic position coverage with the bedtools command genomeCoverageBed –split (Quinlan and Hall, 2010). DESeq2 v1.14.1 (Love et al., 2014) was used to provide basemean expression values and differential expression analysis across the time course. Total gene coverage for a gene was converted to read counts by dividing the coverage by N+N (100+100) since each paired-end NxN mapped read induces a total coverage of N+N across its genomic positions. Results are in Table S2 and data are available from GEO: GSE106245.
For mouse cortical organoids and H9* and H9NOTCH2NLΔ organoid samples, RNA was isolated according to standard TRIzol protocol. RNA was treated with DNAseI (Roche) according to standard protocol for DNA clean-up in RNA samples. RNA was then isolated by column purification (Zymo RNA clean & concentrator 5) and stored at −80°C. For RNA sequen cing, mRNA was isolated from total RNA using polyA selection Dynabeads mRNA DIRECT Micro Purification Kit (Thermofisher). Library was prepared using strand-specific Ion Total RNA-seq Kit v2 (Thermofisher) and Ion Xpress RNA-seq Barcode 1–16 (Thermofisher) to label different samples. The samples were sequenced on an IonProton system (Thermofisher), generating single-end reads of around 100 bp in length. RNA sequencing data was processed using the Tuxedo package, according the ThermoFisher protocol for IonProton data with the following parameters: Reads were trimmed using trimmomatic (0.36) LEADING:3 TRAILING:3 SLIDINGWINDOW:4:15 MINLEN:25. Then, reads were mapped using STAR (2.4.0) --outStd SAM --outReadsUnmapped Fastx --chimSegmentMin 18 --chimScoreMin 12 and Bowtie2 (2.3.3.1) --local --very-sensitive-local -q --mm, output BAM file per tool were merged. The ENSEMBL hg38 release 84 was used as reference. To generate raw read counts per gene: htseq-count (0.6.1p1) -t exon -i exon_id -q. DESeq2 (2.11.39, Galaxy) was used to normalize read counts and do pairwise statistical analysis to determine significant differentially expressed genes (p-adj < 0.05). For analysis of mouse data, the same processing was used with the mm10 genome. Results are in Table S2.
For comparison of week 4 H9* and H9NOTCH2NLΔ organoid data to the previously established H9 organoid timeline, the following procedure was used: The top 250 upregulated and the 250 downregulated genes between week 4 H9* and H9NOTCH2NLΔ based on p-adj were selected. The matching expression profiles of these 500 genes were extracted from the H9 organoid timeline, yielding 361 genes expressed in both datasets. The expression profiles in week 4 H9* and H9NOTCH2NLΔ and H9 Week 3, Week 4 and Week 5 were sorted from high to low, and ranked 1 to 361. Then, pairwise comparisons were made between each sample to calculate Spearman’s rank correlation between all samples, and plotted using multi-experiment viewer. 212 genes showed shift towards better correlation with Week 5 data in H9NOTCH2NLΔ compared to H9*. These 212 genes were subjected to GO analysis using Panther V13.0 (Mi et al., 2017). A selection of genes from the significantly associated term neuron differentiation was plotted in a heatmap. Z-scores were calculated for the different samples of Week 4 H9* and H9NOTCH2NLΔ, and H9 Week 3, Week 4 and Week 5.
Organoid immunofluorescence staining
Organoids were collected in an eppendorf tube and washed 3 times in PBS, then fixed in 3.8% PFA / PBS for 10 minutes. Organoids were washed 3 times in PBS again, following incubation in 30% sucrose / PBS overnight at 4°C. Organoids were embedded in cr yomolds with Tissue Freezing Medium (VWR) or Shandon Cryomatrix (ThermoFisher) and stored at −80°C for later use. 16μm cryosections (Leica CM3050S) were captured on SuperFrost plus slides (VWR), and stored at −80°C for later use. For immunostainings, sections were defrosted and washed 3 times 3 minutes in PBS. Sections were postfixed 10 minutes in 3.8% PFA, followed by 3 washes of 3 minutes in PBS. Blocking solution (3% BSA + 0.1% Triton in PBS) was incubated at room temperature for 3–4 hours. Primary antibodies were diluted 1:1000 in blocking solution and incubated overnight at 4°C. Sections were washed 3 times 5 minutes in PBS, then secondary antibodies diluted 1:1000 in 0.1% Triton / PBS and incubated 1 hours at room temperature. Slides were then washed 3 times 5 minutes with PBS and mounted with SlowFade+DAPI solution (Invitrogen) and stored at 4°C. Alternativ ely, after secondary antibody incubation, slides were washed 2 times 5 minutes in PBS, followed by DAPI solution incubation of 5 minutes, then washed 2 more times for 5 minutes. 3 drops of FluorSave (MerckMillipore) were added and slides were sealed by coverslips and nailpolish. Imaging was done at least 24 hours after storing the slides at 4°C. Primary antibodies were diluted to the following amounts: anti-SOX2 1:1000, rabbit anti-CTIP2 1:1000, rat anti-CTIP2 1:250, anti-PAX6 1:200, anti-TBR1 1:500. Secondary antibodies were diluted to the following amounts: anti-rabbit 488 1:1000, anti-mouse 488 1:1000, anti-rabbit Cy3 1:1000, anti-rat Cy3 1:1000. Antibody details can be found in the key resource table.
Co-immunoprecipitation and immunoblot
pCIG-NOTCH2-Myc and pCAG-NOTCH2NL-HASh + pCAG-NOTCH2NL-HAL,T197I were mixed in equimolar ratios and transfected using Lipofectamine 2000 (Thermofisher). For control conditions, pCIG-EV and pCAG-EV were used in equimolar ratios. 6 hours after transfection, medium was replaced, and another 24 hours later medium was replaced. Cells were harvested 48 hours after transfection. Cells were washed 3 times with cold 1x PBS, then incubated in 40 minutes in IP buffer (50mM Tris-HCl, 150mM NaCl, 5mM MgCl, 0.5mM EDTA, 0.2% NP-40, 5% glycerol, supplemented with cOmplete, EDTA-free protease inhibitor cocktail (Sigma). Cells were lysed by passing cell suspension through 273/4 gauge needle 10 times. Lysate was centrifuged 10 minutes at 4°C, supernatant was transferred to a fresh 1.5m l tube. 2 μg of one specific antibody was added (anti-HA Abcam ab9110, anti-Myc Abcam ab9E10, anti-His Abcam ab9108, anti-NOTCH2 SCBT sc25-255) and incubated overnight at 4°C in a rotating wheel. DynaBeads were blocked using 3 washed of 1x PBS + 0.5% BSA and added to IP samples, incubating 3 hours at 4°C rotating. Using a magnetic separator, samples were washed 2 times in cold IP buffer. Then samples were eluted in Tris-EDTA buffer and transferred to new 1.5ml tubes. 2x Laemmli buffer + DTT was added 1:1 prior to SDS PAGE. Samples were loaded on 4–20% Tris glycine gels (Bio-Rad), followed by blotting on nitrocellulose membranes following manufacturer’s recommended protocol. Membranes were blocked in 5% skim-milk powder in 1x PBS + 0.05% Tween or 1x TBS + 0.1% Tween. Primary antibodies were incubated 3 hours at room temperature in 1x PBS (anti-NOTCH2 sc25-255) or 1x TBS-T (other antibodies), followed by 3 washes in 1x PBS-T (anti-NOTCH2 sc25-255) or 1x TBS-T (other antibodies). Secondary antibodies (anti-Rabbit-HRP 65-6120, anti-Mouse-HRP 62-6520, Thermofisher) were incubated 60 minutes at room temperature, followed by 3 more washes in 1x PBS-T or 1x TBS-T. Membranes were incubated with supersignal westdura ECL substrate (Thermofisher) and imaged using Bio-Rad Chemidoc imager. For experiments with pCAG-NOTCH2NL-His, pCIG-NOTCH2-Myc, pCIG-PDGFRB-Myc and pCIG-EGFR-Myc, the same protocol was used with equimolar mixes of plasmid DNA. For immunoprecipitation of NOTCH2NLSh,T197I from mouse 46c ESCs, the same protocol was used and protein was isolated from medium using the NOTCH2 sc25-255 antibody.
To analyze presence of secreted NOTCH2NL in NOTCH2NL-conditioned medium, the medium was collected after 32 hours, and used for immunoprecipitation with a NOTCH2 antibody specific for the N-terminal region. The isolated protein samples were analyzed by immunoblot, confirming the presence of secreted NOTCH2NL in the medium (Figure 6D). NOTCH2NLSh,T197I is detected in two bands, of which the two bands of NOTCH2NLSh likely may represent the glycosylated form of the protein (higher band) and unmodified protein (lower band). This pattern was also observed in ectopic expression of N-terminal fragments of the NOTCH3 receptor (Duering et al., 2011).
NOTCH reporter co-culture assays
U2OS cells were seeded at a density of 425,000 cells per well for transfection (6-wells plate). In parallel, U2OS control or U2OS-JAG2 cells were seeded at a density of 110,000 cells per well for co-culture (12-wells plate). After 24 hours, U2OS cells in 6-wells plates were transfected the following amounts of plasmid DNA per well. For control conditions: 500 ng pGL3-UAS, 33.3 ng pRL-CMV, 16.7 ng pCAG-GFP, 200 ng pcDNA5.1-NOTCH2-GAL4, 167 ng pCAG-EV, and 273 ng pBluescript. For conditions including NOTCH2NL:500 ng pGL3-UAS, 33.3 ng pRL-CMV, 16.7 ng pCAG-GFP, 200 ng pcDNA5.1-NOTCH2-GAL4, 200 ng pCAG-NOTCH2NL, and 240 ng pBluescript. Plasmid DNA mix was transfected using polyethylenimine (PEI, linear, MW 25000, Polysciences). All amounts were scaled accordingly for multiple transfections. For larger experiments, cells were seeded and transfected in T25 flasks or on 100 mm plates and amounts used were scaled accordingly to surface area. 6 hours after transfection, 6-wells plates were treated with 0.5 ml of 0.25% Trypsin and 0.5 mM EDTA in PBS per well for 2 minutes at 37 degrees. Cells were resuspended in a total volume of 7 ml after addition of culture medium. Medium of 12-wells plates was removed, and 1 ml of transfected cell suspension was added to each well for co-culture. 10 μM Dibenzazepine (DBZ) was added to selected control wells. After 24 hours, medium was removed and cells washed once with PBS. Cells were incubated in 150 μl of 1x passive lysis buffer (PLB, Promega) on an orbital shaker for 15 minutes. Lysates were stored at −80°C until analysis. In OP9 and OP9-DLL1 co-cultures, 80,000 cells were seeded per well of a 12-wells plate. For generating conditioned medium, U2OS cells were seeded on 100 mm plates, and were PEI transfected with 2000 ng of pCIG-EV, or 2400 ng of NOTCH2NLA or NOTCH2NLB. Another 10000 ng or 9600 ng of pBluescript was used as carrier DNA. 6 hours after transfection, medium was replaced. 32 hours after transfection, medium was collected and 0.2 μm filtered and used the same day. The experiments using conditioned medium were done as previously described, but were seeded on 0.25% gelatin, 0.1% BSA coated plates instead. For the reporter U2OS cell transfection, only pCAG-EV, and NOTCH2NL plasmids were not added to the plasmid DNA mix, and replaced by pBluescript. Instead, transfected cells are resuspended and seeded in conditioned medium harvested from other cells. For DLL4 assays, 24-wells plates were coated overnight at 4°C with 150 μl of 5 μg / ml rDLL4 (R&D Systems) , 0.25% gelatin, 0.1% BSA in PBS. Control plates were coated with 0.25% gelatin, 0.1% BSA in PBS only. U2OS cells were transfected and seeded according to co-culture protocol as previously described, except 0.5 ml of cell suspension was used for each well of the coated 24-wells plates. NOTCH-GAL4 and reporter constructs were kindly gifted by Arjan Groot and Marc Vooijs (MAASTRO lab, Maastricht University).
RT-PCR characterization of primate NOTCH2NL fusion genes
For amplification and detection of potential fusion transcripts, Qiagen OneStep RT-PCR kit was used according to manufacturer’s protocol. 25 ng of total RNA isolated from gorilla iPSCs, chimpanzee iPSCs, or human H9 ESCs was used per reaction. Primers used in these reactions were:
N2NL_Fw1_exon1: CGCTGGGCTTCGGAGCGTAG
N2NL_Rv2_exon5: CCAGTGTCTAATTCTCATCG
PDE4DIP_Fw2_exon24: ACACCATGCTGAGCCTTTGC
PDE4DIP_Fw1_exon27: AAGGCCCAGCTGCAGAATGC
MAGI3_Fw1_exon1: GGGTTCGGGATGTCGAAGAC
MAGI3_Fw2_exon10: GCAACTGTGTCCTCGGTCAC
MAGI3_Fw3_exon14: GGGAGCAGCTGAGAAAGATG
TXNIP_Fw1_exon1: CAGTTCCATCATGGTGATG
BRD9_Fw2_exon10: ACGCTGGGCTTCAAAGACG
BRD9_Fw1_exon12: GCAGGAGTTTGTGAAGGATGC
Oligo capture library generation
To enrich whole-genome sequencing libraries to allow for cost-effective deep sequencing of the NOTCH2NL loci, a MYcroarray MyBaits custom oligonucleotide library was developed. 100 bp probes were designed spaced 50 bp apart in chr1:145,750,000-149,950,000, ignoring repeat masked bases, for a total of 20,684 probes. A further 8,728 probes were created in the three NOTCH2NL loci by tiling with 50 bp overlaps, ignoring repeat masking but dropping any probes with very low complexity. 17,866 probes were added at every Singly Unique Nucleotide (SUN) position tiling at 5 bp intervals from −75 bp to +75 bp around the SUN. SUN positions are single nucleotide substitutions that are markers for individual paralogs. To try and capture population diversity and ensure even enrichment, at every SNP in the NA12878 Genome In a Bottle variant call set the reference base was replaced and probes tiled in the same fashion as the SUNs. Finally, to reach the required 60,060 probes a random 347 probes were dropped.
Library Preparation and Enrichment of 10x Chromium Libraries
High molecular weight DNA was processed into Illumina sequencing libraries using the Chromium Genome Reagent Kit V2 chemistry according to the recommended protocol (CG00022 Genome Reagent Kit User Guide RevC) and enriched using the custom MyBaits oligonucleotide probes described above (Figure S1). Briefly, high molecular weight (HMW) gDNA was isolated from cultured cells using a MagAttract kit (Qiagen) followed by quantification with Qubit. HMW DNA was partitioned inside of an emulsion droplet along with DNA barcode containing gel beads and an amplification reaction mixture. After barcoding the molecules within the emulsion, Illumina sequencing adaptors were added by ligation. In preparation for hybridization with MyBaits probes Illumina adaptor sequences are blocked with complementary oligonucleotides. Biotinylated probes were hybridized overnight at 65°C and isolated using streptavidin coated MyOne C1 beads (Invitrogen). The final enriched libraries were amplified using an Illumina Library Amplification Kit (Kapa).
Sequencing of Enriched 10x Chromium Libraries
The MYcroarray probes (above) were used to enrich 10x Genomics sequencing libraries for three well studied individuals (NA19240, NA12877 and CHM1), the H9 ESC line, the six Simons VIP samples in Figure 7, and the H9 CRISPR mutants in Figure 5. NA12877 was chosen instead of NA12878 because of the existence of high depth 10x Genomics Chromium whole-genome data for that individual. We find that around 50% of our reads map to regions of enrichment, leading to >1000x coverage of the NOTCH2NL loci. The NA19240, NA12877 and H9 libraries were sequenced to 65 million reads, 71 million reads, and 107 million reads respectively. The Simons VIP samples SV721, SV877, SV7720, SV780, SV735 and SV788 were sequenced to a depth of 57 million, 30 million, 44 million, 37 million, 86 million and 37 million reads respectively.
Chimpanzee NOTCH2NL gene analysis on chimpanzee Chromium genome sequencing data
Whole genome 10x Genomics Chromium linked read sequencing libraries were generated from high molecular weight DNA isolated from a chimpanzee iPSC line (Epi-8919-1A) derived from S008919 primary fibroblasts (Yerkes Primates, Coriell) and described in Field, et. al., bioRxiv 232553; doi: https://doi.org/10.1101/232553. according to the 10x Genomics Protocol (CG00022 Genome Reagent Kit User Guide RevC). PE 150bp Illumina sequencing was done on a HiSeq4000 producing 1.6 billion reads. Reads were processed using Longranger and aligned to hg38. Reads aligned to chr1:119,989,248-120,190,000, chr1:149,328,818-149,471,561, chr1:148,600,079-148,801,427, chr1:146,149,145-146,328,264, or chr1:120,705,669-120,801,220 were extracted and their barcodes recorded. All reads from these barcodes were extracted and realigned to a chimp BAC-derived consensus NOTCH2NL sequence using bwa, variants were called with freebayes command “freebayes -f n2nlConsensus.fa --ploidy 10 --min-alternate-fraction 0.05 -k -j --min-coverage 50 -i -u -0 consensus_mapped.sorted.bam”, and then sequences were assembled with Gordian Assembler. Scaffold and assembly hubs were made to visualize these assemblies, as shown in the Github at https://github.com/vrubels/Notch2NL-Project.
NOTCH2NL Simons Samples Coverage Analysis
To assess copy number change in the Simons VIP 1q21.1 collection, the H9, NA12877 and NA19240 enriched 10x Chromium libraries described above were mapped to GRCh38 using Longranger 2.1.3. bamCoverage was used to extract all reads that mapped to the region chr1:142785299-150598866, normalizing depth to 1x coverage across the region to account for library depth. Wiggletools mean (Zerbino et al., 2014) was used to average the depth across these samples. Wiggletools was then used to perform a ratio of this average with the coverages of every Simons 1q21.1 collection sample, which simultaneously normalizes out bias from the array enrichment as well as GC content. These coverages were then re-scaled by the average coverage in the region chr1:149,578,286-149,829,369, which is downstream of NOTCH2NLC and not observed to have copy number change. This rescaling adjusts for a systematic shift downward caused by the combination of the previous normalizations seen in deletion samples, and a similar shift upward in duplication samples. Finally, sliding midpoint smoothing was applied to each coverage track, taking into account missing data by ignoring it and expanding the window size symmetrically around a midpoint to always include 100,000 datapoints, stepping the midpoint 10 kb each time.
Hominid and Archaic Human Copy Number Analysis
Sequencing data for NA12878 (ERR194147), Vindjia Neanderthal (PRJEB21157), Altai Neanderthal (PRJEB1265), Denisovan (ERP001519), Chimpanzee (SRP012268), Gorilla (PRJEB2590) and Orangutan (SRR748005) were obtained either from SRA or from collaborators. These data were mapped to GRCh37 to obtain reads mapping to the NOTCH2 (chr1:120,392,936-120,744,537) and NOTCH2NL (chr1:145,117,638-145,295,356) loci in that assembly, and then those reads were remapped to a reference containing just the GRCh38 version of NOTCH2. Coverage was extracted with bamCoverage, normalizing to 1x coverage across the custom NOTCH2 reference. The resulting coverage tracks were then scaled to the average of the unique region of NOTCH2 then underwent the same sliding midpoint normalization described above, with 5,000 datapoints per window and 2.5 kb step size.
Gordian Assembler
The extremely low number of long fragments per partition in the 10x Chromium process ensures that nearly all partitions containing sequence from a NOTCH2NL repeat will contain sequence from precisely one repeat copy. In order to recover the precise NOTCH2NL repeat sequences, a process was developed to assemble paratypes using barcoded reads. A 208 kb multiple sequence alignment of NOTCH2NL paralogs was constructed and a consensus sequence generated. For each sample being assembled, the 10x Genomics Longranger pipeline was used to map enriched or unenriched reads to GRCh38. All reads that mapped to any of the five NOTCH2 or NOTCH2NL loci in that alignment were extracted, as well as any reads associated with the same input molecules via the associated barcodes. These reads were then remapped to the consensus sequence. FreeBayes (https://arxiv.org/abs/1207.3907) was used to call variants on these alignments with ploidy set to 10 based on the putative number of NOTCH2NL repeats. Each barcode is then genotyped to find the set of alleles supported at each informative SNP site. Alleles for the majority of SNP sites are undetermined in each barcode due to the sparsity of the linked reads. The result is an MxB sparse matrix where M is the number of variants and B is the number of barcodes identified as having NOTCH2-like sequence. A statistical model is then used to phase this matrix into K paratypes. For each cluster of barcodes representing a single paratype, all reads with the associated barcodes are pooled for short-read assembly using the DeBruijn graph assembler idba_ud (Peng et al., 2012).
Establishment of Paratypes in Population
The paratype assembly process described above was applied to the MYcroarray enriched 10x Genomics sequencing of NA19240, H9, NA12877, and the six Simons VIP samples. The H9 paratypes were validated with full-length cDNA sequencing. The NA12878/NA12891/NA12892 trio (Utah) as well as the NA24385/NA24143/NA24149 trio (Ashkenazi) were assembled using linked read data produced by 10x Genomics for the Genome In A Bottle Consortium. Inheritance was established for the Ashkenazi trio, as well as for the three NA12878 paratypes that assembled. Inherited paratypes are not double counted in Table S1. NA12877 did not assemble completely and so is not included in the table. A scaffolding process using alignments of contigs to GRCh38 was performed to construct full-length NOTCH2NL loci for each of these assemblies. The NOTCH2NL transcripts were annotated and assessed for their protein level features.
Enrichment and Sequencing of Full-Length cDNA
Full-length cDNA was constructed from both week 5 cortical organoids as well as undifferentiated H9 hESC total RNA similar to previously described protocols (Byrne et al., 2017) and were enriched using the same MyBaits oligonucleotide set as the 10x Chromium libraries. These cDNA libraries were prepared and sequenced on the Oxford Nanopore MinION. 47,391 reads were obtained for the undifferentiated cells and 118,545 reads for the differentiated cells. The reads were base called with Metrichor. After pooling these datasets, the reads were aligned to GRCh38 to identify putative NOTCH2NL reads. 2,566 reads were identified in the week 5 dataset that mapped to NOTCH2NL, and 363 in the undifferentiated. Both datasets were filtered for full-length transcripts by requiring at least 70% coverage to the first 1.1 kb of the consensus sequence. This filtering process removed NOTCH2 like transcripts, leaving a final set of 1,484 transcripts pooled across both timepoints to be analyzed.
Validating H9 Haplotypes Using Full-Length cDNA
The 1,484 NOTCH2NL transcript sequences identified above were aligned to a consensus sequence of H9 ESC transcript paratypes using MarginAlign (Jain et al., 2015). The reads were then reduced into feature vectors containing variant sites along the first 1.1 kb of the consensus to eliminate noise related to alternative transcription stop sites. The feature vectors were aligned using a Hidden Markov Model with one path for each of the paratype assemblies. Since the transcripts are already aligned to a consensus, there is no need for reverse transitions in the model, and since variation or recombination between paralogs is already accounted for in the assemblies, no transitions between paths are allowed. This vastly simplifies the Forward algorithm, and the maximum probability path (usually determined with the Viterbi Algorithm) is trivial to calculate under these conditions. All mismatches were assumed to be errors and were given an emission probability of 0.1 to approximate the error rate of the nanopore. The paratype assembly was validated by showing that there were no recurrent feature vectors that did not align well to any path through this model.
CRISPR Mutation of NOTCH2NL in the H9 ES Line
To avoid targeting NOTCH2, two guides were used: one in intron 1 with a 1 base mismatch with NOTCH2 and NOTCH2NLR, but identical to the corresponding sequence in all H9 1q21 NOTCH2NL genes, and another that spans a 4 bp deletion relative to NOTCH2 at the start of exon 5. This region is also quite different in NOTCH2NLR (13/20 mismatches to NOTCH2NL) (Figure S5A). H9 hESC at passage 42 were plated on a 6-well dish at 40–50% confluency. After 24 hours, cells were treated with 10μM ROCK inhibitor (Y27632; ATCC, ACS-3030) for 1 hour. 2.5μg of each guide plasmid (E2.1& E5.2, Fig. S5 cloned into pX458, Addgene) was then introduced for 4 hours using Xfect DNA transfection reagent (Clontech, 631317). Each guide set was introduced to all 6 wells of a 6-well plate. 48 hours after transfection, cells were dissociated from wells using Accutase cell dissociation enzyme (eBioscience, 00-4555-56), then rinsed twice in PBS supplemented with 0.2mM EDTA, 2% KnockOut Serum Replacement (Thermo Fisher, 10828028), 1% Penicillin-Streptomycin (LifeTech, 15140122), and 2μM thiazovivin (Tocris, 1226056-71-8), and resuspended in a final volume of 1mL of sorting buffer. The cells were then filtered in a 70μm filter and sorted on a FACS Aria II (BD Biosciences) with a 100μm nozzle at 20psi to select for cells expressing the Cas9-2A-GFP encoded on pX458. Gating was optimized for specificity. Single cells positive for GFP were plated on a 10 cm plate containing 1.5x10⁶ mouse embryonic fibroblasts (MEFs) and cultured in E8 Flex with 2μM thiazovivin (Tocris, 1226056-71-8) for added for the first 24 hours. After growing 5–7 days, individual colonies were manually isolated into 1 well of a 6-well dish on 250,000 MEFs in E8 Flex. 3–5 days later, 3–7 good colonies at passage 42+3 were frozen in BAMBANKER (Fisher Scientific, NC9582225). Remaining cells on MEFs were used for PCR deletion assay. For all subsequent analysis, cells were adapted to culturing on vitronectin (Thermo Fisher A14700) in Gibco’s Essential 8 Flex medium (Thermo Fisher, A2858501). PCR assay for CRIPSR deletion: For each clone, gDNA was isolated from one 70% confluent well of a 6-well dish using Zymo Quick-gDNA Miniprep kit (Zymo, D3006) according to the manufacturer’s protocol. PCR was performed using approximately 70ng gDNA with Herculase II fusion DNA polymerase (Agilent, 6006745) using primers N2NL E2del_F (5′ CACAGCCTTCCTCAAACAAA 3′) and N2NL E5del_R (5′ GTGCCACGCATAGTCTCTCA 3′). PCR products of the expected size were cloned and sequenced to determine that at least one of NOTCH2NL locus harbored the expected deletion. Positive clones underwent Chromium library preparation, target enrichment, Illumina sequencing and NOTCH2NL gene assembly as described above.
NOTCH2NL Expression in Week 5 Neurospheres
Two replicates of bulk RNA-seq of week 5 cortical organoids derived from H9 ES as well as undifferentiated cells from the H9 differentiation time course described above were quantified against a custom Kallisto reference based on GENCODE V27. Using bedtools, all transcripts which overlapped our curated annotations of NOTCH2NL paralogs and NOTCH2 were removed. After converting this annotation set to FASTA, a subset of our paratype assemblies of H9 NOTCH2NL paralogs were added in. Only one representative of both NOTCH2NLR and NOTCH2NLC was used due to their high similarity on the transcript level. The TPM values of the replicates were averaged.
Estimate of NOTCH2 and NOTCH2NL Expression in human fetal brain scRNA-Seq data
To asses NOTCH2NL expression in the developing brain, we re-analyzed single cell RNA sequencing data from (Nowakowski, et al, 2017). Initial analysis of this data showed low expression of NOTCH2 and NOTCH2NL presumably due to removal of multi-mapping reads. To address this, we constructed a custom Kallisto reference based off GENCODE V19 (hg19) where we removed the transcripts ENST00000468030.1, ENST00000344859.3 and ENST00000369340.3. The reads for 3,466 single cells were then quantified against this Kallisto index, and the NOTCH2 and NOTCH2NL rows of the resulting gene-cell matrix compared to previously generated tSNE clusters.
Copy Number Estimates of NOTCH2NL in Human Population
The copy number of NOTCH2NLR and NOTCH2NLC in the human population were established by extracting reads that map to NOTCH2 (chr1:119,989,248-120,190,000), NOTCH2NLR (chr1:120,705,669-120,801,220), NOTCH2NLA (chr1:146,149,145-146,328,264), NOTCH2NLB (chr1:148,600,079-148,801,427) and NOTCH2NLC (chr1:149,328,818-149,471,561) from 266 individuals in the Simons Diversity Panel. These reads were then remapped to the 101,143 bp consensus sequence of a multiple sequence alignment of alignable portions of NOTCH2 and all NOTCH2NL paralogs. This multiple sequence alignment was used to define our SUN markers, and the ratio of reads containing a SUN to a non-SUN were measured and the median value taken for NOTCH2NLC and NOTCH2NLR. Establishing copy number with SUNs proved difficult for NOTCH2NLA and NOTCH2NLB due to the high rate of segregating ectopic gene conversion alleles in the population. Each of the 266 samples was studied by hand. Using comparison to the 10 normal genomes assembled, it appeared that NOTCH2NLA and NOTCH2NLB are not copy number variable in the phenotypically normal population.
Paratype Estimation of NOTCH2NL in Human Population
Assigning paratypes without assemblies is not possible. To try and evaluate the gene conversion landscape in the population, we took the ratio of SUN read depths in all 266 Simons individuals as well as the six Simons VIP samples and our 10 assembled genomes and plotted them split up by paralog (Table S4). These were evaluated for NOTCH2NLC and NOTCH2NLR copy number (Figure S1G). Three samples were identified in Simons with apparent gene conversion in NOTCH2NLC, which we did not observe in any of our assembled samples. Manual analysis of these SUN diagrams led to the annotation of six distinct classes of NOTCH2NLA-NOTCH2NLB gene conversion with varying population frequencies. In some cases, the data were of lower quality and harder to interpret. The most common gene conversion allele is an overwrite of around 20kb of NOTCH2NLB by NOTCH2NLA in intronic sequence between exons 2 and 3, present in 42.5% of Simons normals haplotypes. When interpreting these SUN plots, it is helpful to remember that the denominator of the ratio is the total copy number, and as such as individuals stray from N=10 the expected values change. Gene conversion can be observed as regions where one paralog has ratios on the Y axis go up while the other goes down. Exons 1–5 are located at 19,212–19,590 bp, 59,719–59,800 bp, 84,150–84,409 bp, 92,421–92,756 bp and 93,009–97,333 bp respectively in the consensus sequence.
Copy Number Estimates of Microarray 1q21.1 Deletion/Duplication Syndrome Patients
Comparative genomic hybridization (CGH) microarray probes from Agilent array designs #014693, #014950, #24616, and #16267 were mapped to the human hydatidiform mole genome assembly using the pblat aligner (https://code.google.com/p/pblat/). IDs for microcephaly and macrocephaly patients visualized in Figure S7 are as follows: control-1: MCL08273; control-2: GSM1082800; 1: LG_252808110380_S01; 2: WSX002375; 3: SGM250214; 4: MCL08277; 5:MUG249341; 6: MCL04601; 7: MCL00270; 8: MCL02135; 9: NGS260131; 10: MCL01089; 11: MCL01415. The relative affinities of each probe for each of its mapping locations were calculated using the DECIPHER R package; the predicted hybridization efficiency of a probe and a mapping location was divided by the predicted hybridization efficiency of the probe and its reverse complement, yielding the affinity for the mapping location. An integer linear programming (ILP) model was created for each sample, with integral variables representing the copy number of each probe mapping location in the CGH sample genome and the CGH reference genome, and additional variables representing the total affinity-weighted copy number of all mapping locations for each probe. Approximate equality constraints were added to represent the measured sample/normal hybridization ratios (normalized per-probe to an average control value of 1.0 for arrays with control samples (GEO accession GSE44300) available), the chromosomal structure of the genome, and the prior belief that the copy number at most locations would be 2. Each approximate equality constraint was constructed by creating two variables, which were restricted to be positive and greater than the difference between the constrained quantities in each direction; the weighted sum of these two variables was then added into the model’s objective function. In an alternate method, the locations of homologous sequences that could provide a plausible mechanism for duplication or deletion of a region were also added (data not shown). Finally, the resulting ILP model was minimized using CBC79 (https://projects.coin-or.org/) to produce the sample’s integral copy number calls.
QUANTIFICATION AND STATISTICAL ANALYSIS
For analysis of RNA sequencing read count data, DESeq2 (2.11.39) was used with n = 3 per condition. Replicates were grouped and compared pairwise between conditions. Adjusted p-value (p-adj < 0.05) was used to determine statistically significant genes.
In Notch signaling reporter assays, data with a single independent experiment were analyzed by t-test, with Holm-Bonferroni correction for multiple testing, to determine significant effects (p < 0.05). Error bars are indicating SD. For data with multiple independent experiments, two-way or one-way ANOVA and Tukey’s HSD was used to determine statistically significant effects (p < 0.05), with Holm-Bonferroni correction. For visualization in graphs, weighted average and weighted standard error of the mean (SEM) were calculated over the multiple experiments.
Images were taken of human H9* and H9NOTCH2NLΔ cortical organoids at days 3, 6, 8, 10, 12, 14, 16, 18, 20, 22, 24, 26, and 28 of growth. Images were also taken of organoids generated from stable mESC cell lines expressing NOTCH2NLSh,T197I or EV on days 2, 4, 6, and 8. Each image was loaded into FIJI, and length along the longest axis of every EB at least half-way in view of the image were measured. A two-tailed Kolmogorov-Smirnov test was done on the pair of measurements at each time point. Human EBs were significantly (p < 0.05) different sizes at each time point, and very significantly (p < 0.005) different on days 3, 6, 12, 14, 18, 20, 22, 24, and 26. Mouse EBs showed no significant size difference at any time point.
Analysis of Immunofluorescence images was was done in FIJI (ImageJ 1.51s). For cell counts, images were thresholded, followed by watershed option. Cell counts were calculated using Analyze particles (size pixel2 12-infinity). Organoid section surface area was used to normalize the amount of positive cells counts. For calculating CTIP2 intensity (grey values), the following parameters were used after loading an image: Subtract background: 10px, followed by Threshold: Li. Then, analyze particles was used to calculate the grey value per cell and averaged across the section for statistical analysis. For calculating SOX2 intensity (grey values), the following parameters were used: Threshold: MaxEntropy was used. Then, analyze particles (size pixel2 12-infinity) was used to calculate the grey value per cell and averaged across the section for statistical analysis. Sections from the same organoid were averaged and used as a single replicate in the analysis. Statistics for cell counts and fluorescence intensity were analyzed by t-test, followed by Holm-Bonferroni correction for multiple testing.
DATA AND SOFTWARE AVAILABILITY
The copy number inference software used is available from https://bitbucket.org/adam_novak/copynumber. Gordian assembler is available on github at https://github.com/abishara/gordian_assembler. The upstream and downstream analysis scripts for Gordian assembler are available on github at https://github.com/vrubels/Notch2NL-Project. Enriched linked read data on cell lines are deposited on SRA under accession SRP130766. For the sequence data on the Simons VIP collection samples, the following policy applies. Approved researchers can obtain the Simons VIP population dataset described in this study (https://www.sfari.org/resource/simons-vip/) by applying at https://base.sfari.org. Protected linked read data are available from SFARIbase under accession number SFARI_SVIP_VSV_1. Additional public sequences can be found from Genome in a Bottle at ftp://ftp-trace.ncbi.nih.gov/giab/ftp/data/.
Wild type H9 hESC cortical organoid time course RNA-Seq data are available at GEO, accession GSE106245.
Week 4 human H9* WT and NOTCH2NL knock-out RNA-Seq, and day 6 mouse 46C WT and NOTCH2NL knock-in RNA-Seq are available at GEO, accession GSE111082.
KEY RESOURCES TABLE.
| Reagent or Resource | Source | Identifier |
|---|---|---|
| Antibodies | ||
| Rabbit anti-HA | Abcam | Cat#ab9110 |
| Mouse anti-Myc | Abcam | Cat#ab9E10 |
| Rabbit anti-Myc | Abcam | Cat#ab9106 |
| Rabbit anti-His | Abcam | Cat#ab9108 |
| Rabbit anti-NOTCH2 | SCBT | Cat#sc25-255 |
| Goat anti-Rabbit-HRP | ThermoFisher | Cat#65-6120 |
| Goat anti-Mouse-HRP | ThermoFisher | Cat#62-6520 |
| Rat anti-CTIP2/BCL11B | Abcam | Cat#ab18465 |
| Mouse anti-PAX6 | DSHB | Cat#Pax6 |
| Rabbit anti-TBR1 | Millipore | Cat#AB10554 |
| Rabbit anti-TBR2/EOMES | Abcam | Cat#ab23345 |
| Rabbit anti-SOX2 | Abcam | Cat#ab97959 |
| Rabbit anti-CTIP2 | Abcam | Cat#ab28448 |
| Donkey anti-Rabbit Alexa488 | ThermoFisher | Cat#R37118 |
| Donkey anti-Mouse Alexa488 | ThermoFisher | Cat#R37114 |
| Goat anti-Rabbit Cy3 | Jackson | Cat#111-165-144 |
| Goat anti-Rat Cy3 | Jackson | Cat#112-165-143 |
| Chemical, Peptides and Recombinant Proteins | ||
| FGF2 | Peprotech | Cat#100-18B |
| Noggin | R&D Systems | Cat#3344-ng |
| DKK-1 | Preprotech | Cat#120-30 |
| SB431542 | Sigma | Cat#S4317-5mg |
| Cyclopamine V. californicum | VWR | Cat#239803-1mg |
| Dorsomorphin | Sigma | Cat#P5499 |
| IWR-1-Endo | Sigma | Cat#681669 EMD MILLIPORE |
| EGF | R&D Systems | Cat#236-EG-01M |
| Polyethylenimine | Polysciences | Cat#23966-1 |
| Dibenzazepine | Sigma | Cat#SML0649-5MG |
| rDLL4 | R&D Systems | Cat#1506-D4-050/CF |
| Deposited Data | ||
| Wild type H9 hESC cortical organoid time course RNA-Seq data | this study | GEO: GSE106245 |
| Week 4 human H9* WT and NOTCH2NLΔ, and day 6 mouse 46C EV and NOTCH2NL knock in RNA-Seq | this study | GEO: GSE111082 |
| Enriched linked read DNA-Seq on normal samples and H9 | this study | SRA: SRP130766 |
| Microarray data from controls and patients | DECIPHER | Control is GEO: GSE44300, patient data contact http://decipher.sanger.ac.uk/ |
| Linked read DNA-Seq on two trios (NA12878/NA12891/NA12892 and NA24385/NA21419/NA24143) | 10x Genomics / Genome in a Bottle Consortium (NA12891 and NA12892 data are not publicly available) | ftp://ftp-trace.ncbi.nlm.nih.gov/giab/ftp/data/ |
| Enriched linked read DNA-Seq on Simons VIP samples | Simons Foundation | SFARIbase: SFARI_SVIP_VSV_1 |
| NA12878 Sequencing Data | Illumina Platinum Genomes | SRA: ERR194147 |
| Vindjia Neanderthal Sequencing Data | doi:10.1126/science.aao1887 | SRA: PRJEB21157 |
| Altai Neanderthal Sequencing Data | doi:10.1038/nature12886 | SRA: PRJEB1265 |
| Denisovan Sequencing Data | doi:10.1126/science.1224344 | SRA: ERP001519 |
| Chimpanzee Sequencing Data | University of Nebraska - Non Human Primate Genomics Center (UN-NHPGC) | SRA: SRP012268 |
| Gorilla Sequencing Data | doi:10.1371/journal.pone.0065066 | SRA: PRJEB2590 |
| Orangutan Sequencing Data | doi:10.1038/nature12228 | SRA: SRR748005 |
| Human Fetal brain scRNA-seq data | doi: 10.1126/science.aap8809 | dbGAP: phs000989.v3 |
| Experimental Models: Cell lines | ||
| H9 hESC | WiCell | Cat#WA09 |
| HEK293T | ATCC | Cat#CRL-3216 |
| 46C mESC | Austin Smith | Cat#46C |
| U2OS | Marc Vooijs | na |
| U2OS-JAG2 | Marc Vooijs | na |
| OP9 | Bianca Blom | na |
| OP9-DLL1 | Bianca Blom | na |
| 8919 Chimp iPSC | doi: https://doi.org/10.1101/232553 | na |
| 00053 Gorilla iPSC | Carol Marchetto and Fred Gage | na |
| Software and Algorithms | ||
| Bowtie2 | doi:10.1038/nmeth.1923 | http://bowtie-bio.sourceforge.net/bowtie2/index.shtml |
| STAR | doi:10.1093/bioinformatics/bts635 | https://github.com/alexdobin/STAR |
| bedtools | doi:10.1093/bioinformatics/btq033 | https://github.com/arq5x/bedtools2 |
| DESeq2 | doi:10.1186/s13059-014-0550-8 | https://bioconductor.org/packages/release/bioc/html/DESeq2.html |
| trimmomatic | doi:10.1093/bioinformatics/btu170 | http://www.usadellab.org/cms/?page=trimmomatic |
| htseq-count | na | http://htseq.readthedocs.io/en/master/count.html |
| Panther V13.0 | na | http://www.pantherdb.org/panther/ontologies.jsp |
| Longranger | doi:10.1101/230946 | https://support.10xgenomics.com/genome-exome/software/downloads/latest |
| Microarray copy number inference | This study | https://bitbucket.org/adam_novak/copynumber |
| Gordian assembler downstream analysis scripts and enriched linked read normalization | This study | https://github.com/vrubels/Notch2NL-Project |
| Gordian Assembler | This study | https://github.com/abishara/gordian_assembler |
| Critical Commercial Assays | ||
| OneStep RT-PCR kit | Qiagen | Cat#210212 |
| RNA Clean & Concentrator | Zymo | Cat#R1013 |
| Dynabeads™mRNA DIRECT™Micro Purification Kit | ThermoFisher | Cat#61021 |
| Ribo-Zero rRNA removal kit | Epicentre | MRZH11124 |
| TruSeq DNA Sample Preparation kit | Illumina | FC-121-1001 |
| Ion Total RNA-Seq Kit v2 | ThermoFisher | Cat#4475936 |
| Ion Xpress™RNA-Seq Barcode 1–16 Kit | ThermoFisher | Cat#4475485 |
| Chromium WGS kit V2 | 10X Genomics | 120258 |
| Custom MyBaits-3 oligo kit | Mycroarray | Mybaits 3–12 |
| Kapa HiFi Library Amplification Kit (Illumina) | Kapa | KK2621 |
| Xfect DNA transfection reagent | Clontech | 631317 |
| Zymo Quick-gDNA Miniprep kit | Zymo | D3006 |
| Dual Luciferase Reporter assay | Promega | Cat#E1960 |
| system | ||
| Recombinant DNA | ||
| pX458 | Addgene | #48138 |
| pX458-E2.1 | This study | na |
| pX4580E5.2 | This study | na |
| pCAG-hCas9 | Addgene | #51142 |
| pCAG-GFP | Addgene | #11150 |
| pCAG-EV | This study | na |
| pCAG-NOTCH2NLSh | This study | na |
| pCAG-NOTCH2NLSh,T197I | This study | na |
| pCAG-NOTCH2NLL | This study | na |
| pCAG-NOTCH2NLL,T197I | This study | na |
| pCAG-NOTCH2NLSh,+ATAA | This study | na |
| pCAG-NOTCH2NLL,T197I,+ATAA | This study | na |
| pCAG-NOTCH2NL-HASh | This study | na |
| pCAG-NOTCH2NL-HASh,T197I | This study | na |
| pCAG-NOTCH2NL-HisSh | This study | na |
| pCAG-NOTCH2NL-HisSh,T197I | This study | na |
| pCIG2a | Pierre Vanderhaeghen | na |
| pCIG2a-NOTCH2NLSh,T197I | This study | na |
| pCIG2a-NOTCH2-Myc | This study | na |
| pCIG2a-PDGFR-Myc | This study | na |
| pCIG2a-EGFR-Myc | This study | na |
| pRL-CMV | Promega | E2231 |
| pGL3-UAS | Marc Vooijs | na |
| pcDNA5-NOTCH1-GAL4-TAD-N1 | Marc Vooijs | na |
| pcDNA5-NOTCH2-GAL4-TAD-N1 | Marc Vooijs | na |
| pLVX-NOTCH3-GAL4GV16 | Marc Vooijs | na |
| Oligonucleotides | ||
| Refer to Supplemental Table 5 | ||
Supplementary Material
(A) Identity between NOTCH2-related genes as measured over the alignable genomic region (blue) or the gene exons (pink). (B) DNA and amino acid sequence of human NOTCH2NL genes in exon 5, which is derived from NOTCH2 intron 4. (C) Immunoblot of mouse ESCs transfected with WT NOTCH2NL, or NOTCH2NL with ancestral ATAA inserted in exon 5. (D) Relative protein levels based on the immunoblot in panel C. (E) RT-qPCR analysis of the same samples for determination of transcript levels for each condition. (F) Alignment of the H9 assembled paratypes to GRCh38. Each paratype is colored as to whether a position aligns best to GRCH38 NOTCH2NLA, NOTCH2NLB or NOTCH2NLC. (G) Observed frequency of individuals with the indicated NOTCH2NLC and NOTCH2NLR copy number in the Simons Diversity Panel (n=266). (H) Schematic of linked-read sequencing and Gordian Assembler protocol using the 10x Genomics Chromium genome assay and oligo-capture to enrich for library fragments containing the desired genomic region.
Results of NOTCH2NL gene de novo assembly.
Details of NOTCH2NL-like genes identified by NOTCH2NL de novo assembly, BAC and WGS shotgun sequencing for chimp (A) and by BAC and WGS shotgun sequencing for gorilla (B). (C) Verification of fusion genes by RT-PCR on Chimp and Gorilla RNA. H = Human, C = Chimpanzee, G = Gorilla. (D) Immunoblot blot using an N-terminal NOTCH2 antibody (aa 25-255), comparing ectopic expression of human NOTCH2NLSh,T197I (left lane) to a Chimp NOTCH2NL-like gene lacking exon 2 (NOTCH2NL-like Δexon2) in mESCs (right lane). (E) Details of splice junctions of fusion genes and related open reading frames. Top rows show nucleotide sequence in fusion transcripts. Middle rows show peptides derived from these transcripts. Lower rows contain the orthologous human NOTCH2NL protein sequence.
(A) Summary violin plots indicating NOTCH2NL and NOTCH2 expression in various cell types. (B) NOTCH2NL paratype expression in undifferentiated hESCs and week 5 cortical organoids from bulk Illumina RNA-Seq. (C) Protein alignment of observed NOTCH2, NOTCH2NL and NOTCH2NLR paratypes based on our assembly results. Note that NOTCH2 sequence extends beyond what is shown in the alignment. A segregating variant in NOTCH2NLR is found at amino acid position 235.
(A) MA plot of RNA-sequencing data of mouse cortical organoids based on DESeq2 analysis. (B) Heatmap showing Z-scores of differentially expressed genes (p-adj < 0.05, DESeq2). (C) GO terms significantly associated with the upregulated genes in organoids ectopically expressing NOTCH2NLSh,T197I. Images are 1283 μm wide. (D) Violin plot showing size (length along the longest axis) of mouse cortical organoids based on brightfield pictures in (E). There was no significant difference (p < 0.05) in size between groups at any time point using a two-sided Kolmogorov-Smirnov test.
(A) Heatmap of expression levels for a selection of brain structure marker genes from hESC-derived cortical organoids at the indicated time points (left) and from human embryonic dorsal prefrontal cortex (DFC) samples at 8 pcw, 9 pcw, 12 pcw and 13 pcw, derived from the Allen Brain Atlas (http://www.brainspan.org) (right). w = week; pcw = post conception week; FPKM= fragments per kilobase of exon per million fragments mapped. (B) Schematic of strategy to generate NOTCH2NL-specific deletions using CRISPR/Cas9 and alignment of the two guide sequences used to NOTCH2NL-related sequences. (C) Brightfield images of H9* and H9ΔNOTCH2NL organoids at selected timepoints. Images are 4961 μm wide. (D) Violin plot showing quantification of organoid size over time measured by length of longest axis, * p < 0.05, ** p < 0.005, Kolmogorov-Smirnov test. (E) DAPI staining and SOX2 immunostaining. (F–G) Quantification of SOX2+ cell number and SOX2 intensity. n = 15 H9*, n = 15 H9ΔNOTCH2NL. (H) DAPI staining and CTIP2 immunostaining H9* and H9ΔNOTCH2NL organoid sections. (I–J) Quantification of CTIP2+ cell number and CTIP2 intensity, *** p < 0.0001, t-test. n = 13 H9*, n = 12 H9ΔNOTCH2NL. Scale bars in IF stainings indicate 100 μm.
(A–B) Investigation of co-immunoprecipitation of NOTCH2NL with PDGFRB and EGFR in 2 independent experiments. N2NL = NOTCH2NL. (C) NOTCH reporter assay to assess the effect of NOTCH2NL using either NOTCH1-GAL4, NOTCH2-GAL4 or NOTCH3-GAL4. U2OS cells transfected with EV, NOTCH2NLSh or NOTCH2NLSh,T197I in combination with the different NOTCH-Gal4 receptors, followed by co-culture on U2OS-JAG2 cells or U2OS control cells. n = 6 in one experiment. Student’s t-test with Holm-Bonferroni correction (* p < 0.05, ** p < 10−3, *** p < 10−5), error bars indicate SD. (D) Effects of different NOTCH ligands in reporter assay. U2OS cells transfected with NOTCH2NLSh or NOTCH2NLSh,T197I to assess NOTCH2-Gal4 mediated reporter activity. Here, transfected cells were co-cultured with either U2OS-JAG2 or OP9-DLL1 expressing cells. n = 6 in one experiment. Student’s t-test with Holm-Bonferroni correction (* p<0.05, ** p<10−3, *** p<10−5), error bars indicate SD. (E) U2OS cells transfected with EV, NOTCH2NLSh or NOTCH2NLSh,T197I and NOTCH2-Gal4 were seeded on recombinant DLL4 coated plates or gelatin/BSA control plates, instead of co-culture with ligand-expressing cells. n = 13 in 3 experiments. Two-way anova with Tukey’s HSD (* p < 10−4, ** p <10−8, *** p < 10−12), error bars indicate SEM.
Relative probe intensities from CNV-microarrays for 2 controls and 11 patients with reported 1q21.1 aberrations mapped to the GRCh38 1q21.1 assembly. Gray: normal, red: deletion, blue: duplication. Dark red/blue is high confidence deletion/duplication based on probe values, light red/blue are potentially part of the deletion/duplication.
Features of Simons VIP 1q21.1 samples.
Highlights.
NOTCH2NLA,B,C, expressed in human fetal brain radial glia stem cells, arose 3–4 MYA
These genes encode secreted, Notch-related proteins that enhance Notch signaling
Overexpressing NOTCH2NL delays neuronal differentiation while deletion accelerates it
NOTCH2NLA and NOTCH2NLB serve as breakpoints in 1q21.1 deletion/duplication syndrome
Acknowledgments
We are grateful to all families participating in the Simons Variation in Individuals Project (Simons VIP), the Simons VIP Consortium and SFARI base. We thank Frank Nothaft (Simons Diversity Project), Robert Kuhn, Mark Diekhans, Brain Raney, Hiram Clawson (UCSC Genome Browser), and Raphael Bernier (Simons VIP phenotype data) for assistance with resources; Mari Olsen (Haussler lab), Bari Nazario, Ben Abrams (UCSC Institute for the Biology of Stem Cells), Nader Pourmand (UCSC Genome Sequencing Center), Shana McDevitt (UC Berkeley-QB3 Genomics Sequencing Laboratory) and Martijs Jonker (SILS, University of Amsterdam) for technical support; Arjan Groot and Marc Vooijs (Maastricht Radiation Oncology Lab) for reagents and support for Notch reporter assays; Richard Baldwin (UCSC Anthropology) for providing primate skulls; Pierre Vanderhaeghen, Bin Chen, Benedict Paten, Ed Green and the Haussler and Jacobs labs for helpful discussions and manuscript comments. This work was supported by CIRM Predoctoral T3-00006 (ARF), CIRM Postdoctoral TG2-01157 (FMJJ) Fellowships, Human Frontier Science Program LT000689/2010-L fellowship and CDA00030/2016C award (FMJJ), ERC starting grant ERC-2016-StG-716035 (FMJJ), NWO Earth and Life Sciences project 834.12.003., EMBO ALTF 292-2011 (MH), a fellowship from Edward Schulak (ADE), NIH HG002385 (EEE), NIH F30HG009478 (MLD), CIRM GC1R-06673-A, CIRM GC1R-06673-B, NIH R01 GM109031 (DH), NCI Cloud award fund #24074-443720 (DH), NIST/JIMB training program (AB), and the California QB3 Institute. DH and EEE are Howard Hughes Medical Institute Investigators.
Footnotes
Declaration of Interests
Authors have no interests to declare.
Author Contributions
Conceptualization-D.H., S.R.S., F.M.J.J., I.T.F.; Methodology-I.T.F., S.R.S., D.H., M.M., A.D.E., G.L.M., A.Bi., A.M.N., F.M.J.J.; Validation-M.J.D., X.N.; Investigation-G.A.L., M.M., G.L.M., Avd.B., J.L.R., A.R.F., L.R., T.J.N., A.A.P.; Formal Analysis-I.T.F., A.D.E., A.M.N., A.B., R.L.R., A.B., M.L.D., X.N., S.K.; Resources-T.J.N., A.A.P., M.C.A., S.Z., E.E.E., A.K.; Data Curation-I.T.F., C.M.B., G.A.L.; Writing-Original Draft-D.H., I.T.F., G.A.L., F.M.J.J., S.R.S.; Writing-Review & Edit-D.H., I.T.F., G.A.L., F.M.J.J., S.R.S., C.M.B., A.D.E., G.L.M., A.R.F., M.H., T.J.N., A.A.P., M.L.D., X.N.; Visualization-I.T.F., G.A.L., G.L.M., A.M.N., M.H.; Supervision-A.K., E.E.E., S.R.S., F.M.J.J., D.H.; Project Administration-D.H., S.R.S. F.M.J.J.; Funding acquisition-D.H., F.M.J.J., E.E.E.
Publisher's Disclaimer: This is a PDF file of an unedited manuscript that has been accepted for publication. As a service to our customers we are providing this early version of the manuscript. The manuscript will undergo copyediting, typesetting, and review of the resulting proof before it is published in its final citable form. Please note that during the production process errors may be discovered which could affect the content, and all legal disclaimers that apply to the journal pertain.
References
- Bailey JA, Eichler EE. Primate segmental duplications: crucibles of evolution, diversity and disease. Nat Rev Genet. 2006;7:552–564. doi: 10.1038/nrg1895. [DOI] [PubMed] [Google Scholar]
- Bernier R, Steinman KJ, Reilly B, Wallace AS, Sherr EH, Pojman N, Mefford HC, Gerdts J, Earl R, Hanson E, et al. Clinical phenotype of the recurrent 1q21.1 copy-number variant. Genet Med. 2016;18:341–349. doi: 10.1038/gim.2015.78. [DOI] [PMC free article] [PubMed] [Google Scholar]
- Boareto M, Iber D, Taylor V. Differential interactions between Notch and ID factors control neurogenesis by modulating Hes factor autoregulation. Development. 2017;144:3465–3474. doi: 10.1242/dev.152520. [DOI] [PMC free article] [PubMed] [Google Scholar]
- Brunetti-Pierri N, Berg JS, Scaglia F, Belmont J, Bacino CA, Sahoo T, Lalani SR, Graham B, Lee B, Shinawi M, et al. Recurrent reciprocal 1q21.1 deletions and duplications associated with microcephaly or macrocephaly and developmental and behavioral abnormalities. Nat Genet. 2008;40:1466–1471. doi: 10.1038/ng.279. [DOI] [PMC free article] [PubMed] [Google Scholar]
- Byrne A, Beaudin AE, Olsen HE, Jain M, Cole C, Palmer T, DuBois RM, Forsberg EC, Akeson M, Vollmers C. Nanopore long-read RNAseq reveals widespread transcriptional variation among the surface receptors of individual B cells. Nat Commun. 2017;8:16027. doi: 10.1038/ncomms16027. [DOI] [PMC free article] [PubMed] [Google Scholar]
- Charrier C, Joshi K, Coutinho-Budd J, Kim JE, Lambert N, de Marchena J, Jin WL, Vanderhaeghen P, Ghosh A, Sassa T, et al. Inhibition of SRGAP2 function by its human-specific paralogs induces neoteny during spine maturation. Cell. 2012;149:923–935. doi: 10.1016/j.cell.2012.03.034. [DOI] [PMC free article] [PubMed] [Google Scholar]
- Cheng W, Su Y, Xu F. CHD1L: a novel oncogene. Mol Cancer. 2013;12:170. doi: 10.1186/1476-4598-12-170. [DOI] [PMC free article] [PubMed] [Google Scholar]
- Cheng Z, Ventura M, She X, Khaitovich P, Graves T, Osoegawa K, Church D, DeJong P, Wilson RK, Paabo S, et al. A genome-wide comparison of recent chimpanzee and human segmental duplications. Nature. 2005;437:88–93. doi: 10.1038/nature04000. [DOI] [PubMed] [Google Scholar]
- Dennis MY, Nuttle X, Sudmant PH, Antonacci F, Graves TA, Nefedov M, Rosenfeld JA, Sajjadian S, Malig M, Kotkiewicz H, et al. Evolution of human-specific neural SRGAP2 genes by incomplete segmental duplication. Cell. 2012;149:912–922. doi: 10.1016/j.cell.2012.03.033. [DOI] [PMC free article] [PubMed] [Google Scholar]
- Dennis MY, Eichler EE. Human adaptation and evolution by segmental duplication. Curr Opin Genet Dev. 2016;41:44–52. doi: 10.1016/j.gde.2016.08.001. [DOI] [PMC free article] [PubMed] [Google Scholar]
- Dobin A, Davis CA, Schlesinger F, Drenkow J, Zaleski C, Jha S, Batut P, Chaisson M, Gingeras TR. STAR: ultrafast universal RNA-seq aligner. Bioinformatics. 2013;29:15–21. doi: 10.1093/bioinformatics/bts635. [DOI] [PMC free article] [PubMed] [Google Scholar]
- Dougherty ML, Nuttle X, Penn O, Nelson BJ, Huddleston J, Baker C, Harshman L, Duyzend MH, Ventura M, Antonacci F, et al. The birth of a human-specific neural gene by incomplete duplication and gene fusion. Genome Biol. 2017;18:49. doi: 10.1186/s13059-017-1163-9. [DOI] [PMC free article] [PubMed] [Google Scholar]
- Duan Z, Li FQ, Wechsler J, Meade-White K, Williams K, Benson KF, Horwitz M. A novel notch protein, N2N, targeted by neutrophil elastase and implicated in hereditary neutropenia. Mol Cell Biol. 2004;24:58–70. doi: 10.1128/MCB.24.1.58-70.2004. [DOI] [PMC free article] [PubMed] [Google Scholar]
- Duering M, Karpinska A, Rosner S, Hopfner F, Zechmeister M, Peters N, Kremmer E, Haffner C, Giese A, Dichgans M, et al. Co-aggregate formation of CADASIL-mutant NOTCH3: a single-particle analysis. Hum Mol Genet. 2011;20:3256–3265. doi: 10.1093/hmg/ddr237. [DOI] [PubMed] [Google Scholar]
- Eiraku M, Watanabe K, Matsuo-Takasaki M, Kawada M, Yonemura S, Matsumura M, Wataya T, Nishiyama A, Muguruma K, Sasai Y. Self-organized formation of polarized cortical tissues from ESCs and its active manipulation by extrinsic signals. Cell Stem Cell. 2008;3:519–532. doi: 10.1016/j.stem.2008.09.002. [DOI] [PubMed] [Google Scholar]
- Florio M, Albert M, Taverna E, Namba T, Brandl H, Lewitus E, Haffner C, Sykes A, Wong FK, Peters J, et al. Human-specific gene ARHGAP11B promotes basal progenitor amplification and neocortex expansion. Science. 2015;347:1465–1470. doi: 10.1126/science.aaa1975. [DOI] [PubMed] [Google Scholar]
- Genomes Project C. Auton A, Brooks LD, Durbin RM, Garrison EP, Kang HM, Korbel JO, Marchini JL, McCarthy S, McVean GA, et al. A global reference for human genetic variation. Nature. 2015;526:68–74. doi: 10.1038/nature15393. [DOI] [PMC free article] [PubMed] [Google Scholar]
- Girirajan S, Dennis MY, Baker C, Malig M, Coe BP, Campbell CD, Mark K, Vu TH, Alkan C, Cheng Z, et al. Refinement and discovery of new hotspots of copy-number variation associated with autism spectrum disorder. Am J Hum Genet. 2013;92:221–237. doi: 10.1016/j.ajhg.2012.12.016. [DOI] [PMC free article] [PubMed] [Google Scholar]
- Groot AJ, Habets R, Yahyanejad S, Hodin CM, Reiss K, Saftig P, Theys J, Vooijs M. Regulated proteolysis of NOTCH2 and NOTCH3 receptors by ADAM10 and presenilins. Mol Cell Biol. 2014;34:2822–2832. doi: 10.1128/MCB.00206-14. [DOI] [PMC free article] [PubMed] [Google Scholar]
- Habets RA, Groot AJ, Yahyanejad S, Tiyanont K, Blacklow SC, Vooijs M. Human NOTCH2 Is Resistant to Ligand-independent Activation by Metalloprotease Adam17. J Biol Chem. 2015;290:14705–14716. doi: 10.1074/jbc.M115.643676. [DOI] [PMC free article] [PubMed] [Google Scholar]
- Haldeman-Englert CR, Jewett T. 1q21.1 Recurrent Microdeletion. In: Adam MP, Ardinger HH, Pagon RA, Wallace SE, Bean LJH, Mefford HC, Stephens K, Amemiya A, Ledbetter N, editors. GeneReviews(R) Seattle (WA): 1993. [Google Scholar]
- Hansen DV, Lui JH, Parker PR, Kriegstein AR. Neurogenic radial glia in the outer subventricular zone of human neocortex. Nature. 2010;464:554–561. doi: 10.1038/nature08845. [DOI] [PubMed] [Google Scholar]
- Holloway R, Broadfield D, Yuan M. THE HUMAN FOSSIL RECORD, Volume Three: Brain Endocasts-The Paleoneurological Evidence. Vol. 3. Hoboken, NJ: John Wiley & Sons; 2004. [Google Scholar]
- International Schizophrenia Consortium. Rare chromosomal deletions and duplications increase risk of schizophrenia. Nature. 2008;455:237–241. doi: 10.1038/nature07239. [DOI] [PMC free article] [PubMed] [Google Scholar]
- Jain M, Fiddes IT, Miga KH, Olsen HE, Paten B, Akeson M. Improved data analysis for the MinION nanopore sequencer. Nat Methods. 2015;12:351–356. doi: 10.1038/nmeth.3290. [DOI] [PMC free article] [PubMed] [Google Scholar]
- Karlstrom H, Beatus P, Dannaeus K, Chapman G, Lendahl U, Lundkvist J. A CADASIL-mutated Notch 3 receptor exhibits impaired intracellular trafficking and maturation but normal ligand-induced signaling. Proc Natl Acad Sci U S A. 2002;99:17119–17124. doi: 10.1073/pnas.252624099. [DOI] [PMC free article] [PubMed] [Google Scholar]
- Kim D, Pertea G, Trapnell C, Pimentel H, Kelley R, Salzberg SL. TopHat2: accurate alignment of transcriptomes in the presence of insertions, deletions and gene fusions. Genome Biol. 2013;14:R36. doi: 10.1186/gb-2013-14-4-r36. [DOI] [PMC free article] [PubMed] [Google Scholar]
- Langmead B, Salzberg SL. Fast gapped-read alignment with Bowtie 2. Nat Methods. 2012;9:357–359. doi: 10.1038/nmeth.1923. [DOI] [PMC free article] [PubMed] [Google Scholar]
- Lazaridis I, Patterson N, Mittnik A, Renaud G, Mallick S, Kirsanow K, Sudmant PH, Schraiber JG, Castellano S, Lipson M, et al. Ancient human genomes suggest three ancestral populations for present-day Europeans. Nature. 2014;513:409–413. doi: 10.1038/nature13673. [DOI] [PMC free article] [PubMed] [Google Scholar]
- Love MI, Huber W, Anders S. Moderated estimation of fold change and dispersion for RNA-seq data with DESeq2. Genome Biol. 2014;15:550. doi: 10.1186/s13059-014-0550-8. [DOI] [PMC free article] [PubMed] [Google Scholar]
- Lui JH, Hansen DV, Kriegstein AR. Development and evolution of the human neocortex. Cell. 2011;146:18–36. doi: 10.1016/j.cell.2011.06.030. [DOI] [PMC free article] [PubMed] [Google Scholar]
- Mace A, Tuke MA, Deelen P, Kristiansson K, Mattsson H, Noukas M, Sapkota Y, Schick U, Porcu E, Rueger S, et al. CNV-association meta-analysis in 191,161 European adults reveals new loci associated with anthropometric traits. Nat Commun. 2017;8:744. doi: 10.1038/s41467-017-00556-x. [DOI] [PMC free article] [PubMed] [Google Scholar]
- Mallick S, Li H, Lipson M, Mathieson I, Gymrek M, Racimo F, Zhao M, Chennagiri N, Nordenfelt S, Tandon A, et al. The Simons Genome Diversity Project: 300 genomes from 142 diverse populations. Nature. 2016;538:201–206. doi: 10.1038/nature18964. [DOI] [PMC free article] [PubMed] [Google Scholar]
- Mefford HC, Sharp AJ, Baker C, Itsara A, Jiang Z, Buysse K, Huang S, Maloney VK, Crolla JA, Baralle D, et al. Recurrent rearrangements of chromosome 1q21.1 and variable pediatric phenotypes. N Engl J Med. 2008;359:1685–1699. doi: 10.1056/NEJMoa0805384. [DOI] [PMC free article] [PubMed] [Google Scholar]
- Meyer M, Kircher M, Gansauge MT, Li H, Racimo F, Mallick S, Schraiber JG, Jay F, Prufer K, de Filippo C, et al. A high-coverage genome sequence from an archaic Denisovan individual. Science. 2012;338:222–226. doi: 10.1126/science.1224344. [DOI] [PMC free article] [PubMed] [Google Scholar]
- Mi H, Huang X, Muruganujan A, Tang H, Mills C, Kang D, Thomas PD. PANTHER version 11: expanded annotation data from Gene Ontology and Reactome pathways, and data analysis tool enhancements. Nucleic Acids Res. 2017;45:D183–D189. doi: 10.1093/nar/gkw1138. [DOI] [PMC free article] [PubMed] [Google Scholar]
- Molnar Z, Metin C, Stoykova A, Tarabykin V, Price DJ, Francis F, Meyer G, Dehay C, Kennedy H. Comparative aspects of cerebral cortical development. Eur J Neurosci. 2006;23:921–934. doi: 10.1111/j.1460-9568.2006.04611.x. [DOI] [PMC free article] [PubMed] [Google Scholar]
- Nichols JT, Miyamoto A, Olsen SL, D’Souza B, Yao C, Weinmaster G. DSL ligand endocytosis physically dissociates Notch1 heterodimers before activating proteolysis can occur. J Cell Biol. 2007;176:445–458. doi: 10.1083/jcb.200609014. [DOI] [PMC free article] [PubMed] [Google Scholar]
- Nothaft F. Electrical Engineering and Computer Sciences. Berkeley, CA: University of California at Berkeley; 2017. Scalable Systems and algorithms for genomic variant analysis; p. 142. [Google Scholar]
- Nowakowski TJ, Bhaduri A, Pollen AA, Alvarado B, Mostajo-Radji MA, Di Lullo E, Haeussler M, Sandoval-Espinosa C, Liu SJ, Velmeshev D, et al. Spatiotemporal gene expression trajectories reveal developmental hierarchies of the human cortex. Science. 2017;358:1318–1323. doi: 10.1126/science.aap8809. [DOI] [PMC free article] [PubMed] [Google Scholar]
- Nuttle X, Giannuzzi G, Duyzend MH, Schraiber JG, Narvaiza I, Sudmant PH, Penn O, Chiatante G, Malig M, Huddleston J, et al. Emergence of a Homo sapiens-specific gene family and chromosome 16p11.2 CNV susceptibility. Nature. 2016;536:205–209. doi: 10.1038/nature19075. [DOI] [PMC free article] [PubMed] [Google Scholar]
- Nuttle X, Huddleston J, O’Roak BJ, Antonacci F, Fichera M, Romano C, Shendure J, Eichler EE. Rapid and accurate large-scale genotyping of duplicated genes and discovery of interlocus gene conversions. Nat Methods. 2013;10:903–909. doi: 10.1038/nmeth.2572. [DOI] [PMC free article] [PubMed] [Google Scholar]
- O’Bleness M, Searles VB, Varki A, Gagneux P, Sikela JM. Evolution of genetic and genomic features unique to the human lineage. Nat Rev Genet. 2012;13:853–866. doi: 10.1038/nrg3336. [DOI] [PMC free article] [PubMed] [Google Scholar]
- Peng Y, Leung HC, Yiu SM, Chin FY. IDBA-UD: a de novo assembler for single-cell and metagenomic sequencing data with highly uneven depth. Bioinformatics. 2012;28:1420–1428. doi: 10.1093/bioinformatics/bts174. [DOI] [PubMed] [Google Scholar]
- Pollen AA, Nowakowski TJ, Chen J, Retallack H, Sandoval-Espinosa C, Nicholas CR, Shuga J, Liu SJ, Oldham MC, Diaz A, et al. Molecular identity of human outer radial glia during cortical development. Cell. 2015;163:55–67. doi: 10.1016/j.cell.2015.09.004. [DOI] [PMC free article] [PubMed] [Google Scholar]
- Popesco MC, Maclaren EJ, Hopkins J, Dumas L, Cox M, Meltesen L, McGavran L, Wyckoff GJ, Sikela JM. Human lineage-specific amplification, selection, and neuronal expression of DUF1220 domains. Science. 2006;313:1304–1307. doi: 10.1126/science.1127980. [DOI] [PubMed] [Google Scholar]
- Prufer K, de Filippo C, Grote S, Mafessoni F, Korlevic P, Hajdinjak M, Vernot B, Skov L, Hsieh P, Peyregne S, et al. A high-coverage Neandertal genome from Vindija Cave in Croatia. Science. 2017;358:655–658. doi: 10.1126/science.aao1887. [DOI] [PMC free article] [PubMed] [Google Scholar]
- Prufer K, Racimo F, Patterson N, Jay F, Sankararaman S, Sawyer S, Heinze A, Renaud G, Sudmant PH, de Filippo C, et al. The complete genome sequence of a Neanderthal from the Altai Mountains. Nature. 2014;505:43–49. doi: 10.1038/nature12886. [DOI] [PMC free article] [PubMed] [Google Scholar]
- Quinlan AR, Hall IM. BEDTools: a flexible suite of utilities for comparing genomic features. Bioinformatics. 2010;26:841–842. doi: 10.1093/bioinformatics/btq033. [DOI] [PMC free article] [PubMed] [Google Scholar]
- Rabouille C. Pathways of Unconventional Protein Secretion. Trends Cell Biol. 2017;27:230–240. doi: 10.1016/j.tcb.2016.11.007. [DOI] [PubMed] [Google Scholar]
- Ramsay L, Marchetto MC, Caron M, Chen SH, Busche S, Kwan T, Pastinen T, Gage FH, Bourque G. Conserved expression of transposon-derived non-coding transcripts in primate stem cells. BMC Genomics. 2017;18:214. doi: 10.1186/s12864-017-3568-y. [DOI] [PMC free article] [PubMed] [Google Scholar]
- Rosenfeld JA, Traylor RN, Schaefer GB, McPherson EW, Ballif BC, Klopocki E, Mundlos S, Shaffer LG, Aylsworth AS q21.1 Study G. Proximal microdeletions and microduplications of 1q21.1 contribute to variable abnormal phenotypes. Eur J Hum Genet. 2012;20:754–761. doi: 10.1038/ejhg.2012.6. [DOI] [PMC free article] [PubMed] [Google Scholar]
- Stankiewicz P, Lupski JR. Structural variation in the human genome and its role in disease. Annu Rev Med. 2010;61:437–455. doi: 10.1146/annurev-med-100708-204735. [DOI] [PubMed] [Google Scholar]
- Steinberg KM, Schneider VA, Graves-Lindsay TA, Fulton RS, Agarwala R, Huddleston J, Shiryev SA, Morgulis A, Surti U, Warren WC, et al. Single haplotype assembly of the human genome from a hydatidiform mole. Genome Res. 2014;24:2066–2076. doi: 10.1101/gr.180893.114. [DOI] [PMC free article] [PubMed] [Google Scholar]
- Szamalek JM, Goidts V, Cooper DN, Hameister H, Kehrer-Sawatzki H. Characterization of the human lineage-specific pericentric inversion that distinguishes human chromosome 1 from the homologous chromosomes of the great apes. Hum Genet. 2006;120:126–138. doi: 10.1007/s00439-006-0209-y. [DOI] [PubMed] [Google Scholar]
- Van Dijck A, van der Werf IM, Reyniers E, Scheers S, Azage M, Siefkas K, Van der Aa N, Lacroix A, Rosenfeld J, Argiropoulos B, et al. Five patients with a chromosome 1q21.1 triplication show macrocephaly, increased weight and facial similarities. Eur J Med Genet. 2015;58:503–508. doi: 10.1016/j.ejmg.2015.08.004. [DOI] [PubMed] [Google Scholar]
- Varki A, Geschwind DH, Eichler EE. Explaining human uniqueness: genome interactions with environment, behaviour and culture. Nat Rev Genet. 2008;9:749–763. doi: 10.1038/nrg2428. [DOI] [PMC free article] [PubMed] [Google Scholar]
- Ying QL, Stavridis M, Griffiths D, Li M, Smith A. Conversion of embryonic stem cells into neuroectodermal precursors in adherent monoculture. Nat Biotechnol. 2003;21:183–186. doi: 10.1038/nbt780. [DOI] [PubMed] [Google Scholar]
- Zerbino DR, Johnson N, Juettemann T, Wilder SP, Flicek P. WiggleTools: parallel processing of large collections of genome-wide datasets for visualization and statistical analysis. Bioinformatics. 2014;30:1008–1009. doi: 10.1093/bioinformatics/btt737. [DOI] [PMC free article] [PubMed] [Google Scholar]
Associated Data
This section collects any data citations, data availability statements, or supplementary materials included in this article.
Supplementary Materials
(A) Identity between NOTCH2-related genes as measured over the alignable genomic region (blue) or the gene exons (pink). (B) DNA and amino acid sequence of human NOTCH2NL genes in exon 5, which is derived from NOTCH2 intron 4. (C) Immunoblot of mouse ESCs transfected with WT NOTCH2NL, or NOTCH2NL with ancestral ATAA inserted in exon 5. (D) Relative protein levels based on the immunoblot in panel C. (E) RT-qPCR analysis of the same samples for determination of transcript levels for each condition. (F) Alignment of the H9 assembled paratypes to GRCh38. Each paratype is colored as to whether a position aligns best to GRCH38 NOTCH2NLA, NOTCH2NLB or NOTCH2NLC. (G) Observed frequency of individuals with the indicated NOTCH2NLC and NOTCH2NLR copy number in the Simons Diversity Panel (n=266). (H) Schematic of linked-read sequencing and Gordian Assembler protocol using the 10x Genomics Chromium genome assay and oligo-capture to enrich for library fragments containing the desired genomic region.
Results of NOTCH2NL gene de novo assembly.
Details of NOTCH2NL-like genes identified by NOTCH2NL de novo assembly, BAC and WGS shotgun sequencing for chimp (A) and by BAC and WGS shotgun sequencing for gorilla (B). (C) Verification of fusion genes by RT-PCR on Chimp and Gorilla RNA. H = Human, C = Chimpanzee, G = Gorilla. (D) Immunoblot blot using an N-terminal NOTCH2 antibody (aa 25-255), comparing ectopic expression of human NOTCH2NLSh,T197I (left lane) to a Chimp NOTCH2NL-like gene lacking exon 2 (NOTCH2NL-like Δexon2) in mESCs (right lane). (E) Details of splice junctions of fusion genes and related open reading frames. Top rows show nucleotide sequence in fusion transcripts. Middle rows show peptides derived from these transcripts. Lower rows contain the orthologous human NOTCH2NL protein sequence.
(A) Summary violin plots indicating NOTCH2NL and NOTCH2 expression in various cell types. (B) NOTCH2NL paratype expression in undifferentiated hESCs and week 5 cortical organoids from bulk Illumina RNA-Seq. (C) Protein alignment of observed NOTCH2, NOTCH2NL and NOTCH2NLR paratypes based on our assembly results. Note that NOTCH2 sequence extends beyond what is shown in the alignment. A segregating variant in NOTCH2NLR is found at amino acid position 235.
(A) MA plot of RNA-sequencing data of mouse cortical organoids based on DESeq2 analysis. (B) Heatmap showing Z-scores of differentially expressed genes (p-adj < 0.05, DESeq2). (C) GO terms significantly associated with the upregulated genes in organoids ectopically expressing NOTCH2NLSh,T197I. Images are 1283 μm wide. (D) Violin plot showing size (length along the longest axis) of mouse cortical organoids based on brightfield pictures in (E). There was no significant difference (p < 0.05) in size between groups at any time point using a two-sided Kolmogorov-Smirnov test.
(A) Heatmap of expression levels for a selection of brain structure marker genes from hESC-derived cortical organoids at the indicated time points (left) and from human embryonic dorsal prefrontal cortex (DFC) samples at 8 pcw, 9 pcw, 12 pcw and 13 pcw, derived from the Allen Brain Atlas (http://www.brainspan.org) (right). w = week; pcw = post conception week; FPKM= fragments per kilobase of exon per million fragments mapped. (B) Schematic of strategy to generate NOTCH2NL-specific deletions using CRISPR/Cas9 and alignment of the two guide sequences used to NOTCH2NL-related sequences. (C) Brightfield images of H9* and H9ΔNOTCH2NL organoids at selected timepoints. Images are 4961 μm wide. (D) Violin plot showing quantification of organoid size over time measured by length of longest axis, * p < 0.05, ** p < 0.005, Kolmogorov-Smirnov test. (E) DAPI staining and SOX2 immunostaining. (F–G) Quantification of SOX2+ cell number and SOX2 intensity. n = 15 H9*, n = 15 H9ΔNOTCH2NL. (H) DAPI staining and CTIP2 immunostaining H9* and H9ΔNOTCH2NL organoid sections. (I–J) Quantification of CTIP2+ cell number and CTIP2 intensity, *** p < 0.0001, t-test. n = 13 H9*, n = 12 H9ΔNOTCH2NL. Scale bars in IF stainings indicate 100 μm.
(A–B) Investigation of co-immunoprecipitation of NOTCH2NL with PDGFRB and EGFR in 2 independent experiments. N2NL = NOTCH2NL. (C) NOTCH reporter assay to assess the effect of NOTCH2NL using either NOTCH1-GAL4, NOTCH2-GAL4 or NOTCH3-GAL4. U2OS cells transfected with EV, NOTCH2NLSh or NOTCH2NLSh,T197I in combination with the different NOTCH-Gal4 receptors, followed by co-culture on U2OS-JAG2 cells or U2OS control cells. n = 6 in one experiment. Student’s t-test with Holm-Bonferroni correction (* p < 0.05, ** p < 10−3, *** p < 10−5), error bars indicate SD. (D) Effects of different NOTCH ligands in reporter assay. U2OS cells transfected with NOTCH2NLSh or NOTCH2NLSh,T197I to assess NOTCH2-Gal4 mediated reporter activity. Here, transfected cells were co-cultured with either U2OS-JAG2 or OP9-DLL1 expressing cells. n = 6 in one experiment. Student’s t-test with Holm-Bonferroni correction (* p<0.05, ** p<10−3, *** p<10−5), error bars indicate SD. (E) U2OS cells transfected with EV, NOTCH2NLSh or NOTCH2NLSh,T197I and NOTCH2-Gal4 were seeded on recombinant DLL4 coated plates or gelatin/BSA control plates, instead of co-culture with ligand-expressing cells. n = 13 in 3 experiments. Two-way anova with Tukey’s HSD (* p < 10−4, ** p <10−8, *** p < 10−12), error bars indicate SEM.
Relative probe intensities from CNV-microarrays for 2 controls and 11 patients with reported 1q21.1 aberrations mapped to the GRCh38 1q21.1 assembly. Gray: normal, red: deletion, blue: duplication. Dark red/blue is high confidence deletion/duplication based on probe values, light red/blue are potentially part of the deletion/duplication.
Features of Simons VIP 1q21.1 samples.