

SUMMARY
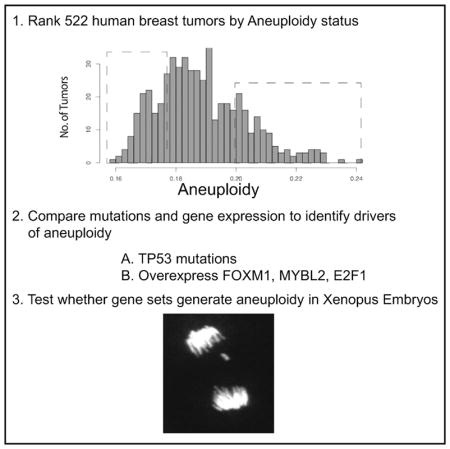
Although aneuploidy is found in the majority of tumors, the degree of aneuploidy varies widely. It is unclear how cancer cells become aneuploid or how highly aneuploid tumors are different from those of more normal ploidy. We developed a simple computational method that measures the degree of aneuploidy or structural rearrangements of large chromosome regions of 522 human breast tumors from The Cancer Genome Atlas (TCGA). Highly aneuploid tumors overexpress activators of mitotic transcription and the genes encoding proteins that segregate chromosomes. Overexpression of three mitotic transcriptional regulators, E2F1, MYBL2, and FOXM1, is sufficient to increase the rate of lagging anaphase chromosomes in a non-transformed vertebrate tissue, demonstrating that this event can initiate aneuploidy. Highly aneuploid human breast tumors are also enriched in TP53 mutations. TP53 mutations co-associate with the overexpression of mitotic transcriptional activators, suggesting that these events work together to provide fitness to breast tumors.
In Brief
Pfister et al. analyzed TCGA sequence data to identify drivers of aneuploidy in breast tumors. TP53 is mutated in most aneuploid tumors, and a large number of genes that control mitosis are overexpressed. The oncogenes E2F1, MYBL2, and FOXM1 that regulate mitotic transcription drive the overexpression of mitotic proteins to lower the fidelity of chromosome segregation.
INTRODUCTION
Aneuploidy is a hallmark of cancer and is high in breast tumors. Current estimates suggest that 90% of solid tumors contain whole-chromosome gains or losses (Danielsen et al., 2016; Roylance et al., 2011). The amount of aneuploidy between tumors and within a tumor is highly variable, suggesting that in addition to current breast cancer classifications, the degree of aneuploidy could be used to tailor treatments. However, classification of tumors requires either simple assays to measure aneuploidy in tumors or a deeper understanding of the mechanisms that drive aneuploidy.
The fidelity of mitosis is critical in maintaining a normal karyotype. Tumor cells sometimes lower the fidelity of mitosis by unknown mechanisms to generate chromosomal instability (CIN). It is estimated that ~45% of breast tumors develop CIN, while the rest remain karyotypically stable (Lingle et al., 2002; Roylance et al., 2011). CIN could drive tumor evolution by driving loss of heterozygosity (LOH) of tumor suppressors or by generating imbalances or structural changes that overexpress oncogenes. How tumor cells develop CIN is an important unanswered question. Mutations in mitotic proteins can drive aneuploidy in experimental systems; however, the major mitotic regulators are rarely mutated in cancer (Bakhoum and Compton, 2012; Bakhoum et al., 2009; Barber et al., 2008; Cahill et al., 1998, 1999). There are examples implicating known tumor suppressors and oncogenes in driving CIN; for example, the overexpression of cyclin D in mouse mammary tissue generates a CIN phenotype and late-onset tumors. In addition, the Mad2 spindle checkpoint protein is regulated by E2F and Rb1 and contributes to their potent oncogenic roles (Casimiro and Pestell, 2012; Schvartzman et al., 2011; van Deursen, 2007).
Mutations in the TP53 tumor suppressor are associated with aneuploid tumors (Clark et al., 1992; Kihana et al., 1992), but there is a debate about how it prevents aneuploidy. Current models suggest that mutating TP53 does not lower the fidelity of mitosis; however, cells that arrest in mitosis for an extended period can trigger tp53 responses that senesce cells (Thompson and Compton, 2010; Uetake and Sluder, 2010). In addition, the missegregation of chromosomes can also trigger a tp53 response, although there is a current debate regarding whether this is an immediate response or requires multiple cell divisions (Li et al., 2010; Santaguida et al., 2017; Soto et al., 2017; Thompson and Compton, 2010). Together, these data suggest that loss of tp53 function does not cause aneuploidy, but it is critical to allow aneuploid cells to remain proliferative.
Transcription factors that regulate the transcription of genes required for mitosis can be oncogenes or tumor suppressors (Fischer et al., 2016). It is unclear how they provide a selective advantage to tumor cells and drive tumor progression. The MuvB transcription complex binds cell cycle promoters and associates with MYBL2 and FOXM1 in S-phase/G2 to activate the promoters of a number of genes required for mitosis (Sadasivam et al., 2012). Both MYBL2 and FOXM1 are oncogenes that are overexpressed in a subset of breast tumors (Laoukili et al., 2007). E2F1 drives the transcription of cell-cycle genes in G1 phase, and it plays critical roles in the cell’s ability to initiate proliferation, which is a well-established role in tumor development. However, E2F1 also binds the promoters of many mitotic genes that are transcribed in G2, and it is unclear whether this also contributes to its oncogenic potential (Cao et al., 2011). Interestingly, loss of the tumor suppressor Rb1, which inhibits the E2F1 transcription factor, is associated with aneuploidy (Manning and Dyson, 2012). Meta-analysis of TP53 downregulated genes suggest that MYBL2, FOXM1, and E2F1 cell-cycle transcriptional regulators are important targets of the tp53 response (Fischer et al., 2016).
Measuring CIN requires knowing cell-to-cell variability in chromosome number and structure within a tumor or an assessment of the rate at which chromosomal changes occur. Therefore, it is more feasible to measure aneuploidy within tumors. Chromosomal changes can be measured by multigene fluorescent in situ hybridization (FISH), comparative genomic hybridization (CGH), and counting of anaphase lagging chromosomes, but these are difficult to perform on biopsies (Bakhoum and Compton, 2012; McGranahan et al., 2012). Therefore, neither CIN nor aneuploidy is routinely tested in the clinic. An algorithm to measure the consequences of CIN (changes in copy number of whole or parts of chromosomes of dominant cell populations within the tumor) was developed by comparing the overexpression of adjacent sets of genes along chromosomes in transcriptional array data (Carter et al., 2006). Carter et al. coined the term “functional aneuploidy” (FA) to distinguish the direct measurement of aneuploidy from CIN, which measures a rate of missegration. Several cell-cycle regulators were found in CIN tumors, and they identified a CIN signature based on the top 70 genes that were overexpressed in CIN tumors (CIN70) (Carter et al., 2006). High expression of the top 25 of these genes indicates poor prognosis in 12 studies and six different tumor types (Carter et al., 2006). This report supported a number of other studies where CIN was correlated with poor prognosis by either FISH analysis or CGH (Chandhok and Pellman, 2009). There is an opportunity to learn more about how CIN develops by segregating tumors by aneuploidy status in large well-annotated tumor databases such as The Cancer Genome Atlas (TCGA) (2012).
We developed a computational method for measuring aneuploidy and large structural changes of chromosomes from exome sequence data based on the heterogeneity of allele frequencies. This allowed us to segregate breast tumors from the TCGA datasets based on their amount of aneuploidy. We compared gene expression profiles from tumors with high and low FA to identify the mechanisms that generate highly aneuploid tumors. Our data confirm that there is a striking correlation between mutations in TP53 and FA in breast tumors (Pati et al., 2004; Sigurdsson et al., 2000). Although the genes encoding the proteins that segregate chromosomes were rarely mutated, they dominate the proteins that are specifically overexpressed in highly aneuploid tumors. In addition, regulators of mitotic transcription, MYBL2, E2F1, and FOXM1, were overexpressed in highly aneuploid breast tumors. We expressed these oncogenes in Xenopus embryos and followed the first divisions that are driven by transcription to show the sufficiency of the overexpression of these three oncogenes to lower the fidelity of mitosis in non-transformed vertebrate epithelial tissues. Our analysis of human breast tumors suggests a two-hit model for generating aneuploidy or CIN (although it cannot predict which hit comes first). First, the overexpression of the E2F1, FOXM1, and MYB2L oncogenes lowers the fidelity of chromosome segregation. Second, the loss of TP53 function enables cells that missegregate chromosomes to remain proliferative.
RESULTS
Measuring the Amount of Aneuploidy in Tumors from the TCGA by Calculating the Variance of Allelic Frequency Ratios
We developed a computational method to measure the amount of aneuploidy in tumors. The method measures changes in copy number of both whole chromosomes and large fragments of chromosomes, which we refer to as FA (“functional aneuploidy”), as originally termed in the CIN70 work (Carter et al., 2006). Aneuploidy changes alternate allele frequencies (AAFs), which can be measured using the exome sequence data available for TCGA samples. AAF in a tumor is a function of the chromosome number in each cell and the percentage of cells that are aneuploid (Figure S1). We developed a simple pipeline to visualize the FA within a single human breast tumor using publically available data from the TCGA consortium (Figure S2). We identified all heterozygous SNPs for each patient as defined by allele frequencies between 0.3 and 0.7 in the non-transformed exome sequence reads. For each heterozygous SNP, we calculate the AAF in the tumor by dividing the number of sequence reads that identify the alternate allele relative to the total number of reads aligning to that genomic region. We plot histograms of the number of SNPs per AAF for each patient’s tumor (Figure 1A; Data S1). Tumors with minimal FA retained a single peak in the histogram of heterozygous alleles that was normally distributed between AAFs of 0.3 and 0.7, as is seen in all matched samples. In contrast, the range of distributions broadens to include AAFs between 0.1 and 0.9 in tumors whose heterogeneity is driven by events that encompass large fragments or whole chromosomes, since these change the AAF for thousands of SNPs (Figures 1A, S1, and S2). A trimodal AAF distribution was found in many of the tumor plots, even though they lack alleles that were homozygous in the normal matched sample. These trimodal distributions arise from LOH events that convert SNP ratios that were heterozygous and close to 0.5 in the matched normal tissue to ratios that appear near homozygous in the tumor.
Figure 1. Measuring the Aneuploidy in Tumors by the Broadening of Allelic Frequency Ratios Calculated from Sequencing Data.

(A) 10 examples of FA histograms, each portraying the allelic frequencies of the heterozygous SNPs of human breast tumors. The number in the top right corner of each plot represents the FA ranking based on the broadening of the allele frequency peaks, with 1 being the widest peak and 510 the narrowest peak. Note that the lower the number, the broader the central peak of allelic frequencies.
(B) Replots of 5 of the tumors from (A) showing the allele frequency ratios along chromosome positions corresponding to coordinates in the GRCh37 genome (so each chromosome runs p arm to q arm). Note that the LOH events that separate the central peaks into two often span large segments of chromosomes or whole chromosomes, which is consistent with chromosome missegregation driving the LOH event.
(C) Plot of the frequency of whole (blue) or partial (red) chromosome LOH for each chromosome.
(D and E) The number of chromosomes with an LOH event in breast tumors correlates with the ranking (D) and FA score (E) of the tumors. R2 values were calculated by fitting to a second-order polynomial curve in Excel. Our method of LOH quantification is summarized in Figure S5.
The width of these AAF histograms correlates to the amount of FA in each tumor. We measured the width of the peaks for 522 breast tumors of various grades and types from the TCGA data-set by calculating the SD of the allele frequency distribution of all AAFs between 0.1 and 0.9 (Figure S3; Table S1). We decided on this simple approach because it is robust and assumption-free. We used these SDs to rank the tumors, assigning the tumor with the widest peaks (largest SD) as number 1, while the tumor with the narrowest peak (smallest SD) as number 522. Examples of 10 tumors and their relative ranks are shown in Figure 1A. Note that all the tumors ranked below 200 are qualitatively broader than plots generated from matched normal sequence data (compare Figure 1A to the corresponding plots of the normal samples in Figure S4), while most of the tumors ranked above 300 were similar to plots generated from non-tumor sequence datasets (Figure S4). Each of the tumors ranked below 200 has its own characteristic shape and extent of AAF peak broadening, which represents the amount of tumor heterogeneity. There is a continuum of AAF distributions (Figure S3). The histograms of the ~115 highest FA scored tumors have both broad central peaks as well as outer peaks from LOH (Data S1). Between ~115 and ~226, there are broad central peaks only. In the tumors ranked from 227 to 320, the peaks transition between noticeable broadening and peaks that appear similar to the matched normal samples. The final 200 tumors (321–522) resemble the matched control plots, suggesting that they have low amounts of FA.
For each tumor, we also generated complementary plots that show the chromosome position of each SNPs AAF score (Figures 1B and S2; Data S2). LOH events generate areas with few SNPs in the 0.5 AAF regions, with corresponding dense areas of SNPs scoring closer to zero and one. The AAF frequencies of most SNPs are contiguous along whole chromosomes or large chromosome regions, confirming that aneuploidy and not random point mutations drives the redistribution of AAF frequencies in tumor samples (Figure 1B). We quantified the number of chromosomes with a region of LOH that spanned a large region of a chromosome (scoring method is outlined in Figure S5A; see also Figure 1C). Our analysis confirmed the high percentages of LOH in chromosomes 11, 16, and 17 found in breast tumors (Lindblom et al., 1993; Nagayama and Watatani, 1993), which validates our analysis (Figure 1C). We also found large amounts of LOH in chromosomes 1 and 8. They were then injected with either control RNA or the RNA encoding the three transcription factors (FOXM1, E2F1, and MYBL2) in two of the four cells of Stage 3 embryos (Figures 5E and 5F). The tumors ranked lower than ~200 showed a stronger correlation of chromosomes with LOH events than the other 322 tumors, which is consistent with about 40% of breast tumors having strong CIN. Whole-chromosome events that are expected from missegregation of chromosomes during mitosis were more strongly represented in the tumors ranked 1–200 (R2 = 0.66; Figure S5B), while they were rare in the tumors ranked from 300 to 522. LOH along large regions of chromosomes, but not spanning the entire chromosome, had similar distributions but were not as tightly linked to our ranking (R2 = 0.53; Figure S5C). Together, these analyses confirm that our method can segregate tumors by the amount of aneuploidy of the cells within the tumor and also that missegregation of whole chromosomes contributes to the FA of high-ranking tumors.
Figure 5. Overexpression of hE2F1, hFOXM1, and hMYBL2 Is Sufficient to Generate CIN Phenotypes in Xenopus Embryos.

(A) 2-cell-stage embryos were injected with either RNA containing stop codon after 33 nt (−) or functional hE2F1, hFoxM1, and hMybL2 (+), as detected by western blot.
(B) Representative images of TOPRO-stained normally dividing animal caps and two of the most common CIN phenotypes seen in triple-overexpressing embryos. Yellow arrows indicate a lagging chromatid; blue arrow indicates a micronucleus.
(C and D) Quantification of lagging chromatids (C) and micronuclei (D) in control, triply overexpressing, or singly injected embryos through fixed-animal cap analysis.
(E) Representative time-lapse series of an animal cap expressing H2B:GFP with normally dividing control cells (co-injected with Ruby-Dextran) or CIN-like phenotypes seen in neighboring triple-overexpressing cells. Blue arrows indicate abnormal divisions seen as lagging chromatids and micronuclei. Time points chosen to show anaphase events.
(F) Quantification of lagging chromatid events as seen in time-lapse videos of control embryos, triply overexpressing embryos, and overexpression of only xMYBL2. Full supplemental videos are available upon request. Scale bars represent 40 μm in all images. **p < 0.01; ***p < 0.001; ****p < 0.0001, one-way ANOVA and Bonferroni post-test statistics,. Error bars represent ±SEM. 8 hpf, 8 hr post-fertilization.
Identification of the Mechanisms Generating FA in Breast Tumors
We used the Variant Annotation, Analysis and Search Tool (VAAST) (Yandell et al., 2011) to identify the genes that had higher numbers of mutations in the 100 tumors with the highest FA score compared to the 100 with the lowest FA score (dotted boxes in Figure 2A). The average number of chromosomes with an LOH event (whole or partial) in the two groups were 15.6 and 0.97, respectively, demonstrating that we are segregating tumors by FA status (Figure 2B). Mutations in TP53 were highly enriched in the high FA tumors (p = 1.5 × 10−140; Figure 2C). TP53 mutations have previously been connected to aneuploidy in tumors, validating our method (Li et al., 2010; Thompson and Compton, 2010). The strong association is consistent with a growing body of literature arguing that tp53 arrests non-transformed cells in G1 following a prolonged mitotic arrest or the missegregation of a chromosome (Hayashi et al., 2012; Jeon and Lee, 2013; Krzywicka-Racka and Sluder, 2011; Uetake and Sluder, 2010). Forty of the 50 tumors with the most FA contained TP53 mutations. Interestingly, the percentage of tumors with TP53 mutations decreased as a function of FA rank for the 250 tumors with the most FA (linear-by-linear association test, test statistic = 30.21842; p = 3.86 × 10⁻⁸), and then there was poorer correlation in the following 246 tumors that are likely to have low FA status (test statistic = 1.222109; p = 2.689×10⁻¹) (Figure 2D) (Agresti, 2007). There were no other genes strongly associated with FA, although mutations in four other genes, including spindle regulator cytoplasmic dynein (heavy chain), were statistically significant. However, the relevance of these genes is unclear, as they tend to be large genes and the enrichment in FA tumors was not very strong. Activating mutations in PIK3CA (p = 3×10⁻³), followed by mutations in MAP3K1 (p = 8×10⁻³), were enriched in the low-FA tumors, although this is probably driven by the predominance of these mutations in luminal tumors that were enriched in the low-FA tumor group (Figure 6). Thus, the only gene whose mutation was strongly enriched in high-FA tumors was TP53.
Figure 2. Identification of Genes Mutated in Aneuploid Tumors.

(A) Histogram showing the distribution of FA scores of the 522 analyzed human breast tumors. The boxes highlight the distributions of the 100 highest and lowest scoring tumors.
(B) The number of chromosomes with LOH events was compared in the 100 highest and lowest aneuploid tumors to demonstrate that the analysis stratifies tumors by aneuploid status. The p value was generated by Welch two-sample t test in R.
(C) All genes significantly mutated in the high aneuploid tumor sets were identified by comparing the sequence data from the 100 highest and lowest ranked tumors using the VAAST program. The p values were calculated by VAAST.
(D) p53 mutations are correlated with functional aneuploidy in the 250 top ranked tumors.
Figure 6. Characterization of the Tumors Scored as High and Low FA.
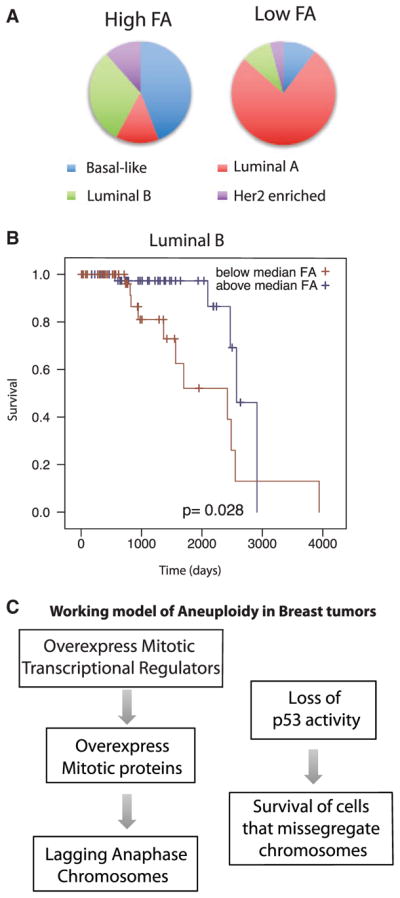
(A) Tumor subtype distribution of the 100 tumors scored as the highest FA and lowest FA.
(B) Kaplan-Meier curve demonstrating that FA status indicates good prognosis for the luminal B subtype of tumors.
(C) Our two-hit model for the generation and propagation of functional aneuploidy; note that we do not indicate which event takes place first.
We also compared the RNA expression data to identify the genes that were overexpressed in FA tumors. All genes were ranked from 1 being the most overexpressed in the high-FA group to ~18,000 being the most overexpressed in the low-FA group. We refer to the Breast FA100 gene set (BrFA100; Table S2) as the 100 genes the were the most overexpressed in the high-FA tumors. The BrFA100 contained 30 genes that were also in the CIN70 list generated by independent methodology in multiple tumor types (Figure 3A; Table S3). Gene ontology (GO) analysis demonstrated that the BrFA100 is highly enriched in genes involved in the cell cycle, as the top two GO terms were cell cycle (p = 5.3 × 10−81) and cell-cycle phase (p = 1.3 × 10−77). “Cell cycle” is a broad GO term set that consists of 1,355 genes, so we asked which stage of the cell cycle was best represented. Twenty of the top 30 GO terms represented mitotic segregation of chromosomes, suggesting that genes controlling mitosis were driving this gene signature (Table S4). We ran the BrFA100 gene sets through the STRING database, which uncovered a highly noded network of 58 critical mitotic regulators (Figure 3B), including nine mitotic kinases (AURKA, AURKB, TTK/MPS1, GSG2/Haspin, CHEK1, NEK2, BUB1, CDK1, and MELK) and 13 kinetochore proteins (Table S2). There was also a subset of cell-cycle regulators, but these were dominated by the proteins that control the entry into mitosis and contained proteins such as Cyclin B2/CCNB2, Cyclin A2/CCNA2, CDK1, CKS1B, CDC25A, and CDC25C. Finally, there were 17 genes associated with DNA replication (DNA Rep), and 14 in DNA repair. These data corroborate the CIN70 study (Carter et al., 2006) and greatly extend the idea that aneuploidy (and, likely, CIN) is associated with overexpression of mitotic proteins.
Figure 3. Regulators of Mitosis Are Overexpressed in Aneuploid Breast Tumors.

The 100 most overexpressed genes in the high-FA-ranking tumors (BrFA100) were identified by comparing RNA expression data of the 100 high-FA and low-FA tumors.
(A) The overlap of the BrFA100 genes, the CIN70 list, and genes present in 3–6 previously published proliferation signatures (Multiple Proliferation Signatures).
(B) STRING diagrams (http://string-db.org) of the BrFA100 list show a highly noded grouping of mitotic regulators, mitotic cell-cycle genes, and DNA replication and repair proteins. The top 10 GO terms of the BrFA100 list shows a strong enrichment of cell-cycle genes, which is driven by a high M-phase gene enrichment (Table S4).
(C) Specifically, we plotted the relative fold enrichment of genes in the chromosome segregation GO term in the BrFA100, CIN70, and six different proliferation signatures.
See also Table S4.
Fifty-six of the BrFA100 genes are found in at least 3 of 6 proliferation signatures (Figures 3A and S6A) (Cohen et al., 2013; Fischer et al., 2016). We found that most proliferation signatures contained about 10-fold enrichment of mitotic regulators, while the CIN70 contained ~18-fold enrichment and the BrFA100 contained over 25-fold enrichment (Figure 3C). We conclude that aneuploid tumors overexpress a large number of genes associated with proliferation, but there is stronger enrichment for genes involved in mitosis.
Mitotic Transcriptional Regulators Drive the Overexpression Patterns Seen in High-FA Tumors
To determine the mechanism of overexpressing the mitotic genes, we asked whether any transcription factors were overexpressed in high-FA tumors. There were 8 transcription factors in our 100 proteins, and 6 of these control the cell cycle (MYBL2, FOXM1, E2F1, RBL1/p107, E2F7, and E2F8). Specifically, the oncogenes MYBL2, FOXM1, and E2F1 (ranked 9th, 10th, and 38th) were of interest due to their roles as master transcriptional activators of genes required for mitosis (Cao et al., 2011; Grant et al., 2013; Sadasivam and DeCaprio, 2013; Sadasivam et al., 2012). Combining the target genes of the DREAM, MMB, and FoxM1/MuvB transcriptional complexes accounts for 92 of the 100 genes in the BrFA100 (Figure 4A) (Fischer et al., 2016). Overexpression of FOXM1, MYBL2, and E2F1 mRNA (z > 2) correlated with FA scores (Figure 4B). Overexpression of these three genes was correlated with FA status in all four breast tumor subtypes (Figure S5D).
Figure 4. Mutations in TP53 and Overexpression of E2F1, MYB2L, and FOXM1 Are Highly Associated in Breast Tumors.

(A) The overlap of BrFA100 and target genes of mitotic transcriptional regulation complexes DREAM, FoxM1-MuvB/MMB, and Rb-E2F.
(B) The percentage of tumors in each group of 50 (ranked by aneuploid status) with 1, 2, or 3 of the transcription factors MYBL2, FOXM1, and E2F1.
(C) Venn diagram of the overlap of the BrFA100 with the top 400 genes downregulated by TP53 (p53 expression score of less than −10, as listed in Fischer et al., 2016).
(D) Venn diagram to show the overlap of ChIP-seq datasets for E2F1, MYB2L, and FOXM1 with the BrFA100 list. Gene lists are shown in Table S3.
(E) Association p values of TP53, E2F1, MYB2L, and FOXM1 as individual pairs. p values were obtained through Fisher exact tests with Benjamini-Hochberg multiple test corrections.
(F) The percentage of tumors in each group of 50 that have a TP53 mutation and 1, 2, or 3 overexpressed transcription factors.
(G) Association of TP53, MYBL2, E2F1, and FOXM1 in 960 human breast tumors of the TCGA. Plots were generated at the cBioPortal (www.cbioportal.org). (G’) The percentage of the 960 tumors with a TP53 mutation and either an amplification (AMP) of the gene as defined by a positive GISTIC score or an upregulation (Up) of the mRNA as defined by a Z score > 2. TF, transcription factor.
See also Table S3.
There was also strong overlap of the BrFA100 with genes identified in a meta-analysis as downregulated by TP53 (Figure 4C). The drivers of this gene signature were shown to be DREAM, FOXM1, and MMB. The BrFA100 contained 91 of the top 486 genes that were overexpressed after multiple treatments that downregulated tp53 function.
We mined publically available chromatin immunoprecipitation followed by sequencing (ChIP-seq) datasets to examine whether MYB2L, FOXM1, and E2F1 bind the promoters of the genes in the BrFA100 lists (Cao et al., 2011; Grant et al., 2013; Sadasivam et al., 2012). At least one of the three transcription factors binds to the promoter of 82 of the 100 genes, and 49 of the BrFA100 genes are bound by at least two of the transcription factors (Figures 4D and S6B; Table S3). Twenty-two of the genes bound all three transcription factors, including the three most overexpressed proteins TPX2, Plk1, and Aurora B/AURKB. For this analysis, we used a subset of the FOXM1 ChIP-seq data that was listed as the 270 “high-confidence” binding regions; interestingly, they contained 35 of the BrFA100 genes (exact hypergeometric probability, p < 9×10⁻¹⁸). These data suggest that the overexpression of the three transcription factors could drive the overexpression of mitotic proteins that we find overexpressed in functionally aneuploid breast tumors. Interestingly, E2F1 and FOXM1 were members of the 16 genes that were not bound by any of the transcription factors, while MYBL2 was only in the E2F1 ChIP-seq set. This suggests that the mechanisms that overexpress these oncogenes are independent of the events that cause the expression of the bulk of the BrFA100 list.
We conclude that the BrFA100 signature can be explained by the overexpression of the mitotic transcriptional regulators MYBL2, FOXM1, and E2F1 and that this correlation is stronger (91/100 genes) than general proliferation signatures (56/100).
A Two-Event Model for Aneuploidy in Breast Tumors
To determine whether TP53 works in conjunction with the mitotic transcriptional regulators to generate FA, we asked whether the tumors that contained mutated TP53 also overexpressed E2F1, FOXM1, and MYBL2. The co-association of every combination of TP53 mutations and the overexpression of MYBL2, FOXM1, or E2F1 are highly significant and provided in Figure 4E. This association suggests that these genes work together to provide an advantage to tumor progression.
Overall, our bioinformatics suggest a two-event model for the generation of aneuploidy in breast tumors. First, the overexpression of the oncogenes MYBL2, E2F1, and FOXM1 is the causative event of the chromosome missegregation, perhaps because this event leads to the transcriptional overexpression of a large number of mitotic regulators. Second, loss of tp53 is required, which, we postulate, allows the cells that missegregate chromosomes to remain proliferative as suggested by the literature (Hayashi et al., 2012; Jeon and Lee, 2013; Krzywicka-Racka and Sluder, 2011; Santaguida et al., 2017; Uetake and Sluder, 2010). To estimate the number of aneuploid tumors that could be explained by this two-hit model, we ranked the percentages of tumors that had both TP53 mutations and overexpressed the transcription factors according to our FA scores (Figure 4F). Sixty percent of the 50 top tumors could be explained by this two-hit model and the co-occurrence of TP53 mutations, and overexpression of the mitotic transcription factors correlated strongly with FA score. In Figures 4G and 4G’, we visualize the co-occurrence in over 900 breast tumors. This analysis also shows the co-occurrence of TP53 mutations and overexpression of one of the three transcription factors in 14.5% of all breast tumors (Figure 4G’). It makes the point that these events may have oncogenic potential beyond generating aneuploidy, since there is a small set of tumors that either have TP53 mutated without overexpressing mitotic transcriptional regulators or that overexpress either MYBL2, FOXM1, or E2F1 without mutating TP53. Overall, our data suggest that 39.6% of the 100 most aneuploid breast tumors become aneuploid because they lose tp53 function and overexpress one of the transcriptional regulators of mitosis (Z > 2). If we increase the stringency to requiring overexpression of 2 of the 3 transcription factors, then approximately 25.4% of highly aneuploid tumors would be explained by the model.
Overexpression of MYBL2, E2F1, and FOXM1 Generates Lagging Anaphase Chromosomes in Non-transformed Vertebrate Epithelial Tissues
We developed a system to connect the results of our bioinformatics approach to missegregation of chromatids in mitosis. Our goal was to visualize the first mitosis after overexpression of FoxM1, E2F1, and MybL2 in a non-transformed vertebrate tissue. To do this, we used early embryos of the frog Xenopus laevis. RNA encoding transcription factors can be injected into embryos and translated into proteins; however, they are not active during the first 12 division cycles that lack transcription (Newport and Kirschner, 1982). After this time (~8 hr post-fertilization), the embryo undergoes the mid-blastula transition (MBT) when transcription begins. Therefore, the immediate action of transcription factors can be measured by visualizing the mitoses of divisions directly after MBT (stages 8 and 9).
We injected mRNA encoding the human MYBL2, E2F1, and FOXM1 transcription factors into two-cell Xenopus embryos. For controls, we injected mRNAs with a stop codon inserted after 10 amino acids of each transcription factor. Western blot analysis of post-MBT embryo lysates confirmed the expression of hMYBL2, hE2F1, and hFOXM1 in the embryos injected with the functional RNAs (Figure 5A). The epithelial tissue above the blastocoel (animal cap) can be easily dissected from the embryos without affecting normal cell divisions, providing an opportunity to collect relatively flat tissue from multiple embryos. The animal cap tissue from FOXM1, MYBL2, and E2F1 (triple)-over-expressing or control RNA-expressing embryos was fixed, stained with the DNA stain (TOPRO-3), and imaged on a confocal microscope to visualize the chromosomes (representative images are shown in Figure 5B). Individual chromatids between segregating anaphase chromosome masses (lagging chromatid) could be detected in 25% of all anaphase events in triple-over-expressing embryos, compared to less than 5% in singly injected control RNA (30 pg) and 8% in embryos injected with three times the amount of control RNA (100 pg) (Figure 5C). In embryos where RNA for only one of the transcription factors was injected, there was an increase in the number of lagging chromatids over controls, but in each case, these values were also significantly lower than the triple-overexpressing clutchmates. To further characterize these mistakes in mitosis, we also examined micronuclei in fixed animal cap tissue. Anaphase lagging chromosomes often become micronuclei in the subsequent interphase, because nuclear envelope formation happens before the lagging chromatid joins the mass of segregating chromatids (Zhang et al., 2013). Approximately 3.5% of triple-overexpressing cells had visible micronuclei, while the single-overexpressing embryos had micronuclei in 1.5%–2% of cells. Again, the triple-injected embryos displayed a significantly higher percentage of micronuclei than both controls or singly overexpressing clutchmates (Figure 5D).
To confirm that the lagging chromatids and micronuclei were caused by missegregation of chromosomes, we performed time-lapse confocal microscopy of animal caps directly after MBT. Moreover, we designed an experiment where the controls and triple-injected cells could be visualized in the same animal cap to control for frog-to-frog variability. In these experiments, embryos were injected at the one-cell stage with RNA for a GFP-tagged histone H2B to follow mitotic events. They were then injected with either control RNA or the RNA encoding the three transcription factors (FOXM1, E2F1, and MYBL2) in two of the four cells of stage 3 embryos (Figures 5E and 5F). Fluorescent dextran was used to label the cells that were either control or triply overexpressing, and there was no experimental variability if the dextran was injected into control or triple-overexpressing cells (data not shown). After MBT, this treatment will generate areas of the animal cap that contain both control and triply overexpressing cells that can be distinguished by the fluorescent dextran. More than 20 videos of animal caps from separate in vitro fertilizations were made and analyzed. Again, we saw a significantly higher level of abnormal divisions in the triply over-expressing half of animal caps, compared to the internal control (Figure 5E). Embryos overexpressing only one of the transcription factors—in this case, the Xenopus version of MybL2—showed an intermediate value of lagging chromatids during mitosis, similar to the trend seen in fixed cap analysis (Figure 5F). We conclude that overexpression of three oncogenic transcription factors in human breast tumors was sufficient to generate aneuploidy in an nontransformed vertebrate epithelial tissue.
We also used the Xenopus system to determine whether preventing new translation of tp53 lowered chromosome segregation. However, this analysis is complicated by the fact that tp53 protein is maternally loaded, and the protein is required for early embryonic development (Wallingford et al., 1997). We created two Morpholino oligonucleotides specific to Xenopus TP53. While injection of either Morpholino had little effect on protein levels at stage 9, we saw a significant decrease in protein levels by later stages (Figure S6C). We find that there is no increase in the number of lagging chromosomes or micronuclei upon injection of TP53 Morpholino at stage 9 (Figure S6D). These data are consistent with a large body of literature that suggests TP53 mutations do not directly lower the fidelity of mitosis (Santaguida et al., 2017; Soto et al., 2017; Thompson and Compton, 2010; Uetake and Sluder, 2010).
Segregation of Human Breast Tumors by FA Status
Tumors of all four subtypes of breast cancer (basal-like, luminal A, luminal B, and Her2 enriched) were represented in the 522 tumors analyzed by our computational method. All four of the tumor subtypes contained both high- and low-FA-score tumors (Figure 6A). Over one third of the high FA tumors were of the Basal-like subtype, compared to the low-FA group, which only contained 8 basal tumors. Luminal A tumors dominated the low FA group. These data suggest that aneuploidy could be used to further stratify tumors beyond current diagnostics.
It has been previously suggested that CIN is a predictor of prognosis. We generated Kaplan-Meier plots to compare the 200 highest and lowest FA-scoring tumors for all four tumor types. We did not have enough statistical power to predict diagnosis for most tumor subtypes. However, women with luminal B tumors fared better if they had high FA scores (Figure 6B). The concept that patients with high levels of CIN have improved prognoses is consistent with a number of previous studies (Birkbak et al., 2011; Roylance et al., 2011, Zhang et al., 2016). We conclude that our algorithm to measure FA has prognostic value for breast tumors.
DISCUSSION
We have used a bioinformatic approach to segregate breast tumors in the TCGA that are highly aneuploid (both whole-chromosome loss and loss of large fragments of chromosomes) from breast tumors of more normal ploidy. TP53 was the only protein whose loss of function was strongly associated with the high-FA tumors. In addition, our analysis argues that the overexpression of oncogenes E2F1, FOXM1, and MYBL2, which we find overexpressed specifically in high-FA tumors, is sufficient to lower the fidelity of chromosome segregation in vertebrate epithelial tissues. The frequency of anaphase lagging chromosomes was consistent with those predicted for optimal tumor progression by CIN (Bakhoum and Compton, 2012). Not only are E2F1, FOXM1, and MYBL2 oncogenes, but they also have a role in non-transformed tissues as master controllers of the mitotic transcriptional program. In fact, E2F1, FOXM1, and MYBL2 bind the promoters of a large percentage of the mitotic regulators that we also found overexpressed in high-FA breast tumors.
Bioinformatic Methods to Measure FA
There is an unmet need for a simple reliable measurement of aneuploidy or CIN status for tumors (McGranahan et al., 2012; Zasadil et al., 2016). Our data suggest that a combination of TP53 mutation and overexpression of MYBL2, FOXM1, and E2F1 may be diagnostically relevant. In addition, as tumor sequencing becomes more prevalent, our bioinformatic method provides the basis for a simple diagnostic test to measure FA in a human tumor.
Our FA algorithm is an improvement in several ways on the CIN70 algorithm, which has been useful and is the only available technology to measure FA from genomic data (Carter et al., 2006). First, our scoring is based on a direct measurement of genome-wide tumor variation, not simply on correlations of gene expression data. Second, the increase in publically available datasets allowed us to focus on mechanisms for breast tumors where the CIN70 work required the mixing of tumor types. Our methodology should be generalizable to other tumor types. Third, we generated not only a score for approximating CIN but also two plots that provide great insight into the subtleties and complexities of heterogeneity within the tumor. Fourth, it is compatible with next-generation sequencing, which will be the future of personalized medicine.
A Model for Generation of Aneuploidy in Breast Tumors
Our data support a two-event model for generation of FA (Figure 6C). First, TP53 is a CIN suppressor, and our data support previous findings that the loss of tp53 function is strongly associated with aneuploidy in tumors (Li et al., 2010; Thompson and Compton, 2010). Second, overexpression of mitotic transcriptional regulators drive the missegregation of chromosomes in mitosis. While it is unlikely that this is the only mechanism to generate CIN, we calculate that this two-step mechanism may act in about 40% of the most aneuploid breast tumors and 15% of all breast tumors.
Our data are consistent with a growing body of literature reporting that an important role of tp53 is to trigger senescence or cell-death pathways after the missegregation of chromosomes (Hinchcliffe et al., 2016; Lambrus et al., 2015; Orth et al., 2012; Uetake and Sluder, 2010), and we suggest that aneuploidy or CIN usually develops after this pathway is lost. The strong co-association of TP53 mutations with the overexpression of MMB/FOXM1 mitotic regulators has also been previously shown; in fact, MMB/FOXM1 drives the transcriptional responses that are found after tp53 loss. Our data suggest that the evolutionary advantage of this co-association would be the generation of genomic instability through CIN, although it is formally possible that the MMB/FOXM1 mitotic regulators provide a function that allows tumors to survive the loss of tp53 without causing aneuploidy. To distinguish between these models, we tested whether overexpression of MYBL2, FOXM1, and E2F1 generated CIN phenotypes. In untransformed Xenopus embryonic tissue, mitotic transcriptional regulator overexpression was sufficient to generate anaphase lagging chromatids at rates comparable to those of CIN in tumors, providing a strong causal link between mitotic transcriptional regulation and CIN.
We don’t know how E2F1, FOXM1, and MYBL2 overexpression lowers the fidelity of mitosis, but the simplest model is that they drive the overexpression of a large number of mitotic regulators, which lowers the robustness of mitotic pathways. For example, the proteins involved in the resolution and prevention of merotelic kinetochore microtubule attachments (Aurora B, Borealin, Survivin, Bub1, MPS1, Plk1, Sgo1, and Ndc80) are all regulated by E2F1 and FOXM1/MMB and overexpressed in human CIN breast tumors, which could be the underlying cause of lagging anaphase chromatids. It is also consistent with recent studies that FOXM1 is a central regulator of kinetochore gene transcription and the fact that centromere gene expression can predict patient outcomes (Banerjee et al., 2014; Laoukili et al., 2005; Thiru et al., 2014; Zhang et al., 2016).
We suggest that the Xenopus animal cap system is an ideal system to assay the development and the consequences of FA because it combines (1) very low background missegregation rates with (2) outstanding observation of mitotic events by microscopy and (3) the employment of a non-transformed vertebrate tissue that would become the skin and neural tissues of a frog, if not manipulated; (4) the ability to rapidly manipulate these events by loss- and gain-of-function methodologies; and (5) the ability to quickly replace loss-of-function experiments with mutants.
EXPERIMENTAL PROCEDURES
Further details of all procedures can be found in the Supplemental Experimental Procedures.
Xenopus Embryo Injection and Analysis
Capped RNA was diluted to 25 pg/nL at 2.5-nL injections, with a final concentration of 30–100 pg per embryo. Animal caps were cut and visualized at stages 8–9. Embryos were injected with transcription factor (TF)-specific or control RNAs (dual stop codons 10 amino acids downstream of the translational start site); for live-cell imaging, embryos were coinjected with nuclear label-H2B:GFP in PCS2+ vectors as described earlier in the text.
Scoring of FA from Exome Sequencing Data
The FA score was calculated from tumor exome sequencing data by measuring the variant allele frequency (also known as “allele balance”) distribution at heterozygous germline SNPs, where heterozygous germline SNPs are defined by variant calls and genotypes in the matched normal data. The variant allele frequency (VAF) of each SNP is calculated by dividing the number of reads containing the alternate SNP allele by the total number of reads that align to that base in the reference genome. In high-FA tumors, numerous LOH and CNA events will cause VAF deviations at large numbers of SNPs across the entire genome, resulting in markedly broader VAF distributions that are obvious from genome-wide VAF histograms (as in Figure 1). The FA score is derived from the SD of VAF measurements in the tumor exome sequencing data across all heterozygous germline SNPs.
Quantification and Statistical Analysis
All statistical tests are specified in the text or figure legends, and details can be found in the Supplemental Experimental Procedures.
Supplementary Material
Highlights.
The authors analyze TCGA sequence data to identify highly aneuploid breast tumors
Mitotic transcriptional regulators and target genes are overexpressed in aneuploid tumors
Mutations in TP53 co-associate with the overexpression of mitotic transcription factors
Overexpression of MYBL2, E2F1, and FOXM1 immediately reduces mitotic fidelity in tissues
Acknowledgments
This work was initiated by a pilot project from the University of Virginia Cancer Center (P30 CA044579). K.P. was supported by grants DR03437, R01 GM099108, R01 GM118798, T32 CA009109, and T32 GM008136. P.T.S. was supported by grant HD069352 from the NICHD and grants R01 GM118798 and DR03437 from the Charlottesville Women’s Four Miler. We acknowledge the Keck Center for Cellular Imaging for the usage of the Zeiss 780 confocal microscope (OD016446). An NIH New Innovator Award (DP2OD006493-01) and a Burroughs Welcome Fund Career Award funded I.M.H., C.C., and R.A.C. Full supplemental videos are available upon request.
Footnotes
DATA AND SOFTWARE AVAILABILITY
Contact Ira Hall (ihall@wustl.edu) for MATLAB code to generate allele frequency plots.
Supplemental Information includes Supplemental Experimental Procedures, six figures, four tables, and two data files and can be found with this article online at https://doi.org/10.1016/j.celrep.2018.04.102.
DECLARATION OF INTERESTS
The authors declare no competing interests.
AUTHOR CONTRIBUTIONS
P.T.S. oversaw all aspects of the project; performed the analysis in Figures 1C–1E, 2, 3, 4, and 6A; and wrote the paper with K.P. I.M.H., R.A.C., and C.C. performed the bioinformatic analysis for the original CIN screen and generated the plots in Figure 1, Data S1, and Data S2. They also performed the analysis to identify the genes mutated and overexpressed in the CIN tumor set. K.P. and J.L.P. performed the Xenopus embryo experiments for Figure 5. M.J.G. and Y.L. generated Figures 6B and S5D. P.S. and R.K. provided funds to support K.P.
References
- Agresti A. An Introduction to Categorical Data Analysis. 2. Wiley-Interscience Publications; 2007. [Google Scholar]
- Bakhoum SF, Compton DA. Chromosomal instability and cancer: a complex relationship with therapeutic potential. J Clin Invest. 2012;122:1138–1143. doi: 10.1172/JCI59954. [DOI] [PMC free article] [PubMed] [Google Scholar]
- Bakhoum SF, Genovese G, Compton DA. Deviant kinetochore microtubule dynamics underlie chromosomal instability. Curr Biol. 2009;19:1937–1942. doi: 10.1016/j.cub.2009.09.055. [DOI] [PMC free article] [PubMed] [Google Scholar]
- Banerjee B, Kestner CA, Stukenberg PT. EB1 enables spindle microtubules to regulate centromeric recruitment of Aurora B. J Cell Biol. 2014;204:947–963. doi: 10.1083/jcb.201307119. [DOI] [PMC free article] [PubMed] [Google Scholar]
- Barber TD, McManus K, Yuen KW, Reis M, Parmigiani G, Shen D, Barrett I, Nouhi Y, Spencer F, Markowitz S, et al. Chromatid cohesion defects may underlie chromosome instability in human colorectal cancers. Proc Natl Acad Sci USA. 2008;105:3443–3448. doi: 10.1073/pnas.0712384105. [DOI] [PMC free article] [PubMed] [Google Scholar]
- Birkbak NJ, Eklund AC, Li Q, McClelland SE, Endesfelder D, Tan P, Tan IB, Richardson AL, Szallasi Z, Swanton C. Paradoxical relationship between chromosomal instability and survival outcome in cancer. Cancer Res. 2011;71:3447–3452. doi: 10.1158/0008-5472.CAN-10-3667. [DOI] [PMC free article] [PubMed] [Google Scholar]
- Cahill DP, Lengauer C, Yu J, Riggins GJ, Willson JK, Markowitz SD, Kinzler KW, Vogelstein B. Mutations of mitotic checkpoint genes in human cancers. Nature. 1998;392:300–303. doi: 10.1038/32688. [DOI] [PubMed] [Google Scholar]
- Cahill DP, da Costa LT, Carson-Walter EB, Kinzler KW, Vogelstein B, Lengauer C. Characterization of MAD2B and other mitotic spindle checkpoint genes. Genomics. 1999;58:181–187. doi: 10.1006/geno.1999.5831. [DOI] [PubMed] [Google Scholar]
- Cancer Genome Atlas N.; Cancer Genome Atlas Network. Comprehensive molecular portraits of human breast tumours. Nature. 2012;490:61–70. doi: 10.1038/nature11412. [DOI] [PMC free article] [PubMed] [Google Scholar]
- Cao AR, Rabinovich R, Xu M, Xu X, Jin VX, Farnham PJ. Genome-wide analysis of transcription factor E2F1 mutant proteins reveals that N- and C-terminal protein interaction domains do not participate in targeting E2F1 to the human genome. J Biol Chem. 2011;286:11985–11996. doi: 10.1074/jbc.M110.217158. [DOI] [PMC free article] [PubMed] [Google Scholar]
- Carter SL, Eklund AC, Kohane IS, Harris LN, Szallasi Z. A signature of chromosomal instability inferred from gene expression profiles predicts clinical outcome in multiple human cancers. Nat Genet. 2006;38:1043–1048. doi: 10.1038/ng1861. [DOI] [PubMed] [Google Scholar]
- Casimiro MC, Pestell RG. Cyclin d1 induces chromosomal instability. Oncotarget. 2012;3:224–225. doi: 10.18632/oncotarget.476. [DOI] [PMC free article] [PubMed] [Google Scholar]
- Chandhok NS, Pellman D. A little CIN may cost a lot: revisiting aneuploidy and cancer. Curr Opin Genet Dev. 2009;19:74–81. doi: 10.1016/j.gde.2008.12.004. [DOI] [PubMed] [Google Scholar]
- Clark JS, George WD, Campbell AM. Dual colour flow cytometry of p53 and c-erbB-2 expression related to DNA aneuploidy in primary and metastatic breast cancer. Cancer Lett. 1992;66:193–200. doi: 10.1016/0304-3835(92)90247-s. [DOI] [PubMed] [Google Scholar]
- Cohen M, Vecsler M, Liberzon A, Noach M, Zlotorynski E, Tzur A. Unbiased transcriptome signature of in vivo cell proliferation reveals pro- and antiproliferative gene networks. Cell Cycle. 2013;12:2992–3000. doi: 10.4161/cc.26030. [DOI] [PMC free article] [PubMed] [Google Scholar]
- Danielsen HE, Pradhan M, Novelli M. Revisiting tumour aneuploidy - the place of ploidy assessment in the molecular era. Nat Rev Clin Oncol. 2016;13:291–304. doi: 10.1038/nrclinonc.2015.208. [DOI] [PubMed] [Google Scholar]
- Fischer M, Grossmann P, Padi M, DeCaprio JA. Integration of TP53, DREAM, MMB-FOXM1 and RB-E2F target gene analyses identifies cell cycle gene regulatory networks. Nucleic Acids Res. 2016;44:6070–6086. doi: 10.1093/nar/gkw523. [DOI] [PMC free article] [PubMed] [Google Scholar]
- Grant GD, Brooks L, 3rd, Zhang X, Mahoney JM, Martyanov V, Wood TA, Sherlock G, Cheng C, Whitfield ML. Identification of cell cycle-regulated genes periodically expressed in U2OS cells and their regulation by FOXM1 and E2F transcription factors. Mol Biol Cell. 2013;24:3634–3650. doi: 10.1091/mbc.E13-05-0264. [DOI] [PMC free article] [PubMed] [Google Scholar]
- Hayashi MT, Cesare AJ, Fitzpatrick JA, Lazzerini-Denchi E, Karlseder J. A telomere-dependent DNA damage checkpoint induced by prolonged mitotic arrest. Nat Struct Mol Biol. 2012;19:387–394. doi: 10.1038/nsmb.2245. [DOI] [PMC free article] [PubMed] [Google Scholar]
- Hinchcliffe EH, Day CA, Karanjeet KB, Fadness S, Langfald A, Vaughan KT, Dong Z. Chromosome missegregation during anaphase triggers p53 cell cycle arrest through histone H3.3 Ser31 phosphorylation. Nat Cell Biol. 2016;18:668–675. doi: 10.1038/ncb3348. [DOI] [PubMed] [Google Scholar]
- Jeon HY, Lee H. Depletion of Aurora-A in zebrafish causes growth retardation due to mitotic delay and p53-dependent cell death. FEBS J. 2013;280:1518–1530. doi: 10.1111/febs.12153. [DOI] [PubMed] [Google Scholar]
- Kihana T, Tsuda H, Teshima S, Okada S, Matsuura S, Hirohashi S. High incidence of p53 gene mutation in human ovarian cancer and its association with nuclear accumulation of p53 protein and tumor DNA aneuploidy. Jpn J Cancer Res. 1992;83:978–984. doi: 10.1111/j.1349-7006.1992.tb02010.x. [DOI] [PMC free article] [PubMed] [Google Scholar]
- Krzywicka-Racka A, Sluder G. Repeated cleavage failure does not establish centrosome amplification in untransformed human cells. J Cell Biol. 2011;194:199–207. doi: 10.1083/jcb.201101073. [DOI] [PMC free article] [PubMed] [Google Scholar]
- Lambrus BG, Uetake Y, Clutario KM, Daggubati V, Snyder M, Sluder G, Holland AJ. p53 protects against genome instability following centriole duplication failure. J Cell Biol. 2015;210:63–77. doi: 10.1083/jcb.201502089. [DOI] [PMC free article] [PubMed] [Google Scholar]
- Laoukili J, Kooistra MR, Brás A, Kauw J, Kerkhoven RM, Morrison A, Clevers H, Medema RH. FoxM1 is required for execution of the mitotic programme and chromosome stability. Nat Cell Biol. 2005;7:126–136. doi: 10.1038/ncb1217. [DOI] [PubMed] [Google Scholar]
- Laoukili J, Stahl M, Medema RH. FoxM1: at the crossroads of ageing and cancer. Biochim Biophys Acta. 2007;1775:92–102. doi: 10.1016/j.bbcan.2006.08.006. [DOI] [PubMed] [Google Scholar]
- Li M, Fang X, Baker DJ, Guo L, Gao X, Wei Z, Han S, van Deursen JM, Zhang P. The ATM-p53 pathway suppresses aneuploidy-induced tumorigenesis. Proc Natl Acad Sci USA. 2010;107:14188–14193. doi: 10.1073/pnas.1005960107. [DOI] [PMC free article] [PubMed] [Google Scholar]
- Lindblom A, Rotstein S, Skoog L, Nordenskjöld M, Larsson C. Deletions on chromosome 16 in primary familial breast carcinomas are associated with development of distant metastases. Cancer Res. 1993;53:3707–3711. [PubMed] [Google Scholar]
- Lingle WL, Barrett SL, Negron VC, D’Assoro AB, Boeneman K, Liu W, Whitehead CM, Reynolds C, Salisbury JL. Centrosome amplification drives chromosomal instability in breast tumor development. Proc Natl Acad Sci USA. 2002;99:1978–1983. doi: 10.1073/pnas.032479999. [DOI] [PMC free article] [PubMed] [Google Scholar]
- Manning AL, Dyson NJ. RB: mitotic implications of a tumour suppressor. Nat Rev Cancer. 2012;12:220–226. doi: 10.1038/nrc3216. [DOI] [PMC free article] [PubMed] [Google Scholar]
- McGranahan N, Burrell RA, Endesfelder D, Novelli MR, Swanton C. Cancer chromosomal instability: therapeutic and diagnostic challenges. EMBO Rep. 2012;13:528–538. doi: 10.1038/embor.2012.61. [DOI] [PMC free article] [PubMed] [Google Scholar]
- Nagayama K, Watatani M. Analysis of genetic alterations related to the development and progression of breast carcinoma. Jpn J Cancer Res. 1993;84:1159–1164. doi: 10.1111/j.1349-7006.1993.tb02816.x. [DOI] [PMC free article] [PubMed] [Google Scholar]
- Newport J, Kirschner M. A major developmental transition in early Xenopus embryos: II. Control of the onset of transcription. Cell. 1982;30:687–696. doi: 10.1016/0092-8674(82)90273-2. [DOI] [PubMed] [Google Scholar]
- Orth JD, Loewer A, Lahav G, Mitchison TJ. Prolonged mitotic arrest triggers partial activation of apoptosis, resulting in DNA damage and p53 induction. Mol Biol Cell. 2012;23:567–576. doi: 10.1091/mbc.E11-09-0781. [DOI] [PMC free article] [PubMed] [Google Scholar]
- Pati D, Haddad BR, Haegele A, Thompson H, Kittrell FS, Shepard A, Montagna C, Zhang N, Ge G, Otta SK, et al. Hormone-induced chromosomal instability in p53-null mammary epithelium. Cancer Res. 2004;64:5608–5616. doi: 10.1158/0008-5472.CAN-03-0629. [DOI] [PubMed] [Google Scholar]
- Roylance R, Endesfelder D, Gorman P, Burrell RA, Sander J, Tomlinson I, Hanby AM, Speirs V, Richardson AL, Birkbak NJ, et al. Relationship of extreme chromosomal instability with long-term survival in a retrospective analysis of primary breast cancer. Cancer Epidemiol Biomarkers Prev. 2011;20:2183–2194. doi: 10.1158/1055-9965.EPI-11-0343. [DOI] [PMC free article] [PubMed] [Google Scholar]
- Sadasivam S, DeCaprio JA. The DREAM complex: master coordinator of cell cycle-dependent gene expression. Nat Rev Cancer. 2013;13:585–595. doi: 10.1038/nrc3556. [DOI] [PMC free article] [PubMed] [Google Scholar]
- Sadasivam S, Duan S, DeCaprio JA. The MuvB complex sequentially recruits B-Myb and FoxM1 to promote mitotic gene expression. Genes Dev. 2012;26:474–489. doi: 10.1101/gad.181933.111. [DOI] [PMC free article] [PubMed] [Google Scholar]
- Santaguida S, Richardson A, Iyer DR, M’Saad O, Zasadil L, Knouse KA, Wong YL, Rhind N, Desai A, Amon A. Chromosome mis-segregation generates cell-cycle-arrested cells with complex karyotypes that are eliminated by the immune system. Dev Cell. 2017;41:638–651. e5. doi: 10.1016/j.devcel.2017.05.022. [DOI] [PMC free article] [PubMed] [Google Scholar]
- Schvartzman JM, Duijf PH, Sotillo R, Coker C, Benezra R. Mad2 is a critical mediator of the chromosome instability observed upon Rb and p53 pathway inhibition. Cancer Cell. 2011;19:701–714. doi: 10.1016/j.ccr.2011.04.017. [DOI] [PMC free article] [PubMed] [Google Scholar]
- Sigurdsson S, Bödvarsdottir SK, Anamthawat-Jonsson K, Steinarsdottir M, Jonasson JG, Ogmundsdottir HM, Eyfjörd JE. p53 abnormality and chromosomal instability in the same breast tumor cells. Cancer Genet Cytogenet. 2000;121:150–155. doi: 10.1016/s0165-4608(00)00260-0. [DOI] [PubMed] [Google Scholar]
- Soto M, Raaijmakers JA, Bakker B, Spierings DCJ, Lansdorp PM, Foijer F, Medema RH. p53 prohibits propagation of chromosome segregation errors that produce structural aneuploidies. Cell Rep. 2017;19:2423–2431. doi: 10.1016/j.celrep.2017.05.055. [DOI] [PubMed] [Google Scholar]
- Thiru P, Kern DM, McKinley KL, Monda JK, Rago F, Su KC, Tsinman T, Yarar D, Bell GW, Cheeseman IM. Kinetochore genes are coordinately up-regulated in human tumors as part of a FoxM1-related cell division program. Mol Biol Cell. 2014;25:1983–1994. doi: 10.1091/mbc.E14-03-0837. [DOI] [PMC free article] [PubMed] [Google Scholar]
- Thompson SL, Compton DA. Proliferation of aneuploid human cells is limited by a p53-dependent mechanism. J Cell Biol. 2010;188:369–381. doi: 10.1083/jcb.200905057. [DOI] [PMC free article] [PubMed] [Google Scholar]
- Uetake Y, Sluder G. Prolonged prometaphase blocks daughter cell proliferation despite normal completion of mitosis. Curr Biol. 2010;20:1666–1671. doi: 10.1016/j.cub.2010.08.018. [DOI] [PMC free article] [PubMed] [Google Scholar]
- van Deursen JM. Rb loss causes cancer by driving mitosis mad. Cancer Cell. 2007;11:1–3. doi: 10.1016/j.ccr.2006.12.006. [DOI] [PubMed] [Google Scholar]
- Wallingford JB, Seufert DW, Virta VC, Vize PD. p53 activity is essential for normal development in Xenopus. Curr Biol. 1997;7:747–757. doi: 10.1016/s0960-9822(06)00333-2. [DOI] [PubMed] [Google Scholar]
- Yandell M, Huff C, Hu H, Singleton M, Moore B, Xing J, Jorde LB, Reese MG. A probabilistic disease-gene finder for personal genomes. Genome Res. 2011;21:1529–1542. doi: 10.1101/gr.123158.111. [DOI] [PMC free article] [PubMed] [Google Scholar]
- Zasadil LM, Britigan EM, Ryan SD, Kaur C, Guckenberger DJ, Beebe DJ, Moser AR, Weaver BA. High rates of chromosome missegregation suppress tumor progression but do not inhibit tumor initiation. Mol Biol Cell. 2016;27:1981–1989. doi: 10.1091/mbc.E15-10-0747. [DOI] [PMC free article] [PubMed] [Google Scholar]
- Zhang CZ, Leibowitz ML, Pellman D. Chromothripsis and beyond: rapid genome evolution from complex chromosomal rearrangements. Genes Dev. 2013;27:2513–2530. doi: 10.1101/gad.229559.113. [DOI] [PMC free article] [PubMed] [Google Scholar]
- Zhang W, Mao JH, Zhu W, Jain AK, Liu K, Brown JB, Karpen GH. Centromere and kinetochore gene misexpression predicts cancer patient survival and response to radiotherapy and chemotherapy. Nat Commun. 2016;7:12619. doi: 10.1038/ncomms12619. [DOI] [PMC free article] [PubMed] [Google Scholar]
Associated Data
This section collects any data citations, data availability statements, or supplementary materials included in this article.