Abstract
Histotripsy is an ultrasonic tissue ablation method based on acoustic cavitation. It has been shown that cavitation dynamics change depending on the mechanical properties of the host medium. During histotripsy treatment, the target-tissue is gradually fractionated and eventually liquefied to acellular homogenate. In this study, the change in the collapse time (tcol) of the cavitation bubble cloud over the course of histotripsy treatment is investigated as an indicator for progression of the tissue fractionation process throughout treatment. A 500-kHz histotripsy transducer is used to generate single-location lesions within tissue-mimicking agar phantoms of varying stiffness levels as well as ex vivo bovine liver samples. Cavitation collapse signals are acquired with broadband hydrophones, and cavitation is imaged optically using a high-speed camera in transparent tissue-mimicking phantoms. The high-speed-camera-acquired measurements of tcol validate the acoustic hydrophone measurements. Increases in tcol are observed both with decreasing phantom stiffness and throughout histotripsy treatment with increasing number of pulses applied. The increasing trend of tcol throughout the histotripsy treatment correlates well with the progression of lesion formation generated in tissue-mimicking phantoms (R2 = 0.87). Finally, the increasing trend of tcol over the histotripsy treatment is validated in ex vivo bovine liver.
Keywords: histotripsy, cavitation, therapy monitoring, ablation, tissue mechanics, ultrasound
1. Introduction
Histotripsy is a tissue ablation method that uses highly controlled acoustic cavitation to noninvasively destroy soft tissue using high peak rarefactional pressure amplitude (>28 MPa), short duration (1–2 cycles) ultrasonic pulses in the intrinsic threshold regime (Xu, et al., 2007; Roberts, et al., 2006; Parsons, et al., 2006). Histotripsy destroys tissue by repeatedly initiating a dense cloud of cavitation microbubbles, which coalesce and collapse violently, thereby fractionating tissue into acellular homogenate (Lin, et al., 2014; Zhang, et al., 2017). Upon arrival of the acoustic pulse, existing cavitation nuclei in the treated medium are excited, resulting in a fast expansion of bubbles. These bubbles expand several orders of magnitude until they have reached a maximum radius, Rmax, and then collapse in a violent fashion to microscopic size (Whittingham, et al., 1998). This sequence of energetic expansion and collapse is known as inertial cavitation (Leighton, 1994), which is the fundamental physical mechanism through which histotripsy destroys tissue (Xu, et al., 2004). After a sufficient number of pulses, histotripsy can completely fractionate soft tissue into a liquefied acellular homogenate (Hall, et al., 2007a). It is known that areas of the body with a higher Young’s modulus (a quantitative indicator of stiffness) such as the wall of blood vessels or fibrous tissues, e.g., tendons, take higher doses of histotripsy pulses to completely liquefy (Vlaisavljevich, et al., 2013; Vlaisavljevich, et al., 2015a).
Previously, ultrasound elastography techniques, such as acoustic radiation force impulse (ARFI) imaging and shear wave imaging, have been used to monitor histotripsy-induced tissue fractionation in real-time (Cain & Wang, 2012; Miller, et al., 2012; Wang, et al., 2012a). It has been found that ultrasound elastography is able to track tissue fractionation with higher sensitivity than by simply observing changes in the B-mode speckle intensity that are caused by the destruction of diffuse scatterers in the tissue (Wang, et al., 2014; Hall, et al., 2007b; Xu, et al., 2009). In these studies, it was shown that the Young’s modulus of soft tissues, such as kidney and liver, decreases throughout histotripsy treatment until a threshold is reached at which point the tissue has been completely liquefied (Wang, et al., 2012a).
Cavitation bubble dynamics models in viscoelastic media show that the cavitation bubble collapse time (tcol), i.e., the time between the initial expansion and first collapse of the bubble cloud, is expected to increase with decreasing Young’s modulus. The Kelvin-Voigt model given by (1) (Yang & Church, 2005; Gaudron, et al., 2015; Estrada, et al., 2017)
| (1) |
is commonly used to describe viscoelastic media, which relates the stress tensor, τ, to the Young’s modulus, E, the deformation tensor, γ, and the viscosity, μ. The stress tensor can be further related to the bubble radius, R, through the Keller-Miksis equation (2),
| (2) |
which is dependent upon the sound speed, c, and density, ρ, of the medium, the surface tension against air, S, the absolute forcing pressure p∞ (t), an assumed spatially uniform pressure within the gas bubble, pg, and the initial radius of the bubble, R0 (Keller & Miksis, 1980). From this equation, it can be seen that the spatial and temporal dynamics of the bubble radius are directly dependent on the Young’s modulus of the medium. Previous simulations and experiments have shown that as the stiffness of the medium quantified by the Young’s modulus decreases, the bubble Rmax and tcol both increase (Vlaisavljevich, et al., 2014b) (Vlaisavljevich, et al., 2015b; Hua & Johnsen, 2013; Barajas & Johnsen, 2017).
We hypothesize that as target-tissue becomes further fractionated over the histotripsy treatment, the effective tissue stiffness decreases, and thus the tcol of the cavitation bubble cloud increases. It is known that both the initial expansion and collapse sequences result in the emission of measureable acoustic shockwaves (Plesset, 1966; Plesset & Prosperetti, 1977; Coussios, et al., 2007; Gyöngy, et al., 2008; Salgaonkar, et al., 2009; Gateau, et al., 2011; Macoskey, et al., 2017); thus, tcol can be measured directly by detecting these emitted shockwaves. We further hypothesize that the increase of tcol over the histotripsy treatment can be used to monitor the treatment progression and completion.
In this study, these hypotheses were tested in three steps. First, transparent agar gel phantoms of varying stiffness were treated with histotripsy at a single location. We acquired the acoustic shockwave signal emitted by the bubble cloud collapse using broadband hydrophones, and we recorded high-speed imaging of the cavitation to validate the hydrophone measurements. The tcol parameter was calculated from both signals to compare with each other. Second, the change of tcol over the treatment recorded acoustically was correlated with the lesion progression in the tissue-mimicking red blood cell (RBC) phantoms. Finally, the increasing trend of tcol over the treatment was validated in ex vivo bovine liver.
2. Methods
2.1 Histotripsy Transducer and Setup
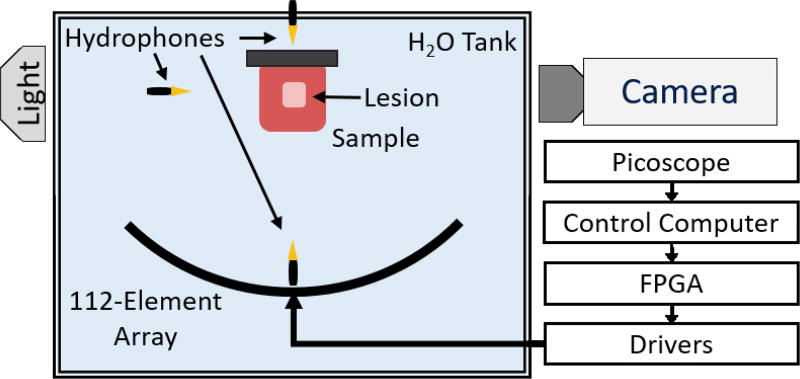
A 500 kHz, 112-element histotripsy array constructed in-house with a 15 cm radius of curvature and a 27 cm aperture was used for all treatments in this study (Duryea, et al., 2015). A custom-built 112-channel high-voltage pulser was used to drive each element with an approximately 1.5-cycle, 3-µs sinusoidal pulse. All elements were driven in-phase such that the histotripsy pulse from each element arrived at the geometric focus of the array simultaneously. A schematic overview of the setup is shown in Figure 1. The acoustic waveform generated at the focus was measured using a fiber-optic probe hydrophone (FOPH) with a 100-µm sensing tip (Parsons, et al., 2006). The array produced a focal zone with a −6 dB beamwidth of 1.65 mm laterally and 6.50 mm axially when measured with the FOPH in the linear regime at a peak rarefactional pressure amplitude of 10 MPa. Above 10 MPa peak-negative pressure (P-), the acoustic waveform could not be measured directly because cavitation occurred at the FOPH tip. For P- greater than 10 MPa, the output from the transducer was estimated by dividing the array into several subaperture slices, which were driven and measured separately and summed to estimate the pressure at each driving voltage. The number of subapertures chosen was always the minimum number required to prevent cavitation at the FOPH tip for each respective driver voltage level (Duryea, et al., 2015).
Figure 1.
Experimental Setup. A 500 kHz 112-element high-powered ultrasound array is used to generate histotripsy lesions at a single location within tissue-mimicking phantoms and ex vivo bovine liver. Three hydrophones at varying positions are used to capture the acoustic shockwaves emitted by the cavitation bubble cloud, and their signals are acquired on a Picoscope data acquisition system (connections not shown). A high-speed camera is used to image the backlit bubble cloud during transparent tissue-mimicking phantom experiments.
The histotripsy array was placed facing upwards in a water tank, and all samples were placed above the array at its focus (Figure 1). All treatments were applied at a single location at the geometric focus of the histotripsy array at 1-Hz pulse repetition frequency (PRF). This low PRF was chosen to reduce cavitation memory effects due to persistent residual nuclei, which are known to alter cavitation dynamics (Wang, et al., 2012b). Agar samples were treated with 100 pulses, and liver samples were treated with 1000 pulses.
2.2 Hydrophone-Based Cavitation Detection
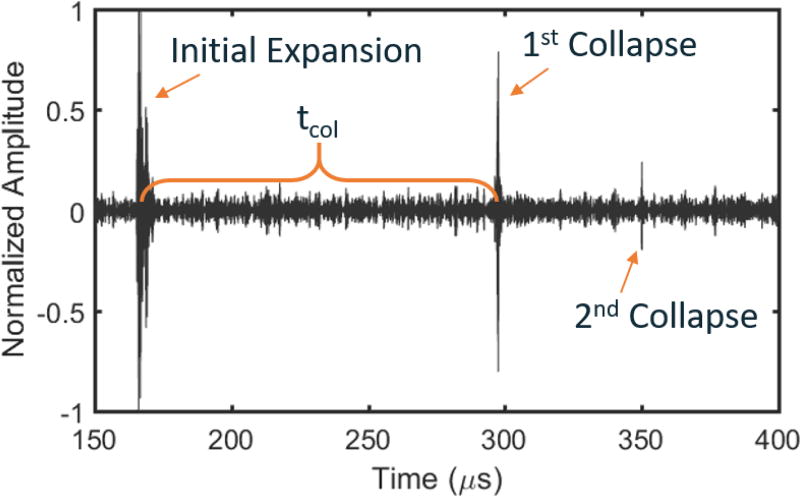
Three broadband hydrophones (Model CA-1135, Dynasen, Inc., Goleta, CA) were placed in the tank at three different orientations: above, to the side, and directly below the focus of the array all at different distances from the focus of the histotripsy array (Figure 1). This was done to investigate any differences in tcol when measured from different orientations relative to the sample and to ensure that we were obtaining the signal from the cavitation collapse and not from scattering. Each hydrophone was connected to a multi-channel oscilloscope (Picoscope 4000 Series, Pico Technology, Cambridgeshire, UK) that was connected to the control computer. tcol was defined as the time between the shockwave signal from the initial expansion of the bubble cloud and the shockwave signal from the first collapse of the bubble cloud. To parse the expansion and collapse signals from the acquired signals, the hydrophone data were filtered with a 1D Gaussian band-pass filter centered at 6 MHz with a Gaussian root-mean square width of 1 MHz. This filter was chosen because it eliminated the low frequency oscillations around the 500 kHz center frequency of the histotripsy transducer and also reduced very high frequency noise while still passing high frequency components of the broadband shockwave emissions from the bubble cloud. A representative cavitation emission signal from a single bubble cloud recorded on the side-mounted hydrophone is shown in Figure 2. After filtration, the acoustic shockwaves emitted from the initial expansion and collapse of the bubble cloud had amplitudes that were approximately an order of magnitude greater than the noise floor. Assuming a fixed sound speed of 1480 m/s, the time of arrival of the shockwave from the initial expansion was predictable. The overall durations of the detected expansion and collapse signals were on the order of 1 µs. Because both the expansion and collapse emission signals were expected to be high-pressure, single-cycle shockwaves (Sukovich, et al., 2017; Cleveland, et al., 2000), the arrival times for the expansion and collapse signals were chosen to be the peak pressure arrival times for each signal. Therefore, to calculate tcol, the time between the expansion and collapse signals was directly measured by calculating the time between the peaks of the two largest signals over the lifespan of the histotripsy bubble cloud.
Figure 2.
Representative bubble cloud expansion and collapse signals acquired from hydrophone in an agar phantom after frequency-domain filtering using a Gaussian shaped filter with a 6 MHz center frequency and a Gaussian root-mean square width of 1 MHz. Time zero represents time at which the histotripsy array was fired. The tcol is calculated as the time between the peak expansion signal and the peak collapse signal. The initial expansion and first collapse signals were readily observable for all treatments of all phantoms and tissue samples.
2.3 Experiment 1 - Hydrophone-Acquired and High-Speed-Camera-Acquired tcol Change in Phantoms of Varying Stiffness
The goal of this experiment was to test the hypotheses that 1) the tcol of the cavitation bubble cloud increases with both decreasing phantom stiffness and increasing histotripsy treatment; and 2) use optical images of the bubble cloud expansion and collapse to validate the tcol measurements acquired using the acoustic shockwave emitted from the collapse of the bubble cloud. Histotripsy-induced cavitation was generated in agarose gel phantoms with varying stiffness, and tcol was calculated using the acoustic shockwave emitted from the cavitation and validated using high-speed optical images of the cavitation bubble cloud.
Previously, it has been shown that agar phantoms can be used to model a physiologically relevant range of tissue mechanical properties by modifying the concentration of agar in the phantom (Vlaisavljevich, et al., 2014b). Typically, the compressional Young’s moduli for low melt temperature agar phantoms range from approximately 38 kPa at 1.0% concentration to approximately 929 kPa at 5% concentration (Normand, et al., 2000). For comparison, typical physiological compressional Young’s moduli range from ~2–5 kPa for the weakest tissues, e.g., lung, fat, and ~900 kPa for the strongest tissues, e.g., cartilage (Vlaisavljevich, et al., 2014a). For this study, low melt, molecular biology grade agar (CAS No. 9012-36-6, DOT Scientific, Burton, MI) was dissolved in boiling deionized water to form tissue-mimicking phantoms in a rectangular mold approximately 9 × 12 × 1.25 cm in size. The molds were designed to reduce acoustic aberrations by ensuring that no structural supporting materials were placed between the histotripsy array and the phantoms to reduce acoustic aberrations. Four different types of agar gels were formed using concentrations of 1.0%, 1.5%, 2.5%, and 5.0% w/v to interrogate the relative differences in bubble dynamics across samples of varying stiffness. Phantoms were treated in replicates of six justified by power analysis to performed to obtain a statistical power of 0.95 and α = 0.01 for observing the difference in tcol between agar concentrations when compared to a normal distribution. All phantoms were degassed in a vacuum (WOB-L 2581, Welch Vacuum, Mt. Prospect, IL) in a desiccator for ten minutes prior to solidification to remove small gas bubbles. Upon solidification, phantoms were removed from their molds and were placed in the water tank above the histotripsy array using a three-axis positioning system for treatment. The driving voltage used to treat these agar phantoms resulted in an estimated P- pressure of 33.1 MPa, which was measured as the summation of four array subapertures. This was just above the intrinsic threshold for cavitation generated using a single-cycle pulse (Maxwell, et al., 2013), so cavitation only occurred at the area of highest pressure at the focus of the transducer and not throughout the entire −6 dB beamwidth. It is important to note that the linear summation of subapertures does not perfectly account for the effects of nonlinear propagation, so this P- pressure measurement is likely an overestimate.
Hydrophone-acquired measurements of tcol were obtained throughout the entire treatment of each tissue-mimicking phantom. For the first pulse in each treatment of each phantom, tcol measurements were directly compared to observe the effects of varying stiffness of intact phantoms on tcol. The overall change of tcol throughout treatment relative to the tcol from the first pulse was then calculated to compare the tcol progression profiles throughout the treatment of each phantom.
A high-speed camera (Phantom V210, Vision Research, Inc., Wayne, NJ) with a 200-mm lens was used to acquire optical images of the bubble cloud expansion and collapse at 125,000 frames-per-second with 8-µs temporal and 45.5-µm spatial resolution with an exposure of 2.0 µs per frame. While this is relatively poor spatial resolution, the maximum bubble sizes observed were on the order of >1 mm, so this resolution was satisfactory for this experiment. For each histotripsy pulse, 38 frames were acquired providing approximately 300 µs of high-speed images per histotripsy pulse. A custom-built diffuse light source was used to backlight the samples. tcol measurements were obtained from the high-speed images by using a summation of a binary mask of each frame to determine whether the bubble cloud was present (Duryea, et al., 2015). The camera-acquired progression of tcol was then correlated with the hydrophone-acquired progression of tcol throughout all treatments using linear regression to optically validate the hydrophone data.
2.4 Experiment 2 - Correlation Between Change of tcol and Lesion Development in RBC Phantom
The goal of Experiment 2 was to test the hypothesis that the increase of tcol over the histotripsy treatment can be used to detect the progression of tissue fractionation generated by histotripsy. To provide a quantifiable indication of histotripsy-induced tissue fractionation, tissue-mimicking agar phantoms made from a thin layer of RBCs embedded between two layers of agar were treated with histotripsy. RBC phantoms have been previously shown to be a good indicator of histotripsy-induced fractionation because the RBC area turns from an opaque red when undamaged to a translucent pink when they are fractionated (Miller, et al., 2016; Maxwell, et al., 2010). High-speed optical images of the RBC phantom can be taken after each pulse to visualize and quantify the damaged area. To form the RBC phantoms, fresh bovine blood acquired from a local abattoir was mixed with citrate-phosphate-dextrose solution (#C7165; Sigma-Aldrich Co., St. Louis, MO, USA) to prevent clotting (Zhang, et al., 2016). The blood was then placed in a vial in a centrifuge at a relative centrifugal force of 1300 g for 15 minutes. Once separated, the plasma and buffy coat was aliquoted from the sample, leaving only packed RBCs. Agar was dissolved in a 1.0% concentration in boiling, phosphate-buffered saline (PBS). The phantom holder from the first experiment was half-filled with the hot agar-saline solution, which was then allowed to cool thereby forming the bottom layer of the three-layer phantom. RBCs were then added to a small amount of 1.0% agar-saline solution at 40 °C to form a 2.5% RBC-agar-saline w/w solution, which was then poured over the bottom agar layer to form a roughly 0.5 mm thick layer that was then allowed to solidify. Finally, a top layer of 1.0% agar-saline solution was added to complete the phantom thereby completely enclosing the RBC layer in agar gel.
To ensure that the RBC phantom layer was completely engulfed by the bubble cloud throughout the entire −6-*dB beamwidth, the histotripsy transducer was driven well above the intrinsic threshold level for cavitation. At the voltage levels used for the treatments in this experiment, the histotripsy array was estimated to output a P- pressure of 59.4 MPa when measured as a summation of eight subapertures using the FOPH.
To analyze the extent of histotripsy-induced destruction optically, a high-resolution camera (Point Grey Chameleon 3, FLIR Systems, Inc., Richmond, BC, Canada) and macro lens were used to take an image of the area of destruction after each histotripsy pulse with an effective resolution of 11.4 µm/pixel. The samples were backlit by a custom-built diffuse light source. To compute a quantitative metric for fractionation progression, an approximately 0.52 mm2 region of interest (ROI) in the center of the lesion was extracted from each image to limit the effects of peripheral damage on the mean lesion intensity (MLI) metric. The MLI, defined as the average pixel intensity over the ROI, was calculated for the entire treatment on a normalized scale from 0 to 1 following the protocol established from previously published work (Miller, 2014; Miller, et al., 2016). The exposure settings of the camera were calibrated such that an untreated area resulted in an average MLI of 0 and an area of complete destruction resulted in an MLI of 1. Thus, an MLI of 1 was used to indicate complete fractionation. Hydrophone-acquired measurements of tcol for each histotripsy pulse were correlated with the change in MLI using linear regression for six treatments to validate the change in tcol as a measure of tissue fractionation. The sample size was determined using power analysis to obtain a statistical power of 0.95 and α = 0.05 for observing the change in MLI throughout treatment.
2.5 Experiment 3 - Ex Vivo Bovine Liver Treatment
The goal of Experiment 3 was to validate the increasing trend of tcol over the histotripsy treatment in ex vivo tissue. To make ex vivo liver samples, freshly excised bovine liver was acquired from a local abattoir and was preserved in room-temperature phosphate-buffered saline (PBS) during transport. All liver samples were used within 12 hours of harvest. Cube-shaped samples of approximately 4 cm were cut from the outermost sections of the left and right lobes of whole liver to obtain sections away from large vasculature. Samples were then placed in degassed PBS under vacuum in a desiccator for five hours. Liver samples required a longer degassing period than agar phantoms due to natural gas formation in excised tissue. The liver cubes were then removed from the vacuum and were embedded in 1.5% agar blocks to maintain structural stability (Macoskey, et al., 2018). The tissue cubes were suspended in sample holders such that no structural support materials occluded the acoustic signal path of the histotripsy array. Upon solidification of the agar block, phantoms were removed from their molds and were positioned in the water above the histotripsy array using a three-axis positioner. Four liver samples were treated with 1000 histotripsy pulses at a single location at the geometric focus of this histotripsy array. This sample size was determined via power analysis to obtain a statistical power of 0.95 with α = 0.05 for observing the change in tcol throughout treatment.
Due to the increased intrinsic threshold for cavitation in liver tissue relative to agar phantoms (Vlaisavljevich, et al., 2014b), the histotripsy transducer was driven well above the free-field intrinsic threshold for cavitation for the liver samples in this experiment. Therefore, the driving voltage used for treating all ex vivo samples was estimated to output a P- pressure of 59.4 MPa if the array were driven in the free-field at that voltage. This was the same driving voltage used for the RBC phantom treatments in the second experiment.
3. Results
3.1 Experiment 1 - Hydrophone-Acquired and High-Speed-Camera-Acquired tcol Change in Phantoms of Varying Stiffness
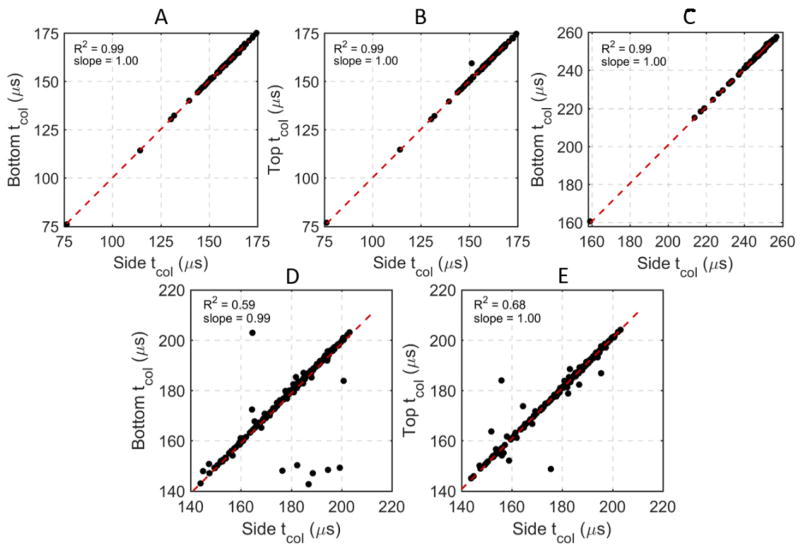
A total of 28 single-location lesions were generated in transparent phantoms with four different concentrations of agar. An example filtered signal from one hydrophone from one histotripsy pulse in a 1.0% agar phantom is shown in Figure 2. In this signal, the emission shockwaves from the initial expansion, first collapse, and second collapse of the bubble cloud are observed around 170, 295, and 350 µs, respectively. Note that while the initial expansion and first collapse signals were observable in all experiments, the second collapse signal was only observable in some cases and generally only in the 1.0% and 1.5% agar gels. In all samples, the cavitation collapse signals were observable on all three hydrophones, and the tcol measurements from all three hydrophones were virtually identical. Example hydrophone comparisons from one treatment of one 1.0% agar phantom from this experiment are shown in Figure 3A,B and indicate very strong, direct linear correlations between the side-mounted and the top- and bottom-mounted hydrophones. In this experiment and subsequent experiments, forward and reverse scattering of the histotripsy pulses occasionally interfered with the collapse shockwave signals on the top- and bottom-mounted hydrophones, thus making it difficult to extract tcol from the data in some cases. However, the side-mounted hydrophone did not experience this issue due to its placement away from the transaxial direction of the histotripsy transducer. Therefore, for consistency, all quantitative tcol data reported in this manuscript are from the side-mounted hydrophone other than the comparative linear correlations reported in Figure 3.
Figure 3.
Comparisons of tcol acquired from top- bottom- and side-mounted hydrophones for one 100-pulse treatment in a 1.0% agar phantom (Experiment 1) (A, B), one 100-pulse treatment in a 1.0% RBC phantom (Experiment 2) (C), and one 1000-pulse treatment (every third pulse) in an ex vivo bovine liver sample (Experiment 3) (D, E). The top-mounted hydrophone was blocked by the RBC phantom holder for Experiment 2, thus it could not be compared to the other two hydrophones. A strong, linear, direct correlation was observed in all comparisons, indicating that the tcol recorded on all three hydrophones were virtually identical.
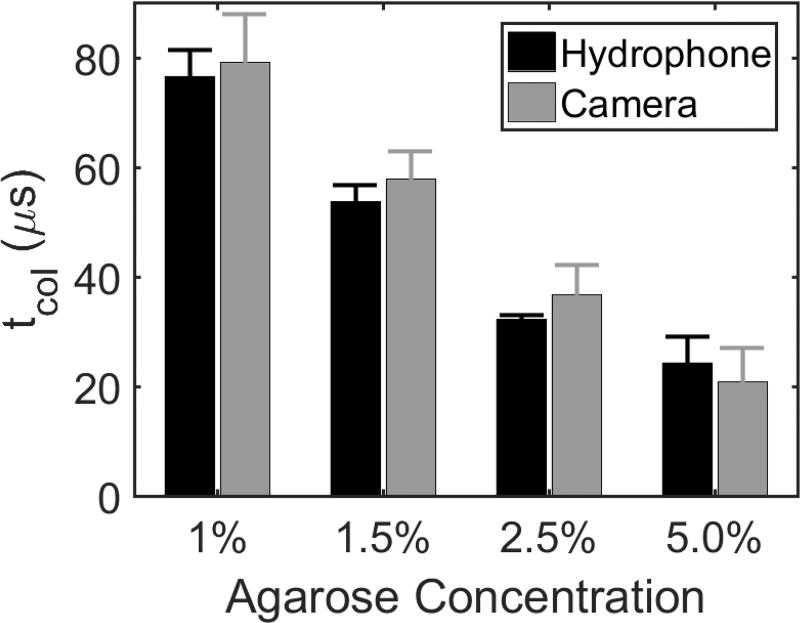
For the first pulse in each treatment, a decrease in tcol acquired from both the hydrophone and the high-speed camera was observed with increasing stiffness (Vlaisavljevich, et al., 2015b; Normand, et al., 2000). As shown in Figure 4, the tcol at the beginning of each treatment was found to be 77 ± 4.8, 56 ± 2.8, 32 ± 0.7, and 26 ± 4.7 µs on the hydrophone and 80 ± 7.7, 58 ± 4.1, 37 ± 4.2, and 21 ± 5,2 on the high-speed camera for the 1.0%, 1.5%, 2.5%, and 5.0% agar concentration phantoms, respectively. Differences between tcol measurements on the first pulse between all agar concentrations were significant (p-values < 0.001), and differences between tcol measurements on the hydrophone and high-speed camera were insignificant (p-value = 0.16). For the 1.0%, 1.5%, and 2.5% phantoms, the camera tended to overestimate tcol on the first pulse in comparison to the hydrophone, but the opposite effect was observed for the 5.0% phantoms. However, no significant interaction effect between the tcol measurement method and the phantom concentration was observed (p-value = 0.15). Furthermore, variation between the two measurement methods is to be expected due to the poor temporal resolution of the camera relative to the hydrophone.
Figure 4.
Bubble cloud tcol in tissue-mimicking phantoms of varied agar concentration acquired from both hydrophone and high-speed camera. Results show tcol for the first histotripsy pulse in six replicate treatments of four different agar concentrations. A significant decrease in tcol with increasing agarose concentration was observed. All differences in tcol due to different agar concentrations were found to be statistically significant using Tukey’s HSD multiple comparisons test (p-values < 0.001) tcol measurements were not statistically significantly different between hydrophone and camera (p-value = 0.16).
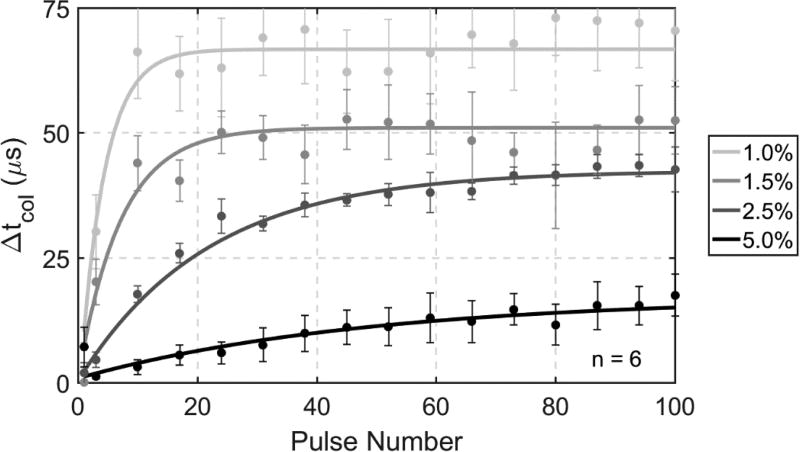
The changes in tcol based on the hydrophone data throughout six 100-pulse treatments in the four different gel stiffness levels are shown in Figure 5. An increasing trend of tcol over the treatment was observed for all gel concentrations, and the phantoms with lower agar concentrations reached their maximum tcol increases earlier than the higher concentration phantoms. Measurements of tcol in the 1.0%, 1.5%, 2.5%, and 5.0% phantoms all exhibited mono-directional increases, with maximum increases of approximately 75, 58, 45, and 18 µs and steady-state increases realized at approximately 18, 28, 70, and 90 pulses, respectively, throughout treatment.
Figure 5.
Change in tcol of bubble clouds throughout 100 pulse treatments in tissue-mimicking phantoms with varying concentrations of agar. Lighter shades of gray correspond with tissue-mimicking phantoms with lower agar concentration and therefore lower stiffness, which exhibited both longer tcol and larger changes in tcol.
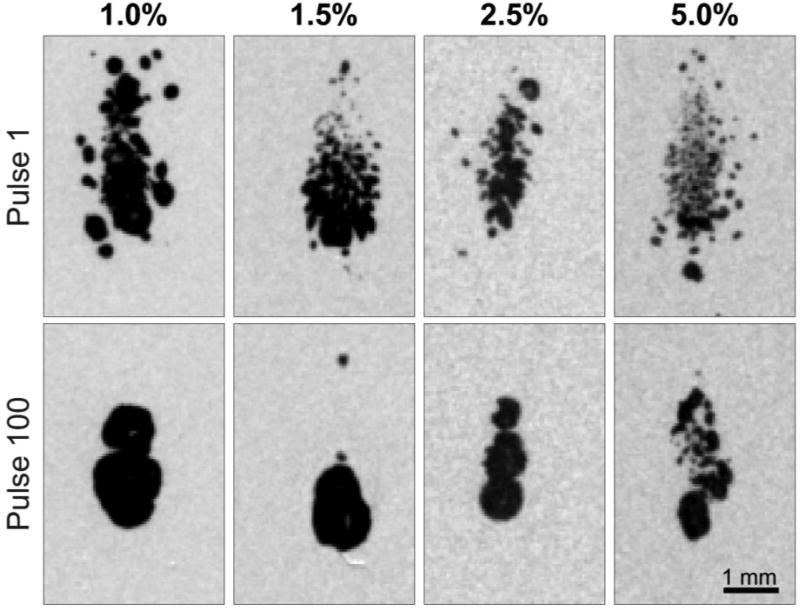
The high-speed camera data also revealed mono-directional increases with decreasing gel concentration and increasing fractionation over the treatment. The tcol measurements in the 1.0%, 1.5%, 2.5%, and 5.0% gels all exhibited mono-directional increases, with the maximum increases of approximately 75, 65, 54, and 25 µs, respectively throughout treatment, with steady-state increases realized at approximately 20, 30, 72, and 90 pulses, respectively. In addition, the high-speed imaging revealed that Rmax increased with decreasing gel concentration and increasing fractionation over the treatment, which corresponded to the tcol data. Stills obtained from the high-speed videos at maximum bubble cloud size for the first and last pulses in agar samples of the four different gel stiffness levels are shown in Figure 6. The video format of Figure 6 is available in the online edition of this manuscript.
Figure 6.
High-speed imaging stills of maximum bubble expansion during first and last pulses of 100 pulse treatments of agar tissue phantoms of varying gel concentration. Maximum bubble expansions did not occur at the same time across agar concentrations and histotripsy dosages. At the time of Rmax, bubbles are smaller and more diffuse for higher agar concentrations and lower treatment dosages. Video format of this figure is available in online form.
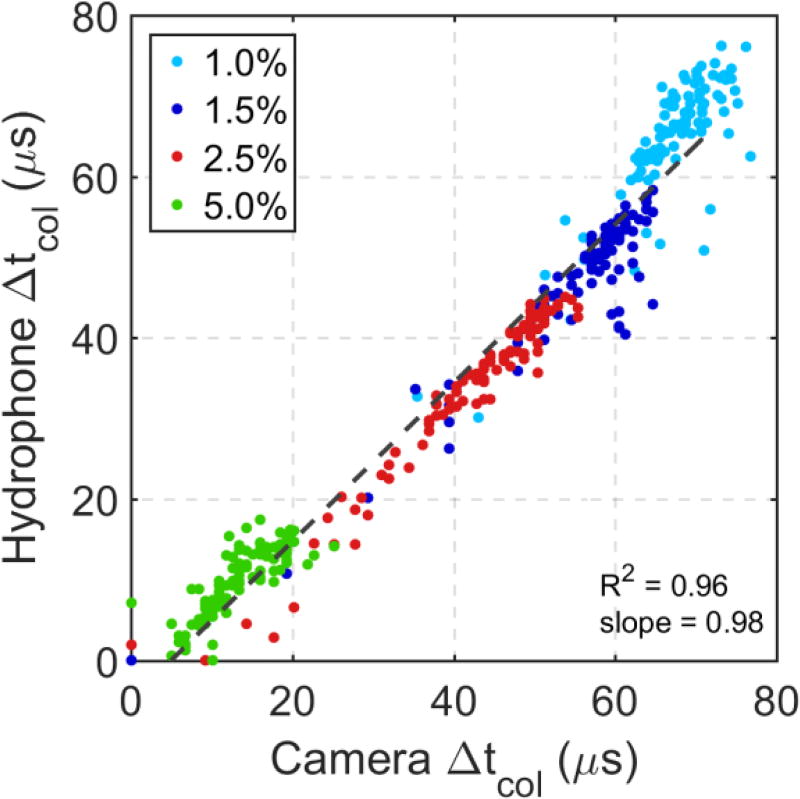
The tcol acquired with the camera were in agreement with the hydrophone data throughout the treatments of all phantoms. The mean change in tcol over six treatments acquired with the camera is plotted against the mean change in tcol acquired with the hydrophone throughout treatment for all agar concentrations in Figure 7. Linear regression between the two datasets indicates a strong, linear, direct correlation (R2 = 0.96) with a regression line slope of 0.98.
Figure 7.
Linear correlation between measurements of changes in collapse time tcol in agar gels of varying concentration acquired from hydrophone and high-speed imaging data (n=6). Dotted line represents best fit line calculated using linear regression. Δtcol calculated from both methods match well with each other. Data from different agar concentrations are easily segmented based on their differences in collapse time.
3.2 Experiment 2 - Correlation Between Change of tcol and Lesion Development in RBC Phantom
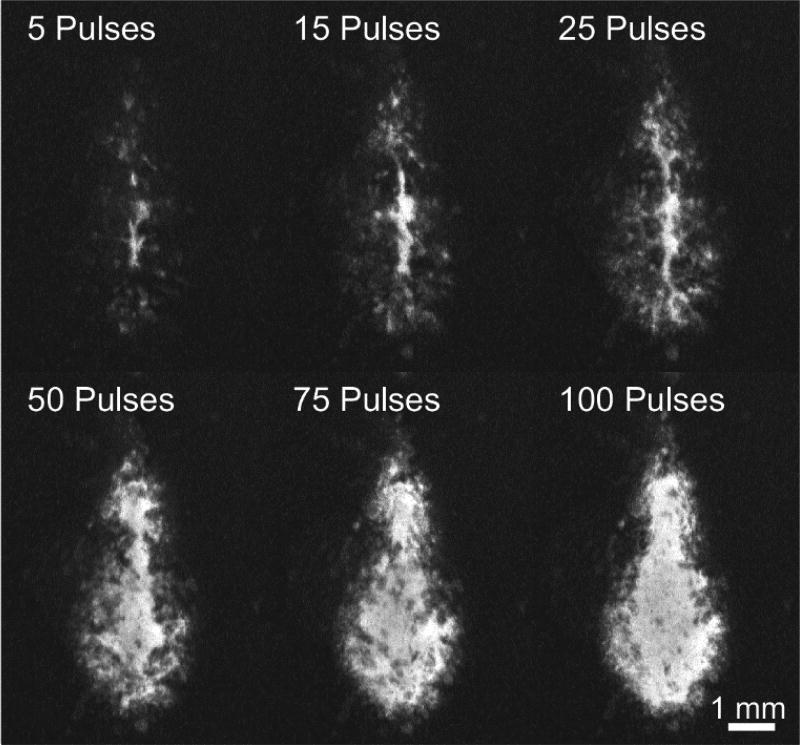
The RBC phantom holder was positioned such that the top-mounted hydrophone was blocked and unable to acquire cavitation shockwave signals. However, the comparison between the side- and bottom-mounted hydrophones is shown in Figure 3C and indicates a strong, direct, linear correlation indicating that the two locations resulted in identical measurements of tcol. Optical images of the RBC layer and tcol measurements using the hydrophone were collected for each histotripsy pulse throughout six 100-pulse histotripsy treatments. Qualitative images of the RBC phantom destruction after 5, 15, 25, 50, 75, and 100 single-location histotripsy pulses are shown in Figure 8. The RBC phantom destruction originated at the center of the bubble cloud where the most intense bubble motion occurs. Significant, rapid increases in destruction were observed throughout the first 25 pulses with decreasing amounts of destruction occurring to 50 pulses. After 50 pulses, little to no increases in destruction based on the optical images were observed in the central part of the lesion. Fractionation of the RBC phantom was quantified for all lesions using the MLI metric and is shown in Figure 9. The quantitative optical analysis revealed that the majority of destruction occurred within the first 40 pulses in which logarithmic growth of the MLI metric was observed. Between 40–50 pulses, the MLI began to saturate in all cases indicating complete fractionation. Additional histotripsy pulses beyond this point resulted in essentially no increase in MLI for the center of the lesion.
Figure 8.
Images of RBC phantom destruction throughout one 100-pulse histotripsy treatment illustrating the changes in MLI. Dark background represents non-fractionated RBCs while lighter areas within the lesion represent destroyed areas of the RBC layer. While the central region of the lesion reached maximum MLI around 50 pulses, the extent of fractionation continued to grow outward throughout the remainder of treatment.
Figure 9.
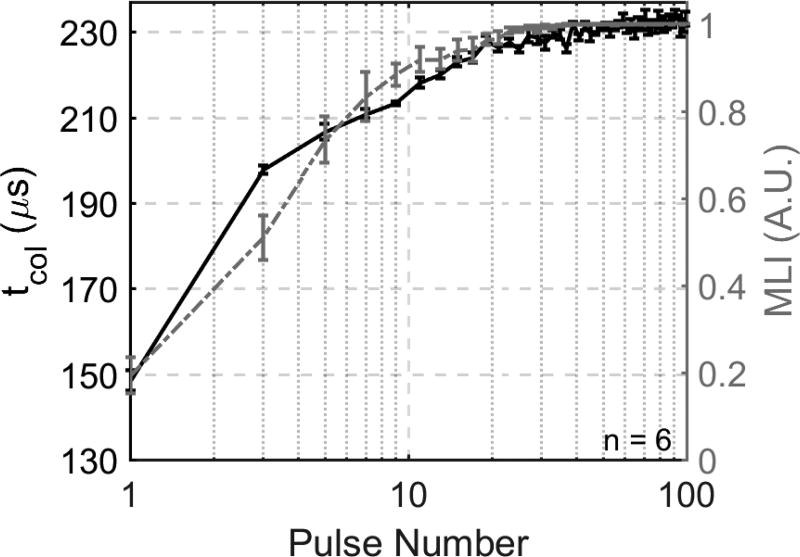
tcol (left y-axis) and MLI (right y-axis) vs. pulse number throughout 100 pulses. The majority of changes in tcol and MLI occur early in treatment and at the same time. The change in tcol is greater than the change in MLI in the first several pulses, but both metrics even out quickly and reach a plateau threshold around 40 pulses.
The tcol progression in the RBC phantoms is plotted with the MLI metric data in Figure 9. In agreement with the MLI metric data, the tcol progression exhibited mono-directional, logarithmic growth until saturating at approximately 40–50 pulses. The bubble cloud for the first pulse of each treatment collapsed at 149 ± 2.4 µs. A large increase in tcol of approximately 50 µs was observed between the first and second pulses. tcol increased rapidly within 20 pulses, reaching 220 µs at approximately 20 pulses. After 20 pulses, tcol increased more slowly until approximately 40 to 50 pulses, reaching 230 µs. No significant increases in tcol were observed throughout the remainder of the treatment with an average increase in tcol of approximately 2 µs between 50 and 100 pulses.
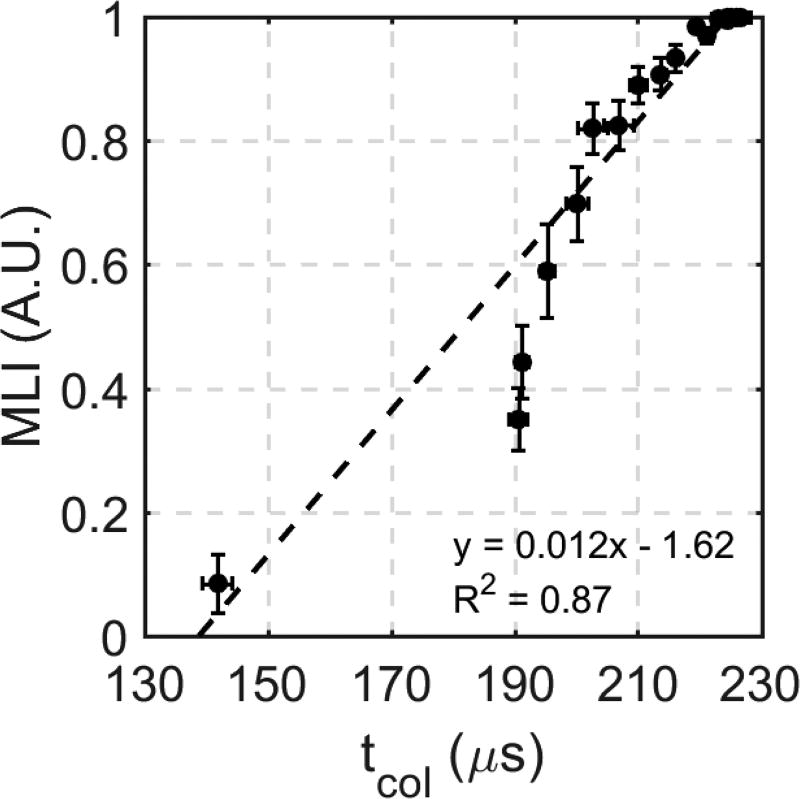
The correlation between the MLI and tcol metrics was computed using linear regression to indicate the validity of using the tcol metric as a measurement of the degree of tissue fractionation. This correlation is shown in Figure 10. Analysis was performed for the entire 100 pulse treatment, and it revealed that a strong linear correlation was observed between the MLI and tcol metrics (R2 = 0.87).
Figure 10.
Linear correlation between tcol and MLI for 100 histotripsy pulses (n=6).
3.3 Experiment 3 - Ex Vivo Bovine Liver Treatment
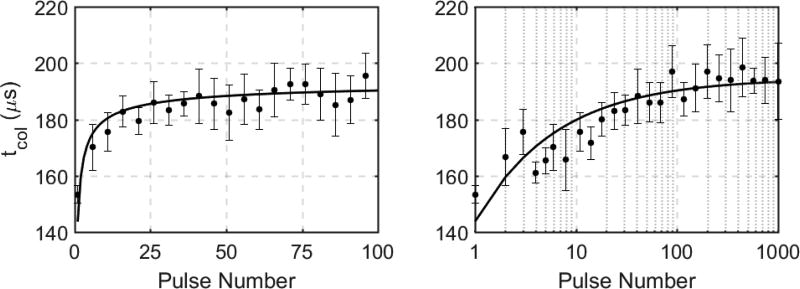
Direct, linear correlations between tcol measurements acquired on the three hydrophones are shown in Figure 3D,E. In general, the three hydrophones resulted in identical measurements of tcol, indicating that a hydrophone could be placed at any location and still acquire the same tcol. The logarithmic growth and saturation trend of tcol over the histotripsy treatment was validated in ex vivo bovine liver samples. The mean change in tcol observed with four ex vivo bovine liver treatments is shown in Figure 11 for the first 100 pulses (left) and for the full 1000 pulse treatment on a log scale (right). The first pulse of each treatment resulted in an average tcol of 153 ± 3.2 µs. During the first 25 pulses, a logarithmic, mono-directional increase in tcol of approximately 30 µs was observed. Between 25 and 100 pulses, only a moderate increase in tcol of approximately 10 µs was observed. During the subsequent pulses between 100 and 1000 pulses, little to no substantial increase was observed with maximum tcol increases for any treatment of approximately 50 µs in comparison to the first pulse of each treatment. The tcol experienced an overall average increase of approximately 40 µs throughout treatment, and it reached this steady-state value of approximately 195 µs tcol around 40 to 50 histotripsy pulses.
Figure 11.
Hydrophone-measured tcol for first 100 pulses (left, linear scale) and 1000 pulses (right, log scale) in ex vivo bovine liver (n=4). The majority of the change in tcol is observed within the first 100 pulses of treatment with little to no change between pulse 100 and pulse 1000.
4. Discussion
Previous work has been reported on the analysis of the cavitation collapse sequence and it’s timing relative to the cavitation expansion. Early studies in cavitation physics investigated the cavitation collapse both numerically and experimentally for spherical and asymmetric bubbles to better understand the mechanisms of cavitation-induced damage and jetting (Ivany & Hammitt, 1965; Mitchell & Hammitt, 1973; Plesset & Chapman, 1971; Ohl, et al., 1995). More recently, studies in the field of shock-wave lithotripsy (SWL) have used the collapse time to monitor changes in cavitation dynamics (Sapozhnikov, et al., 2002) and help detect the presence inertial cavitation (Coleman, et al., 1996), and it has been shown that tcol tends to increase with an increasing number of shockwaves delivered during SWL treatments (Bailey, et al., 2005). It has been shown that SWL cavitation bubbles formed near the surface of a stone or in areas of more densely populated bubble clouds tend to coalesce into an aggregate larger bubble, thus resulting in a longer collapse time (Xi & Zhong, 2000; Tanguay & Colonius, 2003).
In this study, the changes in tcol due to histotripsy-induced destruction of soft tissue were investigated. The data presented in Experiment 1 support our primary hypothesis that tcol increases significantly with decreasing stiffness of the medium, and increases over the histotripsy treatment as the tissue stiffness is reduced with histotripsy-induced fractionation. These results agree with simulation and experimental data that have been presented previously (Vlaisavljevich, et al., 2015a; Vlaisavljevich, et al., 2015b). These data also support our hypothesis that we can accurately measure tcol on a hydrophone using the shockwave emitted by the collapse of the bubble cloud by optically validating the hydrophone data with high-speed images of the bubble cloud. However, there was a non-statistically significant difference in tcol measured by the optical images and the acoustic hydrophone in Experiment 1. This discrepancy is likely due to the relatively low temporal and spatial resolution of the optical imaging. In addition, the optical method measured the collapse time via the presence or absence of the bubble cloud while the hydrophone measured the arrivals of the shockwaves emitted by the expansion and first collapse of the bubble cloud. Therefore, the acoustic hydrophone measurement of tcol is expected to be more precise than that of optical imaging.
Our second hypothesis that the increase in tcol over the histotripsy treatment can be used to monitor the extent of tissue fractionation was supported by the data in Experiment 2 in which RBC phantom destruction was found to correlate linearly with the change in tcol. In Experiment 2, the MLI was only calculated over the central area of the lesion. While the MLI saturated by 50 histotripsy pulses, the images in Figure 8 indicate that there is a change in the lesion periphery throughout the remainder of the treatment. During a typical histotripsy treatment, the focus would be electronically and/or mechanically steered to other locations with each location overlapping slightly such that the periphery of each lesion is treated redundantly. Therefore, for this study, it was most important to quantify the fractionation just at the center of the lesion because the lesion periphery was not representative of the overall fractionation expected during a typical histotripsy treatment.
The increasing trend of tcol over the histotripsy treatment was also validated in ex vivo tissue in Experiment 3. In a recent study, a detailed histological analysis of histotripsy-induced tissue destruction in ex vivo bovine liver samples using the same transducer and similar treatment parameters as the present study was published (Macoskey, et al., 2018). The destruction of hepatocytes identified in Macoskey, et al., 2018 followed a similar trend to the change in tcol in the present study. The majority of hepatocytes were destroyed by 100 pulses, and stronger components of the extracellular matrix such as type I and type III collagen fibers were destroyed by approximately 300–500 pulses with complete liquefaction of all tissue by 1000 pulses. In comparison, the majority of the change in tcol occurred within the first 50 to 100 pulses in the ex vivo bovine liver, thus tcol may be primarily influenced by cellular destruction. These data suggest that the cavitation tcol may be a good indicator to monitor cell destruction during histotripsy therapy.
While a similar trend in the increase in tcol for phantoms of varying stiffness was observed, the data in Experiment 1 indicate that phantoms with higher agar concentrations exhibit smaller and more gradual increases in tcol than the phantoms with lower agar concentrations. Previous work done to investigate the effects of tissue phantom mechanical properties on the efficacy of burst wave lithotripsy treatments have indicated that increased viscoelastic resistance is capable of restricting bubble growth and therefore destruction (Movahed, et al., 2016). Furthermore, fatigue-based models that describe material fatigue in agar phantoms due to irreversible fractionation have also been shown to explain changing bubble dynamics throughout cavitation-based treatments (Movahed, et al., 2017). Therefore, we hypothesize that the reduced destruction in higher concentration phantoms observed in this study is due to two factors. First, gels with higher concentrations are expected to take longer to treat with increased resistance to fatigue due to their increased structural integrity. Second, while the phantom may be liquefied within the lesion area, the mechanical properties of a single-focus lesion are likely still influenced by the boundary effects of surrounding intact material. Future studies will investigate differences in tcol profiles in varying tissues and within volumetric histotripsy lesions to indicate if similar variations can be observed in a physiological setting and when boundary effects are eliminated.
This potential histotripsy feedback method relies on the ability to acquire signals from cavitation collapse sequence throughout treatment. Here, our data indicate that tcol can be measured from multiple locations with nearly identical results acquired at three separate positions. While the hydrophone that was positioned to the side of the histotripsy transducer in this study resulted in signals with the highest SNR for this setup, collapse signals were still obtainable from the other two positions and the tcol measurements were found to be the same across all hydrophones.
Residual cavitation nuclei are small microbubbles that persist well after the histotripsy cavitation bubble cloud has collapsed (Wang, et al., 2012b). It is known that these residual nuclei may affect cavitation dynamics of subsequent bubble clouds, and these effects are known as cavitation memory effects (Duryea, et al., 2015). After the first histotripsy pulse, a portion of the target-region is liquefied while the rest is still intact. In the interstitial fluid spaces, residual cavitation nuclei will persist longer than in intact tissue (Duryea, et al., 2015). While a low PRF of 1 Hz was used in all treatments of this study in an attempt to reduce cavitation memory effects, some residual cavitation nuclei may still persist, especially in the later stages of treatment when tissues and phantoms are highly liquefied or in weaker, lower concentration agar phantoms. However, the variability of tcol observed in this study was relatively low. Therefore, future studies will address this issue by observing tcol under varying treatment PRFs to indicate the impact of memory effects on tcol and then using these observations to gain meaningful insight from the changes of tcol under a variety of treatment parameters.
5. Conclusions
This study shows that the cavitation bubble cloud tcol, which can be measured directly using a broadband hydrophone, increases significantly with decreasing stiffness of the treated medium. It was found that tcol increases throughout histotripsy therapy in both tissue-mimicking agar phantoms and ex vivo bovine tissue, and it was shown that this increase in tcol tracks with histotripsy treatment progression. These preliminary results suggest that observing changes in the cavitation collapse signal may be used as a feedback mechanism for histotripsy-induced tissue fractionation.
Supplementary Material
Acknowledgments
This work was supported by a Research Scholar Grant from the American Cancer Society (RSG-13-101-01-CCE), a grant from National Institute of Biomedical Imaging and Bioengineering (NIBIB) of the National Institutes of Health under Award Number R01EB008998, a grant from National Institute of Neurological Disorders and Stroke (NINDS) of the National Institutes of Health under Award Number R21NS093121, and The Hartwell Foundation. We also gratefully acknowledge support from the Office of Naval Research (Dr. Timothy Bentley) under grant N000141712058. Disclosure notice: Drs. Tim Hall, Charles Cain, Fred Lee Jr., Eli Vlaisavljevich, and Zhen Xu have financial interests and/or other relationships with HistoSonics Inc.
References
- Bailey M, et al. Cavitation detection during shock-wave lithotripsy. Ultrasound in Med. & Biol. 2005;31(9):1245–56. doi: 10.1016/j.ultrasmedbio.2005.02.017. [DOI] [PubMed] [Google Scholar]
- Barajas C, Johnsen E. The effects of elasticity on heat and mass diffusion for freely oscillating bubbles in a tissue-like medium. J. Acoust. Soc. Am. 2017;141:908–918. doi: 10.1121/1.4976081. [DOI] [PMC free article] [PubMed] [Google Scholar]
- Cain C, Wang T-Z. Imaging feedback of histotripsy treatments with ultrasound transient elastography. 20130102932 A1. United States, Patent No. US. 2012 doi: 10.1109/tuffc.2012.2307. [DOI] [PMC free article] [PubMed]
- Cleveland R, Sapozhnikov O, Bailey M, LA C. A dual passive cavitation detector for localized detection of lithotripsy-induced cavitation in vitro. J. Acoust. Soc. Am. 2000 Feb;107(3) doi: 10.1121/1.428572. [DOI] [PubMed] [Google Scholar]
- Coleman A, Choi M, Saunders J. Detection of acoustic emission from cavitation in tissue during clinical extracorporeal lithotripsy. Ultrasound in Med. & Biol. 1996;22(8):1079–87. doi: 10.1016/s0301-5629(96)00118-4. [DOI] [PubMed] [Google Scholar]
- Coussios C, Farny C, Ter Haar G, Roy R. Role of acoustic cavitation in the delivery and monitoring of cancer treatment by high-intensity focused ultrasound (HIFU) International Journal of Hyperthermia. 2007;23(2):105–120. doi: 10.1080/02656730701194131. [DOI] [PubMed] [Google Scholar]
- Duryea A, Cain C, Roberts W, Hall T. Removal of residual cavitation nuclei to enhance histotripsy fractionation of soft tissue. IEEE Trans. Ultrason., Ferroelect., Freq. Control. 2015;62(12):2068–78. [PMC free article] [PubMed] [Google Scholar]
- Duryea A, Tamaddoni H, Cain C, Roberts WHT. Removal of residual nuclei following a cavitation event: a parametric study. IEEE Trans. Ultrason. Ferroelectr. Freq. Control. 2015 Sep;62(9):1605–1614. doi: 10.1109/TUFFC.2014.006601. [DOI] [PMC free article] [PubMed] [Google Scholar]
- Estrada J, et al. High strain-rate soft material characterization via inertial cavitation. Journal of the Mechanics and Physics of Solids. 2017 p. accepted. [Google Scholar]
- Gateau J, et al. Combined Passive Detection and Ultrafast Active Imaging of Cavitation Events Induced by Short Pulses of High-Intensity Ultrasound. IEEE Trans. Ultrason., Ferroelect., Freq. Control. 2011;58(3):517–32. doi: 10.1109/TUFFC.2011.1836. [DOI] [PMC free article] [PubMed] [Google Scholar]
- Gaudron R, Warnez M, Johnsen E. Bubble dynamics in a viscoelastic medium with nonlinear elasticity. J. Fluid Mech. 2015;766:54–75. [Google Scholar]
- Gyöngy M, Arora M, Noble JA, Coussios CC. Use of Passive Arrays for Characterization and Mapping of Cavitation Activity during HIFU Exposure; Beijing. IEEE International Ultrasonics Symposium Proceedings; 2008. pp. 871–874. [Google Scholar]
- Hall T, Fowlkes J, Cain C. A real-time measure of cavitation induced tissue disruption by ultrasound imaging backscatter reduction. IEEE Trans. Ultrason., Ferroelect., Freq. Control. 2007b;54(3):569–75. doi: 10.1109/tuffc.2007.279. [DOI] [PubMed] [Google Scholar]
- Hall T, et al. Histotripsy of rabbit renal tissue in vivo: Temporal histologic trends. J. Endoural. 2007a;21:1159–1166. doi: 10.1089/end.2007.9915. [DOI] [PubMed] [Google Scholar]
- Hua C, Johnsen E. Nonlinear oscillations following the Rayleigh collapse of a gas bubble in a linear viscoelastic (tissue-like) medium. Physics of Fluids. 2013;25:083101. [Google Scholar]
- Ivany R, Hammitt F. Cavitation bubble collapse in viscous, compressible liquids - Numerical analysis. J. Basic Eng. 1965;87(4):977–985. [Google Scholar]
- Keller J, Miksis M. Bubble oscillations of large amplitude. J. Acoust. Soc. Am. 1980;68(2):628–633. [Google Scholar]
- Leighton T. The Acoustic Bubble. San Diego: Academic Press, Inc.; 1994. The Forced Bubble; pp. 287–438. [Google Scholar]
- Lin K-W, et al. Histotripsy beyond the intrinsic cavitation threshold using very short ultrasound pulses: Microtripsy. IEEE Trans. on Ultrasonics, Ferroelectrics, and Frequency Control. 2014 Feb;61(2):251–265. doi: 10.1109/TUFFC.2014.6722611. [DOI] [PMC free article] [PubMed] [Google Scholar]
- Macoskey J, et al. Real-time acoustic-based feedback for histotripsy therapy. Boston, MA: 2017. s.n. [Google Scholar]
- Macoskey J, et al. Bubble-Induced Color Doppler Feedback Correlates with Histotripsy-Induced Destruction of Structural Components in Liver Tissue. Ultrasound in Med. & Biol. 2018;44(3):602–12. doi: 10.1016/j.ultrasmedbio.2017.11.012. [DOI] [PMC free article] [PubMed] [Google Scholar]
- Maxwell A, et al. Probability of cavitation for single ultrasound pulses applied to tissues and tissue-mimicking materials. Ultrasound in Med & Biol. 2013;39(3):449–465. doi: 10.1016/j.ultrasmedbio.2012.09.004. [DOI] [PMC free article] [PubMed] [Google Scholar]
- Maxwell A, et al. A tissue phantom for visualization and measurement of ultrasound-induced cavitation damage. Ultrasound Med. Biol. 2010;36:2132–2143. doi: 10.1016/j.ultrasmedbio.2010.08.023. [DOI] [PMC free article] [PubMed] [Google Scholar]
- Miller R. Histotripsy for Pediatric Cardiac Applications. Ann Arbor: 2014. s.n. [Google Scholar]
- Miller R, et al. Real-time elastography-based monitoring of histotripsy tissue fractionation using color Doppler. Dresden, Germany: 2012. s.n. [Google Scholar]
- Miller R, et al. Bubble-Induced Color Doppler Feedback for Histotripsy Fractionation. IEEE Trans Ultrason Ferroelectr Freq Control. 2016;63(3):408–19. doi: 10.1109/TUFFC.2016.2525859. [DOI] [PMC free article] [PubMed] [Google Scholar]
- Mitchell T, Hammitt F. Asymmetric cavitation bubble collapse. J. Fluids Eng. 1973;95(1):29–37. [Google Scholar]
- Movahed P, et al. Ultrasound-induced bubble clusters in tissue-mimicking agar phantoms. Ultrasound Med. Biol. 2017;43(10):2318–2328. doi: 10.1016/j.ultrasmedbio.2017.06.013. [DOI] [PMC free article] [PubMed] [Google Scholar]
- Movahed P, et al. Cavitation-induced damage of soft materials by focused ultrasound bursts: A fracture-based bubble dynamics model. J. Acoust. Soc. Am. 2016;140:1374–1386. doi: 10.1121/1.4961364. [DOI] [PMC free article] [PubMed] [Google Scholar]
- Normand V, et al. New insight into agarose gel mechanical properties. Biomacromolecules. 2000;1:730–8. doi: 10.1021/bm005583j. [DOI] [PubMed] [Google Scholar]
- Ohl C-D, Philipp A, Lauterborn W. Cavitation bubble collapse studied at 20 million frames per second. Ann. Physik. 1995;507(1):26–34. [Google Scholar]
- Parsons J, Cain C, Abrams GFJ. Pulsed cavitational ultrasound therapy for controlled tissue homogenization. Ultrasound Me. Biol. 2006;32:115–129. doi: 10.1016/j.ultrasmedbio.2005.09.005. [DOI] [PubMed] [Google Scholar]
- Parsons JE, Cain CA, Fowlkes JB. Cost-effective assembly of a basic fiber-optic hydrophone for measurement of high-amplitude therapeutic ultrasound fields. J. Acoust. Soc. Am. 2006 Mar;119:1432–1440. doi: 10.1121/1.2166708. [DOI] [PubMed] [Google Scholar]
- Plesset M. Shockwaves from cavity collapse. Phil. Trans. Royal Soc. A. 1966;260(1110):241–244. [Google Scholar]
- Plesset M, Chapman R. Collapse of an inertially spherical vapour cavity in the neighborhood of a solid boundary. J. Fluid Mech. 1971;47(2):283–90. [Google Scholar]
- Plesset M, Prosperetti A. Bubbly Dynamics and Cavitation. Ann. Rev. Fluid Mech. 1977;9:145–185. [Google Scholar]
- Roberts W, et al. Pulse cavitational ultrasound: A noninvasive technology for controlled tissue ablation (histotripsy) J. Urol. 2006;175:734–738. doi: 10.1016/S0022-5347(05)00141-2. [DOI] [PubMed] [Google Scholar]
- Salgaonkar V, Datta S, Holland C, Mast T. Passive cavitation imaging with ultrasound arrays. J. Acoust. Soc. Am. 2009;126(6):3071–83. doi: 10.1121/1.3238260. [DOI] [PMC free article] [PubMed] [Google Scholar]
- Sapozhnikov O, et al. Effect of overpressure and pulse repetition frequency on cavitation in shock wave lithotripsy. J. Acoust. Soc. Am. 2002;112(3):1183–95. doi: 10.1121/1.1500754. [DOI] [PubMed] [Google Scholar]
- Sukovich J, et al. Investigation of the source of histotripsy acoustic backscatter signals. Journ. Acoust. Soc. Am. 2017;141:3551. [Google Scholar]
- Tanguay M, Colonius T. Progress in modeling and simulation of shock wave lithotripsy (SWL); Osaka, Japan. Fifth International Symposium on Cavitation.2003. [Google Scholar]
- Vlaisavljevich E, et al. Image-guided non-invasive ultrasound liver ablation using histotripsy: Feasibility study in an in vivo porcine model. Ultrasound Med. Biol. 2013;39:1398–1409. doi: 10.1016/j.ultrasmedbio.2013.02.005. [DOI] [PMC free article] [PubMed] [Google Scholar]
- Vlaisavljevich E, et al. Effects of tissue mechanical properties on susceptibility to histotripsy-induced tissue damage. Phys. Med. Biol. 2014a;59:253–270. doi: 10.1088/0031-9155/59/2/253. [DOI] [PMC free article] [PubMed] [Google Scholar]
- Vlaisavljevich E, et al. Effects of ultrasound frequency and tissue stiffness on the histotripsy intrinsic threshold for cavitation. Ultrasound Med Biol. 2015a Jun;41(6):1651–1666. doi: 10.1016/j.ultrasmedbio.2015.01.028. [DOI] [PMC free article] [PubMed] [Google Scholar]
- Vlaisavljevich E, et al. Effects of tissue stiffness, ultrasound frequency, and pressure on histotripsy-induced cavitation bubble behavior. Phys Med Biol. 2015b Feb;60:2271–2292. doi: 10.1088/0031-9155/60/6/2271. [DOI] [PMC free article] [PubMed] [Google Scholar]
- Vlaisavljevich E, et al. Histotripsy-induced cavitation cloud initiation thresholds in tissues of different mechanical properties. IEEE Trans. Ultrason. Ferroelectr. Freq. Control. 2014b;61(2):341–352. doi: 10.1109/TUFFC.2014.6722618. [DOI] [PMC free article] [PubMed] [Google Scholar]
- Wang T-Z, et al. Imaging feedback of histotripsy treatments using ultrasound shear wave elastography. IEEE Trans. Ultrason., Ferroelect., Freq. Control. 2012a;59(6):1167–81. doi: 10.1109/tuffc.2012.2307. [DOI] [PMC free article] [PubMed] [Google Scholar]
- Wang T-Z, et al. Imaging feedback for histotripsy by characterizing dynamics of acoustic radiation force impulse (ARFI)-induced shear waves excited in a treated volume. IEEE Trans. Ultrason., Ferroelect., Freq. Control. 2014;61(7):1137–51. doi: 10.1109/TUFFC.2014.3013. [DOI] [PubMed] [Google Scholar]
- Wang T-Z, et al. An efficient treatment strategy for histotripsy by removing cavitation memory. Ultrasound Med. Biol. 2012b;38(5):753–766. doi: 10.1016/j.ultrasmedbio.2012.01.013. [DOI] [PMC free article] [PubMed] [Google Scholar]
- Whittingham T, Duck F, Baker, AC SH. Ultrasound in Medicine. Philadelphia: Institute of Physics Publishing; 1998. The Purpose and Techniques of Acoustc Output Measurement; pp. 129–148. [Google Scholar]
- Xi X, Zhong P. Improvement of stone fragmentation during shock-wave lithotripsy using a combined EH/PEAA shock-wave generator - In vitro experiments. Ultrasound in Med. & Biol. 2000;26(3):457–67. doi: 10.1016/s0301-5629(99)00124-6. [DOI] [PubMed] [Google Scholar]
- Xu Z, Hall T, Fowlkes JB, Cain CA. Effects of acoustic parameters on bubble cloud dynamics in ultrasound tissue erosion (histotripsy) The Journal of the Acoustical Society of America. 2007 Jul;122(1):229–236. doi: 10.1121/1.2735110. [DOI] [PMC free article] [PubMed] [Google Scholar]
- Xu Z, et al. Controlled Ultrasound Tissue Erosion. IEEE Trans. Ultrason., Ferroelect., Freq. Control. 2004 Jun;51(6):726–736. doi: 10.1109/tuffc.2004.1308731. [DOI] [PMC free article] [PubMed] [Google Scholar]
- Xu Z, et al. Size Measurement of Tissue Debris Particles Generated from Pulsed Ultrasound Cavitational Therapy - Histotripsy. Ultrasound Med. Biol. 2009 Feb;35(2):245–255. doi: 10.1016/j.ultrasmedbio.2008.09.002. [DOI] [PMC free article] [PubMed] [Google Scholar]
- Yang X, Church C. A model for the dynamics of gas bubbles in soft tissue. J. Acoust. Soc. Am. 2005;118(6):3595–3606. doi: 10.1121/1.2118307. [DOI] [PubMed] [Google Scholar]
- Zhang X, et al. Non-Invasive Thrombolysis Using Microtripsy in a Porcine Deep Vein Thrombosis Model. Ultrasound Med. Biol. 2017;43(7):1378–90. doi: 10.1016/j.ultrasmedbio.2017.01.028. [DOI] [PMC free article] [PubMed] [Google Scholar]
- Zhang X, et al. Histotripsy Thrombolysis on Retracted Clots. Ultrasound Med. Biol. 2016 Aug;42(8):1903–1918. doi: 10.1016/j.ultrasmedbio.2016.03.027. [DOI] [PMC free article] [PubMed] [Google Scholar]
Associated Data
This section collects any data citations, data availability statements, or supplementary materials included in this article.


