Abstract
Bromodomain and extra terminal protein (BET) inhibitors are first-in-class targeted therapies that deliver a new therapeutic opportunity by directly targeting bromodomain proteins that bind acetylated chromatin marks1,2. Early clinical trials have shown promise, especially in acute myeloid leukaemia3, and therefore the evaluation of resistance mechanisms is crucial to optimize the clinical efficacy of these drugs. Here we use primary mouse haematopoietic stem and progenitor cells immortalized with the fusion protein MLL-AF9 to generate several single-cell clones that demonstrate resistance, in vitro and in vivo, to the prototypical BET inhibitor, I-BET. Resistance to I-BET confers cross-resistance to chemically distinct BET inhibitors such as JQ1, as well as resistance to genetic knockdown of BET proteins. Resistance is not mediated through increased drug efflux or metabolism, but is shown to emerge from leukaemia stem cells both ex vivo and in vivo. Chromatin-bound BRD4 is globally reduced in resistant cells, whereas the expression of key target genes such as Myc remains unaltered, highlighting the existence of alternative mechanisms to regulate transcription. We demonstrate that resistance to BET inhibitors, in human and mouse leukaemia cells, is in part a consequence of increased Wnt/β-catenin signalling, and negative regulation of this pathway results in restoration of sensitivity to I-BET in vitro and in vivo. Together, these findings provide new insights into the biology of acute myeloid leukaemia, highlight potential therapeutic limitations of BET inhibitors, and identify strategies that may enhance the clinical utility of these unique targeted therapies.
Our increasing knowledge of cancer genomes and epigenomes not only implicates epigenetic regulators in the initiation and maintenance of cancer, but also highlights an opportunity for therapeutic intervention4,5. One of the most promising epigenetic therapies to have emerged in the past decade are small molecule inhibitors targeting the bromodomains of BET family proteins (BRD2, BRD3, BRD4 and BRDT)1,2. While these non-catalytic inhibitors are currently being evaluated in clinical trials across a range of malignancies, the molecular and cellular mechanisms that govern sensitivity and resistance remain largely unknown. We and others have previously demonstrated the pre-clinical efficacy of BET inhibitors in acute myeloid leukaemia (AML)6–8, and early clinical evidence has reinforced the potential of these drugs3.
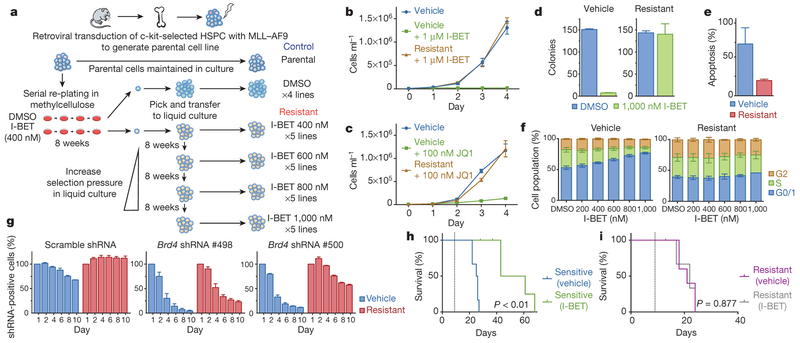
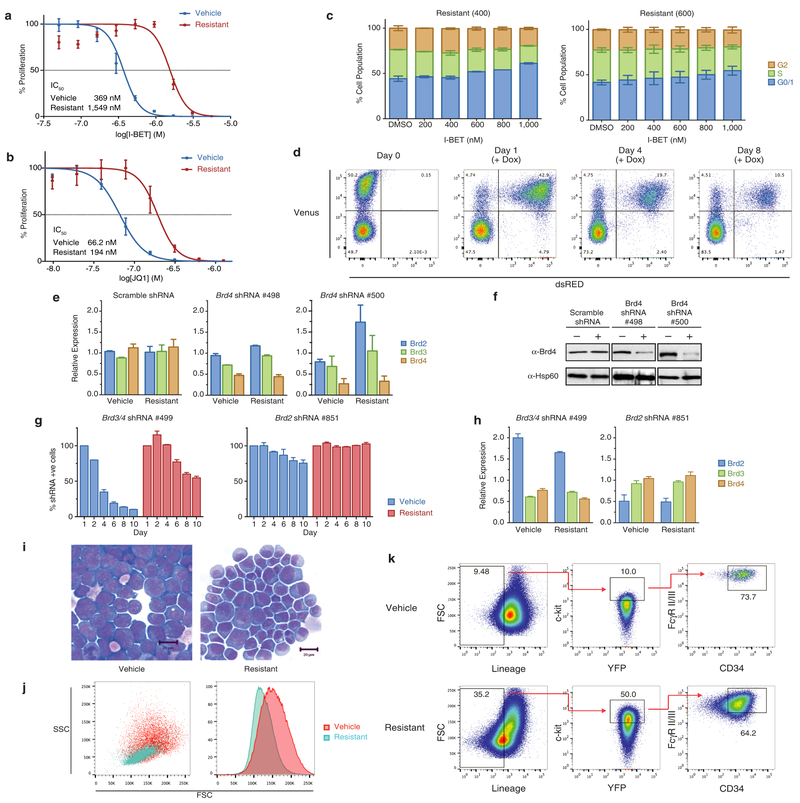
To study BET inhibitor resistance in a model of AML, we transduced mouse bone marrow haematopoietic stem and progenitor cells (HSPCs) with MLL–AF9. After a selection period in cytokine-supplemented methylcellulose in the presence of dimethylsulfoxide (DMSO; vehicle) or I-BET at the IC40 value (40% of maximal inhibitory effect concentration) of these cells (400 nM), we isolated individual blast colonies, each derived from a single cell, to generate four independent vehicle-treated and five independent I-BET-resistant cell lines (Fig. 1a). The selection pressure on I-BET-resistant clones was sequentially increased to establish clones stably growing at various concentrations including those greater than the IC90 value of the parental and vehicle-treated cells (Fig. 1a, b and Extended Data Fig. la). While chemically distinct inhibitors directed against the same target have sometimes overcome resistance9, our data indicates that resistance to I-BET also confers cross-resistance to the chemically distinct BET inhibitor JQ1 (ref. 10) (Fig. 1c and Extended Data Fig. 1b).
Figure 1 |. Establishment of a model of BET inhibitor resistance.
a, Strategy for the generation of resistant clones. HSPC, haematopoietic stem and progenitor cells. b, Resistance to I-BET demonstrated in cell proliferation assays performed in biological triplicate (mean ± s.d.). c, Resistance to JQ1 demonstrated in cell proliferation assays performed in biological triplicate (mean ± s.d.). d, Resistance to I-BET in clonogenic assays performed in biological duplicate (mean ± s.e.m.). e, Resistance to I-BET-mediated induction of apoptosis in biological triplicate experiments (mean ± s.e.m.). f, Resistant clones do not demonstrate cell cycle arrest in biological triplicate experiments (mean ± s.e.m.). g, Resistance to shRNA-mediated knockdown of Brd4 in biological duplicate experiments (mean ± s.e.m.). h, i, Kaplan-Meier curve of secondary syngeneic transplant of sensitive (h) and resistant (i) clones (n = 6 per group, statistical significance calculated using a log-rank test). Dotted line denotes treatment starting on day 9.
Direct comparison of these cell lines demonstrated that although vehicle-treated cells remained exquisitely sensitive to I-BET-mediated suppression of clonogenic capacity, induction of apoptosis and cell cycle arrest, the resistant cells were now impervious to these established phenotypic responses at levels that positively correlated with the degree of selective pressure applied (Fig. 1d–f and Extended Data Fig. 1c). High-content short hairpin RNA (shRNA) screens in this AML model previously identified Brd4 as the major therapeutic target of BET inhibitors8. Using an inducible shRNA system, we were able to replicate these findings in our vehicle-treated clones; however, BET-inhibitor-resistant clones were significantly less susceptible to genetic depletion of Brd4 (Fig. 1g and Extended Data Fig. 1d–h).
Consistent with our previous data7, I-BET leads to a significant survival advantage in this AML model (Fig. 1h). By contrast, this survival advantage is abrogated following an identical treatment strategy in recipients of resistant cells (Fig. 1i). No differences in morphology or pattern of disease between sensitive or resistant cells were observed (Extended Data Fig. li and data not shown). Together, these findings establish a robust model of BET inhibitor resistance in vitro and in vivo, and show that resistant cells are refractory to either chemical or genetic perturbation of Brd4.
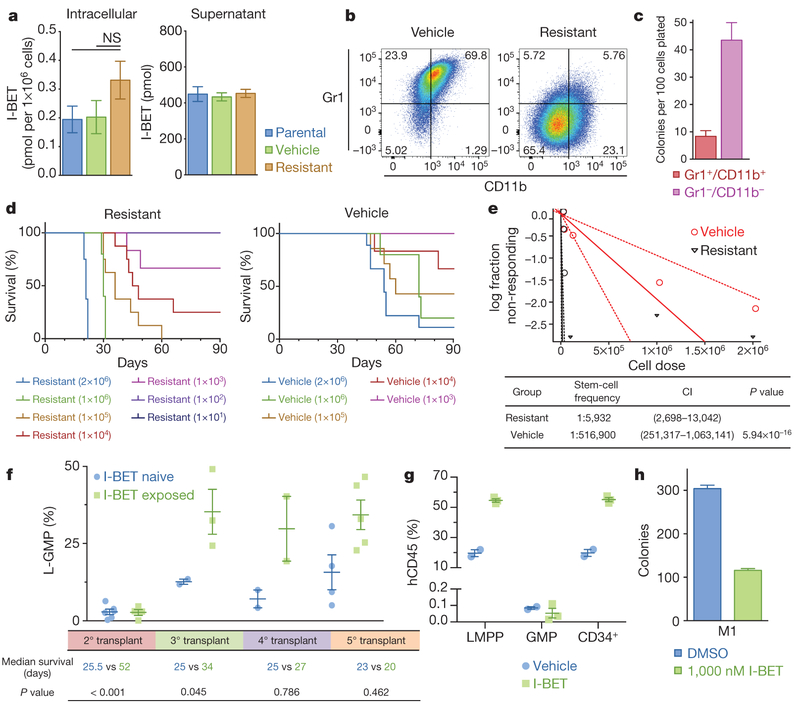
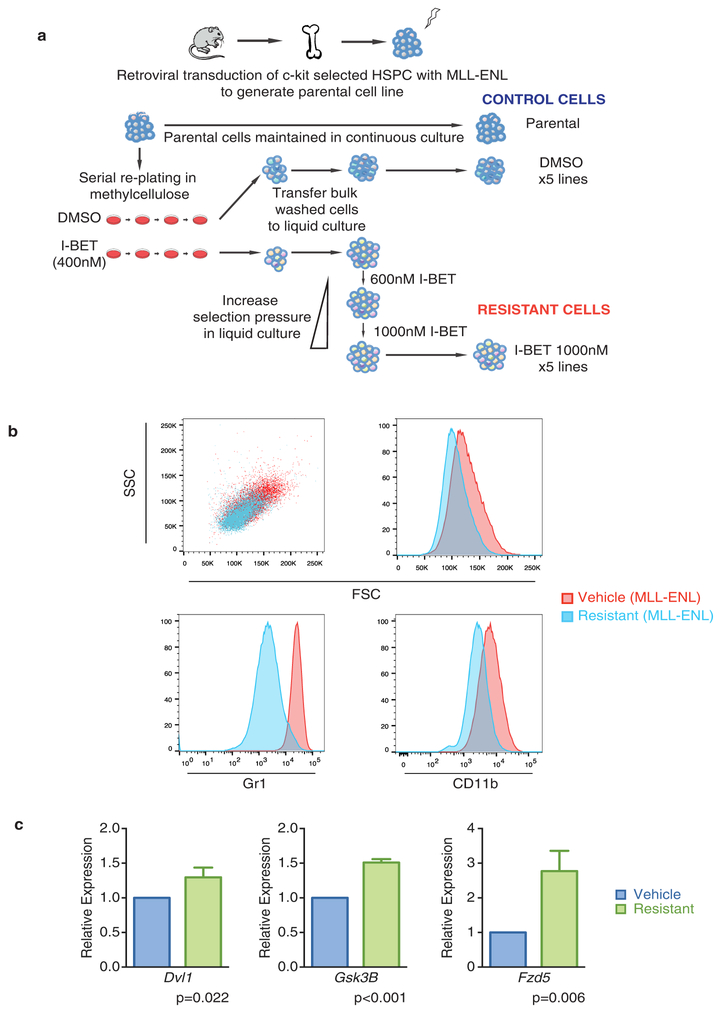
Major mechanisms of drug resistance include reduced drug influx or increased drug efflux11. To address this issue, we performed quantitative mass spectrometry, which revealed no significant difference in the amount of intracellular or extracellular drug (Fig. 2a). However, we noted that resistant cells were smaller and more homogenous by flow cytometry (Extended Data Fig. 1j), and further immunophenotypic characterization of sensitive and resistant cells revealed marked differences in the expression of the lineage markers Gr1 and CD11b (Fig. 2b). These findings were replicated in an independent MLL-ENL model of BET inhibitor resistance (Extended Data Fig. 2).
Figure 2 |. Resistance to BET inhibitors arises from the LSC compartment.
a, Intracellular and extracellular concentrations of I-BET as assessed by quantitative mass spectrometry in biological duplicates (mean ± s.e.m., statistical significance calculated using a two-tailed Student’s t-test). NS, not significant, b, Resistant clones demonstrate an immature immunophenotype (Grl−/CD11b−). c, Clonogenic capacity of the Grl−/CDllb− and Gr1+/CD11b+ populations in resistant clones performed in biological duplicate (mean ± s.e.m.). d, Limiting dilution transplantation analyses Kaplan–Meier curves of C57BL/6 mice injected with indicated number of cells detailed cohort and survival data can be found in Extended Data Fig. 3a. e, LSC frequency from limiting dilution transplantation analyses. Dotted lines indicate 95% confidence intervals (Cl), f, L-GMP frequency in whole mouse bone marrow (mean ± s.e.m.) after serial transplantation of I-BET-exposed leukaemias from in vivo resistance model. Statistical significance of survival outcomes determined using log-rank test of Kaplan–Meier survival estimates, g, Proportion of human leukaemic CD34+ cells, GMPs and LMPPs in whole mouse bone marrow (mean ± s.e.m.) after I-BET exposure in an AML PDX model (n = 5). h, I-BET-naive L-GMPs do not demonstrate intrinsic resistance to I-BET in clonogenic assays in biological duplicate experiments (mean ± s.e.m.), see also Extended Data Fig. 5b. M1, mouse 1.
While the precise immunophenotype of leukaemia stem cells (LSCs) in mouse MLL leukaemia models has been debated12–14, it has previously been shown that LSC potential primarily resides in the more immature, lineage-negative (Lin−, Sca−, cKit+, CD34+, FcγRII/RIII+) leukaemic granulocyte-macrophage progenitor (L-GMP) population, raising the possibility that BET-inhibitor-resistant cells are enriched for LSCs12,14,15. Consistent with this notion, we noted a significant increase in the blast colony forming potential of the Lin− (Gr1−/CD11b−) population, and a marked increase in L-GMP cells in our resistant population before primary transplantation (Fig. 2c and Extended Data Fig. 1k).
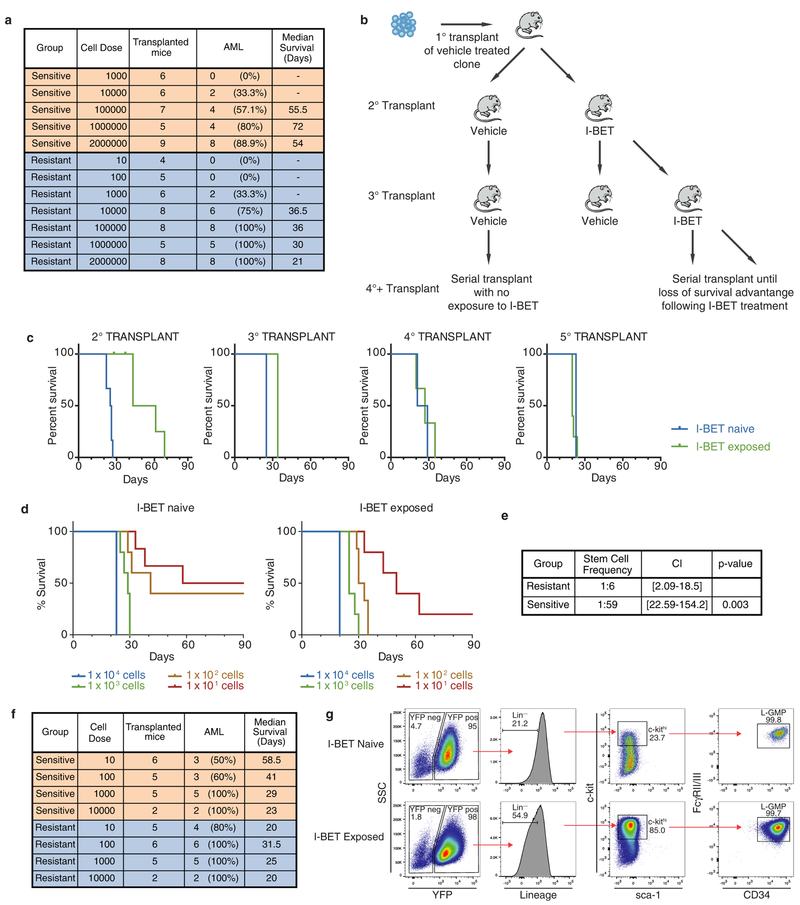
While primary transplantation of vehicle-treated cells paralleled the natural history of this AML model, remarkably, primary transplantation of I-BET-resistant cells resulted in considerably shorter leukaemia latency (Fig. 2d). Moreover, limiting dilution transplantation analyses confirm that I-BET-resistant cells were markedly enriched for LSC potential (Fig. 2d, e and Extended Data Fig. 3a). To assess the relevance of these findings to resistance that emerges in vivo after sustained exposure to I-BET, we derived an independent in vivo model of I-BET resistance (Extended Data Fig. 3b, c). These data validated findings from the ex vivo model, and show that in vivo BET-inhibitor resistance also emerges from an L-GMP/LSC population (Fig. 2f and Extended Data Fig. 3d–g). Importantly, these I-BET-resistant AML cells have a functional LSC frequency of approximately 1:6; this is virtually identical to what has previously been reported for a purified L-GMP population12.
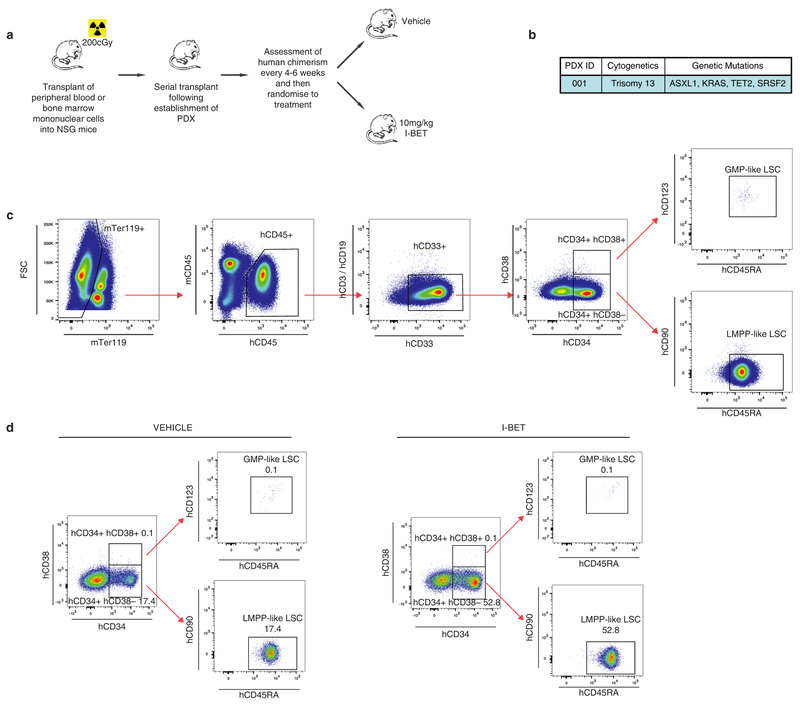
To extend these findings into primary patient samples we treated a patient-derived xenograft (PDX) model of AML with I-BET. While the immunophenotype of human AML LSCs can be variable16, several PDX models have shown that LSCs are enriched within CD34+ cells16,17, which immunophenotypically parallel GMPs or lymphoid-primed multipotent progenitors (LMPPs)18. Consistent with the data from our mouse AML models, we find that I-BET treatment enriches for the leukaemic LMPP population (Fig. 2g and Extended Data Fig. 4).
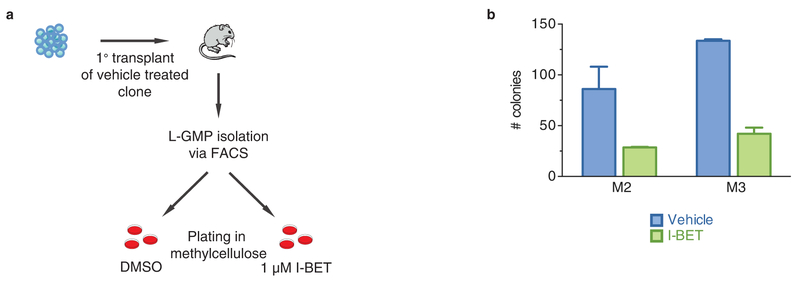
To understand whether LSCs were intrinsically resistant to I-BET, we sorted L-GMPs from mice that were I-BET-naive, and challenged them with 1 μM of I-BET in clonogenic assays. While this dose virtually eradicates the clonogenic potential of I-BET-naive bulk leukaemia cells (Fig. 1d and ref. 7), between 30 and 40% of L-GMPs are able to survive (Fig. 2h and Extended Data Fig. 5). Moreover, initial treatment with I-BET in vivo does not result in an immediate increase in L-GMPs, instead this population progressively emerges with continuous and sustained exposure to drug in vivo (Fig. 2f). These findings suggest that immunophenotypically homogenous L-GMPs/LSCs show marked heterogeneity in their response to I-BET, and that not all L-GMPs are intrinsically resistant to BET inhibitors.
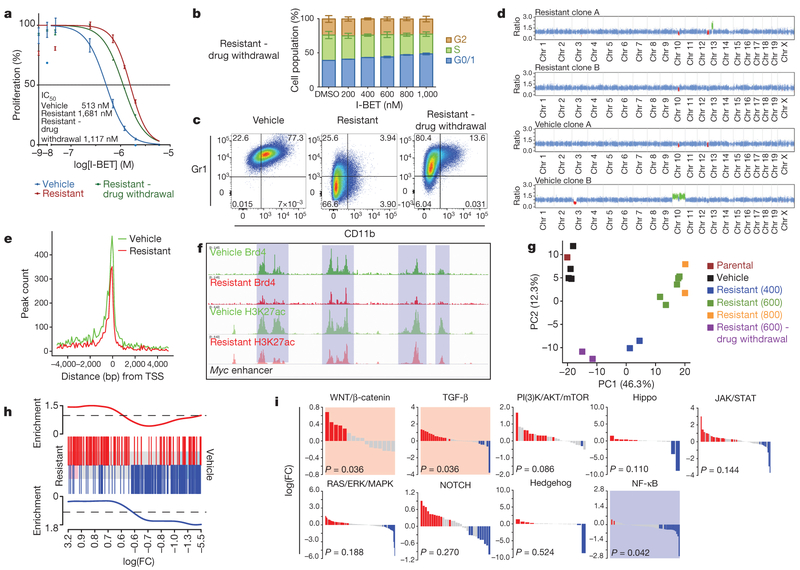
We next sought to understand whether BET inhibitor resistance was reversible in the absence of continuing selective pressure with I-BET. Surprisingly we find that BET inhibitor sensitivity was only partially restored (Fig. 3a, b), and these cells only partially reacquire the immunophenotype of sensitive I-BET-naive cells (Fig. 3c). Moreover, transcriptionally, they also adopt an intermediate state between sensitive cells and those resistant to I-BET above the IC60 value of the drug (Fig. 3g).
Figure 3 |. Genetic, epigenetic and transcriptional characterization of BET-inhibitor-resistant cells.
a, Proliferation assays in sensitive, resistant cells maintained in I-BET and after 8 weeks drug withdrawal (mean ± s.d., n = 12 per group). b, Cell cycle profile in resistant clones after drug withdrawal performed in biological triplicate experiments (mean ± s.e.m.). c, Immunophenotype of sensitive, resistant and drug-withdrawal cells. d, Whole-exome capture sequencing data from vehicle-treated and resistant clones normalized to the parental cell line; red regions denote copy number loss and green regions denote copy number gain. e, Brd4 binding profiled across all annotated transcriptional start sites (TSSs). f, Brd4 binding and histone 3 Lys 27 acetylation (H3K27ac) at Myc enhancer elements. g, Principle component (PC) analysis of parental cells, vehicle-treated clones (n = 4), resistant clones (n = 9) and resistant clones after drug withdrawal (n = 2). Parentheses denote concentration of I-BET (nM) in which resistant clones have been stably maintained. h, GSEA identifies enrichment of a published LSC signature in resistant clones. Upregulated and downregulated genes in the published LSC signature are shown in red and blue, respectively, and correlate with upregulated and downregulated (false discovery rate (FDR) < 5.0 × 10⁻⁵) genes in the I-BET-resistant clones. i, Statistically significant upregulation (shaded red) of the WNT/β-catenin and TGF-β pathways and downregulation (shaded blue) of the NF-κB pathway is observed in all resistant clones (n = 11).
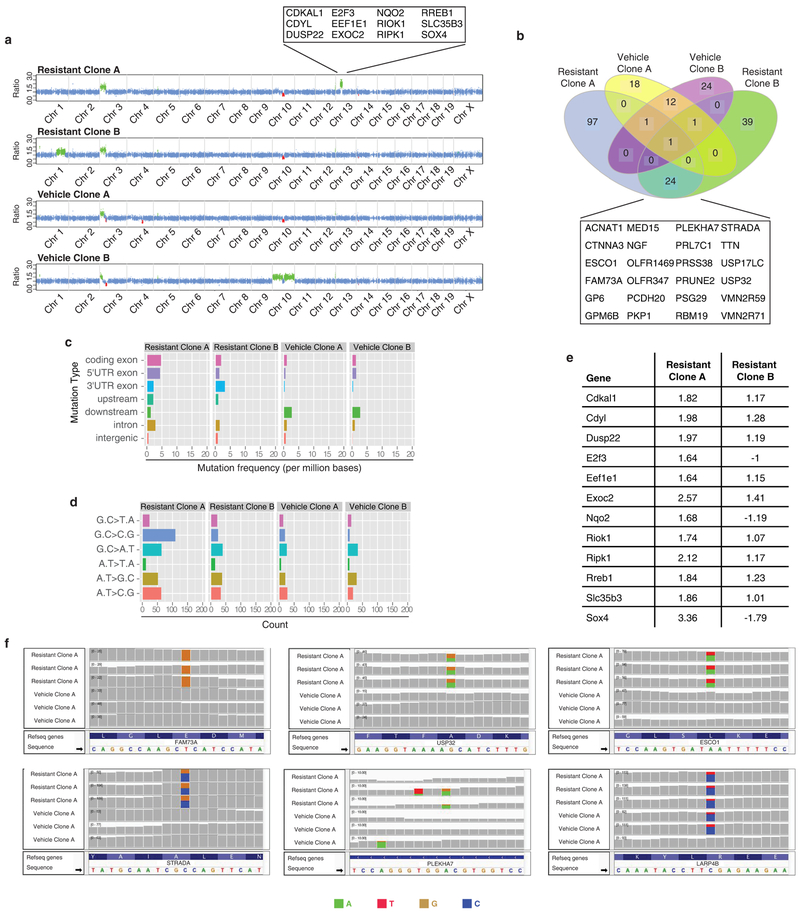
To explore the molecular aetiology for BET inhibitor resistance further, we initially performed whole-exome sequencing in the parental and two separate vehicle/I-BET-resistant cell lines (Fig. 3d and Extended Data Fig. 6). Similar to human leukaemias driven by MLL fusion proteins19, these mouse leukaemia cells do not demonstrate significant genomic instability (Extended Data Fig. 6). Notably, although independently established resistant clones behaved identically in all functional analyses described above, there were no gatekeeper mutations in the bromodomains of Brd2/3/4, and no shared copy number aberrations. Moreover, only a few mutations with no apparent functional relevance to AML and/or BET activity were shared across several resistant cell lines (Fig. 3d and Extended Data Fig. 6a, b).
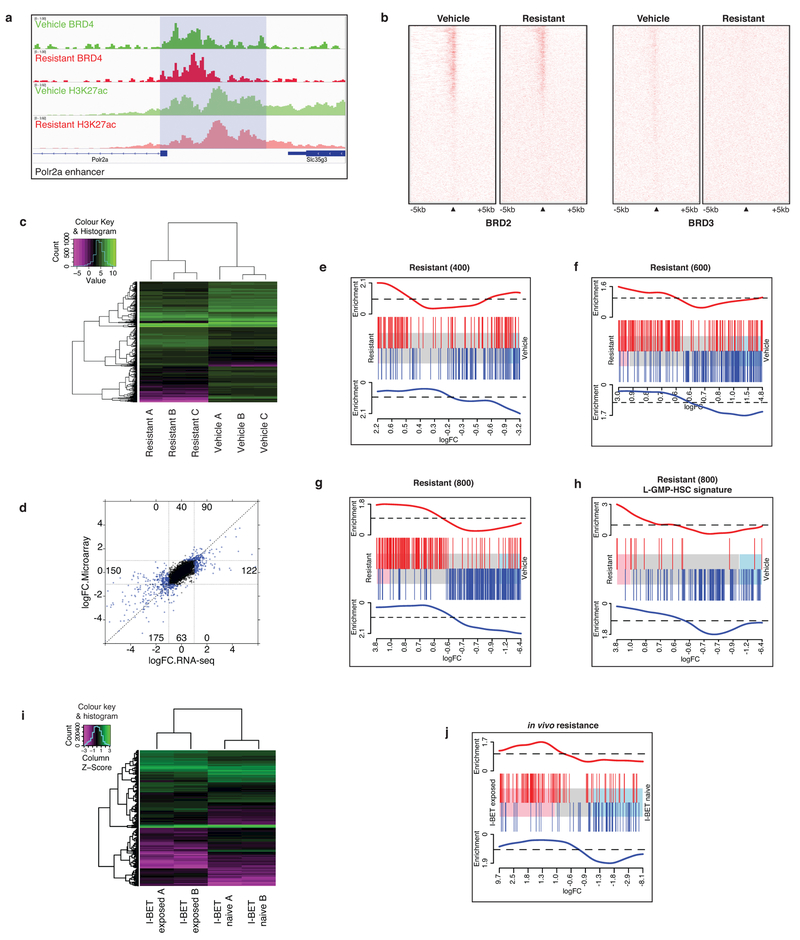
We, and others, have shown that treatment with BET inhibitors results in incomplete displacement of Brd2, Brd3 and Brd4 from chromatin6,20. Similarly, we noticed that resistant cells stably growing in I-BET also showed a decrease in chromatin-bound Brd2, Brd3 and Brd4 (Fig. 3e and Extended Data Fig. 7a, b). Notably, however, we found that key Brd4 target genes such as Myc were equally expressed in resistant cells despite loss of Brd4 from functional Myc enhancer elements (Figs 3f and 4g). These findings raised the prospect that alternative compensatory transcriptional programmes were active in BET-resistant cells.
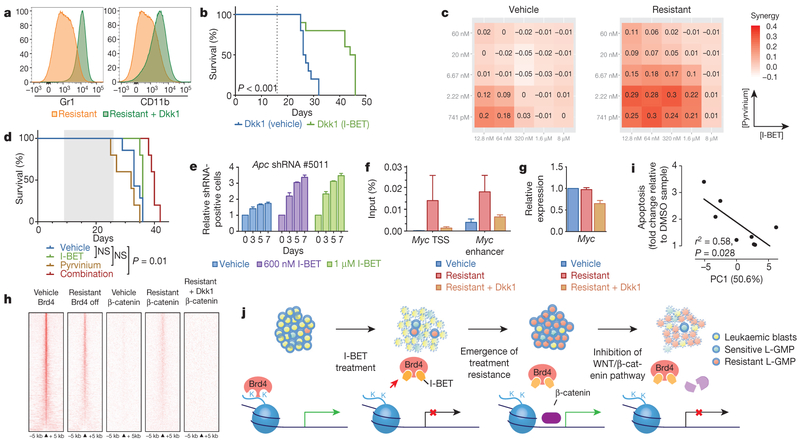
Figure 4 |. WNT/β-catenin signalling regulates sensitivity to BET inhibition.
a, Dkk1 results in re-expression of differentiation markers (Gr1+/CD11b+). b, Kaplan–Meier curve of vehicle and I-BET-treated mice after syngeneic transplantation of resistant clone stably transduced with Dkk1 (n = 10 per group, statistical significance calculated using a log-rank test). Dotted line denotes treatment starting on day 16. c, Heat map representation of Bliss interaction index across five-point dose range of pyrvinium and I-BET performed in biological quadruplicate. d, Kaplan-Meier curve of I-BET with/without pyrvinium after syngeneic transplantation of resistant cells. Shaded area denotes active treatment between days 9 and 26 (vehicle n = 7, I-BET n = 5, pyrvinium n = 5, combination n = 5, statistical significance calculated using a log-rank test). e, Viable, shRNA-positive cells after treatment with either vehicle or I-BET normalized to day 0 performed in biological quadruplicate (mean ± s.d.). f, Binding of β-catenin at Myc TSS and enhancer elements in vehicle-treated cells, resistant cells and resistant cells with Dkk1. Mean enrichment relative to input (±s.e.m.) in chromatin immunoprecipitation (ChIP) analysis from biological triplicate experiments. g, Myc expression from biological triplicate experiments (mean ± s.d.). h, Heat map representation of Brd4 and β-catenin chromatin occupancy ranked according to amount of Brd4 binding in vehicle-treated clones. i, Correlation between aggregate relative expression of examined β-catenin pathway genes with responsiveness to I-BET therapy. Statistical significance determined using Pearson’s correlation. j, Schematic model proposing the mechanism of resistance to BET inhibitor therapy in AML.
Global transcriptome analyses using two distinct methodologies showed a very high degree of correlation, and highlighted several transcriptional changes that clearly distinguished sensitive from resistant cells (Fig. 3g and Extended Data Fig. 7c, d). Notably, and consistent with our functional data, gene set enrichment analyses (GSEA) of our resistant cells strongly overlapped with previously published transcriptome data of LSCs from this AML model12,15 (Fig. 3h and Extended Data Fig. 7e–j). To identify precise transcriptional programmes differentially expressed, we performed GSEA for major signalling pathways. These findings demonstrated that the NF-κB pathway was significantly down regulated, whereas both the TGF-β and Wnt/β-catenin pathways were significantly upregulated in our resistant cells (Fig. 3i).
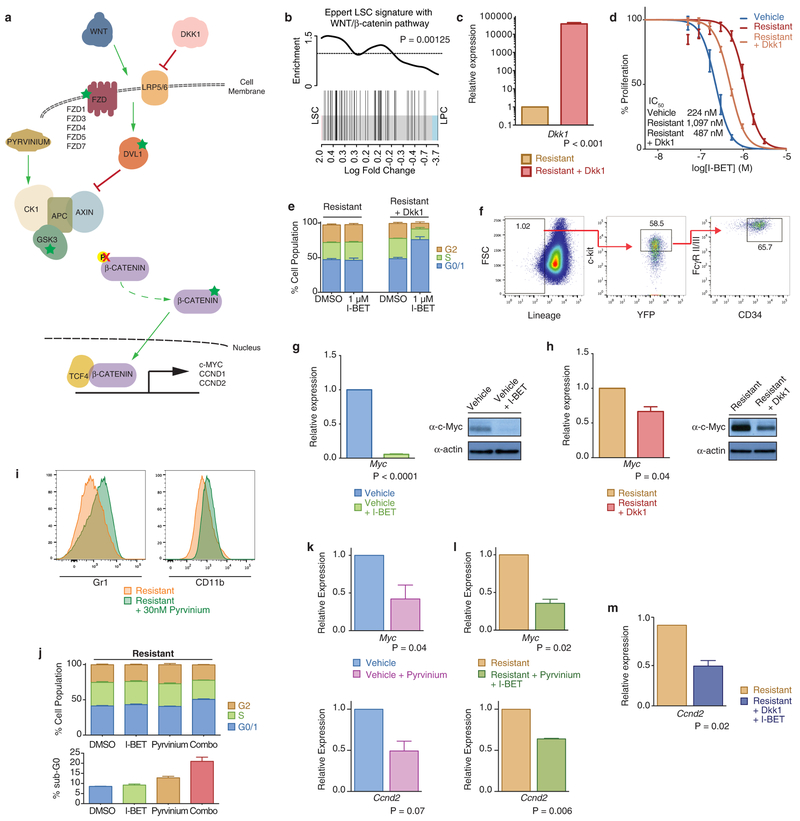
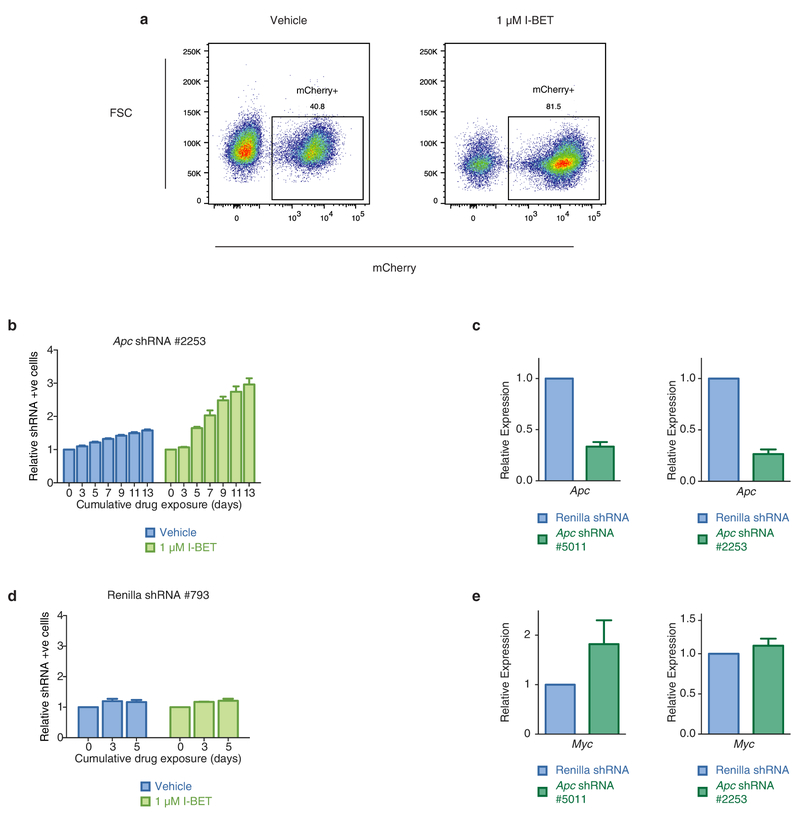
We focused our attention on the Wnt/β-catenin pathway as several components from ligand receptors to transcriptional co-activators were noted to be transcriptionally upregulated (Extended Data Fig. 8a). Interestingly, this pathway has previously been shown to be a major protagonist involved in sustaining LSCs in these models of AML14,21 and in other cancer stem cells22 (Extended Data Fig. 8b). To antagonise Wnt/β-catenin signalling specifically, we overexpressed the Dickkopf Wnt signalling pathway inhibitor 1 (Dkk1), which resulted in the differentiation of our resistant cells into more mature leukaemic blasts (Fig. 4a and Extended Data Fig. 8f) and re-instated sensitivity to I-BET both in vitro and in vivo (Fig. 4b and Extended Data Fig. 8c–h). In support of these findings, pyrvinium, an established inhibitor of the Wnt/β-catenin pathway23, phenocopied these results (Fig. 4c, d and Extended Data Fig. 8i–m). Importantly, stimulation of the Wnt/β-catenin pathway in sensitive cells, by downregulation of the adenomatous polyposis coli (Apc) gene, confers rapid I-BET resistance (Fig. 4e and Extended Data Fig. 9), further highlighting the crucial influence of this pathway on BET inhibitor efficacy.
Mechanistically, we find that in I-BET-naive cells, Brd4 is bound to the cis-regulatory elements of target genes such as Myc (Fig. 3f), whereas β-catenin is essentially absent (Fig. 4f). However, in I-BET-resistant cells, Brd4 binding is decreased (Fig. 3f), but β-catenin is now bound at these sites and able to sustain the expression of Myc (Fig. 4f, g). Negative regulation with Dkk1 reduces chromatin-bound β-catenin and subverts its ability to maintain the expression of Myc (Fig. 4f, g and Extended Data Fig. 8h). Analogous to the events at Myc, we find that in the resistant cells, chromatin occupancy of β-catenin increases at the sites where Brd4 is displaced from chromatin, and this increased β-catenin occupancy is abrogated by the expression of Dkk1 (Fig. 4h).
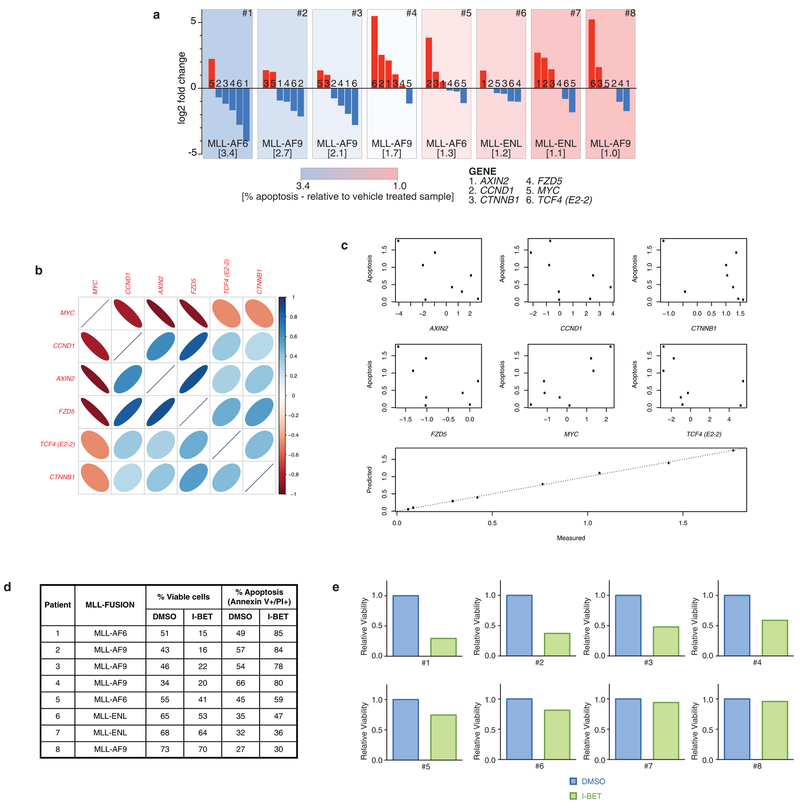
We have previously shown that BET inhibitors have a broad range of efficacy against human AML samples6,7. To explore the translational relevance of our findings, we compared baseline expression of WNT/β-catenin target genes to the degree of I-BET-induced apoptosis in these samples (Extended Data Fig. 10a). Notably, we find a high degree of correlation (Fig. 4i and Extended Data Fig. 10), supporting our findings that increased activity of the WNT/β-catenin pathway negates the effects of BET inhibition.
New classes of anti-cancer therapy rarely emerge, and BET inhibitors have uncovered a new therapeutic precedent; the possibility of specifically targeting epigenetic readers (effector proteins that recognize specific epigenetic modifications on histones or nucleotides). If their early clinical promise is to be realized, it is imperative that we evaluate their limitations and mechanisms of resistance to identify rational strategies that enhance their efficacy. Using models that have recapitulated the hierarchical structure of AML in vitro and in vivo, we show that BET inhibitor resistance emerges from LSCs with increased expression of the Wnt/β-catenm pathway. While not all LSCs are intrinsically resistant, it is clear that a small proportion of these are either transcriptionally primed or display rapid transcriptional plasticity to survive the initial BET inhibitor challenge, these cells subsequently thrive and become the dominant population (Fig. 4j). This adaptive transcriptional plasticity is an emerging theme by which malignant cells are able to escape from therapeutic pressures24, and our findings are consistent with another report highlighting the WNT/β-catenin pathway as a mechanism to circumvent BET inhibition25. Our approach has allowed us to sustain a highly enriched population of LSCs in culture indefinitely, providing a unique resource to characterize LSCs molecularly and enable screening of a range of therapies that may ultimately deliver the opportunity to eradicate the LSC population.
METHODS
Generation of immortalized primary mouse HSPC lines and derivation of clonal cell lines.
Initial generation of immortalized parental cell lines was achieved through magnetic bead selection (Miltenyi Biotec) of c-kit positive cells, obtained from whole bone marrow of male and female C57BL/6 mice, and subsequent retroviral transduction with either an MSCV-MLL-AF9-IRES-YFP or an MSCV-MLL-ENL construct.
To generate clonal resistant cell lines, the MLL-AF9-bearing parental cell line was serially re-plated in cytokine-supplemented methylcellulose (Methocult M3434, StemCell Technologies) containing either vehicle (0.1% DMSO) or drug (400 nM I-BET151). Individual vehicle-treated or resistant colonies were picked and transferred to liquid culture to generate clonal cell lines. Resistant cell lines were maintained continuously in drug while being incrementally exposed to increasing concentrations of drug (up to 1 μM I-BET151). Vehicle treated clones were also continuously maintained in 0.1% DMSO and passaged in identical fashion. The parental cell line was continuously maintained with no exposure to vehicle or drug.
Similarly, to generate resistant cell lines, the MLL-ENL-bearing parental cell line was serially re-plated in cytokine-supplemented methylcellulose containing either vehicle (0.1% DMSO) or drug (400 nM I-BET151). Cells growing in each plate were then washed and transferred to liquid culture to generate cell lines. Resistant cell lines were maintained continuously in drug while being incrementally exposed to increasing concentrations of drug (up to 1 μM I-BET151). Vehicle-treated clones were also continuously maintained in 0.1% DMSO and passaged in identical fashion. The parental cell line was continuously maintained with no exposure to vehicle or drug.
Cell culture.
Primary mouse haematopoietic progenitors and derived cell lines were grown in RPMI-1640 supplemented with mouse IL-3 (10 ng ml−1), 20% FCS, penicillin (100 U ml−1), streptomycin (100 μg ml−1), amphotericin B (250 ng ml −1) and gentamycin (50 μg ml−1). Cell lines were routinely tested for mycoplasma contamination by PCR. Primary human leukaemia cells were grown in the presence of IL3 (10 ng ml−1), IL6 (10 ng ml−1) and SCF (50 ng ml−1). Cells were incubated at 37°C and 5% CO2.
Cell proliferation assays.
For dose-response assays, serial dilutions of I-BET151, JQ1 or pyrvinium were further diluted in media before addition to 96-well plates seeded with between 5 × 10³ and 1 × 10⁴ cells per well to obtain a 0.1% DMSO final concentration. After 72 h incubation, resazurin was added to each well and plates were further incubated for 3 h. Fluorescence was then read at 560 nm/590 nm on a Cytation 3 Imaging Reader (BioTek). Cell counts were performed using a haemocytometer. Determination of in vitro synergy in proliferation assays was undertaken according to the method described previously26.
Clonogenic assays in methylcellulose.
Clonogenic potential was assessed through colony growth of derived cell lines plated in cytokine-supplemented methylcellulose (Methocult M3434, StemCell Technologies). Derived vehicle-treated and resistant cell lines were plated in duplicate at a cell dose of 2 × 10² per plate in the presence of vehicle (0.1% DMSO) or drug (1 μM I-BET151). Gr1−/CD11b− and Gr1+/CD11b+ fractions of resistant cell lines were plated in duplicate following FACS sorting at a cell dose of between 2 × 10² and 2 × 10³ cells per plate. FACS-isolated L-GMP populations from whole mouse bone marrow following primary syngeneic transplant of vehicle-treated clones were plated in duplicate at a cell dose of between 2 × 10² and 2 × 10³ cells per plate in the presence of vehicle (0.1% DMSO) or drug (1 μM I-BET151). Cells were incubated at 37 °C and 5% CO2 for 7–10 days at which time colonies were counted.
Flow cytometric analyses.
Cell apoptosis was assessed using APC conjugated Annexin V (550475, BD Biosciences) and propidium iodide (PI) (P4864, Sigma-Aldrich) staining according to manufacturer’s instructions.
For cell cycle analysis, cells were fixed overnight at −220 °C in 70% ethanol/PBS. Before flow cytometry analysis, cells were incubated at 37 °C for 30 min in PI staining solution (0.02 mg ml−1 PI, 0.05% (v/v) Triton X-100 in PBS, supplemented with DNase-free RNase A (19101, Qiagen)) or incubated at room temperature for 10 min with 4′,6-diamidino-2-phenylindole (DAPI) staining solution (1 μg ml−1 DAPI, 0.05% (v/v) Triton X-100 in PBS).
Immunophenotype assessment for markers of committed differentiation was undertaken through staining with Alexa Fluor 700 anti-Gr1 (108422, BioLegend) and Brilliant Violet 605 anti-CD11b (101237, BioLegend). Assessment of L-GMP populations was undertaken through staining with eFluor 660 anti-CD34 (50-0341-82, eBioscience), biotin lineage antibody cocktail (120-001-547, Miltenyi Biotec), PerCP/Cy5.5 anti-CD16/32 (101324, BioLegend), APC/Cy7 anti-CD117 (105826, BioLegend) and Pacific Blue anti-Ly-6A (122520, BioLegend) followed by secondary staining with V500 streptavidin (561419, BD Biosciences). Assessment of leukaemic LMPP and GMP populations in patient-derived xenografts was undertaken through staining with APC/Cy7 anti-mouse CD45.1 (110716, Biolegend), eFluor 450 anti-mouse Ter119 (48-5921-82, eBioscience), FITC anti-human CD45 (11-9459-42, eBioscience), BV711 anti-human CD38 (563965, BD Biosciences), PE anti-human CD90 (561970, BD Biosciences), PE-Cy5 anti-human CD123 (15-1239-41, eBioscience), PerCP-Cy5.5 anti-human CD45RA (45-0458-42), biotin anti-human CD3 (555338, BD Biosciences), biotin anti-human CD19 (555411, BD Biosciences), PE-Cy7 anti-human CD33 (333946, BD Biosciences) and APC anti-human CD34 (555824, BD Biosciences) followed by secondary staining with V500 streptavidin (561419, BD Biosciences).
PI or DAPI was used as a viability dye to ensure that immunophenotyping analyses were performed on viable cells. Appropriate unstained, single-stained and fluorescence minus one controls were used to determine background staining and compensation in each channel.
Flow cytometry analyses were performed on a LSRFortessa X-20 flow cytometer (BD Biosciences) and all data analysed with FlowJo software (vX.0.7, Tree Star). Cell sorting was performed on a FACSAria Fusion flow sorter (BD Biosciences).
RNA interference studies.
shRNAs were cloned into TtRMPVIR (27995, addgene). For competitive proliferation assays, transduced cells were sorted for shRNA-containing (Venus+/YFP+) and non-shRNA-containing (YFP1 only) populations and recombined at a 1:1 ratio. After this, cells were cultured with 1 mg ml−1 doxycycline to induce shRNA expression. The proportion of shRNA-expressing (dsRED+/Venus+/YFP+) cells were determined by flow cytometric analysis and followed over time. Knockdown efficiency of shRNA-expressing and non-shRNA-containing cells was assessed after 48–72 h of doxycycline exposure by quantitative reverse transcriptase PCR (qRT-PCR) and immunoblotting.
The following shRNA sequences were used: Brd2 (#851), 5′-CGGATTATCA CAAAATTAT-3′; Brd4 (#498), 5′-ACTATGTTTACAAATTGTT-3′; Brd3/4 (#499), 5′-AGGACTTCAACACTATGTT-3′; Brd4 (#500), 5′-AGCAGAACAA ACCAAAGAA-3′.
shRNAs directed against Apc were cloned into LMN-mirE-mCherry. The proportion of shRNA-expressing (mCherry+) cells was determined by flow cytometric analysis following treatment with vehicle (0.1% DMSO) or I-BET151 and followed over time. Selective advantage consequent to shRNA expression results in enrichment of mCherry+ cells. Knockdown efficiency of Apc in shRNA-expressing cells was assessed following FACS of mCherry+ cells. shRNAs directed against Apc were a gift from J. Zuber, the detailed validation of which can be found in ref. 25.
qRT-PCR.
mRNA was prepared using the Qiagen RNeasy kit and cDNA synthesis was performed using SuperScript VILO kit (Life Technologies) as per manufacturer’s instructions. qPCR analysis was undertaken on an Applied Biosystems StepOnePlus System with SYBR green reagents (Life Technologies).
For analysis of mouse cell line samples, expression levels were determined using the ΔCT method and normalized to β-2-microglobulin (B2m) and/or Gapdh. Differences in expression were assessed using a one-sided t-test for statistical significance. Assessment of expression changes associated with I-BET151 treatment occurred at 6 h after treatment with 1 μM I-BET151.
The following mouse primer pairs were used: Apc, forward 5′-GGAGTGGCAGAAAGCAACAC-3′, reverse 5′-AAACACTGGCTGTTTCGTGA-3′; B2m, forward 5′-GAGCCCAAGACCGTCTACTG-3′, reverse 5′-GCTATTTCTTTCTGCGTGCAT-3′; Brd2, forward 5′-TGGGCTGCCTCAGAATGTAT-3′, reverse 5′-CCAGTGTCTGTGCCATTAGG-3′; Brd3, forward 5′-GCCAGTGAGTGTATGCAGGA-3′, reverse 5′-GCCTGGGCCATTAGCACTAT-3′; Brd4, forward 5′-TCTGCACGACTACTGTGACA-3′, reverse 5′-GGCATCTCTGTACTCTC GGG-3′; Ccnd2, forward 5′-CAAGCCACCACCCCTACA-3′, reverse 5′-TTGC CGCCCGAATGG-3′; Dkk1, forward 5′-CTGCATGAGGCACGCTATGT-3′, reverse 5′-AGGAAAATGGCTGTGGTCAG-3′; Dvl1, forward 5′-ATCACAC GCACCAGCTCTTC-3′, reverse 5′-GGACAATGGCACTCATGTCA-3′; Fzd5, forward 5′-GGCTACAACCTGACGCACAT-3′, reverse 5′-CAGAATTGGTGCACCTCCAG-3′; Gapdh, forward 5′-GGTGCTGAGTATGTCGTGGA-3′, reverse 5′-CGGAGATGATGACCCTTTTG-3′; Gsk3b, forward 5′-TTGGAGCCACTGATTACACG-3′, reverse 5′-CCAACTGATCCACACCACTG-3′; Myc, forward 5′-TGAGCCCCTAGTGCTGCAT-3′, reverse 5′-AGCCCGACTCCGACCTCTT-3′.
For determination of baseline WNT/β-catenin pathway and target gene expression in primary human AML samples, expression relative to the mean of all samples was determined using the ΔCT method and normalized to GAPDH and actin. The following human primers were used: AXIN2, forward 5′-CGGACAGCAGTGTAGATGGA-3′, reverse 5′-CTTCACACTGCGATGCATTT-3′; CCND1, forward 5′-GCTGTGCATCTACACCGACA-3′, reverse 5′-CCACTTGAGCTTGTTCACCA-3′; CTNNB1, forward 5′-GACCACAAGCAGAGTGCTGA-3′, reverse 5′-CTTGCATTCCACCAGCTTCT-3′; FZD5, forward 5′-TTCCTGTCAGCCTGCTACCT-3′, reverse 5′-CGTAGTGGATGTGGTTGTGC-3′; MYC, forward 5′-CTGGTGCTCCATGAGGAGA-3′, reverse 5′-CCTGCCTCTTTTCCACAGAA-3′; TCF4, 5′-ATGGCAAATAGAGGAAGCGG-3′, reverse 5′-TGGAGAATAGATCGAAGCAAG-3′; ACTB, forward 5′-TTCAACACCCCAGCCATGT-3′, reverse 5′-GCCAGTGGTACGGCCAGA-3′; GAPDH, 5′-ACGGGAAGCTTGTCATCAAT-3′, reverse 5′-TGGACTCCACGACGTACTCA-3′.
Immunoblotting.
Whole-cell lysates were mixed with Laemmli SDS sample buffer, separated via SDS-PAGE and transferred to PVDF membranes (Millipore). Membranes were then sequentially incubated with primary antibodies (see antibodies) and secondary antibodies conjugated with horseradish peroxidase (Invitrogen). Membranes were then incubated with ECL (GE Healthcare) and proteins detected by exposure to X-ray film.
Mouse tissue sample preparation.
Peripheral blood samples were collected in EDTA-treated tubes (Sarstedt) and counted using a XP-100 analyser (Sysmex). Single-cell cytospins and blood smears were stained with the Rapid Romanowsky Staining Kit (Thermo Fisher Scientific). Bone marrow cells were isolated by flushing both femurs and tibias with cold PBS. Before flow cytometry, red blood cells were lysed in red blood cell lysis buffer (Sigma).
Examination of drug efflux and metabolism by quantitative mass spectrometry.
Between 2 × 10⁵ and 3 × 10⁵ cells per well were seeded in 24-well plates and treated with vehicle (0.1% DMSO) or 600 nM I-BET151. After 48 h, cells were collected by centrifugation, washed twice in ice-cold PBS and lysed in M-PER buffer (78501, Thermo Scientific). Base media, supernatant, wash and cell lysates were quenched with 5% acetonitrile (aq) containing labetalol at 62.5 ng ml−1 as the internal standard. These samples, in addition to serial dilutions of I-BET151 used to generate standard curves, were then analysed by mass spectrometry.
HPLC-mass spectrometry apparatus and conditions: The HPLC system was an integrated CTC PAL auto sampler (LEAP technologies), Jasco XTC pumps (Jasco). The HPLC analytical column was an ACE 2 C18 30 mm × 2.1 mm (Advanced Chromatography Technologies) maintained at 40 °C. The mobile phase solvents were water containing 0.1% formic acid and acetonitrile containing 0.1% formic acid. A gradient ran from 5% to 95% ACN plus 0.1% formic acid up to 1.3 min, held for 0.1 min and returning to the starting conditions over 0.05 min then held to 1.5 min at a flow rate of 1 ml min−1. A divert valve was used so the first 0.4 min and final 0.2 min of flow were diverted to waste.
Mass spectromic detection was by an API 4000 triple quadrupole instrument (AB Sciex) using multiple reaction monitoring (MRM). Ions were generated in positive ionization mode using an electrospray interface. The ionspray voltage was set at 4,000 V and the source temperature was set at 600°C. For collision dissociation, nitrogen was used as the collision gas. The MRM of the mass transitions for I-BET151 (m/z 416.17 to 311.10), and labetalol (m/z 329.19 to 162.00), were used for data acquisition.
Data were collected and analysed using Analyst 1.4.2 (AB Sciex), for quantification, area ratios (between analyte/internal standard) were used to construct a standard line, using weighted (1/x2) linear least squared regression, and results extrapolated the area ratio of samples from this standard line.
Mouse models of leukaemia.
Primary syngeneic transplantation studies of stably growing derived vehicle treated or resistant cell lines in limit dilution analyses were performed with intravenous injection of between 1 × 101 to 2 × 10⁶ cells per mouse.
Serial syngeneic transplantation studies of drug efficacy, generation of in vivo resistance and limit dilution analyses were performed with intravenous injection of between 1 × 101 to 2.5 × 10⁶ cells per mouse obtained from bone marrow or spleen. Treatment with vehicle or I-BET151 at 20–30 mg kg−1 began between days 9 and 13. Pyrvinium, alone or in combination with I-BET151, was delivered between days 9 and 26.
After stable retroviral transduction of resistant cell lines with a Dkk1 containing construct, 5 × 10⁶ cells per mouse were injected intravenously in primary syngeneic transplants. Treatment with vehicle or I-BET151 at 20 mg kg−1 began at day 16.
Syngeneic transplantation studies were performed in C57BL/6 mice (wild-type or expressing Ptprca). All mice were 6–10 weeks old at the time of sub-lethal irradiation (300 cGy) and intravenous cell injection. Treatment with vehicle, I-BET151 or pyrvinium commenced after engraftment of leukaemia as determined by >1% yellow fluorescent protein (YFP) expression in peripheral blood in most mice. Mice were randomly assigned treatment groups; treatment administration was not blinded. Sample sizes were determined according to the resource equation method. Differences in Kaplan–Meier survival curves were analysed using the log-rank statistic.
Patient derived xenograft studies were performed in NOD/SCID/Il2rg−/− (NSG) mice. All mice were 6–10 weeks old at the time of sub-lethal irradiation (200 cGy) and intravenous cell injection of 1 × 10⁵ to 5 × 10⁵ cells per mouse. Treatment with vehicle or I-BET151 at 10 mg kg−1 for a 2-week period began after detection of >1% circulating human CD45+ cells in mouse peripheral blood at week 14. Treatment cohorts were matched for transplant generation.
I-BET151 was dissolved in normal saline containing 5% (v/v) DMSO and 10% (w/v) Kleptose HPB. I-BET151 was delivered daily (5 days on, 2 days off) by intraperitoneal injection (10ml kg−1) with dose reduction of I-BET151 undertaken if evidence of drug intolerance was present. Pyrvinium was dissolved in normal saline containing 15% (v/v) DMSO and delivered daily by intraperitoneal injection (10 ml kg−1). Dosing of pyrvinium started at 0.1 mg kg−1 and escalated in 0.1 mg kg−1 increments every second dose to a maximal dose of 0.5 mg kg−1.
All mice were kept in a pathogen-free animal facility, inspected daily and euthanized on signs of distress/disease. All experiments were conducted under either UK Home Office regulations or Institutional Animal Ethics Review Board in Australia. Statistical analyses of limit dilutions were undertaken according to the method described previously27.
Exome capture sequencing.
DNA was extracted from cell lines using the DNeasy blood and tissue kit (Qiagen), and quantified using the Qubit dsDNA HS Assay (Life Technologies) before fragmentation to a peak size of approximately 200 base pairs (bp) using the focal acoustic device, SonoLab S2 (Covaris). Library preparations were performed using the SureSelectXT Target Enrichment System for Illumina Paired-End Sequencing Library protocol (Agilent Technologies) with the SureSelectXT Mouse All Exon Kit for the capture process (Agilent Technologies). The quality of libraries submitted for sequencing was assessed using the High Sensitivity DNA assay on the 2100 bioanalyzer (Agilent Technologies). Libraries were quantified with qPCR, normalized and pooled to 2 nM before sequencing with paired end 100-bp reads using standard protocols on the HiSeq2500 (Illumina).
The Fastq files generated by sequencing were aligned to the mm10 mouse reference genome using bwa28. Copy number variation was analysed using ADTEx29 to compare the depth of coverage in resistant and vehicle treated clones with the parental cell line. Variant calling was performed with VarScan2 (ref. 30), MuTect31 and GATK HaplotypeCaller32. The Ensembl Variant Effect Predictor (VEP)33 was used to predict the functional effect of the identified variants.
Mutations detected by at least two variant callers were further analysed for shared mutations between cell lines and mutation spectrum. Genomic regions with coverage of at least eight reads in all libraries were analysed for the frequency of mutations. Coding exonic, untranslated regions and intronic regions were obtained from the UCSC Table Browser34. Upstream regions were defined as 1,000 bp upstream of genes, downstream regions were defined as 1,000 bp downstream of genes, and intergenic regions were more than 1,000 bp from genes.
ChIP, qPCR and sequencing analysis.
Cells were cross-linked with 1% formaldehyde for 15 min at room temperature and cross-linking stopped by the addition of 0.125 M glycine. Cells were then lysed in 1% SDS, 10 mM EDTA, 50 mM Tris-HCl, pH 8.0, and protease inhibitors. Lysates were sonicated in a Covaris ultrasonicator to achieve a mean DNA fragment size of 500 bp. Immunoprecipitation (see antibodies) was performed for a minimum of 12 h at 4 °C in modified RIPA buffer (1% Triton X-100,0.1% deoxycholate, 90 mM NaCl, 10 mM Tris-HCl, pH 8.0 and protease inhibitors). An equal volume of protein A and G magnetic beads (Life Technologies) were used to bind the antibody and associated chromatin. Reverse crosslinking of DNA was followed by DNA purification using QIAquick PCR purification kits (Qiagen). Immunoprecipitated DNA was analysed on an Applied Biosystems StepOnePlus System with SYBR green reagents. The following primer pairs were used in the analysis: Myc TSS, forward 5′-GTCACCTTTACCCCGACTCA-3′, reverse 5′-TCCAGGCACATCTCAGTTTG-3′; Myc enhancer, forward 5′-TCTTTGATGGGCTCAATGGT-3′, reverse 5′-TTCCCTTCACCTGATGAACC-3′. For sequencing analysis of immunoprecipitated DNA, DNA was quantified using the Qubit dsDNA HS Assay (Life Technologies). Library preparations were performed using the standard ThruPLEXTM-FD Prep Kit protocol (Rubicon Genomics) and size selected for 200–400 bp using the Pippen Prep (Sage Science Inc.). Fragment sizes were established using either the High Sensitivity DNA assay or the DNA 1000 kit and 2100 bioanalyzer (Agilent Technologies). Libraries were quantified with qPCR, normalized and pooled to 2 nM before sequencing with single-end 50-bp reads using standard protocols on the HiSeq2500 (Illumina). The Fastq files generated by sequencing were aligned to the mm10 mouse reference genome using bwa28. Peak-calling was performed using MACS2 (ref. 35) with default parameters and the input library as control. Profiles and heat maps of reads and MACS peaks in the 5 kb around the TSS were generated with Genomic Tools36.
Expression analysis by microarray and RNA-sequencing.
RNA was prepared using the Qiagen RNeasy kit. For microarray analysis, RNA was hybridized to Illumina MouseWG-6 v2 Expression BeadChips. Gene expression data were processed using the lumi package in R. Probe sets were filtered to remove those where the detection P value (representing the probability that the expression is above the background of the negative control probe) was greater than 0.05 in at least one sample. Expression data was background corrected and quantile normalized. Normalization and inference of differential expression were performed using limma37. Correction for multiple testing was performed using the method of Benjamini and Hochberg38. Genes with an FDR rate below 0.05 and a fold-change greater than 2 were considered significantly differentially expressed. For genes with multiple probe sets, only the probe set with the highest average expression across samples was used.
For RNA sequencing analysis, RNA concentration was quantified with the NanoDrop spectrophotometer (Thermo Scientific). The integrity was established using the RNA 6000 kit and 2100 bioanalyzer (Agilent Technologies). Library preparations were performed using the standard TruSeq RNA Sample Preparation protocol (Illumina) with fragment sizes established using the DNA 1000 kit and 2100 bioanalyzer (Agilent Technologies). Libraries were quantified with qPCR, normalized and pooled to 2 nM before sequencing with paired-end 50 bp reads using standard protocols on an Illumina HiSeq2500.
Reads were aligned to the mouse genome (Ensembl Release 75, Feb 2014) using Subread39 and assigned to genes using featureCounts40. Differential expression was inferred using limma/voom37. Correction for multiple testing using the Benjamini-Hochberg method was performed. Genes with an FDR below 0.05 and a fold-change greater than 2 were considered significantly differentially expressed.
Gene set enrichments were determined using ROAST41. ROAST tests for up- or downregulation of genes in a given pathway (Fig. 3i) were performed on cell lines either stably maintained in vehicle or I-BET. P values were corrected for multiple testing using the method of Benjamini and Hochberg. Gene sets were obtained from MSigDB42 and curated. Human Entrez accessions from the downloaded gene sets were converted into mouse accessions using orthologue information from the Mouse Genome Database (MGD) at the Mouse Genome Informatics website (http://www.informatics.jax.org; accessed June 2014). ROAST tests were performed to assess for an enrichment of a LGMP gene expression signature (GSE4416)12 and a LGMP derived from HSC signature (GSE18483)15 in the I-BET resistant compared with vehicle cell lines. The gene expression program associated with human leukaemia stem cells was obtained from GSE30375 (ref. 17) and analysed with LIMMA37. Gene expression of LSC was compared with LPC and genes upregulated in LSC were analysed for an enrichment of the Wnt/β-catenin pathway using ROAST.
GSEA terms.
The following GSEA terms were used. WNT/β-catenin: ST_WNT_BETA_CATENIN_PATHWAY; JAK/STAT: KEGG_JAK_STAT_SIGNALING_PATHWAY; PI(3)K/AKT/mTOR: REACTOME_PI3K_AKT_ACTIVATION; NF-κB: REACTOME_ACTIVATION_OF_NF_KAPPAB_IN_B_CELLS; RAS/ERK/MAPK: KEGG_MAPK_SIGNALING_PATHWAY; NOTCH: KEGG_NOTCH_SIGNALING_PATHWAY; hippo: REACTOME_SIGNALING_BY_HIPPO; hedgehog: KEGG_HEDGEHOG_SIGNALING_PATHWAY; TGF-β: KEGG_TGF_BETA_SIGNALING_PATHWAY.
Antibodies.
The following antibodies were used in ChIP and immunoblotting assays: anti-Brd2 (A302-583A, Bethyl Labs), anti-Brd3 (A302-368A, Bethyl Labs), anti-Brd4 (A301-985A, Bethyl Labs and ab128874, abcam), anti-H3K27ac (ab4729, abcam), anti-β-catenin (610154, BD Biosciences), anti-c-Myc (9402S, Cell Signalling Technology), anti-β-actin (A1978, Sigma-Aldrich) and anti-Hsp60 (sc-13966, Santa Cruz Biotechnology).
Correlation of expression of WNT/β-catenin pathway expression and response to I-BET151.
A principal component analysis was performed on the qRT-PCR data of β-catenin pathway and target genes from primary human AML samples. Pearson’s correlation was calculated between the expression of the pathway genes in the first principal component, and the responsiveness to I-BET151.
Correlation of log gene expression of selected WNT/β-catenin pathway genes was assessed using a corrgram and correlation between log expression and apoptosis was examined using scatterplots. As expression between genes was typically highly correlated, or inversely correlated, the log-expression data was summarized using the first principle component and compared to the level of apoptosis. A multiple linear regression model was also fitted to the data. As the full model was close to saturated (8 samples, 6 genes), a stepwise model selection procedure based on the Akaike Information Criteria (AIC), which was implemented in the R function STEP, was used. The model that minimized the AIC excluded one gene (AXIN2).
Patient material.
Peripheral blood or bone marrow containing >80% blasts was obtained from patients following consent and under full ethical approval at each involved institute.
Extended Data
Extended Data Figure 1 |. Establishment of a model of BET inhibitor resistance.
a, Resistance to I-BET demonstrated in cell proliferation assays. Representative dose–response curve of a vehicle treated clone and a resistant clone stably maintained in 1,000 nM I-BET after 72 h of growth (mean ± s.d., n = 4 per group). b, Cross-resistance to chemically distinct BET inhibitors demonstrated in cell proliferation assays. Representative dose–response curve of a vehicle-treated clone and a resistant clone after 72 h of growth (mean ± s.d., n = 4 per group). c, Abrogation of response to I-BET-mediated cell cycle arrest. This is more evident in resistant clones stably maintained in higher concentrations of I-BET. Data from biological duplicate experiments (mean ± s.e.m.). d, Representative flow plots of cell lines stably transduced with an inducible shRNA vector. Vector-positive cells constitutively express Venus. After the introduction of doxycycline, shRNA-expressing cells co-express Venus and dsRED. Selective disadvantage consequent to shRNA expression results in drop out of dsRED-positive cells from culture over time, which is assessed by flow cytometry. e, Independent inducible shRNAs specifically reduce the expression of Brd4, but not Brd2 or Brd3, after 48–72 h of doxycycline. Messenger RNA levels in shRNA-positive cells normalized to mRNA expression in shRNA-negative cells in biological duplicate experiments (mean ± s.e.m.). f, Brd4 protein levels are reduced in shRNA-positive cells. Uncropped blots are shown in Supplementary Fig. 1. g, In addition to resistance to selective knockdown of Brd4, BET-inhibitor-resistant cells are also refractory to RNAi-mediated dual knockdown of Brd3 and Brd4. shRNA-mediated knockdown of Brd2 has minimal effect on both vehicle-treated and resistant clones. dsRED-positive cells normalized to day 1 after doxycycline exposure in biological duplicate experiments (mean ± s.e.m.). h, Reduction of Brd3/4 mRNA expression and Brd2 mRNA expression with two independent shRNAs after 48–72 h of doxycycline. mRNA levels in shRNA-positive cells normalized to mRNA expression in shRNA-negative cells in biological duplicate experiments (mean ± s.e.m.). i, Examination of vehicle-treated and resistant clones demonstrates no major morphological differences. j, Resistant clones are smaller and demonstrate homogeneity in size and complexity (FSCmid/SSClow) by flow cytometry. k, Resistant clones are enriched for L-GMPs (Lin−, Sca−, cKit+, CD34+, FcγRII/RIII+). Representative FACS analysis of vehicle-treated and resistant clones, percentages represent proportion of parent gate.
Extended Data Figure 2 |. Resistance to BET inhibitors also arises from an immature cell compartment in MLL–ENL leukaemia.
a, Strategy for the generation of resistant cell lines from primary HSPC after retroviral transduction with the oncogene MLL–ENL. The parental cell line was serially re-plated in cytokine supplemented semi-solid media containing either vehicle (0.1% DMSO) or 400 nMI-BET (~IC40 of parental cell line). Cells in each plate were then washed and transferred to liquid culture to generate cell lines. Resistant cell lines were subsequently exposed to increasing selection pressure in liquid culture. Vehicle-treated cell lines and the parental cell line were identically passaged. b, Resistant cell lines bearing MLL–ENL are smaller and demonstrate homogeneity in size and complexity (FSCmid/SSClow) in addition to exhibiting an immature immunophenotype (Gr1−/CD11b−). Representative FACS analysis of vehicle-treated and resistant cell lines. c, Resistant cell lines bearing MLL–ENL demonstrate increased expression of WNT/β-catenin pathway genes. qRT–PCR data performed in biological triplicate (mean ± s.d.).
Extended Data Figure 3 |. Resistance to BET inhibitors emerges from leukaemia stem cells.
a, Transplant cohorts and survival of mice injected with vehicle-treated and resistant clones in limit dilution analyses of primary syngeneic transplants displayed in Fig. 2d, e. b, Experimental strategy for derivation of in vivo resistance to BET inhibitors in a MLL–AF9 leukaemia model. After primary transplant of a vehicle-treated clone, serial transplant of either I-BET-exposed or I-BET-naive leukaemias, derived from whole bone marrowof diseased mice, was undertaken until loss of I-BET-mediated survival advantage was observed. Treatment was started on days 11–13. c, Progressive loss of I-BET-mediated survival advantage observed in serial transplant generations. Kaplan–Meier curves of serial transplant generations. Second transplant: I-BET naive n = 6, I-BET exposed n = 6. Third transplant: I-BET naive n = 2, I-BET exposed n = 3. Fourth transplant: I-BET naive n = 2, I-BET exposed n = 3. Fifth transplant: I-BET naive n = 4, I-BET exposed n = 5. d, Limit dilution analyses of leukaemias derived from bone marrow of diseased mice chronically exposed to I-BET after the fourth transplant demonstrates that less than 10 cells are reliably able to transfer leukaemia. Kaplan–Meier curves of C57BL/6 mice injected with indicated number of cells. e, Chronic I-BET exposure significantly enriches for leukaemia stem cells in vivo. f, Transplant cohorts and survival of limit dilution analyses of data displayed in d and e. g, Gating strategy for identification of L-GMPs in whole mouse bone marrow.
Extended Data Figure 4 |. Enrichment of a LMPP population in AML PDX.
a, Experimental treatment strategy for treatment of NOD/SCID/Il2rg−/− (NSG) mice bearing AML PDXs. Treated mice (with either vehicle or I-BET) belonged to identical transplant generations. b, Cytogenetic and genetic information of PDX models used. c, Gating strategy for identification of LMPP-like LSCs and GMP-like LSCs from mouse bone marrow. mTer119/mCD45 denotes mouse Ter119/CD45; hCD45/hCD3/hCD19/hCD33/hCD34/hCD38/hCD123/hCD45RA/hCD90 denotes human CD45/CD3/CD19/CD33/CD34/CD38/CD123/CD45RA/CD90. d, Representative FACS analysis of bone marrow obtained from vehicle- and I-BET-treated mice demonstrating enrichment of LMPP-like LSCs in I-BET-treated mice. Events displayed are gated on mTer119−/hCD45+/hCD33+ cells and are expressed as a percentage of total hCD45+ cells.
Extended Data Figure 5 |. Intrinsic resistance to BET inhibition is not a feature of L-GMPs.
a, Experimental strategy for testing intrinsic resistance of L-GMPs to BET inhibition. After syngeneic transplant of a vehicle-treated clone, L-GMPs were FACS-isolated from whole mouse bone marrow of diseased mice and cultured in cytokine supplemented semi-solid media containing either vehicle (0.1% DMSO) or 1 μM I-BET. b, L-GMPs do not demonstrate intrinsic resistance to I-BET. Colony counts after 7 days of growth in biological triplicate (see also Fig. 2h) experiments (mean ± s.e.m.) of FACS-isolated L-GMPs after primary transplant of vehicle-treated clones in two additional independent mice. M2, mouse 2; M3, mouse 3.
Extended Data Figure 6 |. Further genetic characterization of BET-inhibitor-resistant cells.
a, Comparison of whole-exome sequencing (WES) data from early and late time points identifies non-advantageous passenger mutations. Data from WES of samples obtained at an earlier time point to that presented in Fig. 3d is shown. Call out box identifies genes within a small region on chromosome 13 in one resistant clone which demonstrate copy number gain and are associated with increased mRNA expression relative to non-resistant cells. b, Venn diagram demonstrating gene mutations shared between vehicle-treated and resistant clones. Highlighted in the call out box are 24 gene mutations shared between resistant clones but not found in vehicle-treated clones. c, Resistant clones do not exhibit marked genetic instability with low mutation frequency observed. d, No specific mutation signature is identified in resistant clones. e, Correlation of genes identified in copy number gain region on chromosome 13 with gene expression data from the two resistant clones examined by WES. Fold change in gene expression compared to vehicle-treated clones obtained from microarray analysis is shown. f, Mutations detected by WES can be validated with data obtained from RNA sequencing (RNA-seq) of the same clones. Selected examples of mutations unique to resistant clones and shared between vehicle-treated and resistant clones is shown in integrative genomics viewer (IGV) tracks.
Extended Data Figure 7 |. Further epigenetic and gene expression characterization of BET-inhibitor-resistant cells.
a, BRD4 binding profile at Polr2a enhancer elements demonstrates no significant loss of BRD4 binding or H3K27ac levels in resistant clones. b, Genome wide profiling of BRD2 and BRD3 binding at TSSs comparing vehicle-treated and resistant clones is demonstrated in heat maps centred on the TSS of annotated genes with 5 kb flanking sequence either side. Red indicates higher density of reads in ChIP-seq data. c, Heat map of differential mRNA expression data from a vehicle-treated and resistant clone performed by RNA-seq in biological triplicate experiments. d, RNA-seq and microarray data are highly correlated. Correlation of log2 fold change (logFC) between RNA-seq and microarray data across all genes. No genes show opposing expression changes. Dotted line indicates y = x, blue dots represent genes that are significantly differentially expressed (gene expression log(FC) at least ±1.0, FDR corrected P < 0.05). e–g, GSEA shows enrichment of LSC signature in I-BET-resistant cells, with resistant clones stably maintained in progressively higher concentrations of I-BET demonstrating increased enrichment of differentially expressed genes associated with a L-GMP self-renewal program. Barcode plot compares differential expression of genes in vehicle-treated and resistant clones to published microarray data comparing L-GMPs and MLL–AF9 cells propagated in liquid culture. Shaded area in the centre of plot shows genes ranked by fold change in expression in resistant relative to vehicle clones. Pink and blue shading represent significantly up- and downregulated genes, respectively. Upregulated and downregulated genes in the previously published LSC gene expression signature are shown in red and blue, respectively. Resistant (400) upregulated FDR = 1.2 × 10⁻¹, downregulated FDR = 9.3 × 10⁻³. Resistant (600) upregulated FDR < 1.0 × 10⁻⁴, downregulated FDR <2.5 × 10⁻⁴. Resistant (800) upregulated FDR −5.0 × 10⁻⁵, downregulated FDR <5.0 × 10⁻⁵. h, GSEA demonstrates that resistant clones show significant enrichment for genes associated with a self-renewal program identified from L-GMPs arising from haematopoietic stem cells (L-GMP HSCs). Upregulated FDR = 4.6 × 10⁻², downregulated FDR = 1.3 × 10⁻³. i, RNA-seq identifies enrichment of LSC gene expression signature following chronic in vivo BET inhibitor exposure. Heat map of differential mRNA expression data from RNA-seq of leukaemias from the bone marrow of I-BET-exposed (n = 2) and I-BET-naive (n = 2) mice after the fourth transplant. j, GSEA of RNA-seq data identifies enrichment of a previously published LSC gene expression signature in leukaemias chronically exposed to I-BET in vivo. Barcode plot compares differential expression of genes in I-BET-exposed and I-BET-naive leukaemias to published data comparing L-GMPs and MLL–AF9 cells propagated in liquid culture. Shaded area in the centre of plot shows genes ranked by fold change in expression in I-BET-exposed relative to I-BET-naive leukaemias. Pink and blue shading represent significantly up- and downregulated genes, respectively. Upregulated and downregulated genes in the previously published LSC gene expression signature are shown in red and blue, respectively, and correlate with expression of genes in the I-BET-exposed leukaemias (FDR = 0.05).
Extended Data Figure 8 |. Negative regulation of Wnt/β-catenin signaling in resistant clones re-establishes sensitivity to BET inhibition.
a, Schematic representation of the Wnt/β-catenin pathway. Highlighted by green stars are components of the pathway identified from transcriptome data which are significantly upregulated (>1.5-fold change, FDR <0.05) in resistant clones relative to vehicle-treated clones. b, GSEA of previously published human LSC gene expression data demonstrates enrichment of the WNT/β-catenin pathway. c, Dkk1 expression in the resistant cells before and after retroviral transduction of mouse Dkk1. qRT–PCR data from biological triplicate experiments (mean ± s.d.). d, Partial restoration of sensitivity to BET inhibition is observed in resistant clones after transduction with Dkk1. Dose–response curve of a vehicle-treated clone and resistant clone with and without expression of Dkk1 after 72 h of growth (mean ± s.e.m., n = 16 per group). e, Restoration of BET inhibitor induced cell-cycle arrest in resistant clones stably transduced with Dkk1. Flow cytometric analysis after 48 h exposure to either vehicle or 1,000 nM I-BET in biological triplicate experiments (mean ± s.e.m.). f, Resistant clones stably expressing Dkk1 do not show immunophenotypic enrichment for L-GMPs (see Extended Data Fig. 1k for comparison). Representative FACS analysis of resistant clone expressing Dkk1, percentages represent proportion of parent gate. g, Abrogation of Myc mRNA and protein expression in vehicle-treated clones after treatment with I-BET. qRT–PCR data of Myc expression in a vehicle-treated clone after 6 h of treatment with 1 μM I-BET151 in biological triplicate experiments (mean ± s.d.). Uncropped blots are found in Supplementary Fig. 1. h, Negative regulation of Wnt/β-catenin signalling by Dkk1 in resistant clones results in decreased expression of Myc. qRT–PCR data from biological triplicate experiments (mean ± s.d.). i, Small molecule inhibition of Wnt/β-catenin pathway expression re-establishes sensitivity to BET inhibition. Exposure of resistant clones to the Wnt/β-catenin pathway inhibitor pyrvinium also results in re-expression of Gr1+ and CD11b+. Representative FACS analysis of resistant clone in the presence or absence of pyrvinium. j, Pyrvinium synergises with I-BET to induce a modest cell cycle arrest and an induction of cell death (sub-G0 cell fraction). Data from biological triplicate experiments (mean ± s.e.m.). k, l, Pyrvinium reduces the expression of Wnt/β-catenin target genes such as Myc and Ccnd2 in vehicle-treated and resistant cells. qRT–PCR data from biological duplicate experiments (mean ± s.e.m.). m, These findings are similar to those seen for resistant cells stably expressing Dkk1.
Extended Data Figure 9 |. shRNA-mediated knockdown of Apc confers resistance to sensitive clones.
a, shRNA-mediated knockdown of Apc, a negative regulator of Wnt/β-catenin signalling, confers resistance to vehicle-treated clones. BET inhibitor treatment enriches for shRNA-containing (mCherry-positive) cells. Representative FACS plots after 7 days of cumulative drug exposure to either vehicle (0.1% DMSO) or 1 μM I-BET in a vehicle clone transduced with an Apc shRNA. b, c, Independent shRNAs directed against Apc confer resistance to vehicle-treated clones. Viable, shRNA-positive cells after treatment with either vehicle or I-BET normalized to day 0 performed in biological triplicate (mean ± s.d.). qRT–PCR data from FACS-isolated shRNA-containing cells performed in biological duplicate (mean ± s.e.m.). d, I-BET treatment of vehicle-treated clones transduced with a non-targeting shRNA does not enrich for shRNA-containing cells. Viable, shRNA-positive cells after treatment with either vehicle or I-BET normalized to day 0 performed in biological triplicate (mean ± s.e.m.). e, shRNA-mediated knockdown of Apc results in increased expression of Wnt/β-catenin target gene Myc. qRT–PCR data from FACS isolated shRNA containing cells performed in biological duplicate (mean ± s.e.m.).
Extended Data Figure 10 |. WNT/β-catenin pathway expression correlates with responsiveness to I-BET in primary human AML samples.
a, Assessment of β-catenin pathway gene expression in eight primary human AML samples with associated response to I-BET exposure. Each panel represents an individual primary human AML sample, with genetic abnormality denoted. Waterfall plot of relative qRT–PCR expression data of key β-catenin pathway genes (AXIN2, CCND1, CTNNB1, FZD5, MYC, TCF4 (also known as E2-2)) is displayed. Each bar is labelled 1–6 according to gene represented. Relative apoptosis observed after 48 h exposure to 500 nM I-BET versus vehicle (0.1% DMSO) is denoted in square parenthesis and is also represented as a heat map background shading in each panel. b, log2-transformed expression levels of selected genes in the WNT/β-catenin pathway were measured using qRT–PCR. A corrgram shows the genes are highly correlated with each other. The colour and thinness of the ellipse indicate the strength of correlation (a line is perfect correlation; a circle is uncorrelated). The ellipse direction indicates the sign of the correlation (correlated: right/blue, inversely correlated: left/red). c, Expression of selected genes is correlated with apoptosis. Scatterplots show apoptosis versus the log2 expression level of each gene. Expression of five genes (CCND1, CTNNB1, FZD5, MYC and TCF4) predicts apoptosis. The relationship is highlighted in a plot of apoptosis predicted using a multiple linear regression model with the five genes versus the actual data. d, Apoptosis observed after 48 h exposure to either vehicle (0.1% DMSO) or 500 nM I-BET across eight primary human AML samples. e, Relative viability of primary human AML samples after treatment with I-BET.
Supplementary Material
Acknowledgements
We thank A. Bannister for critical reading of the manuscript. The Leukaemia Foundation Australia, Haematology Society of Australia and New Zealand, Royal Australasian College of Physicians and the Victorian Comprehensive Cancer Centre have supported CYF with PhD scholarships. M.A.D. is a Senior Leukaemia Foundation Australia Fellow, VESKI Innovation Fellow and Herman Clinical Fellow. The National Health and Medical Research Council of Australia (1085015; 1066545) and Leukaemia Foundation Australia fund the Dawson laboratory.
Footnotes
Supplementary Information is available in the online version of the paper.
Author Contributions C.Y.F. and M.A.D. designed the research, interpreted data and wrote the manuscript. C.Y.F., O.G., E.Y.N.L., A.F.R., S.F., D.T., K.S., D.S., P.Y., J.M., G.G., D.L., R.G., A.T.P. and M.A.D. performed experiments and/or analysed data. E.L., A.F.R., P.J., R.G.R., S.C.-W.L., C.C., S.W.L., O.A.-W., T.K., R.W.J., S.-J.D., B.J.P.H., R.K.P. and A.T.P. provided critical reagents, interpreted data and aided in manuscript preparation.
Author Information The data discussed in this publication have been deposited in the NCBI Gene Expression Omnibus (GEO) under accession number GSE63683. Reprints and permissions information is available at www.nature.com/reprints. The authors declare competing financial interests: details are available in the online version of the paper. Readers are welcome to comment on the online version of the paper. Correspondence and requests for materials should be addressed to M.A.D. (mark.dawson@petermac.org).
Online Content Methods, along with any additional Extended Data display items and Source Data, are available in the online version of the paper; references unique to these sections appear only in the online paper.
References
- 1.Dawson MA, Kouzarides T & Huntly BJ Targeting epigenetic readers in cancer. N. Engl. J. Med 367, 647–657 (2012). [DOI] [PubMed] [Google Scholar]
- 2.Shi J & Vakoc CR The mechanisms behind the therapeutic activity of BET bromodomain inhibition. Mol. Cell 54, 728–736 (2014). [DOI] [PMC free article] [PubMed] [Google Scholar]
- 3.Herait PE et al. BET-bromodomain inhibitor OTX015 shows clinically meaningful activity at nontoxic doses: interim results of an ongoing phase I trial in hematologic malignancies. Cancer Res. 74, CT231 (2014). [Google Scholar]
- 4.Dawson MA & Kouzarides T Cancer epigenetics: from mechanism to therapy. Cell 150, 12–27 (2012). [DOI] [PubMed] [Google Scholar]
- 5.Helin K & Dhanak D Chromatin proteins and modifications as drug targets. Nature 502, 480–488 (2013). [DOI] [PubMed] [Google Scholar]
- 6.Dawson MA et al. Recurrent mutations, including NPM1c, activate a BRD4-dependent core transcriptional program in acute myeloid leukemia. Leukemia 28, 311–320 (2014). [DOI] [PMC free article] [PubMed] [Google Scholar]
- 7.Dawson MA et al. Inhibition of BET recruitment to chromatin as an effective treatment for MLL-fusion leukaemia. Nature 478, 529–533 (2011). [DOI] [PMC free article] [PubMed] [Google Scholar]
- 8.Zuber J et al. RNAi screen identifies Brd4 as a therapeutic target in acute myeloid leukaemia. Nature 478, 524–528 (2011). [DOI] [PMC free article] [PubMed] [Google Scholar]
- 9.Weisberg E, Manley PW, Cowan-Jacob SW, Hochhaus A & Griffin JD Second generation inhibitors of BCR-ABL for the treatment of imatinib-resistant chronic myeloid leukaemia. Nature Rev. Cancer 7, 345–356 (2007). [DOI] [PubMed] [Google Scholar]
- 10.Filippakopoulos P et al. Selective inhibition of BET bromodomains. Nature 468, 1067–1073 (2010). [DOI] [PMC free article] [PubMed] [Google Scholar]
- 11.Holohan C, Van Schaeybroeck S, Longley DB & Johnston PG Cancer drug resistance: an evolving paradigm. Nature Rev. Cancer 13, 714–726 (2013). [DOI] [PubMed] [Google Scholar]
- 12.Krivtsov AV et al. Transformation from committed progenitor to leukaemia stem cell initiated by MLL–AF9. Nature 442, 818–822 (2006). [DOI] [PubMed] [Google Scholar]
- 13.Somervaille TC & Cleary ML Identification and characterization of leukemia stem cells in murine MLL-AF9 acute myeloid leukemia. Cancer Cell 10, 257–268(2006). [DOI] [PubMed] [Google Scholar]
- 14.Wang Y et al. The Wnt/β-catenin pathway is required for the development of leukemia stem cells in AML. Science 327, 1650–1653 (2010). [DOI] [PMC free article] [PubMed] [Google Scholar]
- 15.Krivtsov AV et al. Cell of origin determines clinically relevant subtypes of MLL-rearranged AML. Leukemia 27, 852–860 (2013). [DOI] [PMC free article] [PubMed] [Google Scholar]
- 16.Valent P et al. Cancer stem cell definitions and terminology: the devil is in the details. Nature Rev. Cancer 12, 767–775 (2012). [DOI] [PubMed] [Google Scholar]
- 17.Eppert K et al. Stem cell gene expression programs influence clinical outcome in human leukemia. Nature Med. 17, 1086–1093 (2011). [DOI] [PubMed] [Google Scholar]
- 18.Goardon N et al. Coexistence of LMPP-like and GMP-like leukemia stem cells in acute myeloid leukemia. Cancer Cell 19, 138–152 (2011). [DOI] [PubMed] [Google Scholar]
- 19.Andersson AK et al. The landscape of somatic mutations in infant MLL-rearranged acute lymphoblastic leukemias. Nature Genet 47, 330–337 (2015). [DOI] [PMC free article] [PubMed] [Google Scholar]
- 20.Lovén J et al. Selective inhibition of tumor oncogenes by disruption of super-enhancers. Cell 153, 320–334 (2013). [DOI] [PMC free article] [PubMed] [Google Scholar]
- 21.Yeung J et al. β-Catenin mediates the establishment and drug resistance of MLL leukemic stem cells. Cancer Cell 18, 606–618 (2010). [DOI] [PubMed] [Google Scholar]
- 22.Jamieson CH et al. Granulocyte-macrophage progenitors as candidate leukemic stem cells in blast-crisis CML. N. Engl. J. Med 351, 657–667 (2004). [DOI] [PubMed] [Google Scholar]
- 23.Thorne CA et al. Small-molecule inhibition of Wnt signaling through activation of casein kinase 1α. Nature Chem. Biol 6, 829–836 (2010). [DOI] [PMC free article] [PubMed] [Google Scholar]
- 24.Knoechel B et al. An epigenetic mechanism of resistance to targeted therapy in T cell acute lymphoblastic leukemia. Nature Genet. 46, 364–370 (2014). [DOI] [PMC free article] [PubMed] [Google Scholar]
- 25.Rathert P et al. Transcriptional plasticity promotes primary and acquired resistance to BET inhibition. Nature 10.1038/nature14898 (2015). [DOI] [PMC free article] [PubMed] [Google Scholar]
- 26.Zhao W et al. A new bliss independence model to analyze drug combination data. J. Biomol. Screen 19, 817–821 (2014). [DOI] [PubMed] [Google Scholar]
- 27.Hu Y &Smyth GK ELDA: extreme limiting dilution analysis for comparing depleted and enriched populations in stem cell and other assays. J. Immunol. Methods 347, 70–78 (2009). [DOI] [PubMed] [Google Scholar]
- 28.Li H & Durbin R Fast and accurate short read alignment with Burrows–Wheeler transform. Bioinformatics 25, 1754–1760 (2009). [DOI] [PMC free article] [PubMed] [Google Scholar]
- 29.Amarasinghe KC, Li J& Halgamuge SK CoNVEX: copy number variation estimation in exome sequencing data using HMM. BMC Bioinformatics 14(Suppl. 2), S2 (2013). [DOI] [PMC free article] [PubMed] [Google Scholar]
- 30.Koboldt DC et al. VarScan 2: somatic mutation and copy number alteration discovery in cancer by exome sequencing. Genome Res. 22, 568–576(2012). [DOI] [PMC free article] [PubMed] [Google Scholar]
- 31.Cibulskis K et al. Sensitive detection of somatic point mutations in impureand heterogeneous cancer samples. Nature Biotechnol. 31, 213–219 (2013). [DOI] [PMC free article] [PubMed] [Google Scholar]
- 32.McKenna A et al. The Genome Analysis Toolkit: a Map Reduce framework for analyzing next-generation DNA sequencing data. Genome Res. 20, 1297–1303 (2010). [DOI] [PMC free article] [PubMed] [Google Scholar]
- 33.McLaren W et al. Deriving the consequences of genomic variants with the Ensembl API and SNP Effect Predictor. Bioinformatics 26, 2069–2070 (2010). [DOI] [PMC free article] [PubMed] [Google Scholar]
- 34.Karolchik D et al. The UCSC Table Browser data retrieval tool. Nucleic Acids Res. 32, D493–D496 (2004). [DOI] [PMC free article] [PubMed] [Google Scholar]
- 35.Zhang Y et al. Model-based analysis of ChIP-Seq (MACS). Genome Biol. 9, R137 (2008). [DOI] [PMC free article] [PubMed] [Google Scholar]
- 36.Tsirigos A, Haiminen N, Bilal E & Utro F GenomicTools: a computational platform for developing high-through put analytics in genomics. Bioinformatics 28, 282–283 (2012). [DOI] [PubMed] [Google Scholar]
- 37.Smyth G in Bioinformatics and Computational Biology Solutions using R and Bio conductor (eds Gentleman R et al. ) 397–420 (Springer, 2005). [Google Scholar]
- 38.Benjamini Y & Hochberg Y Controlling the false discovery rate: a practical and powerful approach to multiple testing. J. R. Stat Soc. B 57, 289–300 (1995). [Google Scholar]
- 39.Liao Y, Smyth GK &Shi W The Subread aligner: fast, accurate and scalable read mapping by seed-and-vote. Nucleic Acids Res. 41, e108 (2013). [DOI] [PMC free article] [PubMed] [Google Scholar]
- 40.Liao Y,Smyth GK & Shi W featureCounts: an efficient general purpose program for assigning sequence reads to genomic features. Bioinformatics 30, 923–930 (2014). [DOI] [PubMed] [Google Scholar]
- 41.Wu D et al. ROAST: rotation gene set tests for complex microarray experiments. Bioinformatics 26, 2176–2182 (2010). [DOI] [PMC free article] [PubMed] [Google Scholar]
- 42.Subramanian A et al. Gene set enrichment analysis: a knowledge-based approach for interpreting genome-wide expression profiles. Proc. Natl Acad. Sci. USA 102, 15545–15550 (2005). [DOI] [PMC free article] [PubMed] [Google Scholar]
Associated Data
This section collects any data citations, data availability statements, or supplementary materials included in this article.


