

Abstract
Toll‐like receptors (TLRs) are important sensors that recognize pathogen‐associated molecular patterns. Generally, TLR9 is known to recognize bacterial or viral DNA but not viral RNA and initiate an immune response. Herein, we demonstrate that infection with dengue virus (DENV), an RNA virus, activates TLR9 in human dendritic cells (DCs). DENV infection induces release of mitochondrial DNA (mtDNA) into the cytosol and activates TLR9 signaling pathways, leading to production of interferons (IFNs). The DENV‐induced mtDNA release involves reactive oxygen species generation and inflammasome activation. DENV infection disrupts the association between transcription factor A mitochondria (TFAM) and mtDNA and activates the mitochondrial permeability transition pores. The side‐by‐side comparison of TLR9 and cyclic GMP‐AMP synthase (cGAS) knockdown reveals that both cGAS and TLR9 comparably contribute to DENV‐induced immune activation. The significance of TLR9 in DENV‐induced immune response is also confirmed in examination with the bone marrow‐derived DCs prepared from Tlr9‐knockout mice. Our study unravels a previously unrecognized phenomenon in which infection with an RNA virus, DENV, activates TLR9 signaling by inducing mtDNA release in human DCs.
Keywords: dendritic cell, dengue virus, immune response, mitochondrial DNA, TLR9
Subject Categories: Microbiology, Virology & Host Pathogen Interaction; Signal Transduction
Introduction
Infection by dengue virus (DENV), a positive‐strand RNA virus belonging to the Flaviviridae family of viruses, has been recognized as one of the most important public health threats worldwide 1. The major causes of death in DENV‐infected patients, such as dengue hemorrhagic fever (DHF) and dengue shock syndrome (DSS), are highly correlated with the induction of an overwhelming immune response leading to production of high levels of proinflammatory cytokines 2. In addition to proinflammatory cytokines, the production of anti‐viral cytokines such as the family of interferon (IFN) proteins, including the type I IFNs (IFN‐α/β), type II IFNs (IFN‐γ), and type III IFNs (IFN‐λ), in the early phase of virus infection plays important roles in the fight against the virus 3, 4. Early reports have demonstrated that human dendritic cells (DCs), the most efficient antigen‐presenting cells, are natural DENV targets and serve as important immune sensors to initiate the immune response in the peripheral blood and in the lymphoid system 5, 6 and to trigger IFN signaling 7.
The Toll‐like receptor (TLR) family comprises 12 members that are important molecules for immune cells to recognize pathogen‐associated molecular patterns (PAMPs) that are present in nucleic acids, carbohydrates, lipids, or proteins 8, 9. Binding of TLRs to their cognate PAMPs leads to the generation of effective innate immunity against pathogens by inducing defensive mediators such as cytokines. The expression patterns and localization of different TLR family members vary; for example, TLR3, TLR7, TLR8, and TLR9 are localized in intracellular endosomes, and TLR1, TLR2, TLR4, TLR5, TLR6, and TLR11 are expressed on the cell surface. The intracellularly localized TLRs recognize specific PAMPs: TLR3 senses double‐stranded RNA, TLR7 and TLR8 recognize single‐stranded RNA 10, and TLR9 recognizes DNA oligonucleotides with unmethylated CpG base pairs 11. Aside from recognizing PAMPs, TLR9 in DCs can recognize “self‐DNA” upon anti‐DNA autoantibody‐mediated entry of DNA into the endolysosomal compartment 12. After endocytosing DNA and trafficking it to endolysosomes where TLR9 is located, binding of TLR9 to the DNA triggers a cascade of signaling events, including activation of NF‐κB and mitogen‐activated protein kinase (MAPK) p38 signaling pathways 13.
Mitochondria have been recognized as ancient bacteria and contain evolutionary endosymbionts. Mitochondria contain their own genome, and the circular mitochondrial DNA (mtDNA) shares certain similarities with bacterial DNA and contains nonmethylated CpG motifs 14. Tissue injury resulting from trauma releases mitochondrial damage‐associated molecular patterns into the circulation, which causes an inflammatory response through activation of the TLR9 signaling pathway 15. By engaging multiple pattern‐recognition receptors expressed on different cell types, mtDNA serves as a potent inducer of the proinflammatory immune response and IFN production 16.
In investigating the TLR subtypes involved in the induction of IFN‐λ1 in DENV‐infected DCs 7, we accidentally found that knockdown of TLR9, but not TLR7 (both serving as controls at the time), inhibited DENV‐induced IFN mRNA expression (data not shown). While it has long been agreed that activation of TLR9 requires its interaction with unmethylated DNA and an RNA virus such as dengue is not likely to activate TLR9, we decided to investigate through adequate and comprehensive approaches the possible involvement and roles of TLR9 in DENV infection. In the present study, we provide evidence that by inducing the release of both non‐oxidized and oxidized mtDNA into the cytosol, DENV infection activated the TLR9 signaling pathway.
Results
DENV infection activated TLR9 in human DCs
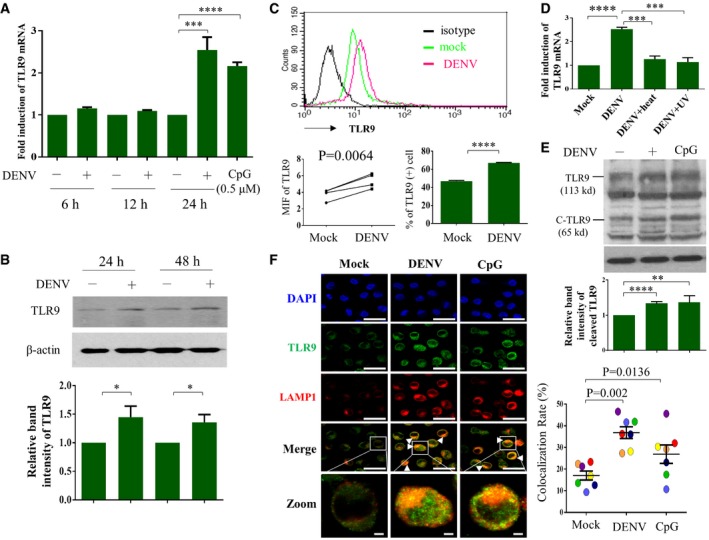
Compared to mock infection, DENV infection induced TLR9 mRNA (Fig 1A) and protein (Fig 1B) expression in human DCs. The results were confirmed by flow cytometry analysis (Fig 1C). Treating DENV with UV irradiation or heat inactivation significantly reduced TLR9 mRNA (Fig 1D). DENV infection also increased the level of cleaved form of TLR9 (Fig 1E). Using confocal microscopy, we demonstrated that under DENV infection, TLR9 co‐localized with lysosomal‐associated membrane protein 1 (LAMP‐1), a molecule that primarily resides across lysosomal membranes in the endolysosomal compartment, indicating the activated status of TLR9 (Fig 1F). These results suggest that the RNA virus dengue activated TLR9.
Figure 1. DENV infection activated TLR9 in human DCs.
-
A–DHuman DCs (1 × 10⁶ cells/ml) were infected by mock or DENV (NGC strain) at MOI 5 for the indicated periods of time or treated with CpG (0.5 μM) for 2 h, and the cells or cellular extracts were collected for determination of TLR9 mRNA expression (A, n = 5) or TLR9 protein expression via Western blotting (B, n = 8) or flow cytometry (C, n = 4). Heat‐ or UV‐inactivated DENV was used as controls (D, n = 4). Values are means of individual measurements in each sample ± SEM. *P < 0.05, ***P < 0.001, and ****P < 0.0001 (unpaired, two‐tailed Student's t‐test). Paired Student's t‐test was adopted for analysis in left lower panel of (C).
-
EHuman DCs were infected with mock or DENV (MOI = 5) for 24 h or treated with CpG (0.5 μM) for 2 h; expression of both TLR9 and its cleaved form (C‐TLR9) was determined by Western blotting; and the relative band intensity was measured (n = 6 and n = 2 for CpG‐positive control). Values are means of individual measurements in each sample ± SEM. **P < 0.01 and ****P < 0.0001 (unpaired, two‐tailed Student's t‐test).
-
FHuman DCs infected with mock or DENV (MOI = 5) for 16 h or treated with CpG (0.5 μM) for 2 h were immunostained with anti‐TLR9 and anti‐LAMP1 antibodies and then counterstained with DAPI (left panel, n = 7). The colocalization of TLR9 and LAMP1 was calculated using analysis software (right panel, n = 7). Each circle indicates the results from one single‐donor DCs. Values are means of individual measurements in each sample ± SEM, and the P‐values are indicated (paired, two‐tailed Student's t‐test). Scale bar = 20 μm (= 2 μm in zoomed pictures). Arrowheads indicate the colocalization of both TLR9 and LAMP1.
Source data are available online for this figure.
TLR9 knockdown blocked DENV‐induced IFNs and downstream signaling events
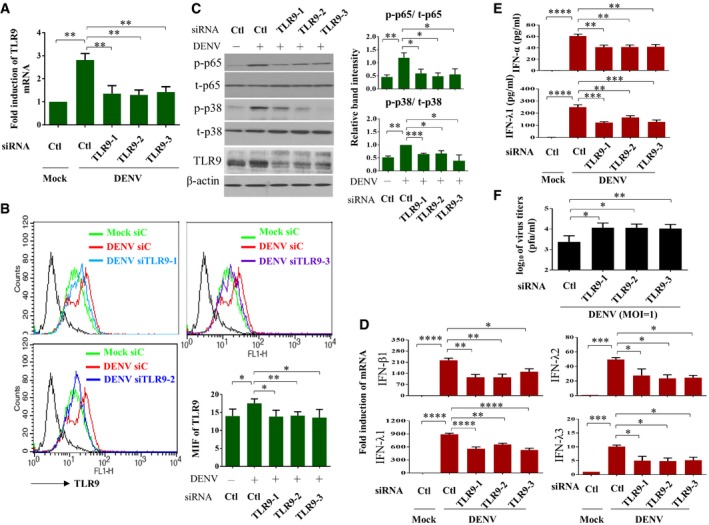
To evaluate whether TLR9 activation in DENV infection is functional and plays certain roles, TLR9 expression was inhibited with RNA interference, and the effects were determined. We showed that TLR9 gene (Fig 2A) and protein (Fig 2B) deficiency resulted in a reduction in DENV‐induced phosphorylation of p38 and p65 (Fig 2C). In parallel, TLR9 knockdown inhibited DENV‐induced IFN‐λ1, IFN‐λ2, IFN‐λ3, and IFN‐β1 mRNA expression (Fig 2D), and IFN‐λ1 and IFN‐α protein production (Fig 2E). Under the condition of TLR9 knockdown, DENV titers increased (Fig 2F). These results confirm that TLR9 activation plays crucial roles in DENV infection‐mediated immune response.
Figure 2. TLR9 activation contributed to DENV‐induced IFN production.
-
A–CHuman DCs were transfected with control siRNA (Ctl) or three sets of TLR9 siRNA duplexes for 24 h and then infected with mock or DENV (MOI = 5) for additional 24 h. The TLR9 mRNA (A, n = 3) and protein expression (B, n = 4) were determined by qPCR and flow cytometry, respectively. The levels of phosphorylated and unphosphorylated p65 (n = 5) and p38 (n = 3) and TLR9 in total cell lysates were analyzed and the relative band intensity measured (C). Values are means of individual measurements in each sample ± SEM. *P < 0.05, **P < 0.01, and ***P < 0.001 (one‐way ANOVA multiple comparisons with Bonferroni post hoc test).
-
D, EHuman DCs were transfected with control siRNA (Ctl) or three sets of TLR9 siRNA duplexes for 24 h and then infected with mock or DENV (MOI = 5) for additional 24 h. The mRNA expression of IFN‐β1, IFN‐λ1, IFN‐λ2, and IFN‐λ3 (D, n = 3) in cells and the protein levels of IFN‐α and IFN‐λ1 (E, n = 6 for IFN‐α and n = 3 for IFN‐λ1) in culture supernatants were measured. Values are means of individual measurements in each sample ± SEM. *P < 0.05, **P < 0.01, ***P < 0.001, and ****P < 0.0001 (one‐way ANOVA multiple comparisons with Bonferroni post hoc test).
-
FHuman DCs were transfected with control siRNA (Ctl) or three sets of TLR9 siRNA duplexes for 24 h and then infected with mock or DENV (MOI = 1) for additional 24 h. The virus titers in culture supernatants were measured by plaque assays (n = 4). Values are means of individual measurements in each sample ± SEM. *P < 0.05 and **P < 0.01 (unpaired, two‐tailed Student's t‐test).
Source data are available online for this figure.
DENV infection induced release of mtDNA into the cytosol but not the extracellular milieu
Several mechanisms have been demonstrated to activate TLR9 in the innate immune response, and one of these is the release of mitochondrial DNA (mtDNA), which serves as a TLR9 ligand 17. We showed that there was neither an increase in mtDNA copy number in either the free form or inside vesicles, nor in the MitoTracker Green‐positive mitochondrial particles in the supernatant of DENV‐infected cells compared to mock‐infected cells (Fig 3A). However, the levels of total cellular mtDNA copy number were mildly decreased after DENV infection at the 24‐h time point; in the meantime, there was significantly and proportionally increased cytosolic mtDNA 12 and 24 h after DENV infection (Fig 3B). The DENV‐induced TLR9 activation and mtDNA release were also demonstrated when DCs were infected with different DENV serotypes (serotypes 1, 3, and 4) as well as different DENV2 strains (Appendix Fig S1). Furthermore, similar results were observed when the studies were conducted in a human lung epithelial cell line (A549 cells) (Appendix Fig S2A and B). The introduced expression of TLR9 in 293T cells (293T‐TLR9) increased IFN‐β and IFN‐λ1 mRNA in response to DENV infection (Appendix Fig S2C). TLR9 immunoprecipitation and qPCR of mtDNA indicated that the released mtDNA in the cytosol was mainly bound to TLR9 in DENV‐infected DCs (Fig 3B). To clarify the oxidation status of mtDNA in DENV‐infected cells, both immunostaining and flow cytometry analysis with anti‐8‐OHdG antibody revealed an increased oxidized form of DNA after DENV infection (Fig 3C). Furthermore, ELISA of the cytosolic 8‐OHdG content revealed a higher oxidized DNA level in the cytosol of DENV‐infected cells (Fig 3D‐I). Immunoprecipitation approaches with antibodies against oxidized DNA followed by qPCR analysis of mtDNA demonstrated that both non‐oxidized and oxidized forms of mtDNA were released from mitochondria into the cytosol after DENV infection (Fig 3D‐II). The 8‐OHdG content in the input samples and the completeness of 8‐OHdG immunoprecipitation in the examined samples were confirmed (Fig 3D‐III and D‐IV). The colocalization of both TLR9 and DNA (likely mtDNA) was observed in DENV‐infected DCs by confocal microscopy (Fig 3E and Appendix Fig S3). Although we were not able to detect mtDNA signal in enriched lysosome of DCs, we did detect higher level of mtDNA in enriched lysosome of DENV‐infected 293T‐TLR9 cells compared to that in mock‐infected 293T‐TLR9 cells (data not shown).
Figure 3. DENV infection induced release of oxidized and non‐oxidized mtDNA into the cytosol.
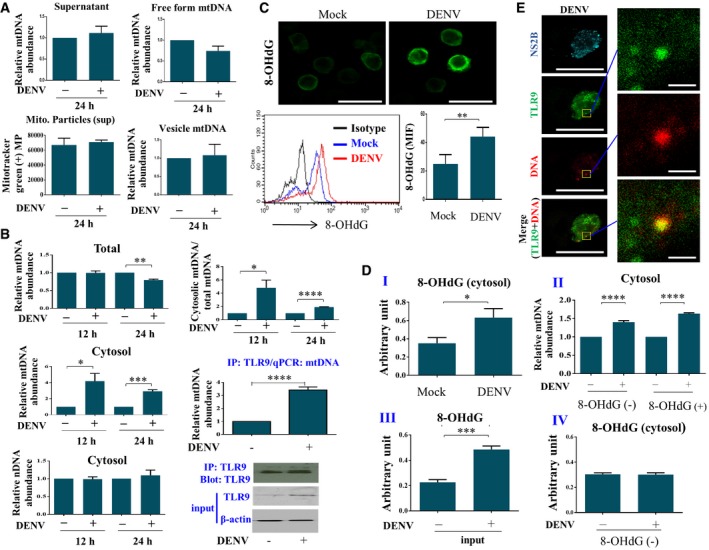
- Human DCs (1 × 10⁶ cells/ml) were infected by mock or DENV (MOI = 5) for 24 h. The mtDNA levels in supernatants as total (n = 7), free form (n = 5), or vesicle‐encapsulated mtDNA (n = 5) from mock‐ or DENV‐infected DCs were measured. Mitochondrial particles in supernatants were monitored by fluorescence probe MitoTracker Green (n = 6). There appeared no statistical significance with the parameters measured between mock and DENV infection by unpaired, two‐tailed Student's t‐test analysis.
- Human DCs infected with mock or DENV (MOI = 5) for 12 or 24 h were collected, and both total DNA and cytosolic DNA were extracted and quantified using qPCR with specific primers to measure the mtDNA and nDNA levels (n = 3). mtDNA bound to TLR9 was analyzed via immunoprecipitation of TLR9 followed by qPCR of mtDNA (n = 4). The relative abundance of cytosolic mtDNA and cytosolic nDNA was determined by normalization with the exogenously added 20 ng of a purified plasmid encoding FLAG gene (PCR3.1‐flag) as described in Materials and Methods. Values are means of individual measurements in each sample ± SEM. *P < 0.05, **P < 0.01, ***P < 0.001, and ****P < 0.0001 (unpaired, two‐tailed Student's t‐test).
- Human DCs infected with mock or DENV (MOI = 5) for 24 h were collected, and intracellular immunostaining with anti‐8‐OHdG antibody and flow cytometry analysis were conducted (n = 3). Values are means of individual measurements in each sample ± SEM. **P < 0.01 (paired, two‐tailed Student's t‐test). Scale bar = 20 μm.
- Human DCs infected with mock or DENV (MOI = 5) for 24 h were collected, and equal amounts of extracted cytosolic DNA were used to measure the level of 8‐OHdG via ELISA (I, n = 6). The oxidized DNA in the cytosolic fraction was immunoprecipitated with anti‐8‐OHdG antibodies. The relative abundance of mtDNA in the pelleted beads (indicated as 8‐OHdG+) was quantified with qPCR. The remaining mtDNA in the supernatant (indicated as 8‐OHdG−) was also analyzed with qPCR (II, n = 4 for 8‐OHdG+ and n = 3 for 8‐OHdG−). The level of 8‐OHdG in samples before (III, labeled “input”, n = 4) and after immunoprecipitation (IV, labeled “8‐OHdG−”, n = 4) was verified by 8‐OHdG ELISA. Values are means of individual measurements in each sample ± SEM. *P < 0.05, ***P < 0.001, and ****P < 0.0001 (unpaired, two‐tailed Student's t‐test).
- Human DCs infected with DENV (MOI = 5) for 16 h were immunostained with anti‐TLR9, anti‐DNA, and anti‐NS2B antibodies and then counterstained with DAPI. The representative pictures were shown, and the colocalization of TLR9 and DNA was zoomed (n = 4). Scale bar = 20 μm (= 1 μm in zoomed pictures).
Source data are available online for this figure.
ROS and inflammasome activation by DENV were responsible for the release of mtDNA
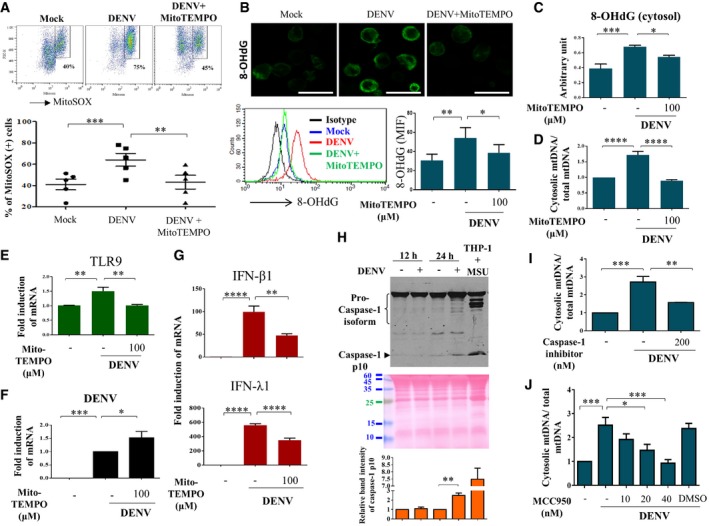
We next investigated possible mechanisms leading to mtDNA release. The results demonstrated that DENV infection induced ROS in DCs, evidenced by increased staining with MitoSOX, a triphenylphosphonium‐linked dihydroethidium compound that accumulates in mitochondria and exhibits red fluorescence when oxidized by ROS (Fig 4A). The effects were abolished by MitoTEMPO, a mitochondria‐targeted superoxide dismutase mimetic that possesses superoxide and alkyl radical scavenging properties (Fig 4A). Treatment with MitoTEMPO reduced total oxidized DNA (Fig 4B) and specifically cytosolic oxidized DNA levels (Fig 4C). In parallel, MitoTEMPO inhibited DENV‐induced mtDNA release into the cytosol (Fig 4D) and TLR9 expression (Fig 4E) but noticeably increased DENV mRNA expression (Fig 4F). Meanwhile, DENV‐induced expression of IFN‐β1 and IFN‐λ1 mRNA was also attenuated by MitoTEMPO (Fig 4G). The involvement of ROS in DENV‐induced mtDNA release could also be demonstrated with a mitochondria‐targeted antioxidant MitoQ that quenches mtROS 18 (Fig EV1). Given that DENV infection induced expression of caspase‐1 p10 (Fig 4H) suggesting inflammasome induction, treating DCs with a caspase‐1 inhibitor attenuated DENV‐induced mtDNA release (Fig 4I). MCC950, a potent and selective inhibitor of the NOD‐like receptor (NLR) family, pyrin domain‐containing protein 3 (NLRP3) inflammasome 19 also inhibited DENV‐induced mtDNA release (Fig 4J). These results provide evidence suggesting the involvement of ROS and inflammasome in DENV‐induced mtDNA release into the cytosol.
Figure 4. ROS and inflammasomes were involved in DENV‐induced mtDNA release.
-
A–GHuman DCs were infected with mock or DENV (MOI = 5) in the absence or presence of a mitochondrial ROS scavenger, MitoTEMPO (100 μM). The intensity of MitoSOX fluorescence observed via flow cytometry was used as an indicator of mitochondrial ROS levels (A, n = 5). The levels of 8‐OHdG were measured by immunostaining (Scale bar = 20 μm) and flow cytometry analysis (B, n = 6). The levels of both cytosolic 8‐OHdG (C, n = 6) and mtDNA release (D, n = 4) were measured by ELISA and qPCR, respectively. Meanwhile, the expression of TLR9 mRNA (E, n = 4), DENV mRNA (F, n = 6), and IFN‐β1 and IFN‐λ1 mRNA (G, n = 4) was determined. Values are means of individual measurements in each sample ± SEM. *P < 0.05, **P < 0.01, ***P < 0.001, and ****P < 0.0001 (one‐way ANOVA multiple comparisons with Bonferroni post hoc test).
-
HHuman DCs were infected with mock or DENV (MOI = 5) for 12 or 24 h. The cell culture supernatants from mock‐ or DENV‐infected DCs were collected and measured for caspase‐1 p10 expression using Western blotting (n = 3). The supernatant from THP‐1‐derived macrophages treated with monosodium urate crystals was used as a positive control. The loading control was shown with Ponceau S stain. Values are means of individual measurements in each sample ± SEM. **P < 0.01 (unpaired, two‐tailed Student's t‐test).
-
IHuman DCs were pretreated with caspase‐1 inhibitor (n = 3) and then infected with mock or DENV (MOI = 5) for 24 h. The relative abundance of cytosolic mtDNA and total mtDNA was determined. Values are means of individual measurements in each sample ± SEM. **P < 0.01 and ***P < 0.001 (one‐way ANOVA multiple comparisons with Bonferroni post hoc test).
-
JHuman DCs were pretreated with various doses of MCC950 (n = 4) and then infected with mock or DENV (MOI = 5) for 24 h. The relative abundance of cytosolic mtDNA and total mtDNA was determined. Values are means of individual measurements in each sample ± SEM. *P < 0.05 and ***P < 0.001 (one‐way ANOVA multiple comparisons with Bonferroni post hoc test).
Source data are available online for this figure.
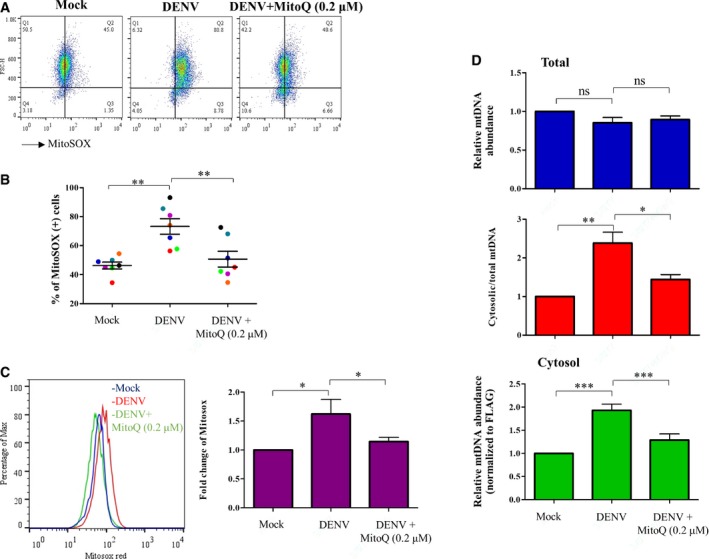
Figure EV1. Effects of a mitochondria‐targeted antioxidant MitoQ in DENV‐induced mtDNA release.
-
A–DHuman DCs were infected with mock or DENV (MOI = 5) in the absence or presence of a mitochondria‐targeted antioxidant MitoQ (0.2 μM). The intensity of MitoSOX fluorescence (A, n = 7), the percentages of MitoSOX‐positive cells (B, n = 7), the percentages of Max (C, n = 7), and the relative abundance of mtDNA (D, n = 7) were determined. Values are means of individual measurements in each sample ± SEM. *P < 0.05, **P < 0.01, and ***P < 0.001 (paired, two‐tailed Student's t‐test).
Disturbance of TFAM–mtDNA association and opening of MPT pores were involved in mtDNA release
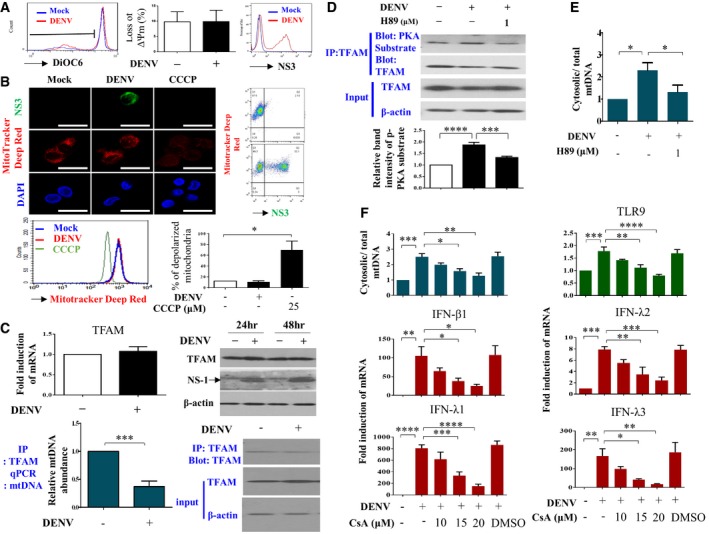
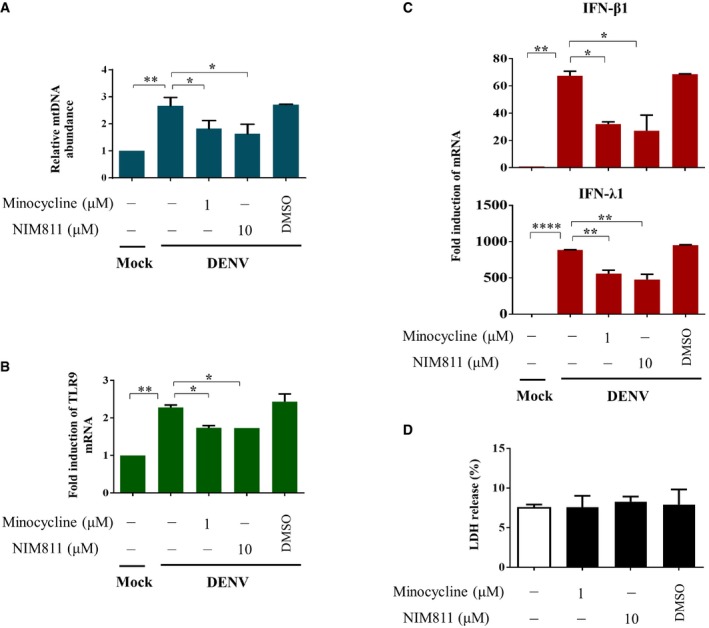
Staining with DiOC6, a fluorescent membrane dye used to detect the mitochondrial outer membrane potential in live cells, did not reveal any disruption in the mitochondrial membrane potential in DENV‐infected DCs (Fig 5A). The same conclusion was obtained with the assessment of MitoTracker Deep Red staining (Fig 5B). As a positive control, carbonyl cyanide m‐chlorophenyl hydrazine (CCCP) treatment increased mitochondrial membrane depolarization. In addition, both virus‐infected DCs (NS3‐positive) and virus‐uninfected DCs (NS3‐negative) shared similar intensity of MitoTracker Deep Red signal (Fig 5B). In contrast, weaker signal of MitoTracker Deep Red in A549 cells expressing DENV NS3 protein was observed (Appendix Fig S4). Although the spare respiratory capacity of mitochondria was not affected by DENV infection, DENV infection mildly increased the basal mitochondrial respiration rate (Appendix Fig S5A). Furthermore, DENV infection neither induced mitophagy in DCs (Appendix Fig S5B) nor caused more cell death or LDH release compared to mock infection (Appendix Fig S6). Noticeably, there was a clear difference between DCs and A549 cells in response to DENV infection using JC‐1 probe to examine changes of mitochondrial membrane potential (Appendix Fig S7). Moreover, there were no evident changes in mitochondrial morphology in DENV‐infected DCs, a sharp contrast to DENV‐infected Huh7 hepatoma cells under transmission electron microscopy (Appendix Fig S8). We were surprised to find that the mRNA and protein levels of TFAM, a molecule that binds and keeps mtDNA inside the mitochondria, were not affected after DENV infection (Fig 5C, upper panel). However, the results of TFAM immunoprecipitation followed by qPCR of mtDNA showed that less TFAM was bound to mtDNA in DENV‐infected DCs compared to mock‐infected DCs (Fig 5C, lower panel). The kinase activity of protein kinase A (PKA) bound to TFAM increased in DENV‐infected DCs, and the PKA inhibitor H89 inhibited this effect (Fig 5D). Accordingly, H89 also inhibited DENV‐induced mtDNA release (Fig 5E). Meanwhile, DENV infection reduced ATP, a key mediator required for TFAM degradation (Appendix Fig S9). Cyclosporin A, a potent inhibitor of mitochondrial permeability transition pore formation, dose‐dependently inhibited DENV‐induced mtDNA release and TLR9 mRNA and IFN mRNA expression (Fig 5F). Two other compounds, NIM811 and minocycline, capable of blocking mitochondrial permeability transition without affecting nuclear factor of activated T‐cell activity 20, also could inhibit DENV‐induced mtDNA release and TLR9 mRNA and IFN mRNA expression (Fig EV2). These results suggest that DENV infection activated PKA and induced an increase in mtDNA dissociation from TFAM and release into the cytosol through increased mitochondrial membrane permeability; albeit no changes in mitochondrial membrane potential could be detected.
Figure 5. TFAM phosphorylation and opening of mitochondrial transition pores were responsible for mtDNA release.
- After infection with mock or DENV (MOI = 5) for 24 h, DCs were collected and the changes in mitochondria outer membrane potential were measured by staining with DiOC6 followed by flow cytometry analysis (n = 4). Values are means of individual measurements in each sample ± SEM. There was no statistical significance by unpaired, two‐tailed Student's t‐test analysis. The detection of viral NS3 fluorescence intensity confirmed productive viral infection.
- After infection with mock or DENV (MOI = 5) for 24 h, DCs were collected. The status of mitochondria depolarization was assessed with MitoTracker Deep Red staining (n = 3). The staining of both NS3 and DAPI was included. DCs treated with 25 μM CCCP for 3 h were used as the positive control. Values are means of individual measurements in each sample ± SEM. *P < 0.05 (unpaired, two‐tailed Student's t‐test). Scale bar = 20 μm.
- After infection with mock or DENV (MOI = 5) for 24 h, DCs were collected. Both mRNA and protein levels of TFAM were not affected by DENV infection (upper panel, n = 7). The levels of TFAM‐binding mtDNA were quantified via immunoprecipitation of TFAM followed by qPCR of mtDNA (lower panel, n = 4). Values are means of individual measurements in each sample ± SEM. ***P < 0.001 (unpaired, two‐tailed Student's t‐test). The inclusion of 48‐h time point of DENV infection shown in the right upper panel served as another comparison. Arrow indicates the position of NS‐1.
- After infection with mock or DENV (MOI = 5) for 24 h, DCs were collected. To measure PKA activity, the protein complex bound to TFAM was immunoprecipitated and then incubated with antibodies against PKA‐phosphorylated peptides (anti‐PKA substrate) or TFAM (lanes 1 and 2, n = 5). Meanwhile, the effect of a PKA inhibitor (H89) on DENV‐induced PKA activity on TFAM phosphorylation was determined (lane 3, n = 5). Values are means of individual measurements in each sample ± SEM. ***P < 0.001 and ****P < 0.0001 (one‐way ANOVA multiple comparisons with Bonferroni post hoc test).
- Human DCs were infected with mock or DENV (MOI = 5) for 24 h and mtDNA release was measured (n = 4). Values are means of individual measurements in each sample ± SEM. *P < 0.05 (one‐way ANOVA multiple comparisons with Bonferroni post hoc test).
- Human DCs were pretreated or not with various doses of cyclosporin A for 2 h and then infected with mock or DENV (MOI = 5) for 24 h. Accordingly, several parameters, including mtDNA release (n = 3), TLR9 mRNA (n = 4), and IFN mRNA (n = 4 for IFN‐λ1 and IFN‐λ3 and n = 3 for IFN‐β1 and IFN‐λ2) expression, were determined. Values are means of individual measurements in each sample ± SEM. *P < 0.05, **P < 0.01, ***P < 0.001, and ****P < 0.0001 (one‐way ANOVA multiple comparisons with Bonferroni post hoc test).
Source data are available online for this figure.
Figure EV2. Effects of minocycline and NIM811 on DENV‐induced mtDNA release, TLR9 mRNA expression, and IFN mRNA expression.
-
A–DHuman DCs (2 ×10⁴) were infected with mock or DENV (MOI = 5) for 24 h in the absence or presence of minocycline (1 μM), NIM811 (10 μM) or DMSO. The relative abundance of mtDNA was measured using the exogenously added FLAG gene as a control for normalization (A, n = 2). The expression of TLR9 mRNA (B, n = 2), IFN‐β1 and IFN‐λ1 mRNA (C, n = 2), and LDH release (D, n = 2) were measured accordingly. Values are means of individual measurements in each sample ± SEM. *P < 0.05, **P < 0.01, and ****P < 0.0001 (one‐way ANOVA multiple comparisons with Bonferroni post hoc test).
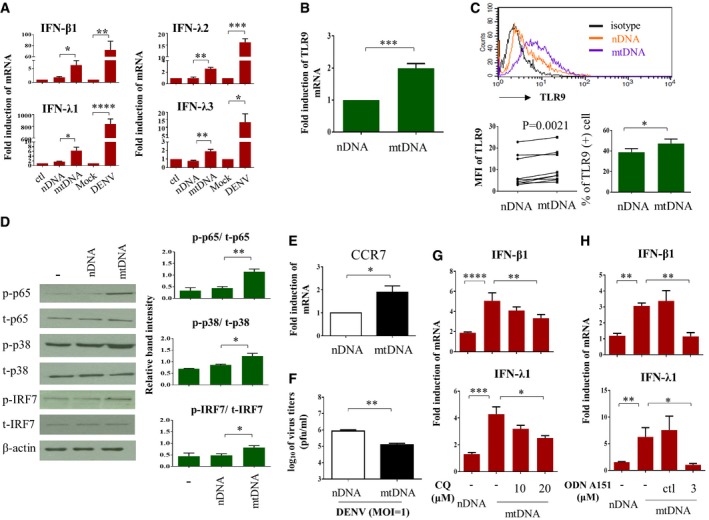
Exogenous introduction of mtDNA recapitulated in part DENV infection‐induced signaling events
To confirm that the release of mtDNA into the cytosol can to a certain extent mimic DENV infection‐induced effects, we exogenously introduced mtDNA into DCs and evaluated the following events. Compared to the introduction of nDNA, which had no effect, mtDNA transduction induced IFN mRNA expression, although the magnitude was less than that from DENV infection (Fig 6A). mtDNA also enhanced TLR9 expression at both mRNA and protein levels (Fig 6B and C, respectively). In addition, mtDNA administration activated TLR9 downstream signaling molecules, such as p65, MAPK p38, and IRF7, in DCs (Fig 6D). Transfection with mtDNA increased DENV‐induced CCR7 mRNA expression (Fig 6E), an important molecule for DENV infection‐induced migration of DCs 7, but suppressed virus production (Fig 6F). Furthermore, treatment with chloroquine, an inhibitor of endosomal acidification capable of suppressing TLR9 activity 21, abolished mtDNA‐induced IFN‐λ1 and IFN‐β1 mRNA expression (Fig 6G). Blocking the TLR9 signaling pathway with synthetic oligodeoxynucleotide (ODN) TTAGGG (ODN A151), which comprises the suppressive (TTAGGG)4 motif and acts as a TLR9 antagonist, also inhibited mtDNA‐mediated IFN‐λ1 and IFN‐β1 mRNA induction (Fig 6H). These findings suggest that mtDNA released into the cytosol by DENV infection of DCs caused TLR9 activation and its downstream MAPK p38 and NF‐κB signaling, potentially facilitating DC migration and IFN production and consequently limiting virus propagation.
Figure 6. Introduction of mtDNA simulated DENV infection‐mediated effects in DCs.
-
A–EBoth mtDNA and nDNA were prepared as described in the Materials and Methods. Either mtDNA or nDNA at 1 μg was delivered into DCs via electroporation. Null‐electroporated cells were used as controls. Several parameters, including IFN mRNA (A, n = 5 for IFN‐β1 and IFN‐λ1, n = 3 for IFN‐λ2 and n = 4 for IFN‐λ3), TLR9 mRNA (B, n = 4), and TLR9 protein expression (C, n = 9 for MFI measurement and n = 4 for percentages analysis), were measured. The levels of phosphorylated and unphosphorylated p65, p38, and IRF7 (D, n = 3) and expression of CCR7 mRNA (E, n = 5) were determined. DCs infected by mock or DENV (MOI = 5) for 24 h served for additional comparisons in (A). Values are means of individual measurements in each sample ± SEM. *P < 0.05, **P < 0.01, and ***P < 0.001 (unpaired, two‐tailed Student's t‐test). Paired Student's t‐test was adopted for analysis in left lower panel of (C).
-
FHuman DCs were introduced with either nDNA or mtDNA through electroporation. Twenty‐four hours later, DCs were infected with DENV (MOI = 1) and the effects of nDNA and mtDNA on viral production were measured by plaque assays (n = 3). Values are means of individual measurements in each sample ± SEM. **P < 0.01 (unpaired, two‐tailed Student's t‐test).
-
GHuman DCs were treated with various doses of chloroquine 30 min before nDNA or mtDNA delivery through electroporation. Twenty‐four h after electroporation, the levels of IFN‐β1 and IFN‐λ1 mRNA were determined (n = 3). Values are means of individual measurements in each sample ± SEM. *P < 0.05, **P < 0.01, ***P < 0.001, and ****P < 0.0001 (one‐way ANOVA multiple comparisons with Bonferroni post hoc test).
-
HHuman DCs were treated with the TLR9 antagonist ODN A151 or its control (ctl) for 2 h before nDNA or mtDNA delivery, and IFN‐β1 and IFN‐λ1 mRNA expression was measured (n = 3). Values are means of individual measurements in each sample ± SEM. *P < 0.05 and **P < 0.01 (unpaired, two‐tailed Student's t‐test).
Source data are available online for this figure.
Depletion of mtDNA inhibited DENV‐induced effects
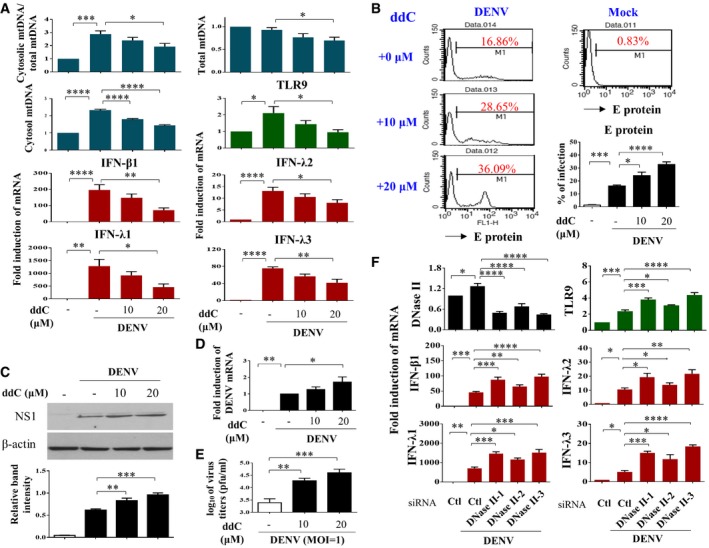
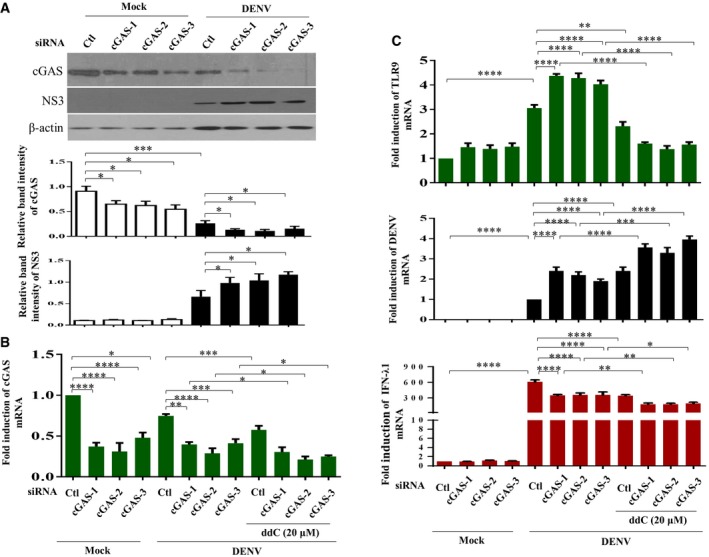
To further examine the impact of mtDNA release in DENV infection‐mediated effects, we treated cells with ddC (2′3′‐dideoxycytidine) to deplete mtDNA. Treatment with ddC reduced total mtDNA content, DENV‐induced release of mtDNA, TLR9 expression, and the mRNA levels of IFN‐λ1, IFN‐λ2, IFN‐λ3, and IFN‐β1 (Fig 7A). Unexpectedly, treatment with ddC also reduced the ratio of cytosolic/total mtDNA with the mechanisms currently unclear. In contrast, ddC treatment enhanced expression of DENV E protein (Fig 7B), DENV NS1 protein (Fig 7C), DENV mRNA (Fig 7D), and DENV titers (Fig 7E). In addition to decreasing mtDNA copy number with ddC, as an alternative approach, DCs were transduced with DNase II siRNA to prevent mtDNA degradation. We showed that DNase II knockdown via siRNA enhanced DENV‐induced TLR9 and IFN mRNA expression (Fig 7F). Because degradation of cyclic GMP‐AMP synthase (cGAS) has been shown to be targeted by DENV as an evasion mechanism from anti‐viral immunity 22, the effects of cGAS knockdown (Fig EV3A and B) were determined. The results showed that in the deficiency of cGAS, DENV infection induced stronger TLR9 expression, likely due to more free cytosolic mtDNA available to activate TLR9 (Fig EV3C). Unexpectedly, under the condition of cGAS knockdown and stronger TLR9 expression, DENV‐induced IFN‐λ1 (also IFN‐β1, data not shown) mRNA expression reduced and DENV mRNA expression increased (Fig EV3C). The results seemed to indicate that, under reduction in cGAS, the TLR9‐mediated effects were modified with the mechanisms currently unclear. Furthermore, in the presence of combining both depletion of mtDNA by ddC treatment and cGAS knockdown compared to cGAS knockdown alone, further reduction in TLR9 and IFN‐λ1 mRNA as well as induction of DENV mRNA was observed (Fig EV3B and C). The side‐by‐side comparisons with knockdown of TLR9 and cGAS were performed, and the results suggest that both cGAS and TLR9 were comparably important in DENV‐induced IFN mRNA expression (Fig EV4). As controls, the various treatments in this study did not preserve significant cytotoxicity (Appendix Fig S10). In animal studies, we showed that DENV infection of bone marrow‐derived DCs (BMDCs) prepared from Tlr9‐knockout mice resulted in lower IFN‐β1 mRNA expression and higher DENV mRNA expression compared to DENV‐infected BMDCs prepared from wild‐type mice (Fig 8). Thus, the studies in Tlr9‐knockout mice support the observations in human primary DCs. A cartoon showing how DENV infection regulates mtDNA release and the subsequent effects is presented in Appendix Fig S11.
Figure 7. Altering mtDNA content with ddC or DNase II siRNA modulated DENV‐induced effects in DCs.
-
A–DHuman DCs were pre‐incubated with ddC at the indicated concentrations for 48 h to abrogate mtDNA. Cells were collected 24 h after mock or DENV (MOI = 5) infection. The mtDNA release (n = 4) and levels of TLR9 mRNA (n = 3) and IFN mRNA (n = 4 for IFN‐β1 and IFN‐λ2; n = 3 for IFN‐λ1 and IFN‐λ3) were determined (A). In parallel, DENV E protein (B, n = 4), DENV NS1 protein (C, n = 4), and DENV mRNA (D, n = 4) were measured by different approaches, respectively. Values are means of individual measurements in each sample ± SEM. *P < 0.05, **P < 0.01, ***P < 0.001, and ****P < 0.0001 (one‐way ANOVA multiple comparisons with Bonferroni post hoc test).
-
EAfter ddC treatment, DCs were infected by DENV (MOI = 1) for 24 h and the virus titers were determined by plaque assays (n = 4). Values are means of individual measurements in each sample ± SEM. **P < 0.01 and ***P < 0.001 (one‐way ANOVA multiple comparisons with Bonferroni post hoc test).
-
FHuman DCs were transfected with control siRNA (Ctl) or three sets of DNase II siRNA duplexes for 24 h and then infected with mock or DENV (MOI = 5) for additional 24 h. Several DENV‐induced parameters were measured thereafter as indicated (n = 4 for DNase II, TLR9, IFN‐β1, and IFN‐λ2 and n = 3 for IFN‐λ1 and IFN‐λ3). Values are means of individual measurements in each sample ± SEM. *P < 0.05, **P < 0.01, ***P < 0.001, and ****P < 0.0001 (one‐way ANOVA multiple comparisons with Bonferroni post hoc test).
Source data are available online for this figure.
Figure EV3. Effects of cGAS knockdown with or without concomitant mtDNA depletion in DENV‐infected DCs.
-
A–CHuman DCs were transfected with control siRNA (Ctl) or three sets of cGAS siRNA duplexes for 24 h and then infected with mock or DENV (MOI = 5) for an additional 24 h. As indicated, ddC treatment to deplete mtDNA was introduced in some conditions. The cGAS, viral NS3 and β‐actin protein levels (A, n = 4), cGAS mRNA (B, n = 4) and TLR9 mRNA, DENV mRNA, and IFN‐λ1 mRNA (C, n = 4) were determined. Values are means of individual measurements in each sample ± SEM. *P < 0.05, **P < 0.01, ***P < 0.001, and ****P < 0.0001 (one‐way ANOVA multiple comparisons with Bonferroni post hoc test).
Source data are available online for this figure.
Figure EV4. Side‐by‐side comparisons of the effects of TLR9 and cGAS knockdown in DENV‐induced IFN mRNA expression.
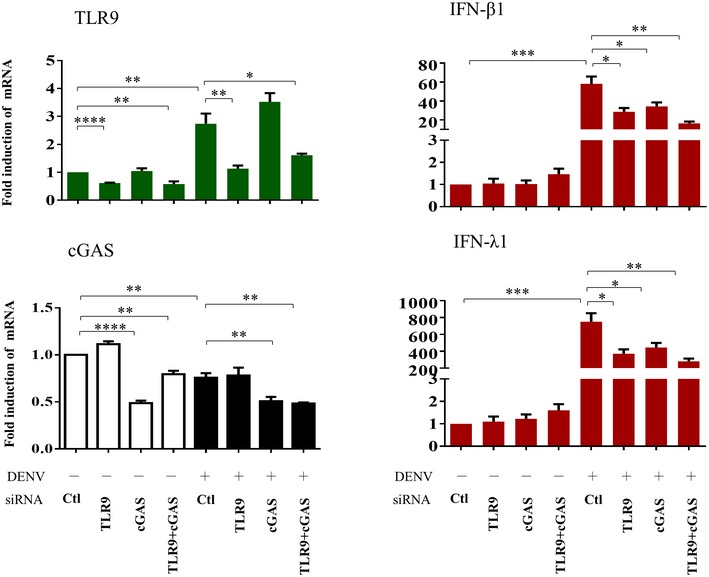
Human DCs were transfected with control siRNA (Ctl), TLR9 siRNA, cGAS siRNA, or both TLR9 and cGAS siRNA duplexes for 24 h and then infected with mock or DENV (MOI = 5) for an additional 24 h. The mRNA levels of TLR9, cGAS, IFN‐β1, and IFN‐λ1 were determined (n = 4). Values are means of individual measurements in each sample ± SEM. *P < 0.05, **P < 0.01, ***P < 0.001, and ****P < 0.0001 (unpaired, two‐tailed Student's t‐test).
Figure 8. Regulation of IFN‐β1 and DENV mRNA in bone marrow‐derived DCs (BMDCs) prepared from Tlr9‐knockout and wild‐type mice.
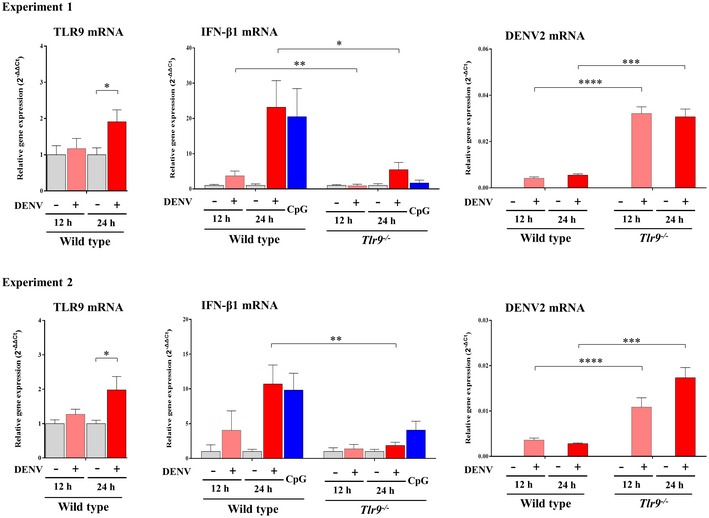
BMDCs (1 × 10⁶ cells/ml) prepared from wild‐type and Tlr9‐knockout mice were infected with mock or DENV (MOI = 5) for 12 or 24 h. Treatment with CpG (0.5 μM) served as the control. The expression of TLR9 mRNA, IFN‐β1 mRNA, and DENV mRNA was measured with qPCR. One pair of mice (one wild‐type mouse and one Tlr9‐knockout mouse) were included for each independent experiment. The results showed two out of five independent experiments. Values are means of individual measurements (in triplicate) in each sample ± SD. *P < 0.05, **P < 0.01, ***P < 0.001, and ****P < 0.0001 (unpaired, two‐tailed Student's t‐test).Source data are available online for this figure.
Discussion
Plasmacytoid DCs are well‐known to express TLR7 and TLR9 in endosomes, through which viral RNA and viral DNA, respectively, can be recognized and induce an immune response 23. In the present study, we reveal connections between infection with the dengue RNA virus, the release of mtDNA into the cytosol, and the activation of TLR9 and TLR9 downstream signaling pathways, such as NF‐κB. These events lead to induction of the anti‐viral cytokines IFNs, including IFN‐β1, IFN‐λ1, IFN‐λ2, and IFN‐λ3, in human DCs. Interestingly, stimulation with the TLR9 ligand CpG A induces less IFN‐α expression in peripheral blood mononuclear cells obtained from DENV‐infected patients with severe clinical manifestations compared to those with less severe symptoms 24. This highlights the crucial role of TLR9 signaling in the pathogenesis of DENV infection.
MtDNA can mediate the proinflammatory response through many different mechanisms 16. Many situations may cause mtDNA release, such as tissue injury, proinflammatory cytokine stimulation, and stress conditions 15, 25, 26. In the current study, we also identified several required processes that regulate mtDNA release in DCs induced by DENV infection. Mitochondrial superoxide production was increased in DENV‐infected DCs compared to mock‐infected DCs. Through several different approaches, we also demonstrated that there was no increased cell death in DENV‐infected DCs compared to mock‐infected DCs, in sharp contrast with DENV‐infected immortalized cells (Fig 5B, and Appendix Figs S4–S8). The observation is also consistent with our previous report 5. Along with inhibition of mitochondrial superoxide production, MitoTEMPO suppressed DENV‐induced formation and release of oxidized mtDNA, TLR9 expression and IFN production and increased virus replication (Fig 4). Blockade with cyclosporine A, a potent inhibitor of the mitochondrial membrane permeability transition pore, prevented mtDNA release into the cytosol and effectively inhibited DENV‐induced signaling events (Fig 5). Exogenously introduced mtDNA triggered NF‐κB and p38 activation, induced IFN production, and inhibited virus production (Fig 6). Inhibition of mtDNA‐TLR9 signaling by chloroquine, which acidifies lysosomes and impairs TLR9 activity, or by the CpG inhibitor ODN that binds but does not activate TLR9 ameliorated the mtDNA‐mediated effects. Moreover, reduction in mtDNA content through inhibiting mtDNA replication by ddC suppressed the DENV‐induced effects. In contrast, augmentation of mtDNA content by preventing mtDNA degradation with DNase II deficiency led to the opposite outcomes (Fig 7). All these evidences support the crucial roles of the mtDNA‐TLR9 axis in DENV infection‐mediated IFN production and their consequential events. In support of our observations, while this report was under preparation for submission, Aguirre et al presented evidence that DENV infection induced mtDNA release in genetically modified 293T cells 22. Nevertheless, to the best of our knowledge, this is the first report demonstrating DENV infection‐induced release of mtDNA into the cytosol in human DCs.
To our surprise, given that DENV infection induced ROS generation, mtDNA release, TLR9 activation, and the following signaling cascades, it did not affect mitochondrial membrane potential. According to Catteau et al, induced expression of a nine‐residue sequence of the DENV M protein results in disruption of the mitochondrial transmembrane potential in transformed cells and tumor cells; however, there is no generation of reactive oxygen species 27. The findings appeared to be different from those of the current study using intact virus to infect human DCs, where the involvement of oxidative stress but not changes in mitochondrial transmembrane potential were detected. The development of morphological and ultrastructural mitochondrial changes in DENV infection‐induced apoptosis has been observed in cell lines such as HepG2 28. In the present study, we did not specifically examine mitochondrial size and shape, and therefore, the differences in mitochondrial dynamics between immortal cell lines and primary human cells infected by DENV are currently unclear. However, in our series of observations in different cell types infected by DENV, DCs appeared to be healthy and showed no evident cytopathic or apoptotic characteristics, which is in contrast to results observed with A549 and the liver cell line HepG2 (5, 29 and data not shown). This might explain, at least in part, why no changes in mitochondrial membrane potential were detected in DENV‐infected DCs.
DENV infection induced the release of both non‐oxidized and oxidized forms of mtDNA into the cytosol (Fig 3D). Compared to the non‐oxidized form, oxidized mtDNA more strongly activates TLR9 signaling 30. Early studies already demonstrated that release of mtDNA into the cytosol is dependent on NALP3 inflammasome and mitochondrial ROS 31 and is triggered by Bak‐/Bax‐mediated signaling 32. To our surprise, mtDNA not only activated but also upregulated TLR9 expression, a mechanism by which mtDNA can amplify its proinflammatory effects. While phosphorylation of TFAM by protein kinase A is an important step leading to TFAM degradation and mtDNA release, in this report, we could not detect a reduction in TFAM levels (Fig 5C, upper panel). However, the TFAM‐binding mtDNA level was reduced after DENV infection (Fig 5C, lower panel). In addition, DENV infection activated PKA kinase activity to phosphorylate its substrate TFAM (Fig 5D). Furthermore, the PKA inhibitor H89 inhibited mtDNA release (Fig 5E). Moreover, DENV infection reduced the ATP level and was thus likely to downregulate TFAM degradation machinery which is ATP‐dependent. Altogether, these results suggest the involvement of the PKA‐TFAM‐mtDNA cascade in DENV‐induced mtDNA release. Quick replenishment of degraded TFAM may possibly have helped maintain the total TFAM level inside the mitochondria.
There are several different strategies that viruses can adopt to evade suppression by innate immunity effectors such as anti‐viral IFNs 33, 34. For example, interference with mitochondrial morphodynamics is one of the strategies by DENV to attenuate the innate immune response 35. Given the proinflammatory effects of mtDNA, manipulation of mtDNA release or the mtDNA response has been targeted by invading pathogens. An important observation by Aguirre et al 22 identified cyclic GMP‐AMP synthase as the sensor for intracellular mtDNA and the recognition mechanisms are greatly dismantled by DENV by targeting both the cyclic GMP‐AMP synthase (cGAS) and STING. Furthermore, the authors demonstrated that DENV NS2B protein is responsible for targeting the DNA sensor cGAS and guiding it to the lysosome for degradation so that the intracellularly released mtDNA will not be recognized 22. The critical role of cGAS in DENV‐induced IFN production is further supported by the current study showing that the reduction in IFN‐λ1 due to cGAS knockdown was as significant as the depletion of mtDNA by itself, which indicates that a significant portion of the IFN signaling is mediated by cGAS (Fig EV3). Notably, there are other different ways for DENV proteins to interact with mitochondria in infected cells to mediate a variety of reactions to attenuate the anti‐viral immune response. Through association with the N‐terminal CARD‐like domain and the C‐terminal transmembrane domain of mitochondrial anti‐viral signaling protein (MAVS), DENV NS4A protein prevents MAVS binding to retinoic acid‐inducible gene I, and suppresses the downstream activation of IRF3 and NF‐κB as well as IFN production 36. The DENV NS2B3 protease complex can cleave two mitochondria‐associated fusion proteins, mitofusins 1 and 2, which are two important molecules in mediating the interaction between mitochondria and the ER membrane, and jeopardize anti‐viral response and cell survival 37. Furthermore, DENV NS4B protein can induce mitochondria elongation that physically interacts with convoluted membranes in the ER–mitochondria interface, promotes viral replication, and inhibits IFN responses 35. These mechanisms mediated by different DENV non‐structural proteins are proposed to affect the mitochondrion–ER interaction to avoid the accumulation of DENV proteins in that organelle and to minimize mtDNA leakage into the cytoplasm 38.
In conclusion, in this study, we report an important concept, specifically, that an RNA virus such as DENV can active TLR9 signaling by inducing mtDNA release into the cytosol. Several proinflammatory processes, such as mitochondrial ROS production, inflammasome activation, and oxidized mtDNA generation, all potentially trigger immune responses against virus infection. The present study also provides a direct comparison of how cGAS and TLR9 work in DENV infection, one inducing innate immune response and the other impacting the mtDNA regulation during infection (Fig EV4). Recently, a phase II study with the mitochondria‐targeted antioxidant mitoquinone has demonstrated benefits in patients with hepatitis C virus infection 39. Given that currently no promising medications have been developed for treatment of DENV infection 40 and both DENV and hepatitis C virus share some similarities, it is possible that this drug or related mitochondria‐targeting medications may have a role in treatment of DENV infection. This study together with the other relevant recently published report 22 should encourage further studies exploring the roles of mitochondria in DENV infection.
Materials and Methods
Culture medium and reagents
The culture medium consisted of RPMI 1640, F12, and DMEM (Gibco‐BRL, Life Technologies Corporation, Carlsbad, CA, USA) supplemented with 10% fetal bovine serum (FBS, HyClone, Thermo Fisher Scientific Inc, Waltham, MA, USA). Recombinant granulocyte–macrophage colony‐stimulating factor (GM‐CSF) and IL‐4 were purchased from R&D (Minneapolis, MN, USA). MitoSOX™ Red, MitoTracker Deep Red, MitoTracker Green, and DiOC6 were purchased from Invitrogen (Carlsbad, CA, USA). Caspase 1 inhibitor and the inflammasome inhibitor MCC950 were obtained from Calbiochem (Merck KGaA, Darmstadt, Germany) and Cayman Chemical Company (Michigan, USA), respectively. ODN‐151 (TLR9 inhibitor), CYT387 (a JAK1/JAK2/TBK‐1 inhibitor), and CpG (TLR9 agonist) were from Invitrogen (San Diego, CA, USA). Cyclosporin A (CsA), ddC, CCCP, Rotenone, MitoTEMPO, chloroquine (CQ), and PKA inhibitor H89 were all purchased from Sigma‐Aldrich (St. Louis, MO, USA). Anti‐NS1 (GTX103346), anti‐NS2B (GTX124246), anti‐TLR9 (GTX59899), anti‐DNA (GTX629477), and anti‐β‐actin (GTX109638) antibodies were from GeneTex, Inc. (Irvine, CA, USA); anti‐phosphorylated p38 (#9211), anti‐phosphorylated p65 (#3031), anti‐phosphorylated interferon regulatory factor (IRF)7 (#5184), and anti‐PKA‐phosphorylated peptides antibodies (#9621) were from Cell Signaling Technology (Beverly, MA, USA); antibodies recognizing caspase‐1 (sc‐622), TLR9 (sc‐47723) (for immunoprecipitation), total p38 (sc‐535), total p65 (sc‐109), and total IRF7 (sc‐9083) were from Santa Cruz Biotechnology (Santa Cruz, CA, USA); anti‐transcription factor A, mitochondria (TFAM) (ab119684), anti‐TLR9 (ab53396) (for immunostaining), anti‐LAMP‐1 (ab24170), and anti‐TOMM20 (ab186734) antibodies were from Abcam (Cambridge, United Kingdom); anti‐8O‐HdG antibody (SMC‐155) was from StressMarq Biosciences (Victoria, Canada). The monoclonal antibody (mAb) to viral E protein was prepared from the supernatant of hybridoma cells (HB46; ATCC, Manassas, VA). Alexa Fluor 488‐conjugated goat anti‐mouse antibody and Alexa Fluor 594‐conjugated goat anti‐rabbit antibodies were from Invitrogen. NIM811 was kindly provided by Novartis (Taiwan division, Taipei, Taiwan). Unless otherwise specified, all other chemicals and reagents were purchased from Santa Cruz Biotechnology or Sigma‐Aldrich Chemical Company.
Preparation of human DCs, the human lung epithelial cell line A549, and HEK‐293T cell line
DCs were prepared from purified CD14+ monocytes as previously described 29. In brief, buffy coats were purchased from a blood bank (Taipei, Taiwan) with approval from the Institutional Review Board and mixed with Ficoll‐Hypaque. After centrifugation, the layer of peripheral blood mononuclear cells was collected, and the cells were incubated with anti‐CD14 microbeads (Miltenyi Biotec, Bergisch Gladbach, Germany) at 4–8°C for 15 min. After washing, CD14+ cells were isolated using a magnetic‐activated cell sorting cell isolation column (Miltenyi Biotec). The purified monocytes were cultured in RPMI 1640 medium containing 10% FBS, 800 U/ml GM‐CSF, and 500 U/ml IL‐4 at a cell density of 1 × 10⁶ cells/ml. The culture medium was replaced every other day with fresh medium containing GM‐CSF and IL‐4, and cells with a purity greater than 95% after 5–7 days of culture were used in the experiments 29. Human lung epithelial cell line (A549 cells) (Bioresource Collection and Research Center, Taiwan) and HEK‐293T cells (RNAi core, Academia Sinica) were maintained in F12 medium and DMEM, respectively, supplied with 10% FBS in a humidified atmosphere containing 5% CO2 at 37°C. HEK‐293T cells that stably expressed TLR9 were established by transfecting 293T cells with expression plasmid encoding the human TLR9 gene ORF cDNA clone (Sino Biological Inc., Beijing, China) using X‐tremeGENE HP DNA transfection reagent (Roche, Basel, Switzerland). After hygromycin selection and verification via RT–qPCR, HEK‐293T cells stably expressing TLR9, named 293T/TLR9 cells, were obtained.
DENV preparation and infection
Preparation of DENV has been previously described 29. DENV2 strains New Guinea C, 16,681 and wild‐type local Taiwanese strain PL046, and DENV1, DENV3, and DENV4 serotypes, kindly provided by Dr. YL Lin (Academia Sinica, Taipei, Taiwan), were propagated in C6/36 mosquito cells in RPMI containing 5% heat‐inactivated FBS and maintained at 28°C for 7 days. Preparation of mock‐conditioned medium was performed using the same procedures, except buffered saline was substituted for virus inoculation. Heat‐ and UV‐inactivated viruses were prepared by treatment at 56°C for 1 h and UV‐induced crosslinking, respectively. Unless otherwise specified, DCs (1 × 10⁶/ml in culture medium) were infected with mock or DENV at an MOI of 5 for 2 h at 37°C. The determination of virus titer was achieved according to methods described in our previous report 29.
LDH release assay
The supernatants were harvested to determine the amount of cytosolic lactate dehydrogenase (LDH) by using the Cytotoxicity Detection Kit (Roche) according to the manufacturer's instructions. Cells treated with Triton X‐100 were used as a positive control maximum LDH release. The percentages of cytotoxicity after DENV infection or drugs treatment were measured and presented as (experimental release‐culture medium background)/(Triton X‐100 release‐culture medium background) × 100.
Cell viability assay (CCK‐8 assay)
The Cell Counting Kit‐8 (CCK‐8) (Dojindo Laboratories, Kumamoto, Japan) was used to measure cell viability according to the manufacturer's instructions. DCs were infected with mock or DENV in 96‐well plates for 24 h (uninfected DCs as the control). Three wells were prepared for each condition. After infection, 10 μl CCK‐8 solution was added to each well, and after additional incubation at 37°C for 1 h, the OD values for each well were read using the wavelength 450 nm to measure cell viability on a microplate reader. The cell viability was calculated as follows: cell viability (%) = OD (experiment) – OD (blank)/OD (control) – OD (blank) × 100.
Extraction of total and cytosolic DNA
The total and cytosolic DNA extraction method was performed according to a previous report 41 with some modifications. DCs (4 × 10⁶) were divided into two equal aliquots. One aliquot, for normalization control, was used to extract total DNA using a NucleoSpin Tissue kit (Macherey‐Nagel, Duren, Germany). The other aliquot was resuspended in 400 μl of buffer containing 150 mM NaCl, 50 mM HEPES pH 7.4, and 25 mg/ml digitonin (EMD Chemicals, Gibbstown, NJ, USA). The samples were rotated end‐over‐end for 15–20 min at 4°C and then centrifuged at 980 × g for 3 min three times to remove cellular debris. The supernatants were collected and transferred to fresh tubes and spun at 17,000 × g for 10 min to remove any remaining cellular residue and to yield cytosolic preparations free of nuclear, mitochondrial, and endoplasmic reticulum contamination. The DNA in the cytosol fraction was then isolated by running the sample through a NucleoSpin Tissue column (Macherey‐Nagel) and subsequently eluted with buffer.
Quantitative RT–qPCR and mtDNA measurement
Total RNA from treated cells was isolated with TRIzol reagent (Invitrogen) as described in our previous report 7. RNA concentrations were measured using a NanoDrop spectrophotometer (ND 1000 V.3.1.0; Thermo Fisher Scientific, Waltham, MA, USA). Reverse transcription was performed in a 20 μl mixture containing 2 μg of total RNA, random hexamers (Invitrogen), a mixture containing 10× reverse transcription buffer, dNTPs, magnesium chloride, dithiothreitol (Invitrogen), and Moloney murine leukemia virus reverse transcriptase (MMLV RTase, Invitrogen). The cDNA was prepared for further measurement using qPCR. Briefly, 20 ng of cDNA was amplified in a total mixture volume of 20 μl consisting of 1× KAPA SYBR FAST qPCR Master Mix (KAPA Biosystems, Boston, MA, USA) and the appropriate gene‐specific primers, which were added at a final concentration of 200 nM. The primers used are shown in Appendix Table S1. The reactions were performed over 40 cycles comprising steps at 95°C for denaturing and 60°C for annealing and extension on a LightCycler 480 (Roche). The changes in gene expression induced by DENV infection in the presence or absence of inhibitors or siRNA were calculated with the following formula: fold change = 2−Δ (ΔCt), where ΔCt = Ct of target gene − Ct of GAPDH, and Δ(ΔCt) = ΔCt infected − ΔCt control. For measuring the levels of mtDNA, 20 ng of isolated DNA was subjected to qPCR with KAPA SYBR FAST qPCR Master Mix (KAPA Biosystems) with 200 nM mtDNA primers or nuclear DNA (nDNA) primers. Three mtDNA primer pairs were used to quantify mtDNA. The levels of mtDNA in total cell lysate were calculated as mtDNA normalized to nDNA. To quantify mtDNA in the cytosol fraction, 20 ng of a purified plasmid encoding FLAG gene (PCR3.1‐flag) was added to the eluted solution according to the description by Aguirre et al 22 except that FLAG gene was chosen instead of EGFP gene. The specific primers for both endogenous mtDNA and FLAG plasmid were used to measure the relative content of cytosolic mtDNA normalized to FLAG (the primers for PCR were given in Appendix Table S1). The relative mtDNA abundance indicates the relative mtDNA content in DENV‐infected cells normalized to mock‐infected cells. In addition, the relative content of mtDNA in cytosol versus total was also calculated.
Flow cytometry
For intracellular staining of TLR9, 8‐OHdG, and DENV E protein, the collected cells were washed twice with cold PBS before being fixed in 0.5% paraformaldehyde. The fixed cells were permeabilized via resuspension in 0.5% saponin in PBS. After 30 min on ice, antibodies recognizing specific intracellular proteins were added to the permeabilization buffer and incubated for another 1 h with occasional mixing. Following a wash, the species‐specific secondary antibodies were added and incubated for another 1 h. After two washes with cold PBS, the cells were collected for flow cytometry analysis (Becton Dickinson, NJ, USA).
Measurement of mitochondrial membrane potential with JC‐1 probe
The fluorescent probe, JC‐1, purchased from Life Technologies was used to study mitochondrial membrane potential according to the manufacturer's instructions and the published report 42. In brief, human DCs or A549 cells (2.5 × 10⁵ cells per each condition) were incubated with JC‐1 staining solution (10 μg/ml) for 30 min at 37°C. After washes with PBS, the fluorescence intensity of JC‐1 was measured by a flow cytometer (Becton Dickinson) and the results were analyzed with a FlowJo software (Becton Dickinson).
Western blotting
Enhanced chemiluminescence Western blotting (Amersham, GE Healthcare Life Science, Uppsala, Sweden) was performed as previously described 7. Briefly, equal amounts of proteins were separated on a 10% SDS–PAGE gel and transferred to a nitrocellulose membrane. For immunoblotting, the nitrocellulose membrane was incubated with TBS‐T containing 5% nonfat milk for 1 h and then blotted with antibodies against individual proteins overnight. After being washed with TBS‐T, the filter was incubated with secondary antibodies conjugated to horseradish peroxidase for 1 h. The filter was then incubated with the substrate and exposed to X‐ray film. After scanning, the intensity of bands on the Western blots was compared using ImageJ software.
Measurement of mitochondria ROS and depolarization
For ROS measurement, DCs were incubated with 5 μM MitoSOX™ Red (Invitrogen) in culture medium at 37°C for 30 min. After being washed with PBS, the cells were then analyzed using flow cytometry. Mitochondrial depolarization was probed by incubating DCs with 25 nM MitoTracker Deep Red at 37°C for 30 min. DCs were then washed with PBS and fixed in 0.5% paraformaldehyde before flow cytometry analysis.
Preparation of mtDNA for cell stimulation
A mtDNA isolation kit from Abcam (Cambridge, UK) was used to extract mtDNA from A549 or HepG2 cells. In brief, 5 × 10⁷ cells were resuspended in 1 ml of cold cytosol extraction buffer and incubated on ice for 10 min. The cells were then gently homogenized with an ice‐cold Dounce tissue grinder for approximately 100–200 passes. The homogenization efficiency was evaluated with microscopy. After grinding, the homogenized suspension was transferred to an Eppendorf tube and centrifuged at 700 × g for 10 min at 4°C. Subsequently, the supernatant was collected and transferred to a fresh 1.5‐ml tube and centrifuged at 10,000 × g for 30 min at 4°C to pellet the mitochondria particles. After lysis with 1× mitochondria lysis buffer on ice for 10 min and incubation with 5 μl of enzyme mix in a 50°C water bath for another 60 min, the extracted mtDNA was then precipitated with absolute ethanol, washed with 70% ethanol, and dissolved in water. The mtDNA concentration was quantified by measuring the OD 260/280, and mtDNA quality was evaluated with qPCR. In parallel, the pellet after homogenization and centrifugation at 700 × g was used to isolate nDNA using a QIAmp DNA Mini Kit according to the instructions (Qiagen, Hilden, Germany).
siRNA and mtDNA transfection
DCs were collected and resuspended at 1 × 10⁷/ml in Modified Eagle's Minimum Essential Medium (opti‐MEM, Invitrogen) containing 300 nM siRNA (Stealth RNAi™ siRNA, Invitrogen) or 1 μg/100 μl DNA. Cells were transferred to a BTX cuvette (Harvard Apparatus, Inc., Holliston, MA, USA) and electroporated with one pulse at 300 V for 3 ms. Cells were rested in complete medium for 16–24 h and then used for subsequently designated experiments. The siRNA duplex sequences used are shown in Appendix Table S1.
Determination of cytokines and 8‐OHdG via ELISA
Standard ELISA methods were used to measure concentration of cytokines such as IFN‐λ (R&D systems) and IFN‐α (PBL Assay Science, Piscataway, NJ, USA). For 8‐OHdG detection 25, 500 ng of DNA was added to poly‐L‐lysine‐coated (0.01%) 96‐well EIA/RIA plates (Costar, Washington, DC, USA) and incubated at 4°C overnight. The wells were washed with PBS and blocked with PBS containing 1% BSA for 2 h at room temperature. A biotinylated mouse anti‐human 8‐OHdG antibody that recognizes oxidized nucleotides was added at 0.5 μg/ml and incubated for 2 h at room temperature. After being washed with PBS, the samples were incubated with horseradish peroxidase‐conjugated streptavidin (Invitrogen) for 20 min, and after the substrate was added, the absorbance was read at 450 nm with an ELISA reader.
Immunoprecipitation of oxidized DNA
The method for immunoprecipitation of oxidized DNA was adapted from a previous report 25. Equal volumes of cytosolic extract in a buffer containing 50 mM NaCl, 50 mM HEPES pH 7.4, and 25 mg/ml digitonin were cleared by incubation with protein A/G PLUS‐Agarose beads (Santa Cruz). After adding 0.3 U/ml micrococcal nuclease (Thermo Fisher Scientific Inc, Waltham, MA, USA) and allowing it to react for 30 min at 37°C, 5 μg/ml anti‐8‐OHdG antibody‐conjugated protein A/G beads were added and incubated with mild rotation at 4°C overnight. After centrifugation, non‐8‐OHdG DNA in the supernatant was collected by running the sample through a Nucleospin column. Meanwhile, the pelleted beads were washed with PBS and incubated with 0.5 μg/ml proteinase K for 30 min at 56°C. The 8‐OHdG+ DNA that bound to the antibody‐bead complexes was eluted from the beads with buffer provided and boiled at 100°C for 5 min. The mtDNA in the eluted buffer was analyzed with qPCR. The levels of 8‐OHdG in samples before and after immunoprecipitation were verified by ELISA.
Co‐immunoprecipitation of protein–mtDNA complex and analysis
Co‐immunoprecipitation followed by qPCR analysis was adapted from a previous report 26. DCs were resuspended in a polysome lysis buffer containing 10 mM HEPES pH 7.0, 100 mM KCl, 5 mM MgCl2, 25 mM EDTA, 0.5% NP‐40, 2 mM dithiothreitol and complete protease inhibitors. After one freeze–thaw, the samples were centrifuged at 13,000 × g and 4°C for 20 min. Cell lysates were collected, and the targeted protein was pulled down using antibody‐conjugated A/G beads and incubated at 4°C overnight with mild rotation. The beads were then washed five times with a buffer containing 10 mM Tris–HCl and 20 mM NaCl, and the associated complexes/proteins were released from the beads by incubation at 100°C for 5 min with buffer, as described in the previous section, except proteinase K was not added to the fraction for Western blotting of the immunoprecipitated protein. Equal amounts of samples were loaded for Western blot of pull‐down TLR9. To detect the specific DNA fragment in the released solution associated with TLR9 in the released solution, 20 ng of a purified plasmid encoding FLAG gene (PCR3.1‐flag) was added. The relative mtDNA abundance associated with TLR9 was quantified by qPCR of mtDNA with the FLAG gene as a control.
Assessment of mtDNA and mitochondrial particles released in the extracellular milieu
The presence of mtDNA in culture supernatant was assessed with a QIAmp DNA Mini and Blood Mini kit from Qiagen (Qiagen, Hilden, Germany). In brief, the culture medium was first centrifuged at 700 × g to eliminate cells and cell debris. Then, 400 μl of the cell‐free supernatant was transferred to Eppendorf tubes. After adding proteinase K, the samples were mixed with 400 μl of the provided buffer. After incubation at 56°C for 10 min, 400 μl of absolute ethanol was added to the mixture, and the samples were vortexed. Subsequently, the entire mixture was run through a QIAamp Mini spin column via centrifugation. After washing the column two times with washing buffer, the DNA in the column was eluted with distilled water and subjected to qPCR analysis. To separately detect free mtDNA and/or mtDNA enclosed in mitochondrial particles in the supernatant, the collected cell‐free samples were further centrifuged at 13,000 × g for 30 min to pellet small vesicles. The pelleted vesicles were resuspended in 200 μl of PBS for QIAmp DNA Mini and Blood Mini kit analysis and qPCR to examine mtDNA in the microparticles. Meanwhile, the pellet‐free supernatants were collected, concentrated with a DNA Clean/Extraction kit (Qiagen), and analyzed for free form mtDNA using qPCR. In addition, the presence of intact mitochondria particles was also examined by resuspending pelleted vesicles in mitochondria respiration buffer containing 210 mM mannitol, 10 mM HEPES, and 1 mM EGTA and staining them with MitoTracker Green followed by flow cytometry analysis.
Immunofluorescence staining and confocal imaging
DCs were collected and washed two times with PBS before being fixed with 4% paraformaldehyde on ice for 20 min. The fixed cells were washed and resuspended homogenously in PBS with 0.05% Triton X‐100 on ice for 5 min to permeabilize the cells. The cells were washed again with PBS and blocked with PBS containing 1% BSA and 1% goat serum for 30 min. Primary antibodies were added and incubated with the cells for 2 h on ice with occasional mixing. After removing unbound antibodies by washing, secondary antibodies conjugated with an Alex Fluor fluorescent dye were added and incubated in the dark for 1 h on ice. Cell nuclei were counterstained with 1 mg/ml DAPI (4′,6‐diamidino‐2‐phenylindole; Sigma) at 1:5,000 dilution. Finally, 2 × 10³ cells were seeded on slides, air‐dried in the dark, and mounted with mounting reagent (FluorSave™ Reagent, EMD Millipore Calbiochem, San Diego, CA, USA) for subsequent confocal microscopy analysis. Samples were examined with a Leica TCS SP5 confocal laser‐scanning microscope (Leica Microsystems, Wetzlar, Germany) equipped with HCX PL APO 3×/1.4‐0.6 oil objective (Leica). Image processing and colocalization analysis were performed with Leica LAS AF software. For detecting the colocalization between TLR9 and DNA, the primary antibodies used included anti‐TLR9 (goat, ab53396), anti‐DNA (mouse IgM, GTX1384), and anti‐NS2B (rabbit, GTX124246) antibodies. For the secondary antibodies, they included Fluor 488 Donkey anti‐rabbit (Thermo A21206), Fluor 594 Donkey anti‐goat (Thermo A‐11058), Fluor 647 Donkey anti‐mouse IgM (Jackson 715‐605‐140), and Normal Donkey serum (Jackson).
Transmission electron microscopy (TEM)
For TEM analysis, the mock‐ and DENV‐infected dendritic cells were harvested and washed with PBS for three times. Cells were fixed with fixative (2.5% glutaraldehyde and 4% paraformaldehyde in 0.1 M sodium cacodylate buffer, pH 7.2) for overnight at 4°C and then incubated with post‐fixation solution (1% osmium tetroxide in sterilized water) for 1 h at room temperature. After extensive washing by sterilized water, cells were dehydrated in a graded series of ethanol and embedded in Epon812 resin (EMS, Hatfield, PA). The ultrathin (70‐nm) cell sections were cut on the EM UC7 Ultramicrotome (Leica Microsystems, Germany) and subsequently stained with saturated uranyl acetate and Reynolds lead citrate solutions. The electron micrograph was examined in an 100 kV JEM‐1230 (JEOL, Peabody, MA) transmission electron microscope.
Mice and preparation of bone marrow‐derived dendritic cells (BMDCs)
The wild‐type female C57BL/6 mice (6–12 weeks) were purchased from the National Laboratory Animal Breeding and Research Center (Taipei, Taiwan). TLR9 KO mice were obtained from Dr. Tsung‐Hsien Chuang (National Health Research Institutes, Taiwan) with permission from Dr. Shizuo Akira (Osaka University, Japan). All of the animals were housed and maintained at the Animal Center of the National Health Research Institutes. All of the animal studies were conducted in accordance with the protocol approved by the Institutional Animal Care and Use Committee of the NHRI (approval number: NHRI‐IACUC‐105137‐A‐S01). The preparation of BMDCs was performed according to our previous report 43. In brief, we first isolated bone marrow cells from the mice and cultured them at a density of 2 × 10⁵ cells/ml in Petri dishes containing 10 ml of complete RPMI‐1640 medium with 200 U/ml (20 ng/ml) recombinant mouse granulocyte–macrophage colony‐stimulating factor (GM‐CSF; PeproTech Inc., New Jersey, USA). On day 3, another 10 ml of complete RPMI medium containing 20 ng/ml GM‐CSF was added. On day 6, cells from each dish were collected, washed, and counted and used for DENV study as described in human DCs.
Statistical analysis
All determinants were performed in triplicate, and data from pooled donors are expressed as the means ± SEM. Statistical comparisons were performed using Student's t‐test or one‐way analysis of variance (ANOVA). When ANOVA showed significant differences between groups, Bonferroni's post hoc test was used to determine the specific pairs of groups that significantly differed. A P‐value of < 0.05 was considered to indicate statistical significance. Asterisks indicate values that are significantly different from the relevant control (*P < 0.05, **P < 0.01, ***P < 0.001, and ****P < 0.0001).
Author contributions
J‐HL and L‐JH participated in the study design. M‐YW, C‐YH, C‐HW, L‐FH, C‐YY, S‐JL, and P‐YK performed the experiments and analyzed the data. S‐FL provided helpful discussion and comment on study results and part of the grant support. L‐JH and J‐HL wrote the report. All authors read and approved the manuscript.
Conflict of interest
The authors declare that they have no conflict of interest.
Supporting information
Appendix
Expanded View Figures PDF
Source Data for Expanded View
Review Process File
Source Data for Figure 1
Source Data for Figure 2
Source Data for Figure 3
Source Data for Figure 4
Source Data for Figure 5
Source Data for Figure 6
Source Data for Figure 7
Source Data for Figure 8
Acknowledgements
This work is supported by grants from Chang Gung Memorial Hospital (CMRPG3E2161, CMRPG3F0571, and CMRPG3B1912), Tao‐Yuan, Taiwan. We thank the gift of NIM811 from Novartis, DENV strains from Dr. Yi‐Ling Lin, and TLR9‐knockout mice from Dr. Tsung‐Hsien Chuang and Dr. Shizuo Akira.
EMBO Reports (2018) 19: e46182
Contributor Information
Jenn‐Haung Lai, Email: laiandho@gmail.com.
Ling‐Jun Ho, Email: lingjunho@nhri.org.tw.
References
- 1. Castro MC, Wilson ME, Bloom DE (2017) Disease and economic burdens of dengue. Lancet Infect Dis 17: e70–e78 [DOI] [PubMed] [Google Scholar]
- 2. Paessler S, Walker DH (2013) Pathogenesis of the viral hemorrhagic fevers. Annu Rev Pathol 8: 411–440 [DOI] [PubMed] [Google Scholar]
- 3. Sadler AJ, Williams BR (2008) Interferon‐inducible antiviral effectors. Nat Rev Immunol 8: 559–568 [DOI] [PMC free article] [PubMed] [Google Scholar]
- 4. MacMicking JD (2012) Interferon‐inducible effector mechanisms in cell‐autonomous immunity. Nat Rev Immunol 12: 367–382 [DOI] [PMC free article] [PubMed] [Google Scholar]
- 5. Ho LJ, Wang JJ, Shaio MF, Kao CL, Chang DM, Han SW, Lai JH (2001) Infection of human dendritic cells by dengue virus causes cell maturation and cytokine production. J Immunol 166: 1499–1506 [DOI] [PubMed] [Google Scholar]
- 6. Navarro‐Sanchez E, Altmeyer R, Amara A, Schwartz O, Fieschi F, Virelizier JL, Arenzana‐Seisdedos F, Despres P (2003) Dendritic‐cell‐specific ICAM3‐grabbing non‐integrin is essential for the productive infection of human dendritic cells by mosquito‐cell‐derived dengue viruses. EMBO Rep 4: 723–728 [DOI] [PMC free article] [PubMed] [Google Scholar]
- 7. Hsu YL, Wang MY, Ho LJ, Lai JH (2016) Dengue virus infection induces interferon‐lambda1 to facilitate cell migration. Sci Rep 6: 24530 [DOI] [PMC free article] [PubMed] [Google Scholar]
- 8. Janeway CA Jr, Medzhitov R (2002) Innate immune recognition. Annu Rev Immunol 20: 197–216 [DOI] [PubMed] [Google Scholar]
- 9. Akira S, Uematsu S, Takeuchi O (2006) Pathogen recognition and innate immunity. Cell 124: 783–801 [DOI] [PubMed] [Google Scholar]
- 10. Heil F, Hemmi H, Hochrein H, Ampenberger F, Kirschning C, Akira S, Lipford G, Wagner H, Bauer S (2004) Species‐specific recognition of single‐stranded RNA via toll‐like receptor 7 and 8. Science 303: 1526–1529 [DOI] [PubMed] [Google Scholar]
- 11. Hemmi H, Takeuchi O, Kawai T, Kaisho T, Sato S, Sanjo H, Matsumoto M, Hoshino K, Wagner H, Takeda K et al (2000) A toll‐like receptor recognizes bacterial DNA. Nature 408: 740–745 [DOI] [PubMed] [Google Scholar]
- 12. Boule MW, Broughton C, Mackay F, Akira S, Marshak‐Rothstein A, Rifkin IR (2004) Toll‐like receptor 9‐dependent and ‐independent dendritic cell activation by chromatin‐immunoglobulin G complexes. J Exp Med 199: 1631–1640 [DOI] [PMC free article] [PubMed] [Google Scholar]
- 13. Sasai M, Linehan MM, Iwasaki A (2010) Bifurcation of Toll‐like receptor 9 signaling by adaptor protein 3. Science 329: 1530–1534 [DOI] [PMC free article] [PubMed] [Google Scholar]
- 14. Cardon LR, Burge C, Clayton DA, Karlin S (1994) Pervasive CpG suppression in animal mitochondrial genomes. Proc Natl Acad Sci USA 91: 3799–3803 [DOI] [PMC free article] [PubMed] [Google Scholar]
- 15. Zhang Q, Raoof M, Chen Y, Sumi Y, Sursal T, Junger W, Brohi K, Itagaki K, Hauser CJ (2010) Circulating mitochondrial DAMPs cause inflammatory responses to injury. Nature 464: 104–107 [DOI] [PMC free article] [PubMed] [Google Scholar]
- 16. West AP, Shadel GS (2017) Mitochondrial DNA in innate immune responses and inflammatory pathology. Nat Rev Immunol 17: 363–375 [DOI] [PMC free article] [PubMed] [Google Scholar]
- 17. Garcia‐Martinez I, Santoro N, Chen Y, Hoque R, Ouyang X, Caprio S, Shlomchik MJ, Coffman RL, Candia A, Mehal WZ (2016) Hepatocyte mitochondrial DNA drives nonalcoholic steatohepatitis by activation of TLR9. J Clin Invest 126: 859–864 [DOI] [PMC free article] [PubMed] [Google Scholar]
- 18. Formentini L, Santacatterina F, Nunez de Arenas C, Stamatakis K, Lopez‐Martinez D, Logan A, Fresno M, Smits R, Murphy MP, Cuezva JM (2017) Mitochondrial ROS production protects the intestine from inflammation through functional M2 macrophage polarization. Cell Rep 19: 1202–1213 [DOI] [PubMed] [Google Scholar]
- 19. Coll RC, Robertson AA, Chae JJ, Higgins SC, Munoz‐Planillo R, Inserra MC, Vetter I, Dungan LS, Monks BG, Stutz A et al (2015) A small‐molecule inhibitor of the NLRP3 inflammasome for the treatment of inflammatory diseases. Nat Med 21: 248–255 [DOI] [PMC free article] [PubMed] [Google Scholar]
- 20. Theruvath TP, Zhong Z, Pediaditakis P, Ramshesh VK, Currin RT, Tikunov A, Holmuhamedov E, Lemasters JJ (2008) Minocycline and N‐methyl‐4‐isoleucine cyclosporin (NIM811) mitigate storage/reperfusion injury after rat liver transplantation through suppression of the mitochondrial permeability transition. Hepatology 47: 236–246 [DOI] [PMC free article] [PubMed] [Google Scholar]
- 21. Yasuda H, Leelahavanichkul A, Tsunoda S, Dear JW, Takahashi Y, Ito S, Hu X, Zhou H, Doi K, Childs R et al (2008) Chloroquine and inhibition of Toll‐like receptor 9 protect from sepsis‐induced acute kidney injury. Am J Physiol Renal Physiol 294: F1050–F1058 [DOI] [PMC free article] [PubMed] [Google Scholar]
- 22. Aguirre S, Luthra P, Sanchez‐Aparicio MT, Maestre AM, Patel J, Lamothe F, Fredericks AC, Tripathi S, Zhu T, Pintado‐Silva J et al (2017) Dengue virus NS2B protein targets cGAS for degradation and prevents mitochondrial DNA sensing during infection. Nat Microbiol 2: 17037 [DOI] [PMC free article] [PubMed] [Google Scholar]
- 23. Bao M, Liu YJ (2013) Regulation of TLR7/9 signaling in plasmacytoid dendritic cells. Protein Cell 4: 40–52 [DOI] [PMC free article] [PubMed] [Google Scholar]
- 24. Torres S, Hernandez JC, Giraldo D, Arboleda M, Rojas M, Smit JM, Urcuqui‐Inchima S (2013) Differential expression of Toll‐like receptors in dendritic cells of patients with dengue during early and late acute phases of the disease. PLoS Negl Trop Dis 7: e2060 [DOI] [PMC free article] [PubMed] [Google Scholar]
- 25. Lood C, Blanco LP, Purmalek MM, Carmona‐Rivera C, De Ravin SS, Smith CK, Malech HL, Ledbetter JA, Elkon KB, Kaplan MJ (2016) Neutrophil extracellular traps enriched in oxidized mitochondrial DNA are interferogenic and contribute to lupus‐like disease. Nat Med 22: 146–153 [DOI] [PMC free article] [PubMed] [Google Scholar]
- 26. Caielli S, Athale S, Domic B, Murat E, Chandra M, Banchereau R, Baisch J, Phelps K, Clayton S, Gong M et al (2016) Oxidized mitochondrial nucleoids released by neutrophils drive type I interferon production in human lupus. J Exp Med 213: 697–713 [DOI] [PMC free article] [PubMed] [Google Scholar]
- 27. Catteau A, Roue G, Yuste VJ, Susin SA, Despres P (2003) Expression of dengue ApoptoM sequence results in disruption of mitochondrial potential and caspase activation. Biochimie 85: 789–793 [DOI] [PubMed] [Google Scholar]
- 28. El‐Bacha T, Midlej V, Pereira da Silva AP, Silva da Costa L, Benchimol M, Galina A, Da Poian AT (2007) Mitochondrial and bioenergetic dysfunction in human hepatic cells infected with dengue 2 virus. Biochem Biophys Acta 1772: 1158–1166 [DOI] [PubMed] [Google Scholar]
- 29. Ho LJ, Hung LF, Weng CY, Wu WL, Chou P, Lin YL, Chang DM, Tai TY, Lai JH (2005) Dengue virus type 2 antagonizes IFN‐alpha but not IFN‐gamma antiviral effect via down‐regulating Tyk2‐STAT signaling in the human dendritic cell. J Immunol 174: 8163–8172 [DOI] [PubMed] [Google Scholar]
- 30. Yoshida H, Nishikawa M, Kiyota T, Toyota H, Takakura Y (2011) Increase in CpG DNA‐induced inflammatory responses by DNA oxidation in macrophages and mice. Free Radic Biol Med 51: 424–431 [DOI] [PubMed] [Google Scholar]
- 31. Nakahira K, Haspel JA, Rathinam VA, Lee SJ, Dolinay T, Lam HC, Englert JA, Rabinovitch M, Cernadas M, Kim HP et al (2011) Autophagy proteins regulate innate immune responses by inhibiting the release of mitochondrial DNA mediated by the NALP3 inflammasome. Nat Immunol 12: 222–230 [DOI] [PMC free article] [PubMed] [Google Scholar]
- 32. White MJ, McArthur K, Metcalf D, Lane RM, Cambier JC, Herold MJ, van Delft MF, Bedoui S, Lessene G, Ritchie ME et al (2014) Apoptotic caspases suppress mtDNA‐induced STING‐mediated type I IFN production. Cell 159: 1549–1562 [DOI] [PMC free article] [PubMed] [Google Scholar]
- 33. Morrison J, Aguirre S, Fernandez‐Sesma A (2012) Innate immunity evasion by dengue virus. Viruses 4: 397–413 [DOI] [PMC free article] [PubMed] [Google Scholar]
- 34. Garcia‐Sastre A (2017) Ten strategies of interferon evasion by viruses. Cell Host Microbe 22: 176–184 [DOI] [PMC free article] [PubMed] [Google Scholar]
- 35. Chatel‐Chaix L, Cortese M, Romero‐Brey I, Bender S, Neufeldt CJ, Fischl W, Scaturro P, Schieber N, Schwab Y, Fischer B et al (2016) Dengue virus perturbs mitochondrial morphodynamics to dampen innate immune responses. Cell Host Microbe 20: 342–356 [DOI] [PMC free article] [PubMed] [Google Scholar]
- 36. He Z, Zhu X, Wen W, Yuan J, Hu Y, Chen J, An S, Dong X, Lin C, Yu J et al (2016) Dengue virus subverts host innate immunity by targeting adaptor protein MAVS. J Virol 90: 7219–7230 [DOI] [PMC free article] [PubMed] [Google Scholar]
- 37. Yu CY, Liang JJ, Li JK, Lee YL, Chang BL, Su CI, Huang WJ, Lai MM, Lin YL (2015) Dengue virus impairs mitochondrial fusion by cleaving mitofusins. PLoS Pathog 11: e1005350 [DOI] [PMC free article] [PubMed] [Google Scholar]
- 38. Aguirre S, Fernandez‐Sesma A (2017) Collateral damage during dengue virus infection: making sense of DNA by cGAS. J Virol 91: e01081‐16 [DOI] [PMC free article] [PubMed] [Google Scholar]
- 39. Gane EJ, Weilert F, Orr DW, Keogh GF, Gibson M, Lockhart MM, Frampton CM, Taylor KM, Smith RA, Murphy MP (2010) The mitochondria‐targeted anti‐oxidant mitoquinone decreases liver damage in a phase II study of hepatitis C patients. Liver Int 30: 1019–1026 [DOI] [PubMed] [Google Scholar]
- 40. Lai JH, Lin YL, Hsieh SL (2017) Pharmacological intervention for dengue virus infection. Biochem Pharmacol 129: 14–25 [DOI] [PubMed] [Google Scholar]
- 41. West AP, Khoury‐Hanold W, Staron M, Tal MC, Pineda CM, Lang SM, Bestwick M, Duguay BA, Raimundo N, MacDuff DA et al (2015) Mitochondrial DNA stress primes the antiviral innate immune response. Nature 520: 553–557 [DOI] [PMC free article] [PubMed] [Google Scholar]
- 42. Ferreira GB, Vanherwegen AS, Eelen G, Gutierrez AC, Van Lommel L, Marchal K, Verlinden L, Verstuyf A, Nogueira T, Georgiadou M et al (2015) Vitamin D3 induces tolerance in human dendritic cells by activation of intracellular metabolic pathways. Cell Rep 10: 711–725 [DOI] [PubMed] [Google Scholar]
- 43. Song YC, Liu SJ (2015) A TLR9 agonist enhances the anti‐tumor immunity of peptide and lipopeptide vaccines via different mechanisms. Sci Rep 5: 12578 [DOI] [PMC free article] [PubMed] [Google Scholar]
Associated Data
This section collects any data citations, data availability statements, or supplementary materials included in this article.
Supplementary Materials
Appendix
Expanded View Figures PDF
Source Data for Expanded View
Review Process File
Source Data for Figure 1
Source Data for Figure 2
Source Data for Figure 3
Source Data for Figure 4
Source Data for Figure 5
Source Data for Figure 6
Source Data for Figure 7
Source Data for Figure 8