

Abstract
Many pressing medical challenges, such as diagnosing disease, enhancing directed stem-cell differentiation, and classifying cancers, have long been hindered by limitations in our ability to quantify proteins in single cells. Mass spectrometry (MS) is poised to transcend these limitations by developing powerful methods to routinely quantify thousands of proteins and proteoforms across many thousands of single cells. We outline specific technological developments and ideas that can increase the sensitivity and throughput of single-cell MS by orders of magnitude and usher in this new age. These advances will transform medicine and ultimately contribute to understanding biological systems on an entirely new level.
Keywords: single-cell mass-spectrometry, single-cell analysis, ultrasensitive proteomics, systems biology, disease diagnosis, sample preparation, Simpson’s paradox, network inference, causal inference, counting noise
INTRODUCTION
Quantifying proteins in single cells has a long history. For decades, scientists and physicians have used antibodies, fluorescent proteins, and MALDI-TOF to identify or quantify a few different proteins per cell.1–6 These methods have enabled new discoveries7 and clinical applications8 and even spawned new fields, such as understanding the role of noise in gene expression.9,10 These impressive achievements were made based on measuring just a few different proteins per cell.
However, many pressing needs in medicine, such as diagnosing disease and enhancing directed stem-cell differentiation, as well as transformative opportunities in biology demand qualifying 100−1000 times more proteins; they demand an entirely different set of approaches and techniques. Such approaches are beginning to coalesce around new ideas and emerging technologies in MS-based proteomics that promise to quantify thousands of proteins and all of their modifications (termed proteoforms) across thousands of single mammalian cells. We begin by outlining the urgent demand and exciting opportunities for these methods because this context can best motivate future methodological developments. Then, we discuss specific technical opportunities that can increase the sensitivity and throughput of single-cell proteomics by orders of magnitude and thus contribute to realizing its tremendous promise.
LIMITATIONS OF POPULATION-AVERAGE MEASUREMENTS
Some model biological systems, such as microbial cultures and mammalian cell cultures, are composed of cells that have identical genomes and grow in a homogeneous environment.
Whereas the same genome and the same environment might be expected to give rise to identical proteomes, they do not; individual cells differ in their proteomes,7 and these proteome differences sometimes have significant functional consequences.9,10 We can detect and study such differences only by quantifying protein levels in individual cells.9 Still, the proteomes of cells from a clonal population growing in a homogeneous culture share many similarities. These similarities can be identified if millions of cells are lysed together and the lysate is analyzed by LC−MS/MS to quantify the average abundance of each protein across all cells. Such analysis, the mainstay of biologically directed quantitative MS, has been very fruitful.11,12 The more similar the cells comprising the sample, the easier the interpretation of the MS data. Conversely, biological systems comprised of very different cells, such as human tissues, cancer, or immune cells infiltrating a tissue, are less tractable by this analysis.8,13 Even if we can perfectly measure the protein levels in a sample composed of different cell types, we cannot easily interpret the measurements. The measured protein levels reflect the population averages across all cell types, and we cannot determine the contributions of different cell types to the very accurate and precise measurement afforded by modern LC−MS/MS applied to bulk samples.
Still, the ability to quantify nearly complete transcriptomes and proteomes from bulk samples has been transformative for biomedical research.11,12,14 It has enabled unbiased screens and unexpected discoveries.15–17 Yet comprehensive proteome measurements have been confined to samples composed of many cells, reflecting only the population-average. Interpreting population-average protein levels is fundamentally confounded when samples consist of heterogeneous cells. The most obvious caveat is that the population-average may not be representative for any cell. For example, proteoforms may have bimodally distributed abundances within the whole heterogeneous cell population. Consider, for example, pancreatic biopsies of two patients containing both α and β cells. Even if the levels of a protein are unimodally distributed within each cell type, biopsies that have slightly biased representations of each cell type will yield different population-average measurements (Figure 1a). This occurs even if those measurements are perfect. Thus a population-average measurement might misleadingly suggest differential protein expression when, in fact, there is no difference whatsoever between the two patients (Figure 1a). Furthermore, population-average measurements could indicate decreased abundance of a protein, whereas, in fact, its abundance in the α cells has increased (Figure 1b).
Figure 1.

Differential cell-type sampling confounds the interpretation of population-average data. (a) Population-average levels of a protein may differ significantly across patients because the sampled tissues contain different fractions of the constituent cell types even when the cell-type-specific levels of the protein are identically distributed. Such differences may arise from biased sampling or from altered proportions of cell types between the two patients. (b) Similarly, increased levels of the protein in α cells may be obscured because of different representation of α and β cells in the analyzed samples.
More generally, trends within groups, within different cell types, for instance, may disappear or even reverse when these groups are combined, as with population-average measurements. This phenomenon is known as Simpson’s paradox.18 We recently demonstrated19 the confounding effects of Simpson’s paradox in using mRNA levels as surrogates for protein levels with bulk data (Figure 2a). Similarly, Simpson’s paradox can confound the interpretation of population-average protein levels, as illustrated in Figure 2b. If we only consider the average levels of the ith and the jth proteins across cell types, the proteins seem positively correlated (Figure 2b). However, paradoxically, within each cell type the abundances of the ith and the jth proteins can have an inverse relationship (Figure 2b). Perfect measurements of cell types sorted based on a few markers cannot resolve such phenomena; the true relationship can be observed only by measuring proteins in single cells.
Figure 2.

Simpson’s paradox confounds the interpretation of population-average protein and mRNA measurements. (a) For a particular gene, its protein levels across tissues can be poorly predicted by its mRNA levels, whereas the average protein levels can be well predicted by scaled mRNA levels.19 Thus mRNAs levels are unreliable surrogates for relative protein levels, and we need direct measurements of proteins. (b) Related manifestation of Simpson’s paradox indicates that the average levels of the ith and the jth proteins may appear positively correlated, even though they are inversely correlated within a cell type. Averaging across cells, even cell types sorted based on markers, will obscure the relationship between the ith and the jth proteins.
For the reasons illustrated in the examples above, measuring protein levels in tissues, both for establishing healthy baselines and for diagnosing disease, is best done by measuring protein abundance in single cells. The most immediate clinical applications of single-cell proteomics are the discovery of biomarkers and their diagnostic use. In the longer term, single-cell proteomics can open new frontiers in unbiased modeling, understanding, and rational control of biological systems, as we discuss below.
SINGLE-CELL PROTEOMICS OPENS EXCITING FRONTIERS
Single-cell proteomics will allow us to perform causal protein inference and create unbiased models of direct and indirect protein interactions. These exciting prospects require estimating joint and conditional probability distributions of proteins across single cells, which, in turn, require many observations of individual proteins quantified across thousands of individual single cells. Such estimates have been obtained for only a few proteins, relying on antibodies or fluorescent proteins. Reliably estimated joint distributions of proteoforms will enable modeling protein−protein dependencies with the empirical probabilities, without assuming a sigmoidal, linear, or any specific relationship. Such models can infer the dependence and its causality between any two measured proteoforms while controlling, without assumptions, for the influence of all other measured proteoforms. Yet these models can control only for the measured proteins. Thus the full power of such analysis, which can lead to causal inference, requires measuring all relevant proteoforms. We believe that high-throughput single-cell proteomics can estimate the joint distributions among the relevant proteoforms and, in the process, catalyze a transition from the population-average measurements to casual inference, elucidating direct and indirect protein interactions and signaling mechanisms. Similarly, the joint distributions enable us to estimate the mutual information (MI) between proteins. The MI inequality states that the mutual information between a variable X, for example, a kinase, and its causal variable, for example, an upstream kinase, is always larger than the mutual information between X and another correlated but not causal variable. This allows us to determine which protein kinases are upstream and downstream in a signaling cascade or another similar biological sequence of causal events. Such progress will produce models that can predict and design the outcomes of new treatments, for example, rationally engineer-directed differentiation of stem cells into cell types of interest. Realizing these promises requires increasing both the sensitivity and the throughput of single-cell proteomics. We believe that both factors can be increased by orders of magnitude based on the suggestions outlined below.
TRANSFORMATIVE OPPORTUNITIES FOR REALIZING SINGLE-CELL PROTEOMICS
In the foreseeable future, two types of technologies are likely to increase the number of proteins quantified per single cell: (i) antibody-based methods and (ii) MS-based methods. Antibody-based methods have a long track record of success. For many years, the binding of antibodies to a few cellular proteins has been assayed by measuring fluorophores, transition metals, and more recently DNA sequences conjugated to the antibodies. Such methods have measured up to a few dozen proteins per cell. Efforts are underway to increase this number while overcoming molecular crowding limitations and ensuring cellular permeability, antibody availability, binding specificity, and epitope availability. In contrast with antibody-based methods, MS-based methods for quantifying proteins in single cells are in their infancy, yet initial attempts have already quantified hundreds of proteins per cell and thousands of proteins over many single cells.20 Below we focus on MS-based methods, as we believe they have the potential to afford unparalleled specificity, measurement accuracy, depth of proteome coverage, and flexibility in experimental design.
So far, most single-cell MS studies have used either (i) MALDI-TOF,2 whose quantitative accuracy is undermined by variable and incomplete ionization, or (ii) quantitative electrospray ionization (ESI) methods. The first glimmers of the potential for ESI−MS to profile the proteomes of single cells began in the 1990s, with the targeted detection of a few highly abundant proteins at or near single-cell equivalent levels.21–23 More recently, ESI−MS has been used in conjunction with other significant innovations to detect many more proteins in single human oocytes24 or small samples from single embryonic frog cells (blastomeres).25,26 Even with mammalian cells having diameter ∼15 μm, ESI−MS has made progress in quantifying increasing number of proteins in relatively small number of cells, reaching thousands of proteins in cell lysates corresponding to hundreds of cells27 or even fewer cells.28 Recently, we reported a method that allows quantifying over a thousand proteins across many single mouse stem cells.20 We believe that the field is ready to take off from this launching point and increase the number of accurately quantified proteins and the number of single cells assayed by orders of magnitude.
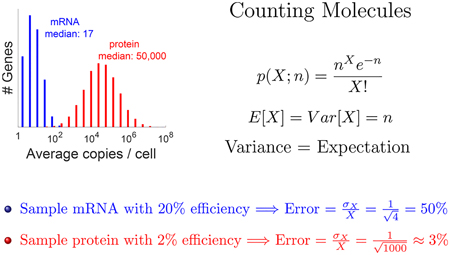
The relatively high copy number of proteins per cell29 can support both deep proteome quantification and low sampling error compared with single-cell RNA-seq. So far, RNA-seq has quantified the most molecules per cell, but the accuracy of these measurements has been limited by counting noise: Because only a subset of the RNA molecules are sampled (counted), their estimated abundances contain missing values and counting error due to sampling.30 If we count n molecules out of a larger pool, then the Poisson distribution estimates the standard deviation of the sampling as √n, and thus the relative error, estimated as standard deviation over mean, is √n/n = 1/√n. Therefore, if we sample 20% of the mRNA molecules from a relatively abundant gene and obtain four sequences per cell, then we can expect about 1/√4 = 50% relative error from the sampling alone. Because cells contain over 1000 protein molecules per mRNA molecule,29 the counting error of protein sampling can be smaller: For the median protein, having 50 000 molecules per cell, sampling even 1% of the molecules will result in about 1/√500 ≈ 5% sampling error. These numbers promise deep and accurate quantification of single-cell proteomics if we can accomplish the opportunities discussed below. The challenges are technical, posing no conceptual limitations, and we believe they are tractable with current and emerging ideas and technologies. Many of these challenges and opportunities are similar for bottom-up methods (measuring peptides after protease digestion) and for top-down methods (measuring undigested proteins), and we discuss them together, although top-down proteomics faces lower sensitivity, harder multiplexing, and more challenging protein identification.
SAMPLE PREPARATION
Cell extraction and separation for single-cell proteomics can be similar to cell extraction for other analytical methods, that is, single-cell RNA-seq, and such methods have been extensively reviewed.31 After extraction and separation, sample preparation for single-cell proteomics should ideally result in complete cell lysis and digestion, incur minimal loss of protein, and allow high-throughput automation for the analysis of thousands, even millions, of single cells. Because many chemicals used for cell lysis are incompatible with MS, such chemicals have to be removed in a cleanup procedure. Advanced cleanup methods aim to minimize protein losses32,33 and perform well with microgram samples,34 but their performance with picogram samples (as is the proteome of typical mammalian cell) remains untested. Cell lysis methods that use only MS-compatible reagents, for example, sonication in water,20,27 can obviate cleanup and thus help reduce losses.
Standard MS preparation methods for bulk samples use 10− 100 μL volumes; reducing these volumes to a few nanoliters or less will afford a substantial reduction in protein loss and reagents used (Figure 3a). This protein loss is primarily due to surface adsorption, which bulk proteomics overcomes by operating near the protein or peptide solubility limit. To mimic that approach for single-cell proteomics, given the ∼500 pg of protein in a typical mammalian cell,29 the reaction volume should be limited to nanoliters. Just recently, proteomics preparations have been scaled down to hundreds of nano-liters,28 whereas single-cell transcriptomics often uses lysis volumes that are 100 times smaller, on the order of just a few nanoliters.13 Protein losses can be further reduced by passivating the surfaces interfacing with the samples. Taken together, the above approaches can decrease protein losses and thus increase the efficiency of protein delivery to the MS instrument by orders of magnitude (Figure 3a). Furthermore, automated precision liquid handling will play a large role in single-cell proteomics, making sample preparation robust, high-throughput, and cost-effective (Figure 3d).
Figure 3.

Transformative opportunities for improving the quantification of single-cell proteomes. (a) Most bulk samples prepared for MS have volume of 10−100 μL.11,12,17 Reducing the volume for sample preparation to 1 to 2 nL13 can significantly reduce protein losses from surface adsorption. (b) The sharper the separation peaks, the larger the fraction of the ions can be analyzed for a fixed sampling (injection) time. Sharper peaks can be achieved by reducing the bore of LC columns, using monolithic columns, PLOT columns,27 or capillary electrophoresis.25 (c) Typically elution peaks have a full width at the base of ∼60 s and about 10−15 s at midheight, whereas ions for MS2 are sampled for mere milliseconds. These settings are typical for bulk proteomics and result in sampling <1% of the ions delivered to the instruments. Thus increasing the sampling time 100× can substantially increase the ions analyzed by MS, the sensitivity, and the accuracy of quantification. While, the panel displays sampling during the apex of the peak, this cannot always be achieved for all ions. (d) Automated liquid handling and 96/384-well plates can increase the consistency of sample preparation, decrease volumes to the nanoliter range, and increase throughput. (e) Parallel accumulation and serial injection of ions can afford increased ion sampling without reducing throughput. (f) A larger number of barcodes will increase the number cellular proteomes quantified per run without reducing proteome coverage or ion sampling.
PEPTIDE SEPARATION
Modern MS methods sample only a fraction of each elution peak, which corresponds to 1% or less of the ions for each peptide that the instrument could sample (Figure 3b). This small fraction is sufficient for the identification of peptides in bulk samples and maximizes peptide identification per unit time. Single-cell proteomics, however, can benefit from delivering the maximum number of ions from each peptide to the MS detectors. Two simple strategies can maximize the number of ions delivered: (i) improved peptide separation with tighter, and therefore taller, peaks, so that the number of ions sampled per unit time is increased and (ii) sampling a greater fraction of the elution peaks. The first strategy is technically demanding, whereas the second one comes at the expense of reduced throughput per unit time. Such limitations can be partially compensated for by (i) improving the separation, that is, using specialized liquid chromatography (LC) columns27 or capillary electrophoresis25,35 (which is particularly promising for top-down MS), or by (ii) making all measurements targeted to proteins of interest, which involves programming the MS instrument to sequence specific peptides. These strategies combined have the potential to increase 10− 100 times the number of ions delivered to the instrument and thus increase the sensitivity of single-cell proteomics by 10− 100-fold (Figure 3b,c).
PARALLEL ION ACCUMULATION
Data-dependent acquisition (DDA) with current MS hardware operates by selecting specific ions and fragmenting them for identification and quantification. The ions are serially accumulated and serially analyzed. This strategy is efficient when accumulation times are short. In bulk samples, ions are abundant enough so that sampling them for a very short time results in reliable identification and quantification. However, single-cell MS ideally should sample a large fraction of the ions, which requires accumulating ions over longer periods of time. If ion accumulation is serial, then longer accumulation increases sensitivity but at the expense of fewer quantified peptides per unit time. This trade-off can be resolved by accumulating ions in parallel, so that we gain sensitivity without losing throughput. The most obvious way to accomplish parallel accumulation and parallel injection is by using data-independent acquisition (DIA). Because DIA does not allow direct quantification from the reporter ions of isobaric tags, we can adapt it to use the complement ions that remain bound to peptide fragments. Parallel accumulation with serial injection can be accomplished by using additional accumulation traps built into the MS instrument (Figure 3e). Alternatively, parallel accumulation and serial injection can be achieved by trapped ion mobility spectrometry.36 For long accumulation times, and thus sensitive MS, the increase in throughput by parallel accumulation is proportional to the number of ions accumulated in parallel, and we expect to gain 2 −10-fold (Figure 3e).
HIGHER MULTIPLEXING FOR INCREASED THROUGHPUT
Achieving high chromatographic resolution and quantifying thousands of proteins requires an hour of LC−MS/MS time or more. Thus to quantify the proteomes of thousands of single cells within hours, we need to quantify many cells per LC− MS/MS run. Such multiplexing can be achieved by isobaric chemical barcoding.37,38 These barcodes are chemically identical but distinguishable by MS due to their different isotopic compositions. While there are a number of commercially available barcode sets, the largest such set allows the simultaneous analysis of only 11 different samples. However, larger sets of barcodes can be synthesized, and, indeed, many colleagues are actively working on making multiplex tags that would allow 30−100 individual cells to be measured in parallel (Figure 3f). In creating new barcodes for single-cell proteomics, there is an opportunity to solve an outstanding problem with the technology, coisolation. Quantitative fragments from the currently available barcodes are not peptide specific, allowing the signal to be polluted by fragments from different peptide species.39 The barcode labeling chemistry would have to be changed such that the barcode to peptide bond is much stronger or the barcodes require less energy for fragmentation, allowing the quantification to be based on peptide-specific complement ions.
PROTEIN IDENTIFICATION AND DATA ANALYSIS
While the analysis of single-cell MS data can use tools developed for bulk MS,40–42 it raises specific challenges and opportunities. One specific challenge is peptide sequencing. At very low abundance, many peptides may not produce enough fragment ions to support confident identification. One solution may be to include a carrier cells together with single cells, each of which is labeled with a unique tandem-mass tag.20 With this strategy, the fragment ions supporting peptide identification are derived from peptides pooled across all samples, including the carrier channel.20 Combining this strategy with increases in the number of distinct tandem-mass tags will further facilitate peptide identification and decrease the need for carrier cells. Another approach is to use additional peptide characteristics, such as retention time or empirical mass spectra. These approaches can exploit the fact that single-cell proteomics data will contain multiple similar runs that can be used, for example, for making spectral libraries. As previously discussed, quantifying 1000s of single cells in a reasonable time frame requires barcoding, which will benefit from new computational approaches to accurately merge quantitative data sets acquired separately. If single-cell proteomes are quantified by shotgun MS, then the proteins quantified in different runs will overlap partially, with some proteins quantified across all MS runs, whereas others will be quantified in only a subset of the runs. This partial overlap will result in missing data; that is, the levels of some proteins will not be quantified in some single cells. Such missing data are pervasive with respect to single-cell RNA-seq30 and must be handled carefully in single-cell proteomics to avoid artifacts.
The number of confidently identified peptides or proteins has served as a popular MS benchmark. Indeed, this number is informative for the depth of discovery when only a few bulk samples are analyzed by MS and only proteins quantified across all samples can be meaningfully analyzed. However, when the proteomes of many hundreds of cells are analyzed, all proteins quantified across a large enough number of cells can be analyzed. Consider, for example, a shotgun MS study profiling 10 000 single cells and quantifying a pair of proteins, A and B, across only 10% of the cells. Despite the low probability of quantifying A and B, we can still analyze the 1000 cells in which these proteins are quantified and compute a meaningful correlations between A and B. Thus the most relevant benchmark for the depth of single-cell proteomics is the subset of proteins quantified across large enough number of cells to allow for biological inferences for these proteins. The number of proteins quantified per run and across every single cell is a technological benchmark with limited practical significance. As we increase the number of quantified single-cell proteomes, the number of proteins quantified in every cell can only decrease, whereas the number of proteins quantified across many cells will increase, and so will the coverage of the proteome that can be analyzed.
Focusing exclusively on maximizing proteome coverage per cell can substantially undermine the throughput (number of analyzed cells) and the accuracy of quantification. This is because longer nLC gradients will generally provide more time to sample more ions and thus contribute to larger number of identified peptides per run. However, because the run takes longer, fewer samples can be analyzed per instrument per unit time, and thus fewer cells are quantified. Furthermore, longer gradients generally will result in broader elution peaks and thus fewer ions sampled per unit injection time. As discussed above, sampling fewer ions will result in larger relative sampling error, equal to 1/√n, where n is the number of sampled ions. Algorithms for matching spectra between runs are an excellent way to increase depth of coverage. However, such approaches do not assign confidence to the new spectral assignments. We are excited for efforts to incorporate both retention time and spectral information into a rigorous statistical framework to increase the number of confidently identified and accurately quantified peptides. This potential for small sampling error and for highly controlled, direct ratiometric measurements (no need for amplification, surrogates, or reporters) supports the imminent possibility of deep and accurate quantification of single-cell proteomes. This prospect, the opportunities for increased multiplexing, and the new analytical methods afforded by these data can revolutionize biology and medicine.
OUTLOOK AND COMMUNITY ENGAGEMENT
In this Perspective, we highlighted the most exciting and approachable opportunities toward realizing high-throughput and cost-effective single-cell proteomics. We aimed to make our Perspective accessible for the broadest audience possible because we hope that it will stimulate a community-wide discussion via meetings and workshops dedicated to single-cell proteomics.43 We hope to catalyze interdisciplinary collaborations that focus technological developments toward answering the most promising biological questions and solving biomedical problems. Single-cell proteomics is an imminent opportunity to revolutionize biology and medicine. Realizing this opportunity requires a unified effort of colleagues with diverse expertise, including instrument engineers, separation scientists, mass spectrometry experts, statisticians, and biologists.
ACKNOWLEDGMENTS
We thank R. G. Huffman, B. Budnik, G. Harmange, E. Emmott, A. Ivanov, A. Semrau, and B. Karger for constructive feedback. This work was funded by startup funds from Northeastern University and a New Innovator Award from the NIGMS from the National Institutes of Health to N.S. under Award Number DP2GM123497.
Footnotes
The authors declare no competing financial interest.
REFERENCES
- (1).Chalfie M; Tu Y; Euskirchen G; Ward WW; Prasher DC Green fluorescent protein as a marker for gene expression. Science 1994, 263, 802–805. [DOI] [PubMed] [Google Scholar]
- (2).Caprioli RM; Farmer TB; Gile J Molecular imaging of biological samples: localization of peptides and proteins using MALDI-TOF MS. Anal. Chem 1997, 69, 4751–4760. [DOI] [PubMed] [Google Scholar]
- (3).Bandura DR; et al. Mass cytometry: technique for real time single cell multitarget immunoassay based on inductively coupled plasma time-of-flight mass spectrometry. Anal. Chem 2009, 81, 6813–6822. [DOI] [PubMed] [Google Scholar]
- (4).Bendall SC; et al. Single-cell mass cytometry of differential immune and drug responses across a human hematopoietic continuum. Science 2011, 332, 687–696. [DOI] [PMC free article] [PubMed] [Google Scholar]
- (5).Darmanis S; et al. Simultaneous multiplexed measurement of RNA and proteins in single cells. Cell Rep. 2016, 14, 380–389. [DOI] [PMC free article] [PubMed] [Google Scholar]
- (6).Hughes AJ; et al. Single-cell western blotting. Nat. Methods 2014, 11, 749–755. [DOI] [PMC free article] [PubMed] [Google Scholar]
- (7).Elowitz MB; Levine AJ; Siggia ED; Swain PS Stochastic gene expression in a single cell. Science 2002, 297, 1183–1186. [DOI] [PubMed] [Google Scholar]
- (8).Weissleder R; Pittet MJ Imaging in the era of molecular oncology. Nature 2008, 452, g15. [DOI] [PMC free article] [PubMed] [Google Scholar]
- (9).Raj A; van Oudenaarden A Nature, nurture, or chance: stochastic gene expression and its consequences. Cell 2008, 135, 216– 226. [DOI] [PMC free article] [PubMed] [Google Scholar]
- (10).Levy E; Slavov N Single cell protein analysis for systems biology. Essays in Biochemistry (in press) PeerJ Preprints 2018, 6, e26965v1. [DOI] [PMC free article] [PubMed] [Google Scholar]
- (11).Aebersold R; Mann M Mass spectrometry-based proteomics. Nature 2003, 422, 198. [DOI] [PubMed] [Google Scholar]
- (12).Zhang B; et al. Proteogenomic characterization of human colon and rectal cancer. Nature 2014, 513, 382. [DOI] [PMC free article] [PubMed] [Google Scholar]
- (13).Macosko EZ Highly Parallel Genome-wide Expression Profiling of Individual Cells Using Nanoliter Droplets. Cell 2015, 161, 1202–1214. [DOI] [PMC free article] [PubMed] [Google Scholar]
- (14).Brown PO; Botstein D Exploring the new world of the genome with DNA microarrays. Nat. Genet 1999, 21, 33. [DOI] [PubMed] [Google Scholar]
- (15).Boyer LA; et al. Core transcriptional regulatory circuitry in human embryonic stem cells. Cell 2005, 122, 947–956. [DOI] [PMC free article] [PubMed] [Google Scholar]
- (16).Slavov N; Macinskas J; Caudy A; Botstein D Metabolic cycling without cell division cycling in respiring yeast. Proc. Natl. Acad. Sci. U. S. A 2011, 108, 19090–19095. [DOI] [PMC free article] [PubMed] [Google Scholar]
- (17).Slavov N; Budnik B; Schwab D; Airoldi E; van Oudenaarden A Constant Growth Rate Can Be Supported by Decreasing Energy Flux and Increasing Aerobic Glycolysis. Cell Rep. 2014, 7, 705–714. [DOI] [PMC free article] [PubMed] [Google Scholar]
- (18).Blyth CR On Simpson’s paradox and the sure-thing principle. J. Am. Stat. Assoc 1972, 67, 364–366. [Google Scholar]
- (19).Franks A; Airoldi E; Slavov N Post-transcriptional regulation across human tissues. PLoS Comput. Biol 2017, 13, e1005535. [DOI] [PMC free article] [PubMed] [Google Scholar]
- (20).Budnik B; Levy E; Harmange G; Slavov N Mass-spectrometry of single mammalian cells quantifies proteome heterogeneity during cell differentiation. bioRxiv 2017, 102681 DOI: 10.1101/102681. [DOI] [PMC free article] [PubMed] [Google Scholar]
- (21).Hofstadler SA; Swanek FD; Gale DC; Ewing AG; Smith RD Capillary Electrophoresis-Electrospray Ionization Fourier Transform Ion Cyclotron Resonance Mass Spectrometry for Direct Analysis of Cellular Proteins. en. Anal. Chem 1995, 67, 1477–1480. [DOI] [PubMed] [Google Scholar]
- (22).Valaskovic GA; Kelleher NL; McLafferty FW Attomole Protein Characterization by Capillary Electrophoresis-Mass Spec-trometry. Science 1996, 273, 1199–1202. [DOI] [PubMed] [Google Scholar]
- (23).Mellors JS; Jorabchi K; Smith LM; Ramsey JM Integrated Microfluidic Device for Automated Single Cell Analysis Using Electrophoretic Separation and Electrospray Ionization Mass Spectrometry. Anal. Chem 2010, 82, 967–973. [DOI] [PMC free article] [PubMed] [Google Scholar]
- (24).Virant-Klun I; Leicht S; Hughes C; Krijgsveld J Identification of maturation-specific proteins by single-cell proteomics of human oocytes. Mol. Cell. Proteomics 2016, 15, 2616–2627. [DOI] [PMC free article] [PubMed] [Google Scholar]
- (25).Lombard-Banek C; Moody SA; Nemes P Single-Cell Mass Spectrometry for Discovery Proteomics: Quantifying Translational Cell Heterogeneity in the 16-Cell Frog (Xenopus) Embryo. Angew. Chem., Int. Ed 2016, 55, 2454–2458. [DOI] [PMC free article] [PubMed] [Google Scholar]
- (26).Sun L Single Cell Proteomics Using Frog (Xenopus laevis) Blastomeres Isolated from Early Stage Embryos, Which Form a Geometric Progression in Protein Content. Anal. Chem 2016, 88, 6653–6657. [DOI] [PMC free article] [PubMed] [Google Scholar]
- (27).Li S; et al. An integrated platform for isolation, processing, and mass spectrometry-based proteomic profiling of rare cells in whole blood. Mol. Cell. Proteomics 2015, 14, 1672–1683. [DOI] [PMC free article] [PubMed] [Google Scholar]
- (28).Zhu Y; Piehowski PD; Zhao R; Chen J; Shen Y; Moore RJ; Shukla AK; Petyuk VA; Campbell-Thompson M; Mathews CE Nanodroplet processing platform for deep and quantitative proteome profiling of 10−100 mammalian cells. en. Nat. Commun 2018, 9, 882. [DOI] [PMC free article] [PubMed] [Google Scholar]
- (29).Milo R; Jorgensen P; Moran U; Weber G; Springer M BioNumbers-the database of key numbers in molecular and cell biology. Nucleic Acids Res. 2010, 38, D750–D753. [DOI] [PMC free article] [PubMed] [Google Scholar]
- (30).Hicks SC; Townes FW; Teng M; Irizarry RA Missing data and technical variability in single-cell RNA-sequencing experiments. Biostatistics 2017, kxx053. [DOI] [PMC free article] [PubMed] [Google Scholar]
- (31).Hosic S; Murthy SK; Koppes AN Microfluidic sample preparation for single cell analysis. Anal. Chem 2016, 88, 354–380. [DOI] [PMC free article] [PubMed] [Google Scholar]
- (32).Kulak NA; Pichler G; Paron I; Nagaraj N; Mann M Minimal, encapsulated proteomic-sample processing applied to copy-number estimation in eukaryotic cells. Nat. Methods 2014, 11, 319. [DOI] [PubMed] [Google Scholar]
- (33).Hughes CS; et al. Ultrasensitive proteome analysis using paramagnetic bead technology. Mol. Syst. Biol 2014, 10, 757. [DOI] [PMC free article] [PubMed] [Google Scholar]
- (34).Sielaff M; et al. Evaluation of FASP, SP3, and iST Protocols for Proteomic Sample Preparation in the Low Microgram Range. J. Proteome Res. 2017, 16, 4060–4072. [DOI] [PubMed] [Google Scholar]
- (35).Sun L; et al. Over 10 000 Peptide Identifications from the HeLa Proteome by Using Single-Shot Capillary Zone Electrophoresis Combined with Tandem Mass Spectrometry. Angew. Chem., Int. Ed 2014, 53, 13931–13933. [DOI] [PMC free article] [PubMed] [Google Scholar]
- (36).Meier F; et al. Parallel accumulation−serial fragmentation (PASEF): multiplying sequencing speed and sensitivity by synchronized scans in a trapped ion mobility device. J. Proteome Res. 2015, 14, 5378–5387. [DOI] [PubMed] [Google Scholar]
- (37).Thompson A; et al. Tandem mass tags: a novel quantification strategy for comparative analysis of complex protein mixtures by MS/ MS. Anal. Chem 2003, 75, 1895–1904. [DOI] [PubMed] [Google Scholar]
- (38).Ross PL; et al. Multiplexed protein quantitation in Saccharomyces cerevisiae using amine-reactive isobaric tagging reagents. Mol. Cell. Proteomics 2004, 3, 1154–1169. [DOI] [PubMed] [Google Scholar]
- (39).Savitski MM; et al. Measuring and managing ratio compression for accurate iTRAQ/TMT quantification. J. Proteome Res. 2013, 12, 3586–3598. [DOI] [PubMed] [Google Scholar]
- (40).Eng JK; McCormack AL; Yates JR An approach to correlate tandem mass spectral data of peptides with amino acid sequences in a protein database. J. Am. Soc. Mass Spectrom. 1994, 5, 976–989. [DOI] [PubMed] [Google Scholar]
- (41).Cox J; Mann M MaxQuant enables high peptide identification rates, individualized ppb-range mass accuracies and proteome-wide protein quantification. Nat. Biotechnol 2008, 26, 1367–1372. [DOI] [PubMed] [Google Scholar]
- (42).Sinitcyn P; Daniel Rudolph J; Cox J Computational Methods for Understanding Mass Spectrometry−Based Shotgun Proteomics Data. Annu. Rev. Biomed. Data Sci 2018, 1, 207–34. [Google Scholar]
- (43). Single Cell Proteomics. 2018 www.northeastern.edu/scp2018.