

Summary
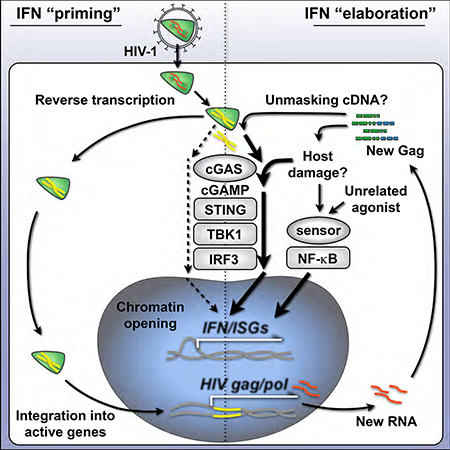
Myeloid dendritic cells (DCs) have the innate capacity to sense pathogens and orchestrate immune responses. However, DCs do not mount efficient immune responses to HIV-1, primarily due to restriction of virus reverse transcription, which prevents accumulation of viral cDNA and limits its detection through the cGAS-STING pathway. By allowing reverse transcription to proceed, we find that DCs detect HIV-1 in distinct phases, before and after virus integration. Blocking integration suppresses, but does not abolish, activation of the transcription factor IRF3, downstream interferon (IFN) responses, and DC maturation. Consistent with two stages of detection, HIV-1 “primes” chromatin accessibility of innate immune genes before and after integration. Once primed, robust IFN responses can be unmasked by agonists of the innate adaptor protein, MyD88, through a process that requires cGAS, STING, IRF3, and NF-B. Thus, HIV-1 replication increases material available for sensing and discrete inflammatory inputs tune cGAS signaling to drive DC maturation.
Keywords: HIV-1, innate immunity, DNA sensing, type I interferon, cGAS, STING, IRF3, HIV integration, dendritic cell, chromatin modification
eTOC Blurb
Parameters regulating the innate immune response to HIV-1 remain unclear. Johnson et al. elucidate how dendritic cells sense HIV-1 in two stages. They demonstrate that cGAS/STING signaling can be tuned through unrelated pathways to unmask interferon responses before and after HIV-1 integration.
Introduction
Generation of type I IFN responses during viral infection hinges on the cellular recognition of viral components by host-encoded pattern recognition receptors. Activation of these innate immune receptors or “sensors” leads to phosphorylation of adaptor proteins and transcription factors that drive IFN and IFN-stimulated gene (ISG) expression to protect the host (Cao, 2016; Ivashkiv and Donlin, 2014). In the case of lentiviral infection, under the right conditions, viral RNA, reverse-transcribed cDNA, or viral proteins have been reported to trigger IFN responses through these sensors (Beignon et al., 2005; Gringhuis et al., 2010; Jakobsen et al., 2013; Manel et al., 2010; Monroe et al., 2014; Pertel et al., 2011). While IFNs and many ISGs contribute to blocking transmission of HIV-1 and SIV, innate responses are insufficient for protection during natural infection (Sandler et al., 2014; Schoggins et al., 2011). During the chronic phase of HIV-1 pathogenesis, IFN responses are dysregulated and heightened ISG expression correlates with disease progression (Fernandez et al., 2011; Sandler et al., 2014). Thus, identifying the cellular parameters that govern timely and effective innate responses to HIV-1 is of considerable interest.
DCs are among the first cells to contact lentiviruses during transmission and express a constellation of pathogen sensors that enable IFN and inflammatory cytokine production (Iijima & Iwasaki 2008). Although myeloid DCs express the cellular receptors for HIV-1, CD4 and CCR5, and can internalize virus, the majority of these cells are not productively infected and do not efficiently detect HIV-1 during entry (Granelli-Piperno et al., 2004; Manel et al., 2010; Smed-Sorensen et al., 2005). This is largely due to DCs expressing high levels of the restriction factor, SAMHD1, a nucleotide phosphohydrolase that prevents reverse transcription of retroviruses (Hrecka et al., 2011; Laguette et al., 2011). Other lentiviruses, such as HIV-2 or SIV, package the accessory protein, Vpx, which targets SAMHD1 for degradation through the ubiquitinproteasome system and counteracts its restriction. Delivering Vpx to DCs in trans with HIV-1 serves as a model for studying HIV-driven immune responses, as it enables reverse transcription to proceed and permits efficient infection, leading to IFN production and DC maturation (Gao et al., 2013; Lahaye et al., 2013; Manel et al., 2010; Yoh et al., 2015).
In DCs, the key molecule that initiates immune responses during retroviral infection is the cytoplasmic DNA sensor, cyclic GMP-AMP synthase (cGAS) (Gao et al., 2013). Together with proximal factors such as IFI16 and PQBP1, cGAS senses reverse transcribed viral cDNA and catalyzes the synthesis of the second messenger, cyclic GMP-AMP (cGAMP) (Jonsson et al., 2017; Yoh et al., 2015). cGAMP then binds and activates the adaptor protein, STING, which undergoes a conformational change, is phosphorylated at Ser366, and traffics from the endoplasmic reticulum (ER) to the ER-Golgi intermediate compartment where it phosphorylates TANK-binding kinase 1 (TBK1) (Liu et al., 2015). TBK1 subsequently phosphorylates the transcription factor, Interferon Regulatory Factor 3 (IRF3), leading to its dimerization, nuclear entry, and the induction of type I IFN. While cGAS appears to be critical for generating IRF3-dependent immune responses during retroviral infection in DCs, it is unclear what circumstances permit cGAS to detect HIV-1 before it integrates into host DNA, or after integration during productive replication.
In agreement with the latter concept, several reports indicate that sensing of HIV-1 infection, type I IFN production, and cell activation, do not occur until integration has taken place (Lahaye et al., 2013; Manel et al., 2010; Vermeire et al., 2016). In permissive cells, reverse transcription of HIV-1 proceeds inside the capsid, a protective mechanism that likely evolved to shield the cDNA during entry. Mutations that destabilize the capsid can trigger innate immune sensing before integration through a process that is regulated by capsid interactions with the cellular proteins cyclophilin A (in DCs) and CPSF6 (in macrophages) (Lahaye et al., 2013; Rasaiyaah et al., 2013). HIV-1 cDNA that escapes into the cytosol before integration can be targeted by a ubiquitously expressed host exonuclease, TREX1, which degrades cytoplasmic DNA and limits cGAS sensing (Yan et al., 2010). Interestingly, in other experimental systems, HIV-1 can elicit innate responses prior to integration, with IRF3 phosphorylation and ISG production being triggered to the same degree with replicating virus as they are in the presence of integrase inhibitors (Gao et al., 2013; Yoh et al., 2015). As all of these reports are well supported, we set out to conciliate their findings and further elucidate the conditions that authorize IFN signaling during HIV-1 infection in DCs.
Here, we have examined whether HIV-1 is sensed in human DCs before or after integration using antiretroviral drugs and virus mutants to separate stages of the HIV-1 life cycle. We report that HIV-1 cDNA is detected at low levels prior to integration and that HIV-1 replication increases the efficiency of cGAS-mediated sensing by an order of magnitude. Additionally, we have demonstrated that HIV-1 infection in DCs leads to alterations in host chromatin that reflect two stages of an IFN response. Increasing the multiplicity of infection (MOI), increasing the availability of IRF3, or providing secondary innate stimulation through cGAS-independent pathways, can dramatically enhance the IFN signal that is triggered by preintegration material. Using shRNA knockdowns in DCs and CRISPR perturbations in THP-1 monocytic cells we demonstrate that IFN responses depend on cGAS, STING, and IRF3, but not IRFs 1, 5, or 7, or several other molecules involved in sensing DNA and RNA. Our studies support the hypothesis that HIV-1 replication increases the amount of material available for sensing and indicate that the cGAS-STING axis can be tuned by unrelated inflammatory signals to unmask robust IFN responses prior to integration.
Results
DCs mount an innate immune response to HIV-1 at steps before and after integration
To assess the extent to which DCs have the capacity to sense HIV-1 before or after integration, we infected immature monocyte-derived DCs with a single-cycle HIV-1 reporter virus (HIV-GFP) in the presence of Vpx and used antiretroviral drugs or viral mutants to interrogate how steps of the virus life cycle intersect with the innate response (Figure 1A). We tracked changes in DC activation status, IFN production, ISG expression, and phosphorylation of key signaling molecules. As found previously (Manel et al., 2010), immature DCs infected with HIV-GFP became mature (Figures 1B and S1A), with the majority of cells scoring positive for GFP and expression of the costimulatory molecule, CD86, by 48 h. As expected, blocking reverse transcription with Efavirenz (EFV), completely suppressed activation of DCs (Figure 1B). However, blocking integration with Raltegravir (RAL) did not fully inhibit CD86 induction, suggesting that the innate response was partially engaged after reverse transcription but before virus replication.
Figure 1. HIV-1 is sensed in DCs before and after integration.

(A) Illustration depicting steps of the HIV-1 life cycle impacted by antiretrovirals (EFV, RAL), mutations (IN-D116A, ΔGag), or a non-replicating lentivector (LKO-GFP).
(B) and (C) Flow cytometry plots of CD86 vs GFP expression in DCs 48 h after infection +/− antiretrovirals (B) or compared to IN-D116A, ΔGag, and LKO-GFP (C).
(D) and (E) Pooled data from DCs derived from unique donors plotted as GFP mean fluorescence intensity (MFI), %CD86+, and bioactive type I IFN from DC supernatants. n = 28 (mock, HIV-GFP, RAL); or n = 17 (EFV). * = p<0.01; ** = p<0.001; *** = p<0.0001.
(F) Correlation between CD86 and IFN in DCs.
(G) Flow cytometry histograms depicting intracellular p24 levels at 16, 32, and 48 h after infection. Plot represents pooled data from 4 donors.
MOI = 1.5; mutants normalized to HIV-GFP. Panels with pooled data show mean +/− SEM. See also Figure S1.
To rule out the possibility that partial activation could be the result of incomplete drug penetrance, we next tested HIV-GFP containing a mutation in integrase (IN-D116A). Similar to our results with RAL, we found IN-D116A led to partial induction of CD86 (Figure 1C). Residual GFP expression observed after HIV-GFP infection in the presence of RAL or with IN-D116A (Figures 1B-1E) is consistent with the fact that non-integrated episomes are known to be sources for limited transcription of early viral genes, but are deficient in transcription of gag-pol (Sloan and Wainberg, 2011). DCs were also only partially activated by HIV-GFP containing mutations in Gag (ΔGag) or by a non-replicating, integration-competent lentivector (LKO-GFP), supporting the hypothesis that newly synthesized capsid protein is important for DC maturation (Manel et al., 2010).
As DC maturation during HIV-1 infection is linked with the IFN response, we next plotted infection, CD86 induction, and type I IFN activity for multiple donors. Blocking integration with RAL reduced IFN activity, similar to infections with IN-D116A, ΔGag, and LKO-GFP compared to HIV-GFP (Figures 1D-E), with IFN activity positively correlating with CD86 (Figure 1F). We verified that virus entry was not compromised in the presence of drugs by measuring intracellular p24 (Figure 1G), and as expected, RAL inhibited expression of viral RNA, but not accumulation of reverse-transcribed DNA (Figure S1B). Together, these findings support the concept that the innate response during HIV infection occurs in two phases, before and after integration.
Activation of the transcription factor IRF3 is crucial for generating the first wave of type I IFN during an innate response (Sato et al., 1998). At 24 h post infection, IRF3 phosphorylation was completely blocked by EFV, but was still detectable in the presence of RAL (Figure S1C). We next asked if differences in IRF3 activation and nuclear trafficking persisted over time, noting similar levels of STING and TBK1 phosphorylation under conditions of drug pressure. Phosphorylation and nuclear translocation of IRF3 increased as infection progressed to 32 h (Figure S1D), and this response, while still evident, was suppressed in RAL-treated samples, particularly at later time points. Downstream of IRF3 activation, early production and secretion of the type I IFN, IFN-beta (encoded by the gene, IFNB1), can signal in an autocrine and paracrine fashion through IFN receptors (IFNAR1/2) to activate canonical IFN signaling through the JAK/STAT pathway, which further amplifies IFN and ISG expression (Ivashkiv and Donlin, 2014). In the presence of RAL, we could observe STAT1 phosphorylation and induction of the ISGs, IRF1 and IRF7, although this response was lower than with HIV-GFP and reflected reduced phosphorylation of IRF3 (Figure S1D).
As ISG expression can be a more sensitive readout of IFN signaling than immuno blotting for pathway proteins, we next tested expression levels of ISG15, an early ISG induced to high levels during an IFN response. EFV completely inhibited its induction, but RAL only did so in part (Figure S1E). In accordance with several studies reporting that wild type HIV-1 evades innate immune responses (Gringhuis et al., 2017; Rasaiyaah et al., 2013; SmedSorensen et al., 2005), we did not observe significant changes in ISG15 expression in DCs infected with CD4/CCR5-tropic, replication competent HIV-1, even in productively infected cultures (Figure S1F). To circumvent the suppressive effects associated with wild type HIV-1 infection, we proceeded using HIV-GFP to better understand the threshold of the innate response. Using cell-based bioassays, we found that type I IFN activity and NF-κB activity in DC supernatants was dependent on the amount of virus added (Figure S2A, S2B). At high MOI we could detect IFN, but not NF-κB activity in the presence of RAL. Together, these results support the notion that myeloid cells have the capacity to sense HIV before and after integration.
Replication of HIV-1 leads to elaboration of type I IFN responses
To develop an unbiased view of the innate response occurring before and after integration, we sought to explore the transcriptional response on a genome-wide scale. Blocking integration with RAL inhibited both the induction of up-regulated transcripts and the repression of down-regulated transcripts, which were associated with pathways involved in IFN signaling and metabolism, respectively (Figures 2A-B; S2C-D). Inspection of individual genes revealed dramatic induction of ISGs during infection (eg: ISG15, CXCL10, ISG20, HES4, IRF7, and APOBEC3A) and interferons, themselves (IFNB1, IFNL1), beginning at 8–16 h after infection (Figures S2E-F), coinciding with activation of IRF3 (Figure S1D).
Figure 2. HIV-1 replication amplifies IFN and ISG expression.

(A) Heat maps of microarrays from DCs infected with HIV-GFP +/− RAL at 0, 8, 16, 20, 24, 28, 32, and 40 h (MOI = 1.5). Expression data was fit to a regression model (see STAR Methods), plotted as mean-centered and scaled by the standard deviation for each gene. Genes are ordered by whether expression increases or decreases with time and by the p-value of the slope difference +/− RAL from 0–32 h. n = 2 donors.
(B) Spider plots of selected top pathways identified from Ingenuity Pathway Analysis of microarray data. Lines are color-code by time after infection and greater distances from the plot center indicate stronger enrichment, graphed as -log(p).
(C) Promoter-associated transcription factor motifs in genes induced during HIV-GFP infection as in (A) identified by Enrichr.
(D) Gene Ontology (GO) Biological Processes associated with genes induced during HIV-GFP infection.
(E) Bioactive type I IFN from DC supernatants after infection with HIV-GFP +/− RAL at the indicated time and MOI. n = 4 donors.
Fitting our data to a linear model enabled us to determine slopes for transcriptional changes over time (Table S1). IFNB1, IFNL1, and CXCL10 displayed strikingly lower slopes when integration was blocked (Table S1; Figure 2A; S2E). Transcription factor motifs for IRF family members and the canonical NF-κB family member, RELA, were enriched in promoter regions of top-ranking genes (Figure 2C). Fittingly, we found “response to virus”, “response to type I IFN”, and “type I IFN signaling pathway” to be among the top scoring Gene Ontology (GO) Biological Processes associated with these genes (Figure 2D). We hypothesized that if the strength of the IFN signal was a function of the amount of viral material available for sensing, then simply increasing virus MOI in the presence of RAL could meet or exceed the level of innate activation associated with HIV-GFP replication at early time points. Indeed, increasing MOI of HIV-GFP in the presence of RAL potentiated expression and rate of induction of bioactive type I IFN (Figure 2E). We observed donor-to-donor variation in the innate response that may be the result of differences in baseline gene expression, but blocking integration reduced IFN output longitudinally under many conditions. Importantly, we see induction of IFN and ISG transcripts occurring as early as 8–16 h after infection (Figures S2E-F), time points where the majority of DCs are not yet producing new viral components (Figure S1A). These results bring clarity to previous evidence of both pre- and post-integration sensing of HIV in complementary experimental models (Gao et al., 2013; Manel et al., 2010). Thus, DCs have the capacity to respond to HIV-1 prior to integration and virus replication increases the efficiency of sensing and elaborates IFN output.
Changes in chromatin accessibility in DCs infected with HIV-1 indicate the presence of virus and reflect a primed type I IFN response.
To determine whether infection leads to changes in accessible chromatin that might inform the transcriptional response and reflect IRF and NF-κB activation, we infected DCs in the presence of Vpx and performed an assay for transposase-accessible chromatin (ATAC-seq) at 16, 32, and 48 h on sorted cells from three independent donors (Figure 3A, 3B; S3A). ATACseq peaks representing open chromatin were observed across the genome with many peaks corresponding to transcription start sites (TSS) (Figure 3C and Table S2). Global assessment of gene-associated peaks revealed that Viral Infection (z-score = 12.47, p = 9.47E-19), Infection by an RNA virus (z-score = 12.32, p = 3.5E-11), and Infection by HIV-1 (z-score = 12.12, p = 7.97E-10) were the top scoring Diseases and Biological Functions (Figure S3B), and implicated roles for IFN, JAK/STAT, and inflammatory signal cascades (Figure S3C). Additionally, the top upstream regulators of gene-associated peaks were predicted to be IRF family members, NF-B factors, and type I and type III IFNs (Figure 3D).
Figure 3. Chromatin accessibility at ISG promoters reflects two stages of the interferon response during HIV infection.

(A) Schematic depicting process for DC derivation, kinetic analysis of HIV-1 infection in the presence of Vpx, DC maturation, and ATAC-seq analysis of open chromatin.
(B) Flow cytometry plots of DCs sorted for ATAC-seq after infection with HIV-GFP for 16, 32, or 48 h (MOI = 1.5), +/− RAL, displaying CD86 vs GFP expression.
(C) ATAC-seq tracks highlighting a portion of chromosome 1.
(D) Heat map displaying upstream regulators of differential ATAC-seq peaks predicted by Ingenuity Pathway Analysis.
(E) Smooth scatter density plots showing the genome-wide relationship between transcript levels and ATAC-seq TSS peak in DCs infected with HIV-GFP +/− RAL at 32 h. The positions of example ISGs in low-density regions are highlighted in red.
(F) ATAC-seq tracks at 48 h showing transcription start site peaks for indicated genes juxtaposed with tracks from ENCODE ChIP-seq for NF-κB, STAT1, IRF3, and DNAse hypersensitivity. Tracks were visualized using IGV and represent merged files across 3 biological replicates.
In order to visualize how genome-wide changes in open chromatin track with changes in gene expression, we plotted changes in transcript values vs. changes in ATAC-seq TSS peak values (Figure 3E). At 32 h after infection, a time point when we observe strong ISG expression, the majority of transcripts and TSS peak values remained unchanged (dense blue regions centered at 0), but many ISGs were positioned in the upper right regions of the plots, suggesting that chromatin opening correlates with ISG induction. When viewing individual peaks at the gene level, we could observe changes in open chromatin across the ATAC-seq time series for several ISGs (ISG15, ISG20, HES4, IRF7, PIM3, APOBEC3A, and IFIT3) compared to housekeeping controls (Figures 3F; S3D). RAL suppressed, but did not completely abolish the increase in chromatin accessibility at these ISG promoters during HIV-GFP infection. Given that we could observe progressive chromatin opening at peaks corresponding with known ChIP-seq binding sites for NF-κB/RELA, IRF3, and STAT1 (Figures S3D; 3F), we hypothesized that low levels of innate sensing might “prime” IFN signaling that could be unmasked by unrelated stimuli.
Cytoplasmic DNA primes a type I IFN response that can be boosted by unrelated stimuli
The lack of a robust IFN response to HIV-1 in DCs is thought to be a major obstacle to vaccine development (Luban, 2012). Therefore, identifying cellular parameters that increase cGAS-STING signaling and unmask IFN responses to HIV-1 before integration could prove clinically beneficial. To determine if secondary stimulation could increase IFN production and DC activation during HIV-GFP infection, we infected DCs with HIV-GFP at low MOI and then challenged with a battery of classic innate agonists. Two agents that are known to stimulate IFN production, polyI:C and LPS, potentiated IFN and CD86 expression during HIV-GFP infection at concentrations below those needed drive robust IFN on their own (Figures S4A and S4B).
Surprisingly, upon testing several TLR agonists that are restricted to MyD88 signaling and typically do not lead to IFN production in myeloid cells (PAM2, PAM3, Flagellin, and R848), we found that these also “boosted” IFN production and cell activation during HIV-GFP infection (Figures S4A and S4B). In attempt to identify the stage of infection that enabled the IFN boost following MyD88 stimulation, we exposed DCs to HIV-GFP and antiretroviral drugs to inhibit reverse transcriptase (EFV or Zidovudine (AZT)), integrase (RAL), or protease (Amprenavir (AMP) or Saquinavir (SAQ)), and found that reverse transcriptase inhibitors, but not later-acting antiretrovirals or neutralizing antibodies to the type I IFN receptor (αIFNAR), blocked the ability of R848 to potentiate IFN (Figures 4A and 4B). R848 boosted IFN in a progressive fashion starting at 16 h after infection for both HIV-GFP and HIV-GFP + RAL conditions (Figures 4C, 4D). As expected, R848 stimulated NF-κB activity, but HIV-GFP at low MOI did not significantly impact NF-κB over the course of this assay (see also Figure S2B). The kinetics of the IFN boost appear to track with the timing of IRF3 phosphorylation (Figure S1D) and are in agreement with a model where HIV-1 reverse transcription products accumulate over the course of infection, trigger cGAS-STING activation, and prime type I IFN responses.
Figure 4. Cytoplasmic DNA primes robust type I IFN responses.

(A) Bioactive type I IFN from DCs that were infected with HIV-GFP at 0.5 MOI for 28 h in the presence of the antiretrovirals shown and stimulated overnight with R848 (3 μg/ml). n = 4 donors.
(B) IFNB quantified by ELISA in supernatants of DCs primed with HIV-GFP and boosted with R848 under the conditions shown. n = 3 donors
(C) Experimental design model for HIV-GFP “prime” and TLR “boost” time course.
(D) Bioactive type I IFN and NF-κB activity in supernatants from DCs treated as shown in (C) +/− RAL, boosting with vehicle control or R848 at the indicated times. n = 4 donors.
(E) Experimental design using cGAMP to recapitulate HIV-GFP priming.
(F) Heat maps of IFNB1, IFNL1, CXCL10, and IL1B expression as a dose response matrix using cGAMP and R848 as indicated in (E). Heatmaps represent qPCR data from 1 of 2 donors. (G) Bioactive type I IFN activity from DCs primed with 0.5 μg/ml 2,3-linked cGAMP for 7 h +/− EFV or RAL and boosted +/− R848, overnight. n = 4 donors.
(H) Bioactive type I IFN from DC supernatants primed with 3,3 linked cGAMP (0.5, 1, 2 μg/ml), R848 (0.3, 1, 3 μg/ml), IFNB (0.1, 0.3, 1 ng/ml), or IFNa2a (10, 30, 100 U/ml) and challenged overnight with R848 (3 μg/ml). n = 4 donors.
(I) Bioactive type I IFN activity from DCs treated with Vpx that were mock infected or infected with wild type CCR5-tropic HIV-1 for 72 h and challenged overnight +/− R848 (3 μg/ml). n = 8 donors. * = p<0.05
Panels with pooled data show mean +/− SEM. See also Figure S4.
Moreover, we found that HIV-mediated priming of IFN was dependent on Vpx (Figure S4C), supporting that hypothesis that sensing requires reverse transcription. R848 also boosted IFN after first priming DCs with the IN-D116A and ΔGag mutants (Figure S4D), which is consistent with partial sensing of HIV-1 at a point between reverse transcription and integration (Figures 1C and 1E). Notably, we found that HIV-mediated priming could be recapitulated by introducing low levels of the STING agonist, 2’,3’-linked cGAMP, which bypassed the requirement for reverse transcription and functioned independently of Vpx (Figures 4E; S4C). After first priming with cGAMP, stimulation of MyD88 with either R848 or PAM3 increased expression of IFNB1, IFNL1, and CXCL10 (Figures 4F; S4E), yet expression of IL1B was not impacted by cGAMP priming, suggesting that MyD88 stimulation enhances IFN signaling, but not vice versa. Priming with cGAMP and boosting with R848 increased bioactive type I IFN in DC supernatants by 1–2 log orders, and this effect was insensitive to reverse transcriptase inhibitors (Figure 4G). Similar to mammalian 2’3’-linked cGAMP, we found that bacterial 3’,3’linked cGAMP was also able to prime IFN responses (Figure 4H). Additionally, we found that R848 could not operate as both a “prime” and “boost” agent and DCs treated with recombinant type I IFNs were not susceptible to an R848 mediated boost in IFN production (Figure 4H).
Perhaps most noteworthy, is that R848 could trigger IFN production in DC cultures infected with CD4/CCR5-tropic, replication competent HIV-1, despite the virus failing to drive an IFN response on its own under these conditions (Figures 4I; S1F). As a control for the specificity of the IFN bioassay, reporter virus and other innate agonists did not stimulate IFN activity when directly added to indicator cells, illustrating that exposure to DCs is required (Figure S4F). Considering that HIV replication might increase the amount of cytoplasmic DNA accessible for sensing and consequently increase levels of cGAMP, we also questioned whether cGAMP could work as effectively as TLR agonists to boost IFN output. To test this, we primed DCs with low amounts of HIV-GFP before administering increasing amounts of cGAMP, which revealed that cGAMP is not as effective as PAM3 or R848 at potentiating type I IFN responses (Figure S4G). These results highlight how activation of unrelated pathways can potently unmask cell intrinsic IFN responses.
The cGAS-STING pathway is required before and after integration to prime IFN responses during HIV-1 infection in DCs
cGAS is reported to be the critical sensor for detecting retroviral cDNA (Gao et al., 2013), but several other sensors reportedly detect HIV-1 components in pDCs, CD4 T cells, and macrophages (Beignon et al., 2005; Gringhuis et al., 2017; Jakobsen et al., 2013; Monroe et al., 2014). These include the DNA sensor IFI16 (which, like cGAS, signals through STING), the RNA sensor DDX3 (which signals through MAVS), and TLR7/8 (which signal through MyD88). Additionally, the IFN-inducible Protein Kinase R (PKR), has been reported to facilitate IFN production downstream of adapter proteins (McAllister & Samuel, J Biol Chem 2009) and has a role in regulating the stability of IFNB1 mRNA (Schulz et al., 2010). To assess whether proteins in these pathways contribute to cGAS-STING-dependent immune responses in DCs, we perturbed their expression using shRNA and CRISPR/Cas9 technology. Knockdown of cGAS, but not knockdown of IFI16, MAVS, or PKR, inhibited the induction of CD86 and IFN in DCs during HIV-GFP infection (Figures 5A; 5B; 5C). Additionally, we observed that gene expression of ISG15 and CXCL10, were reduced in cGAS-knockdown cells during HIV-GFP infection + or – RAL (Figures 5D), suggesting that cGAS is required for sensing HIV-GFP before and after integration. Knockdown cells produced IFN when stimulated with cGAMP and responded as expected to stimulation with polyI:C or LPS (Figures 5E; S5A). Cells deficient in cGAS produced less IFN in response to polyI:C, as further evidence for cGAS having widespread roles in innate immunity (Schoggins et al., 2014).
Figure 5. The cGAS-STING axis is required for HIV-mediated priming of type I and type III IFN and induction of ISGs.

(A) Immunoblots of DC whole cell lysates after shRNA-mediated knockdown of the indicated targets.
(B) DCs modified by shRNA as in (A) were mock infected or challenged with HIV-GFP at day 4 for 48 h. GFP and CD86 levels were assessed by flow cytometry. Plots represent 1 of 3 donors. (MOI = 2)
(C) Bioactive type I IFN from DC supernatants infected with HIV-GFP (MOI = 2). n = 3 donors. (D) qPCR of ISG15 and CXCL10 expression in DCs that were transduced with control or cGAS shRNA and infected with HIV-GFP (MOI = 2) +/− RAL for 28 h.
(E) Bioactive type I IFN from shRNA-transduced DCs that were stimulated with cGAMP (5 μg/ml; 16 h). n = 2 donors.
(F) Flow cytometry of ISG15 vs GFP expression in THP-1 CRISPR cells after infection with HIV-GFP +/− RAL (MOI = 0.5)
(G) qPCR of CXCL10 expression in THP-1 CRISPR cells that were infected with HIV-GFP +/− RAL for 28 h.
(H) Bioactive type I IFN in supernatants from THP-1 CRISPR populations were either unprimed or primed with HIV-GFP+RAL (MOI = 2) for 28 h, then mock treated or boosted with PAM3 (100 ng/ml) for 4 h. n = 3.
Data show mean +/− SEM. See also Figure S5.
We sought an alternative model to support our findings since we were unable to achieve high efficiency knockdown for several pathway components in DCs, such as MyD88. THP-1 monocytic cells are competent for sensing cytoplasmic DNA, have been previously used to study sensing of HIV (Gao et al., Science 2013), and are amenable to CRISPR/Cas9 modification. While we concede that some elements of innate immune signaling are likely to differ between THP-1 cells and DCs, we were able to show that blocking integration leads to partial inhibition of the IFN response in THP-1 cells as it does in DCs (Figure S5B). Following lentiCRISPR disruption of cGAS, MAVS, MyD88, and STING in THP-1 cells (Figure S5C-D), only loss of cGAS or STING significantly impacted CXCL10 and ISG15 expression during HIVGFP infection (Figures 5F; 5G). When THP-1 cells were first primed with HIV+RAL and boosted for 1 h with the TLR agonist, PAM3, we could observe distinct contributions of cGAS-STING and MYD88 pathways to the induction of IFNB1, IFNL1, ISG15, and IL1B (Figure S5E). Importantly, these experiments support a role for MyD88 in TLR-mediated unmasking of type I IFN.
IRF3, but not IRF1, IRF5, or IRF7, sets the threshold for innate sensing of HIV-GFP and primes IFN responses
In agreement with our transcriptome and ATAC-seq analysis (Figure 2B; 2C; 3D), several publications suggest that IRF family transcription factors, such as IRF1, IRF3, IRF5, and IRF7 are important upstream regulators of the innate response to HIV (Doyle et al., 2015; Manel et al., 2010; Nasr et al., 2017). To pinpoint whether one or more of these IRFs controls the IFN response in myeloid cells, we generated CRISPR/Cas9-modified THP-1 cells (Figure 6A) and tested IFN and ISG output during infection with HIV-GFP. We found the majority of the IFN response, before and after integration, could be attributed to IRF3, whereas the loss of IRF1, 5, or 7, had no significant impact on the expression of IFNB1, IFNL1, or CXCL10 (Figures 6B; 6C). Cells deficient in IRF3 were also less sensitive to a PAM3-mediated IFN boost, but expression of TNF and IL1B were unaffected. Curiously, HIV-GFP infection led to partial induction of IL-1B, indicating that an IRF3-independent component of the innate response is engaged during replication. Similarly, IFN and ISG expression were not ablated in cells deficient in IRF3, most notably during PAM3 stimulation (Figures 6B; 6C), suggesting either residual IRF3 expression remained in these cells or unknown factors compensated for its loss.
Figure 6. IRF3, but not IRF1, IRF5, or IRF7 is required for IFN priming and induction of ISGs.

(A) Immunoblots of lysates from THP-1 populations modified using the lentiCRISPR system compared to empty vector control (LCV2).
(B) Flow cytometry of ISG15 vs GFP expression in THP-1 CRISPR cells 48 h after infection with HIV-GFP (MOI = 0.25, 0.5, 1).
(C) THP-1 CRISPR cells were primed with HIV-GFP+RAL or left unprimed (mock) for 28 h and then treated with vehicle or PAM3 (100ng/ml) for 1 h. Gene expression of the indicated targets was assessed by qPCR relative to GAPDH. n = 2 biological replicates with 2 technical replicates each.
Data show mean +/− SEM. See also Figure S6.
Knockdown of IRF3 in DCs reduced maturation during HIV-GFP infection (Figures S6A; S6B), supporting results from a previous study (Manel et al., 2010). In contrast, increasing levels of IRF3 by an overexpression vector potentiated CD86 induction, increased IFN output by an order of magnitude, and unmasked DC responses prior to HIV-GFP integration (Figures S6A; S6C). Knockdown of IRF3 ablated the ability of R848 to increase bioactive IFN in cell supernatants, but did not affect NF-κB reporter activity (Figures S6D; S6E). Overexpression of a phospho-deficient IRF3 that contained a serine to alanine mutation at residue 396 (S396A) did not potentiate type I IFN production (Figure S6F). Interestingly, R848 did not further increase IFN in conditions where wild-type IRF3 was overexpressed (Figures S6D and S6F), suggesting that the signal has either plateaued or there is a limited window of opportunity for TLR agonists to increase IFN output during the innate response to cytoplasmic DNA. Overexpression of IRF3 did not lead to detectable levels of bioactive IFN but was sufficient to increase baseline transcription of ISG15, CXLC10, and IFNB1 (Figure S6G). We could not detect phosphorylated IRF3 in mock-treated DCs that overexpressed IRF3; however, the intensity of phosphorylated IRF3 correlated with increased IFN signaling in cells treated with HIV-GFP, with and without RAL (Figure S6H), suggesting that the availability of IRF3 establishes the threshold for HIVdriven innate immune responses.
Following cGAS-STING-IRF3 priming, distinct signals emanate from MyD88-NF-κB to enhance IFN responses.
To further assess the molecular mechanisms that lead to MyD88-mediated unmasking of IFN responses, we explored whether TLR stimulation led to changes in the cGAS-STING signaling axis. As with HIV-GFP, priming with low concentrations of cGAMP resulted in phosphorylation of STING, TBK1, and IRF3 (Figure 7A). The TLR agonists R848 and PAM3 did not appreciably impact phosphorylation of STING or IRF3, but could phosphorylate TBK1 and NF-κB, which are known to be downstream of MyD88 (Figure 7A) (Liu et al., 2015). Moreover, phosphorylation of IRF3 was not impacted during the first hour of a TLR boost after cGAMP priming (Figure 7B), a time when IFNB1 expression is dramatically enhanced (Figure 4F). We next asked whether perturbation of NF-κB signaling impacted HIV-driven immune responses in DCs, since NF-κB is known to cooperate with IRF3 during an IFN response and is a major effector of MyD88 activation. Inhibition of NF-κB with Celastrol (Cel) reduced CD86 induction and IFN production when added as late as 8 h after HIV-GFP and did not adversely affect infection efficiency (Figures 7C; 7D).
Figure 7. NF-κB activity is necessary but not sufficient to boost IFN responses. Related to Figure 5.

(A) Immunoblots of DC lysates after administration of cGAMP (6 h; 1, 3, and 10 μg/ml), PAM3 (100 ng/ml; 15 and 90 min), or R848 (3 μg/ml; 15 and 90 min).
(B) Immunoblots of DC lysates primed with cGAMP (6 h; 1 μg/ml) or left unprimed, then mock treated or stimulated with R848 for 15, 30, or 60 min. Blots represent 1 of 2 donors.
(C) Flow cytometry plots of CD86 vs GFP expression in DCs infected with HIV-GFP for 48 h +/− Cel (0.5 μM), added at the indicated times after infection.
(D) Graphs of %CD86+ and bioactive type I IFN activity in DCs infected with HIV-GFP and treated with Cel as in (C) relative to infection without drug. n = 3 donors.
(E) DCs were left unprimed or primed with cGAMP (6 h, 1 μg/ml) or HIV-GFP (28 h, MOI 1) and then challenged overnight with R848 +/− Cel, TNFαβ (5, 50, 500 ng/ml), IL-1ββ (0.03, 0.3, 3 ng/ml), or Thap (0.1, 1, 10 nM). Flow cytometry histograms represent 1 of 4 donors.
(F) NF-κB activity from DC supernatants under conditions shown, treated as in (E).
(G) Bioactive type I IFN from DC supernatants under conditions as in (E).
(H) CD80 MFI (I) in DCs primed with cGAMP and treated as in (E). n = 4 donors.
Data show mean +/− SEM. See also Figure S7.
To understand if conventional proinflammatory molecules could unmask IFN responses, we then tested, interleukin-1 beta (IL-1β), tumor necrosis factor alpha (TNFα), and Thapsigargin (TG), for their ability to potentiate IFN and DC maturation. We found that IL-1β, which triggers NF-κB through a MyD88-dependent pathway, was able to enhance CD86, NF-κB, and IFN responses in a manner similar to TLR agonists after priming with low levels of cGAMP or HIVGFP (Figures 7E-7H). In contrast, TNFα and the calcium-mobilizing agent, TG, which have previously been shown to increase IFN responses (Venkatesh et al., Immunity 2013; Liu & Smith et al., J Immunol 2012), were able to potentiate CD80 and CD86 (Figures 7E; 7H), but they did not significantly increase type I IFN activity above background (Figure 7G). Thus, these data support that activation of NF-κB is necessary for IFN signaling, yet indicate that nonspecific inflammation is insufficient to boost IFN responses in this system. In summary, our data indicate that during lower levels of STING activation, distinct, specific signals emanating from MyD88 can augment IFN production and innate activation in myeloid cells.
Discussion
In this study we set out to comprehensively study the innate response to HIV-1 in DCs in attempt to elucidate the parameters that lead to robust IFN responses. We have found that myeloid cells respond to HIV-1 before and after the virus integrates into the host genome, extending the findings of several publications (Gao et al., 2013; Lahaye et al., 2013; Manel et al., 2010; Nasr et al., 2017). Curiously, it is known that HIV-2, which is considered less pathogenic than HIV-1, is efficiently sensed by DCs prior to integration (Lahaye et al., 2013). This property has been attributed to the HIV-2 capsid and it was not thought that HIV-1 shared this feature. While sensing of HIV-1 before integration occurs at lower efficiency, we find that IFN responses are amplified once the virus replicates or when DCs are stimulated with a secondary innate immune signal (Figures S7A; S7B).
How does virus replication lead to enhanced IFN responses? One hypothesis is that newly synthesized capsid protein (Gag) interacts with cyclophilin A and existing, non-integrated cDNA to unmask cGAS-dependent IFN signaling (Manel & Littman 2011; Lahaye et al., 2013). Yet, an alternative hypothesis is that the potentiation of IFN signaling that accompanies virus replication is driven by cGAS-dependent sensing of collateral damage occurring in the host cell. We note in this study that several cellular processes were impacted during HIV replication, such as mitochondrial function, lipid metabolism, retinoic acid signaling, and death receptor signaling (Figure 2B and Figure S2B). Perturbations in mitochondrial function and escape of mitochondrial DNA into the cytosol are known to drive cGAS-mediated IFN signaling (West et al., 2015). Replication of dengue and herpesviruses have recently been shown to trigger mitochondrial damage and in turn, activation of cGAS (Aguirre et al., 2017; West et al., 2015). It has also been reported that in some cell types, membrane fusion events lead to IFN responses during virus infection (Decalf et al., 2017; Holm et al., 2012). Similarly, alterations in lipid metabolism are known to engage IFN responses through cGAS and STING independently of virus infection (York et al., 2015). It is unclear how these processes might be affected during HIV infection, but we speculate that production of HIV-1 Gag or Gag-Pol is linked with altered mitochondrial function, lipid metabolism, or other stress responses and influences cGAS signaling
Here, we report that sensing of HIV-1 is linked with modification of host chromatin and “priming” of IFN responses. It has long been known that transcription factors in the IRF family, in combination with NF-κB, are critical for IFN induction (Sato et al., 1998; Thanos and Maniatis, 1995; Yoneyama et al., 1998). Since IRF and NF-κB binding sites exist in the HIV LTR, it is worth considering the possibility that the virus evolved to exploit activation of IFN and inflammatory pathways to increase efficiency of replication (Doyle et al., 2015). Consistent with this idea is the observation that in the chronic phase of HIV pathogenesis in humans and in nonhuman primate models there is a positive correlation between IFN levels, immune activation, and viral load (Fraietta et al., 2013). If sensing of HIV-1 leads to open chromatin at IRF and NFκB binding sites (Figure 3), does this benefit the host or the virus? Chromatin modifications might inform the nature of an antiviral innate response, but perhaps these changes facilitate integration and replication. Intriguingly, retroviral integration is known to be non-random (Sultana et al., 2017) and there is evidence that IFN response genes have been rewired through evolution by endogenous retroviruses (Chuong et al., 2016).
We propose that low levels of cGAS-STING stimulation are sufficient to trigger activation of select IRF3-dependent genes, but higher levels of cGAS-STING activity, alone or in combination with another inflammatory pathway, is required for robust IFN signaling, DC maturation, and induction of a fuller arsenal of IRF- and NF-κB-dependent genes. As a case in point, pre-integration material from a modest MOI is sufficient to trigger expression of IRF-dependent genes such as ISG15, IFIT1, and IFIT2 (Figure 2A, S2C). HIV replication correlates with stronger induction of genes that are codependent on IRF3 and NF-κB (Figure 2A; Table S1; eg: IFNB1, CCL5, GBP5, CXCL10) (Tong et al., 2016). As a corollary, MyD88 stimulation does not induce early expression of ISG15 (Figure S5E; 6C), yet it potentiates expression of IRF3- and NF-κB-dependent genes (Figures 4F; S5E; 6C). Future studies are needed to define the transcription factor requirements that set thresholds in the innate response, particularly with respect to specific IFN and ISG classes.
It is also essential to consider that cross-regulation or cross-interference of IFN signaling have been documented in a number of cases (Cao, 2016). In plasmacytoid DCs, IRF3-mediated induction of SOCS1 can inhibit a TLR7 -> MyD88 -> IRF7 -> IFN-alpha/beta pathway (Yu et al., 2016). In our experimental system, we find that monocyte-derived myeloid DCs, which do not express high levels of TLR7 or typically produce an IFN response downstream of MyD88, will express high amounts of IFN if MyD88 activation follows IRF3 activation. It is reasonable to assume that differences in protein expression levels, the timing of stimulation, and cell type differences in autocrine/paracrine feedback loops may affect cross-regulation of IFN signaling to influence the magnitude and direction of immune responses. Furthermore, it will be important to determine whether specific DC subtypes, such as those recently redefined (Villani et al., 2017), behave similarly to monocyte-derived DCs with respect to priming and elaboration of IFN signaling. This is particularly relevant given that DC subtypes differ in their ability to restrict virus infection and formulate immune responses (Silvin et al., 2017).
In summary, we have clarified how the HIV-1 life cycle intersects with the innate response in myeloid cells, demonstrating that the incoming reverse transcribed cDNA is detected at low levels, leading to “priming” of IFN responses that can then be amplified during virus replication or following secondary inflammatory stimulation. Further exploration of the cellular parameters that regulate innate sensing of HIV will likely improve our ability to drive effective antiviral immune responses in DCs as we uncover additional auxiliary modes of IFN regulation.
STAR Methods
CONTACT FOR REAGENT AND RESOURCE SHARING
Further information and requests for resources and reagents should be directed to and will be fulfilled by the Lead Contact, Jarrod Johnson (jarrod.johnson@cidresearch.org).
EXPERIMENTAL MODEL AND SUBJECT DETAILS
Cell lines and blood-derived dendritic cells
For generation of monocyte-derived immature DCs, we acquired leukocytes from de-identified normal human donors (Bloodworks Northwest). Leukocytes were collected under the Bloodworks Donor Products for Research and Test Development/Standardization – External Investigators Protocol (Western Institutional Review Board - WIRB protocol 20150119) and informed consent was obtained from all subjects. In accordance with the IRB, samples were deidentified and donors remain anonymous, so the authors did not receive personal identifying information and cannot report on their sex, gender, or age. Peripheral blood mononuclear cells (PBMCs) were layered over Ficoll-Paque Plus (GE Healthcare). CD14+ monocytes from PBMC buffy coats were isolated with anti-human CD14 magnetic beads (Miltenyi) and cultured in RPMI (Thermo Fisher) containing 10% heat-inactivated fetal bovine serum (FBS, Peak Serum, Inc), 50 U/ml penicillin, 50 μg/ml streptomycin (P/S, Thermo Fisher), 10 mM HEPES (Sigma), 2-Mercaptoethanol (Thermo Fisher), and 2 mM L-glutamine (Thermo Fisher), in the presence of recombinant human GM-CSF at 10 ng/ml and IL-4 at 50 ng/ml (Peprotech). We tested multiple batches of FBS and selected lots that led to minimal baseline induction of CD86 over the course of DC differentiation. Fresh media and cytokines were added to cells (40% by volume) on day 1 or day 2 after isolation. On day 4, cells were collected, resuspended in fresh media with cytokines used for infection or stimulation. Immature DCs on day 6 were routinely assessed by flow cytometry surface marker staining to be CD11c+ (Thermo Fisher Cat# 17–0116-42, RRID:AB_1659668), HLA-DR+ (BioLegend Cat# 307607, RRID:AB_314685), DC-SIGN+ (R and D Systems Cat# FAB161P, RRID:AB_357064), and CD86- (eBioscience Cat# 15–0869-42 RRID:AB_11042003).
293FT female cells (Life Technologies Cat# R70007, RRID:CVCL_6911) and HeLa female cells (ATCC Cat# CRL-7923, RRID:CVCL_0030), were cultured in Dulbecco’s modified Eagle’s medium (DMEM, Thermo Fisher) that was supplemented with 10% FBS, P/S, 10mM HEPES, and supplemented with 0.1 mM MEM non-essential amino acids (Thermo Fisher), 6 mM glutamine, and 1 mM sodium pyruvate (Thermo Fisher).
HL116 male cells were cultured in DMEM supplemented with 10% FBS, P/S, 10mM HEPES, 0.1 mM MEM non-essential amino acids, 6 mM glutamine, 1 mM sodium pyruvate, and HAT supplement (Thermo Fisher; hypoxanthine (5 mM), aminopterin (20 μM) and thymidine (0.8 mM)) diluted 1:50 as recommended.
THP-1 male monocytic cells (ATCC Cat# TIB-202, RRID:CVCL_0006) were cultured in RPMI with 10% heat-inactivated fetal bovine serum, 50 U/ml penicillin, 50 μg/ml streptomycin, 10 mM HEPES, 2-Mercaptoethanol, and 2 mM glutamine and kept at a density between 250,000 and 1e6 cells per ml.
All cells were maintained at 37°C and 5% CO2. All c ell lines were thawed from early passages, kept in culture no longer than 4 weeks (239FTs) or 8 weeks (HeLa, HL116, and THP-1), and were regularly tested for mycoplasma contamination (every 6 months).
Cell line experiments were performed on biological replicates from independent cultures and DC experiments were performed using biological replicates from blood-derived cells from 2 to 28 individual donors, depending on the figure panel. Information for specific experiments can be found in the figure legends.
METHOD DETAILS
Plasmids and mutagenesis
HIV-GFP is env- vpu- vpr- vif- nef-, with the GFP open reading frame in place of nef, and has been used previously to interrogate immune responses in human DCs (Manel et al., 2010). Virus like particles packaging Vpx were generated from the plasmid pSIV3+, which is based on SIVmac251, GenBank acc. no. M19499, has been described elsewhere (Mangeot et al., 2000). The plasmid used for production of CD4/CCR5-tropic HIV-1 contained the YU-2 envelope in a replication competent TN6/NL4–3 backbone (Diskin et al., 2013). Overexpression vectors for IRF3 and IRF3-S396A and shRNA vectors not purchased from Sigma were generated in-house using overlap extension mutagenesis techniques to modify LKO.1 or LKO-GFP. Primers for cloning and mutagenesis are listed in Table S3.
lentiCRISPR sgRNAs (single guide RNAs) were designed using the E-CRISP algorithm (http://www.e-crisp.org/E-CRISP/) selecting for high efficiency and single target specificity with positioning near the first translated exon. Oligos spanning the sgRNA sequence were annealed and ligated into the lentiCRISPRv2 backbone (Addgene plasmid #52961, Gift from Feng Zhang). To generate the parental control vector (LCV2), lentiCRISPRv2 was digested with BsmBI and re-ligated to remove the 2 kb stuffer. All lentiviral constructs were transformed into Stbl3 bacteria (ThermoFisher) for propagation of plasmid DNA. All plasmids were prepped and purified using a Nucleobond Xtra Maxi Kit (Takara). Coding sequences of overexpression constructs, shRNA hairpins, and sgRNAs were confirmed by automated sequencing (Genewiz). The target sequences for the shRNA and sgRNA constructs used in this study are listed in Table S3.
Virus and virus-like particle production
Recombinant lentiviral vectors, HIV-GFP reporter virus, and replication competent CD4/CCR5-tropic HIV-1 were produced by transfection into 293FT cells. Cells were seeded onto poly-L-lysine (MP Biomedicals) -coated 15 cm plates the day before transfection to be 70–80% at the time of transfection. Cells were transfected with a total of 22.5 μg DNA using PEImax (Polysciences, Inc.) at a ratio of 1:2 (DNA:PEI). For lentiviral vectors, plasmid amounts were 3.4 μg CMV-VSV-G (Addgene plasmid #8454), 9 μg psPax2 (Addgene plasmid #12260), and 10.1 μg transgene (LKO.1 controls, shRNA construct, overexpression vector, or lentiCRISPR construct). For HIV-GFP and IN-D116A (Manel et al., 2010) plasmid amounts were 3.4 μg CMVVSV-G and 19.1 μg HIV cassette. ΔGag-GFP was produced in the presence of a helper construct to provide Gag (Manel et al., 2010). Virus-like particles containing Vpx were produced using 3.4 μg CMV-VSV-G and 19.1 μg pSIV3+ (Mangeot et al., 2000). The following morning after transfection, cells were washed once and replaced with fresh media. Supernatants were harvested after another 32 h, passed through 0.45 μm syringe filters (Corning), and treated with Benzonase (25 U/ml, 1 h at 37 °C, EMD Millipore) to remove residual plasmid DNA. Supernatants of HIV-GFP reporters and lentiviral vectors were transferred to thinwall Conical tubes (Beckman) and concentrated by ultracentrifugation at 24 K rpm for 2 h at 4 °C in a SW28 swing-bucket rotor (Beckman). Pellets were resuspended in DC media without cytokines and insoluble material was clarified by centrifuging at 500 rcf for 4 min. 50X concentrated viral stocks were frozen at −80 °C, titered on 293FT and THP-1 cells, and p24 concentrations determined by ELISA (ZeptoMetrix).
Perturbation of DCs and cell lines
DCs were modified by lentiviral shRNA and overexpression constructs similar to previously described protocols (Manel et al., 2010). CD14+ monocytes were isolated from whole blood by magnetic bead selection and were resuspended in complete DC media containing GM-CSF (10 ng/ml), IL-4 (50 ng/ml), and polybrene (Sigma, 1 μg/ml) and aliquotted to 10 cm dishes using 6 × 10^6 cells in 9 ml media. Supernatant containing virus-like particles packaging Vpx was added to overcome the block to reverse transcription (1 ml supernatant for 1 × 10^7 cells) prior to adding control, shRNA, or overexpression lentiviral vectors. 150 μl of concentrated viral stocks were sufficient to transduce 6 × 10^6 CD14+ cells at >98%. shRNA clones for targeting IRF3, cGAS, MAVS, and PKR, were used independently. For targeting IFI16, 75 μl of vector preps from two shRNA clones were pooled to improve knockdown.
THP-1 monocytic cells were transduced with shRNA or lentiCRISPR constructs in 6 well cluster plates using 1 × 10^6 cells per well in 2 ml media with polybrene (2 μg/ml). Concentrated viral stocks were added for shRNA transduction (25 μl per well) or lentiCRISPR transduction (250 μl per well). Two days after transduction, cells were put under selection with puromycin (1 μg/ml, Invivogen) for 1 week and then puromycin-resistant populations were allowed to expand. shRNA-transduced cells were used beginning 1 week after selection and lentiCRISPRtransduced cells were used beginning 2–3 weeks after selection. Independent transductions were performed for biological replicates. Knockdown, overexpression, or disruption of target gene expression was confirmed by immunoblot or Tracking of Indels by Decomposition (TIDE) sequencing analysis (https://tide-calculator.nki.nl/).
Infections and stimulations
For experiments with HIV-GFP, supernatant containing virus-like particles packaging Vpx was added to CD14+ cells at day 0 (1 ml supernatant for 1 × 10^7 cells). For experiments with cGAMP, Vpx was only added in DCs where indicated in the figure legends. DCs were infected with HIV-GFP or virus mutants normalized by p24 levels between day 4 and day 6 after differentiation. DCs were counted on day 4 and resuspended at 800,000 cell per ml in fresh medium with GM-CSF, IL-4, and polybrene (1 μg/ml) and then reseeded into appropriate culture vessels. For most assays, DCs were plated in round bottom 96 well plates at 60,000 cell per well in 75 μl. Infections and stimulations were performed by diluting virus in DC media (without cytokines or polybrene) to a final volume normalized to control (150 – 175 μl per well), as indicated in the figure legends. For experiments with replication competent HIV-1, cells were inoculated with virus at 2.5 ng/ml on day 4 and then media was exchanged on day 5 and again on day 6. Antiretroviral drugs (NIH AIDS Reagent Program or Selleck Chemicals) were added prior to virus infection at the following concentrations: EFV (20 nM); AZT (100 μM); RAL (25 μM); SAQ (5 μM); AMP (5 μM). Celastrol (Invivogen) was used at 0.5 μM. Innate and inflammatory stimuli -- polyI:C (InvivoGen); 2’3’-cGAMP (InvivoGen); 3’,3’ cGAMP (InvivoGen); TNFα (Peprotech); recombinant IL-1β (Peprotech); recombinant IFN-β (Peprotech); recombinant IFNa2a (Thermo Fisher); PAM3 (EMC microcollections); PAM2 (EMC microcollections); Flagellin (InvivoGen); R848 (InvivoGen); LPS (List Biological Laboratories, INC.), and Thapsigargin (Sigma) -- were used as indicated in the figure legends. We note that cGAMP was directly added to media at the indicated concentrations. Phagocytic cells such as monocytederived DCs and THP-1 monocytic cells will readily internalize cGAMP we found that direct administration reduced technical variability compared to transfection. Similar to experiments with DCs, THP-1 monocytic cells were infected in the absence of Vpx at a density of 500,000 cell per ml in complete RPMI medium with polybrene (5 μg/ml).
Flow cytometry
Infected or stimulated DCs were washed with phosphate buffered saline (PBS, Corning) and then exposed to LIVE/DEAD violet (ThermoFisher) in PBS for 15 min at 4 °C in the dark. Cells were either simultaneously stained for surface markers or first washed with PBS and then stained in FACS buffer containing 1% Bovine Serum Albumin (BSA, Roche) and 1 mM EDTA in PBS for 15–30 min in the dark at 4 °C. Cells were t hen washed with PBS and fixed with 0.5% paraformaldehyde (Electron Microscopy Sciences) diluted in PBS. Cells were either sorted on a FACSAria II or analyzed on an LSR II flow cytometer (BD Biosciences). For intracellular staining using anti-human ISG15 (R&D Systems) in THP-1 monocytic cells, cells were first exposed to LIVE/DEAD violet as described above, washed in PBS, then fixed and permeabilized using a cytofix/cytoperm kit (BD Biosciences), and stained according to the manufacturers instructions. Cells were washed and resuspended in PBS with 1% BSA and data were acquired on an LSR II flow cytometer (BD Biosciences) and analyzed using FlowJo software (FlowJo LLC).
Nucleic acid isolation and quantitative PCR
For quantitation of viral cDNA, 500,000 DCs were seeded in 24 well plates and infected with HIV-GFP in the presence of Vpx and in the absence or presence of RAL and EFV. Infected DCs were collected in 1.5 ml tubes, washed 1X with PBS and DNA was extracted using a QIAmp DNA mini kit (Qiagen). Reverse transcription products were quantified using primers that are specific for the LTR and normalized to human mitochondrial gene ND5. For quantitation of host gene expression, 50,000 to 200,000 DCs were lysed in TRIzol reagent (Thermo Fisher) and RNA was isolated according to the manufacturer’s instructions. Two sequential chloroform extractions were performed, Glycoblue (Thermo Fisher) was added as a carrier, and RNA was precipitated with isopropanol and then washed with 75% ethanol. cDNA was converted using Superscript IV (ThermoFisher). Qauntitative PCR reactions were carried out using TaqMan primer probes (ABI) and TaqMan Fast Universal PCR Master Mix (ThermoFisher) in a CFX96 thermocycler (BioRad) in a volume of 10 μl according to the following cycling conditions: 50 °C for 2 min, 95 °C for 2 min, then 50 cycles each of 95 °C for 3 sec, to 60 °C for 30 sec, followed by 95 °C for 5 sec. A melting curve analysis was then per formed going from 65 °C to 95 °C in 0.5 °C intervals every 5 sec. Data were plotted as expr ession relative to GAPDH x 1000.
Microarrays
Monocyte-derived dendritic cells from two unique donors that had been treated with virus-like particles packaging Vpx were infected with HIV-GFP in the presence or absence of RAL in a time course for 0, 8, 16, 20, 24, 28, 32, and 40 h. The time course was performed in reverse order such that all samples were harvested at the same time on day 6 after DC differentiation. Mock-infected samples or samples with RAL only, were treated with Vpx and DC media in parallel with samples that received HIV-GFP for 8 or 40 hours, respectively. Purified RNA was labeled and hybridized to SurePrint G3 8×60K Microarrays (Agilent) and data was acquired at the Institutes for Systems Biology. Probe sequences were mapped against the Ensembl transcript database (ensembl.org, GRCh37.74) and sequences that mapped to more than one gene or had more than 5 mismatches from the database sequence were removed for a total of 37,623 unique probes. Probe-specific logarithmically transformed expression was quantilenormalized. Duplicate probe sequences were averaged. Gene-specific expression was computed by using the probe that showed the highest average expression across all samples in cases in which multiple probes mapped to a single gene for a total of 26,319 gene-specific probes. Expression was modeled as the linear function, Y = b0 + b1*timeHIV + b2*timeHIV*RAL, where timeHIV represents the time since HIV infection and timeHIV*RAL represents the interaction between HIV infection and drug treatment. Only samples with time since infection up to 32 hours were included in the model. Statistical significance of the coefficients were computed with the LIMMA R package (https://bioconductor.org/packages/release/bioc/html/limma.html). p-values were adjusted for multiple hypothesis testing with the Benjamini-Hochberg method for controlling the false discovery rate. Genes for which the time coefficient had an FDR < 0.001 and fold change range of mean log2 signal > 1.0 were selected for a total of 1,560 genes that were plotted by heat map.
ATAC-seq
DCs from three unique donors were infected in the presence of Vpx for 16, 32, or 48 h with or without RAL. The time course was performed in reverse order such that all samples were harvested at the same time on day 6 after DC differentiation. Cells were stained for LIVE/DEAD violet and CD86 to assess activation status and then all live cells were sorted on a FACSAria II (BD Biosciences). 50,000 sorted DCs from each condition were immediately prepped for ATACseq (Buenrostro et al., 2013). Cells were pelleted by spinning at 500 g for 5 min at 4 °C. Cells were washed in cold PBS and centrifuged again at 500 g for 5 min at 4 °C. Cell pellets were lysed in cold lysis buffer (10 mM Tris-HCl, pH 7.4, 10 mM NaCl, 3 mM MgCl2 and 0.1% IGEPAL CA-630) and immediately spun at 500 g for 10 min at 4 °C. The nuclear pellet was used directly for the transposition reaction by resuspending in a reaction mix (20 μL 2× TD buffer, 2 μL Tn5 transposase (Nextera DNA Library Prep Kit, Illumina) and 18 μL nuclease-free water). Transposition was performed for 30 min at 37 °C and sample DNA was purified using a MinElute kit (Qiagen).
Library fragments were amplified by PCR using NEBNext PCR master mix (New England Biolabs) and custom Nextera primers (Table S3) using the following conditions: 72 °C for 5 min; 98 °C for 30 s; and then cycling at 98 °C for 10 s, 63 °C for 30 s and 72 °C for 1 min. To stop amplification before saturation in order to reduce bias, we monitored the PCR reaction using SYBR Green (Thermo Fisher) -based qPCR. Samples were cycled an average of 15 times. Libraries were sequenced on a NextSeq 500 (Illumina) using a 150 cycle high output kit. Unique sequence read pairs were aligned to a combined genome including human chromosomes (hg19), HIV (laboratory construct highly similar to NY5/BRU recombinant clone pNL4–3, GenBank ID = M19921.2) and SIV (isolate Mm251, GenBank ID = M19499.1) sequences using GSNAP (http://research-pub.gene.com/gmap/) and stripping off adapter sequences in a pairwise manner. Only pairs that aligned uniquely and concordantly to non-mitochondrial human chromosomes were retained. Start and end positions of the sequences were adjusted to extend 4 and 5 base pairs respectively to account for transposase adapter insertion (see Buenrostro et al., 2013).
Peak calling was performed with MACS2 (2.1.0) using the start and end locations of the pairs to define fragment lengths. “Blacklisted” regions of known artificially high signal as defined by the Human ENCODE project (www.encodeproject.org/annotations/ENCSR636HFF) were filtered out of peak regions. Bigwig files for each biological group were generated by running MACS2 (https://github.com/taoliu/MACS) peak calling on combined alignments from all samples in the group and outputting a normalized bedgraph file followed by file conversion using the bedGraphToBigWig program (genome.ucsc.edu). The R package DiffBind (http://bioconductor.org/packages/release/bioc/vignettes/DiffBind/inst/doc/DiffBind.pdf) was used to define consensus peak regions across samples and assign counts. Differential peak counts and significance were computed using the R package edgeR (https://bioconductor.org/packages/release/bioc/html/edgeR.html). Promoter regions were defined as 2000 bps upstream from transcription start sites as defined in Ensembl (ensembl.org, GRCh37 v. 75) to 1000 bps downstream.
Promoter scanning and pathway enrichment
Quantile normalized array data was uploaded to Ingenuity Pathway Analysis software (Qiagen) and for each HIV-GFP time point from the array the top 10% of differentially expressed genes compared to mock infected samples at t = 0 were selected for a core analysis. A comparison analysis was performed between all HIV-GFP and HIV-GFP +RAL samples and the top canonical pathways with positive z-scores (indicated in Figure 2) were shown as spider plots. Similarly, gene-associated peaks from ATAC-seq that were differentially accessible compared to mock (p < 0.05) were fed into Ingenuity Pathway Analysis software to perform a comparison analysis. Predicted Upstream Regulators, associated Diseases and Biological Functions, and Canonical Pathways were displayed as heat maps and sorted based on z scores for HIV-GFP compared to mock at 48 h. Additionally, the top induced or repressed transcripts identified from the linear regression analysis of our microarray data across all time points (FDR <0.001) were uploaded as unweighted genes into Enrichr (http://amp.pharm.mssm.edu/Enrichr/). The top scoring Gene Ontology (GO) Biological Processes, Reactome pathways, KEGG pathways, and promoter-associated transcription factor motifs from ENCODE and chromatin enrichment analysis (ChEA) consensus transcription factor motifs were plotted as –log(adjusted p-value)*z-score.
Immunoblotting
Samples were lysed in SDS sample buffer (2% SDS, 50mM Tris, 12.5mM EDTA) containing HALT protease inhibitors (Thermo Fisher), heated for 5 min at 75 °C, briefly sonicated in a water bath bioruptor, and protein concentrations were determined using a reducing agent-compatible BCA assay (Thermo Fisher) according to the manufacturer’s instructions. Equal amounts of protein (typically 10–15 μg) were loaded with LDS loading buffer (Life Technologies) and separated on 4–12% gradient poly-acrylamide Bolt gels (Thermo Fisher). Proteins were transferred to nitrocellulose membranes, blocked using 2.5% bovine serum albumin (Roche) in Tris buffered saline (TBS) with 0.5% tween. Blots were incubated with primary antibodies from Cell Signaling: IRF3 (Cat# 4302S, RRID:AB_1904036); p-IRF3 (Cat# 4947S, RRID:AB_823547); STAT1 (Cat# 9172P, RRID:AB_10831362); p-STAT1 (Cat# 9167S, RRID:AB_561284); IRF7 (Cat# 13014); TBK1 (Cat# 3504, RRID: AB_2255663); p-TBK1 (Cat# 5483, RRID:AB_10693472); IRF1 (Cat# 8478, RRID:AB_10949108); STING (Cat# 13647); p-STING (Cat# 85735); IRF5 (Cat# 13496); MAVS (Cat# 3993, RRID:AB_823565); MYD88 (Cat# 4283S, RRID:AB_10547882); IFI16 (Cat# 14970); cGAS (Cat# 15102); p-NF-kB S536 (Cat #3033, RRID: AB_331284); p-NF-kB S468 (Cat# 3039, RRID:AB_330579); NF-kB (Cat #8242, RRID: AB_10859369); Histone H3 (Cat# 4499, RRID:AB_10544537); and GAPDH (Cat# 5174, RRID:AB_10622025). After incubating blots overnight at 4 °C, or for at least 1 h at room temp, they were washed with TBS/tween, then incubated with the corresponding HRP-conjugated anti-mouse or anti-rabbit secondary antibodies (Santa Cruz: Cat# sc-2004, RRID:AB_631746; Cat# sc-2005, RRID:AB_631736) for 1 h at room temperature. Blots were then washed in TBS/tween, reacted with Wesfemto ECL kit (Thermo Scientific), and developed using a FluorChem E Imager (Protein Simple).
Nuclear and cytoplasmic fractionation
500,000 immature DCs were plated into 24 well plates and mock treated or infected with HIVGFP in the presence or absence of antiretroviral drugs as indicated in the figure legends. To minimize batch effects for the time course, cells were treated in reverse order and harvested at the same time. Cells were transferred to 1.5 ml tubes, centrifuged at 600 rcf at 4 °C, and subcellular fractions were isolated using a Nuclear/Cytosol Fractionation Kit (MBL International) following the manufacturers instructions except that nuclear and cytosol extracts were prepared in 60 and 120 μl volumes respectively, in buffers containing HALT protease and phosphatase inhibitors (Thermo Fisher). Protein concentrations in fractions were determined by BCA and prepared for immunoblot as described above.
Assays for type I IFN and NF-κB
IFN activity in supernatants from infected or stimulated cells were assayed with HL116 cells that contain a luciferase reporter under control of the IFN-inducible 6–16 promoter. Supernatants were exposed to 20,000 HL116 cells in 96 well plates for 7 h, lysed in passive lysis buffer, and scored for luciferase activity (Promega). A standard curve for IFN activity was generated from serial dilution of recombinant human IFNa2a, with HL116 cells responding in a linear range between 2 and 200 U/ml of IFN. IFN-beta in DC supernatants was also detected by ELISA (Invitrogen) according to the manufacturers instructions.
An NF-κB reporter cell line was generated by transducing HeLa cells with a lentivirus that carries firefly luciferase driven by NF-κB response element, pGreenFire1-NF-κB (System Biosciences) and selecting stable cell populations with puromycin (1 μg/ml) (Invivogen). Supernatants from infected DCs were exposed to 20,000 NF-κB reporter cells in 96 well plates for 7 h, lysed in passive lysis buffer, and scored for luciferase activity (Promega).
QUANTIFICATION AND STATISTICAL ANALYSIS
Statistical tests were performed as indicated in the figure legends or otherwise using Prism 6.0 (GraphPad) to calculate a two-tailed t test using paired samples and setting an alpha value of 0.05. In this study, n is defined in the figure legends and represents the number of biological replicates performed, ie., the number of unique donors for DC experiments or the number of independent, non-technical replicates for THP-1 experiments. Donors were excluded from the study if after differentiation in FBS, unstimulated DCs displayed high CD86 (>40%+) at baseline. For Figure 1, a power law calculation was performed to determine that a sample size of 20 unique donors was required to establish statistical significance for differences in CD86 between RAL and control samples, assuming a population standard deviation of +/−15% CD86 (Figure 1D).
DATA AND SOFTWARE AVAILABILITY
The array data have been deposited in the Gene Expression Omnibus (GEO) database under ID code GSE100374. The ATAC-seq data have been deposited in the GEO database under ID code GSE100376. Both can be accessed from the GEO series code GSE100377.
KEY RESOURCES TABLE
| REAGENT or RESOURCE | SOURCE | IDENTIFIER |
|---|---|---|
| Antibodies | ||
| Anti-Human CD86 (B7-2) PE-Cyanine5 | eBioscience | Cat# 15-0869-42 RRID:AB_11042003 |
| Anti-Human CD11c-APC | Thermo Fisher | Cat# 17-0116-42, RRID:AB_1659668 |
| Anti-Human HLA-DR PE-Cyanine5 | BioLegend | Cat# 307607, RRID:AB_314685 |
| Anti-Human DC-SIGN PE | R&D Systems | Cat# FAB161P, RRID:AB_357064 |
| Anti-CD80 Monoclonal Antibody, FITC Conjugated, Clone L307.4 | BD Biosciences | BD Biosciences Cat# 557226, RRID:AB_396605 |
| Anti-Human ISG15/UCRP PE-conjugated Antibody | R&D Systems | Cat# IC8044P |
| Rabbit monoclonal anti-IRF3 (D83B9) | Cell Signaling Technology | Cat# 4302S, RRID:AB_1904036 |
| Rabbit monoclonal anti-phospho-IRF3 (Ser396) Clone 4D4G | Cell Signaling Technology | Cat# 4947S, RRID:AB_823547 |
| Rabbit monoclonal anti-phospho-STAT1 (Tyr701) (58D6) | Cell Signaling Technology | Cat# 9167S, RRID:AB_561284 |
| Rabbit monoclonal anti-STAT1 Antibody | Cell Signaling Technology | Cat# 9172P, RRID:AB_10831362 |
| Rabbit monoclonal anti-IRF7 (D2A1J) | Cell Signaling Technology | Cat# 13014 |
| Rabbit monoclonal anti-TBK1 | Cell Signaling Technology | Cat# 3504, RRID: AB_2255663 |
| Rabbit monoclonal anti-phospho-TBK1 (Ser172) (D52C2) | Cell Signaling Technology | Cat# 5483, RRID:AB_10693472 |
| Rabbit monoclonal anti-IRF1 (D5E4) XP | Cell Signaling Technology | Cat# 8478, RRID:AB_10949108 |
| Rabbit monoclonal anti-STING (D2P2F) | Cell Signaling Technology | Cat# 13647 |
| Rabbit monoclonal anti-phospho-STING (Ser366) | Cell Signaling Technology | Cat# 85735 |
| Rabbit monoclonal anti-IRF5 (E1N9G) | Cell Signaling Technology | Cat# 13496 |
| Rabbit monoclonal anti-MAVS | Cell Signaling Technology | Cat# 3993, RRID:AB_823565 |
| Rabbit monoclonal anti-MyD88 (D80F5) | Cell Signaling Technology | Cat# 4283S, RRID:AB_10547882 |
| Rabbit monoclonal anti-IFI16 (D8BST) | Cell Signaling Technology | Cat# 14970 |
| Rabbit monoclonal anti-cGAS (D1D3G) MB21D1 | Cell Signaling Technology | Cat# 15102 |
| Rabbit monoclonal anti-phospho- NF-κB p65 (S536) | Cell Signaling Technology | Cat #3033,RRID: AB_331284 |
| Rabbit monoclonal anti-phospho- NF-κB p65 (S468) | Cell Signaling Technology | Cat# 3039, RRID:AB_330579 |
| Rabbit monoclonal anti- NF-κB p65 | Cell Signaling Technology | Cat #8242, RRID: AB_10859369 |
| Mouse monoclonal anti-Actin antibody | BD Biosciences | Cat# 612656, RRID:AB_2289199) |
| Rabbit monoclonal anti-Histone H3 (D1H2) | Cell Signaling Technology | Cat# 4499, RRID:AB_10544537 |
| Rabbit monoclonal anti-GAPDH (D16H11) | Cell Signaling Technology | Cat# 5174, RRID:AB_10622025 |
| Mouse monoclonal anti-Human Interferon Alpha/Beta Receptor Chain 2, Clone MMHAR-2 | PBL Assay Science | Cat# PBL-21385-1 |
| Goat anti-rabbit IgG-HRP | Santa Cruz | Cat# sc-2004, RRID:AB_631746 |
| Goat anti-mouse IgG-HRP | Santa Cruz | Cat# sc-2005, RRID:AB_631736 |
| Bacterial and Virus Strains | ||
| Stbl3 competent E. coli | Thermo Fisher | Cat# C737303 |
| Biological Samples | ||
| Human leukocytes from normal donors | Bloodworks Northwest | Product code: 2490-30 http://www.bloodworksnw.org/ |
| Chemicals, Peptides, and Recombinant Proteins | ||
| Ficoll-Paque Plus | GE Healthcare | Cat# 17-1440-02 |
| Benzonase | EMD Millipore | Cat# EM70664-3 |
| Fetal Bovine Serum | Peak Serum Inc | (Lot#125N16) |
| Bovine Serum Albumin | Roche | Cat# 03116956001 |
| Recombinant Human IL-4 | Preprotech | Cat# 200-04 |
| Recombinant Human GM-CSF | Preprotech | Cat# 300-03 |
| HEPES | Sigma | Cat# H3537 |
| Phosphate Buffer Saline (PBS) | Corning | Cat# 45000-446 |
| EDTA 0.5M | Sigma | Cat# E7889 |
| Penicillin-Streptomycin | Thermo Fisher | Cat# 15140-122 |
| 2-Mercaptoethanol | Thermo Fisher | Cat# 21985023 |
| L-glutamine | Thermo Fisher | Cat# 25030081 |
| MEM non-essential amino acids | Thermo Fisher | Cat# 11140050 |
| Sodium Pyruvate | Thermo Fisher | Cat# 11360070 |
| RPMI 1640 medium | Thermo Fisher | Cat# 11875-119 |
| DMEM | Thermo Fisher | Cat# 11965-118 |
| HAT supplement | Thermo Fisher | Cat# 21060-017 |
| poly-L-lysine hydrobromide | MP Biomedicals | Cat# 0219454405 |
| polyI:C high molecular weight | InvivoGen | Cat# tlrl-pic |
| 2’3’-cGAMP (cyclic [G(2’,5’)pA(3’,5’)p] | InvivoGen | Cat# tlrl-cga23-s |
| 3’3’-cGAMP (cyclic [G(3’,5’)pA(3’,5’)p] | InvivoGen | Cat# tlrl-nacga |
| Celastrol | InvivoGen | Cat# ant-cls |
| Thapsigargin | Sigma | Cat# T9033-1MG |
| Recombinant Human TNF-α | Peprotech | Cat# 300-01A |
| Raltegravir (RAL) (ISENTRESS/MK-0518) | Selleck Chemicals | Cat# S2005 |
| Raltegravir (RAL) (ISENTRESS/MK-0518) | NIH AIDS Reagent Program | Cat #11680, CAS 871038-72-1. |
| Zidovudine (AZT) | NIH AIDS Reagent Program | Cat #3485, CAS 30516-18-1 |
| Efavirenz (EFV) | NIH AIDS Reagent Program | Cat #4624, CAS 154598-52-4 |
| Saquinavir (SAQ) | NIH AIDS Reagent Program | Cat #4658, CAS 127779-20-8 |
| Amprenavir (AMP) | NIH AIDS Reagent Program | Cat #8148, CAS #161814-49-9 |
| Recombinant Human IFN-β | Preprotech | Cat# 300-02BC |
| Recombinant Human IFNa2a | Thermo Fisher | Cat # 111001 |
| Pam3Cys-SKKKK | EMC microcollections | Cat# L2000 |
| Pam2Cys-SKKKK | EMC microcollections | Cat# L2020 |
| Flagellin from S. typhimurium | Invivogen | Cat# tlrl-stfla |
| Recombinant Human IL1Ԙ | Preprotech | Cat# 200-01B |
| R848 (Resiquimod) | InvivoGen | Cat# tlrl-r848 |
| LPS – ultra pure from Salmonella minnesota R595 | List Biological Laboratories, INC. | Cat# 434 |
| TRIzol reagent | Thermo Fisher | Cat# 15596026 |
| GlycoBlue Coprecipitate | Thermo Fisher | Cat# AM9516 |
| Polyethylenimine “Max”, (Mw 40,000) - High Potency Linear PEI | Polysciences, Inc. | Cat# 9002-98-6 |
| Paraformaldehyde | Electron Microscopy Sciences | Cat# 15713-S |
| Polybrene | Sigma | Cat# TR-1003-G |
| Puromycin | Invivogen | Cat# ant-pr-1 |
| TaqMan Fast Universal PCR Master Mix | Thermo Fisher | Cat# 4352402 |
| NEBNext® High-Fidelity 2X PCR Master Mix | New England Biolabs | Cat# M0541S |
| SYBR Green I Nucleic Acid Stain | Thermo Fisher | Cat# S-7563 |
| LDS NuPage loading buffer | Thermo Fisher | Cat# NP0007 |
| Bolt Gels 4-12% Bis-Tris polyacrylamide gels | Thermo Fisher | Cat# NW04122BOX |
| HALT combined protease and phosphatase inhibitor | Thermo Fisher | Cat# 78441 |
| Critical Commercial Assays | ||
| LIVE/DEAD® Fixable Violet Dead Cell Stain Kit | Molecular Probes | Cat# L34955 |
| Complete kit (Universal) KAPA Library Quantification Kits for Next-Generation Sequencing | Kappa Biosystems | Cat# KK4824 |
| Nextera DNA Library Prep Kit | Illumina Inc. | Cat# FC-121-1030 |
| Nuclear/Cytosol Fractionation Kit | MBL International | Cat# JM-K266 |
| Plasmid DNA Purification Nucleobond Xtra Maxi Kit | Takara | Cat# 740414.100 |
| DNeasy Blood & Tissue Kit | Qiagen | Cat# 69504 |
| Minelute Kit | Qiagen | Cat# 28004 |
| Wes Femto Maximum Sensitivity Substrate | Thermo Fisher | Cat# 34095 |
| BCA protein assay, reducing agent compatible | Thermo Fisher | Cat# PI23252 |
| p24 ELISA | ZeptoMetrix | Cat# 0801111 |
| Human IFN beta ELISA | Invitrogen | Cat# PI414101 |
| Luciferase assay system | Promega | Cat# E4530 |
| Deposited Data | ||
| Agilent microarrays on human DCs infected with HIV-GFP +/− RAL | This paper | GSE100374 |
| ATAC-seq on human DCs infected with HIV-GFP +/− RAL | This paper | GSE100376 |
| ChIP-seq for IRF3 | ENCODE | http://hgdownload.cse.ucsc.edu/goldenPath/hg19/encodeDCC/wgEncodeSydhTfbs/wgEncodeSydhTfbsGm12878Irf3IggmusSig.bigWig |
| ChIP-seq for NF-κB | ENCODE | http://hgdownload.cse.ucsc.edu/goldenPath/hg19/encodeDCC/wgEncodeSydhTfbs/wgEncodeSydhTfbsGm12878NfkbTnfalggrabSig.bigWig |
| ChIP-seq for STAT1 | ENCODE | http://hgdownload.cse.ucsc.edu/goldenPath/hg19/encodeDCC/wgEncodeSydhTfbs/wgEncodeSydhTfbsGm12878Stat1StdSig.bigWig |
| DNase-HS-seq on CD14+ monocytes | ENCODE | http://hgdownload.cse.ucsc/edu/goldenPath/hg19/encodeDCC/wgEncodeOpenChromDnase/wgEncodeOpenChromDnaseMonocd14Sig.bigWig |
| Experimental Models: Cell Lines | ||
| HEK 293FT cells | Thermo Fisher | Cat# R70007, RRID:CVCL_6911 |
| HL116 reporter cells | N/A | Gift from Sandra Pellegrini |
| HeLa cells | ATCC | Cat# CRL-7923, RRID:CVCL_0030 |
| THP-1 cells | ATCC | Cat# TIB-202, RRID:CVCL_0006 |
| Experimental Models: Organisms/Strains | ||
| N/A N/A N/A | ||
| Oligonucleotides | ||
| ATAC-seq sequencing primers | (Buenrostro et al., 2013) | (see Table S3) |
| Primers for cloning LKO-IRF3 | This paper | (see Table S3) |
| TaqMan GAPDH assay | ThermoFisher | Cat# Hs02758991_g1 |
| TaqMan IFNB1 assay | ThermoFisher | Cat# Hs01077958_s1 |
| TaqMan HIV-LTR assay | ThermoFisher | Cat# Pa03453409_s1 |
| TaqMan ISG15 assay | ThermoFisher | Cat# Hs01921425_s1 |
| TaqMan CXCL10 assay | ThermoFisher | Cat# Hs01124251_g1 |
| TaqMan IFNL1 assay | ThermoFisher | Cat# Hs00601677_g1 |
| TaqMan eGFP assay | ThermoFisher | Cat# Mr04329676_mr |
| TaqMan IL1B assay | ThermoFisher | Cat# Hs01555410_m1 |
| Recombinant DNA | ||
| HIV-GFP | (Manel et al., 2010) | N/A |
| HIV-GFP-IN-D116A | (Manel et al., 2010) | N/A |
| HIV-GFP- Gag | (Manel et al., 2010) | N/A |
| LKO-GFP | (Manel et al., 2010) | N/A |
| HIV-1 (replication competent TN6 backbone) | (Diskin et al., 2013) | N/A |
| pSIV3+ (for production of virus-like particles containing Vpx) | (Mangeot et al., 2000) | SIVmac251 GenBank acc. no. M19499 |
| pLKO.1 – TRC cloning vector | Gift from David Root | Addgene plasmid #10878 |
| psPAX2 | Gift from Didier Trono | Addgene plasmid #12260 |
| pCMV-VSV-G | Gift from Bob Weinberg | Addgene plasmid #8454 |
| pLKO.1 - TRC control | Gift from David Root | Addgene plasmid #10879 |
| pcDNA3-IRF3-FL | Gift from Peter Howley | Addgene plasmid #22860 |
| LKO-IRF3 | This paper | N/A |
| LKO-IRF3 S396A | This paper | N/A |
| pGreenFire1- NF-κB + EF1-Puro | System Biosciences | TR012PA-P |
| control shRNA | Sigma | SHC002 |
| IRF3 shRNA | This paper | N/A |
| MAVS shRNA | This paper | N/A |
| cGas shRNA | Sigma | TRCN0000149984 |
| IFI16 shRNA 1 | Sigma | TRCN0000364735 |
| IFI16 shRNA 2 | Sigma | TRCN0000364688 |
| PKR shRNA | Sigma | TRCN0000196400 |
| lentiCRISPR v2 | Gift from Feng Zhang | Addgene plasmid #52961 |
| lentiCRISPR control (LCV2) | This paper | N/A |
| lentiCRISPR cGAS KO5 | This paper | N/A |
| lentiCRISPR cGAS KO6 | This paper | N/A |
| lentiCRISPR MAVS KO1 | This paper | N/A |
| lentiCRISPR MAVS KO2 | This paper | N/A |
| lentiCRISPR MYD88 KO5 | This paper | N/A |
| lentiCRISPR MYD88 KO7 | This paper | N/A |
| lentiCRISPR STING KO5 | This paper | N/A |
| lentiCRISPR STING KO7 | This paper | N/A |
| lentiCRISPR IRF1 KO3 | This paper | N/A |
| lentiCRISPR IRF3 KO2 | This paper | N/A |
| lentiCRISPR IRF5 KO3 | This paper | N/A |
| lentiCRISPR IRF7 KO3 | This paper | N/A |
| Software and Algorithms | ||
| R | N/A | https://www.rproject.org/ |
| Integrative Genomics Viewer (IGV) | N/A | http://software.broadinstitute.org/software/igv/ |
| LIMMA | N/A | https://bioconductor.org/packages/release/bioc/html/limma.html |
| GraphPad Prism 6.0 | GraphPad | https://www.graphpad.com/scientificsoftware/prism/ |
| FlowJo 8.7 | FlowJo LLC | https://www.flowjo.com/ |
| GSNAP | N/A | http://research-pub.gene.com/gmap/ |
| Ingenuity Pathway Analysis | Qiagen | https://www.qiagenbioinformatics.com/products/ingenuitypathway-analysis |
| MACS2 | N/A | https://github.com/taoliu/MACS |
| bedGraphToBigWig | N/A | genome.ucsc.edu |
| edgeR | N/A | https://bioconductor.org/packages/release/bioc/html/edgeR.html |
| DiffBind | N/A | http://bioconductor.org/packages/release/bioc/vignettes/DiffBind/inst/doc/DiffBind.pdf |
| eCRISP | N/A | http://www.ecrisp.org/E-CRISP/ |
| Enrichr | N/A | http://amp.pharm.mssm.edu/Enrichr/ |
| Tracking of Indels by Decomposition (TIDE) sequencing | N/A | https://tidecalculator.nki.nl/ |
| Other | ||
| LS Columns | Miltenyi Biotec, Inc | 130-042-401 |
| SW 28 Ti Rotor, Swinging Bucket | Beckman | Cat# 342204 |
| Thinwall Polyallomer, Conical Tubes; Size:25 × 89 | Beckman | Cat# 358126 |
| 0.45 μm syringe filters | Corning | Cat# 28200-026 |
| CD14 MicroBeads, human | Miltenyi Biotec, Inc | 130-050-201 |
| QuadroMACS Separator | Miltenyi Biotec, Inc | 130-090-976 |
| LSR II Flow Cytometer | BD Biosciences | N/A |
| FACSAria II Cell Sorter | BD Biosciences | N/A |
| CFX96 thermal cycler | Biorad | Model T100 |
| SurePrint G3 Human Gene Expression v3 8×60K Microarray Kit | Agilent | G4851B |
| FluorChem E Imager | Protein Simple | N/A |
Supplementary Material
Gene-associated open chromatin peak values from ATAC-seq during HIV-1 infection. Related to Figure 2.
Regression analysis from time course transcriptomics data in DCs infected with HIV-GFP +/− RAL. Related to Figure 6.
shRNA, sgRNA, and primer sequences used in this study. Related to STAR METHODS.
Highlights.
Myeloid DCs sense HIV-1 in distinct phases, before and after integration
HIV-1 sensing leads to changes in chromatin accessibility and primes IFN responses
Perturbation of IRF3 expression levels impacts IFN responses downstream of cGAS/STING
MyD88-specific stimuli cooperate with IRF3 to augment IFN production in DCs
Acknowledgments
We thank Pamela Troisch for arrays and sequencing; Alan Diercks for critically reading the manuscript; and Nicolas Manel for offering advice and plasmids. This work was supported the Howard Hughes Medical Institute (DRL); the Helen and Martin Kimmel Center for Biology and Medicine (DRL); and by grants from the National Institutes of Health (F32AI093231 to JSJ; R21AI084633 to DRL; R01AI025032, R01AI032972, and U19AI100627 to AA).
Footnotes
Declaration of Interests
The authors declare no competing interests.
Publisher's Disclaimer: This is a PDF file of an unedited manuscript that has been accepted for publication. As a service to our customers we are providing this early version of the manuscript. The manuscript will undergo copyediting, typesetting, and review of the resulting proof before it is published in its final citable form. Please note that during the production process errors may be discovered which could affect the content, and all legal disclaimers that apply to the journal pertain.
References
- Aguirre S, Luthra P, Sanchez-Aparicio MT, Maestre AM, Patel J, Lamothe F, Fredericks AC, Tripathi S, Zhu T, Pintado-Silva J, et al. (2017). Dengue virus NS2B protein targets cGAS for degradation and prevents mitochondrial DNA sensing during infection. Nat Microbiol 2, 17037. [DOI] [PMC free article] [PubMed] [Google Scholar]
- Beignon AS, McKenna K, Skoberne M, Manches O, DaSilva I, Kavanagh DG, Larsson M, Gorelick RJ, Lifson JD, and Bhardwaj N (2005). Endocytosis of HIV-1 activates plasmacytoid dendritic cells via Toll-like receptor-viral RNA interactions. The Journal of clinical investigation 115, 3265–3275. [DOI] [PMC free article] [PubMed] [Google Scholar]
- Buenrostro JD, Giresi PG, Zaba LC, Chang HY, and Greenleaf WJ (2013). Transposition of native chromatin for fast and sensitive epigenomic profiling of open chromatin, DNA-binding proteins and nucleosome position. Nat Methods 10, 1213–1218. [DOI] [PMC free article] [PubMed] [Google Scholar]
- Cao X (2016). Self-regulation and cross-regulation of pattern-recognition receptor signalling in health and disease. Nature reviews Immunology 16, 35–50. [DOI] [PubMed] [Google Scholar]
- Chuong EB, Elde NC, and Feschotte C (2016). Regulatory evolution of innate immunity through co-option of endogenous retroviruses. Science 351, 1083–1087. [DOI] [PMC free article] [PubMed] [Google Scholar]
- Decalf J, Desdouits M, Rodrigues V, Gobert FX, Gentili M, Marques-Ladeira S, Chamontin C, Mougel M, Cunha de Alencar B, and Benaroch P (2017). Sensing of HIV-1 Entry Triggers a Type I Interferon Response in Human Primary Macrophages. Journal of virology 91. [DOI] [PMC free article] [PubMed] [Google Scholar]
- Doyle T, Goujon C, and Malim MH (2015). HIV-1 and interferons: who’s interfering with whom? Nat Rev Microbiol 13, 403–413. [DOI] [PMC free article] [PubMed] [Google Scholar]
- Fernandez S, Tanaskovic S, Helbig K, Rajasuriar R, Kramski M, Murray JM, Beard M, Purcell D, Lewin SR, Price P, et al. (2011). CD4+ T-cell deficiency in HIV patients responding to antiretroviral therapy is associated with increased expression of interferonstimulated genes in CD4+ T cells. J Infect Dis 204, 1927–1935. [DOI] [PubMed] [Google Scholar]
- Fraietta JA, Mueller YM, Yang G, Boesteanu AC, Gracias DT, Do DH, Hope JL, Kathuria N, McGettigan SE, Lewis MG, et al. (2013). Type I interferon upregulates Bak and contributes to T cell loss during human immunodeficiency virus (HIV) infection. PLoS Pathog 9, e1003658. [DOI] [PMC free article] [PubMed] [Google Scholar]
- Gao D, Wu J, Wu YT, Du F, Aroh C, Yan N, Sun L, and Chen ZJ (2013). Cyclic GMP-AMP synthase is an innate immune sensor of HIV and other retroviruses. Science 341, 903–906. [DOI] [PMC free article] [PubMed] [Google Scholar]
- Granelli-Piperno A, Golebiowska A, Trumpfheller C, Siegal FP, and Steinman RM (2004). HIV-1-infected monocyte-derived dendritic cells do not undergo maturation but can elicit IL-10 production and T cell regulation. Proceedings of the National Academy of Sciences of the United States of America 101, 7669–7674. [DOI] [PMC free article] [PubMed] [Google Scholar]
- Gringhuis SI, Hertoghs N, Kaptein TM, Zijlstra-Willems EM, Sarrami-Fooroshani R, Sprokholt JK, van Teijlingen NH, Kootstra NA, Booiman T, van Dort KA, et al. (2017). HIV-1 blocks the signaling adaptor MAVS to evade antiviral host defense after sensing of abortive HIV-1 RNA by the host helicase DDX3. Nature immunology 18, 225–235. [DOI] [PubMed] [Google Scholar]
- Gringhuis SI, van der Vlist M, van den Berg LM, den Dunnen J, Litjens M, and Geijtenbeek TB (2010). HIV-1 exploits innate signaling by TLR8 and DC-SIGN for productive infection of dendritic cells. Nature immunology 11, 419–426. [DOI] [PubMed] [Google Scholar]
- Holm CK, Jensen SB, Jakobsen MR, Cheshenko N, Horan KA, Moeller HB, Gonzalez-Dosal R, Rasmussen SB, Christensen MH, Yarovinsky TO, et al. (2012). Viruscell fusion as a trigger of innate immunity dependent on the adaptor STING. Nature immunology 13, 737–743. [DOI] [PMC free article] [PubMed] [Google Scholar]
- Hrecka K, Hao C, Gierszewska M, Swanson SK, Kesik-Brodacka M, Srivastava S, Florens L, Washburn MP, and Skowronski J (2011). Vpx relieves inhibition of HIV-1 infection of macrophages mediated by the SAMHD1 protein. Nature 474, 658–661. [DOI] [PMC free article] [PubMed] [Google Scholar]
- Ivashkiv LB, and Donlin LT (2014). Regulation of type I interferon responses. Nature reviews Immunology 14, 36–49. [DOI] [PMC free article] [PubMed] [Google Scholar]
- Jakobsen MR, Bak RO, Andersen A, Berg RK, Jensen SB, Tengchuan J, Laustsen A, Hansen K, Ostergaard L, Fitzgerald KA, et al. (2013). IFI16 senses DNA forms of the lentiviral replication cycle and controls HIV-1 replication. Proceedings of the National Academy of Sciences of the United States of America 110, E4571–4580. [DOI] [PMC free article] [PubMed] [Google Scholar]
- Jonsson KL, Laustsen A, Krapp C, Skipper KA, Thavachelvam K, Hotter D, Egedal JH, Kjolby M, Mohammadi P, Prabakaran T, et al. (2017). IFI16 is required for DNA sensing in human macrophages by promoting production and function of cGAMP. Nat Commun 8, 14391. [DOI] [PMC free article] [PubMed] [Google Scholar]
- Laguette N, Sobhian B, Casartelli N, Ringeard M, Chable-Bessia C, Segeral E, Yatim A, Emiliani S, Schwartz O, and Benkirane M (2011). SAMHD1 is the dendritic- and myeloidcell-specific HIV-1 restriction factor counteracted by Vpx. Nature 474, 654–657. [DOI] [PMC free article] [PubMed] [Google Scholar]
- Lahaye X, Satoh T, Gentili M, Cerboni S, Conrad C, Hurbain I, El Marjou A, Lacabaratz C, Lelievre JD, and Manel N (2013). The capsids of HIV-1 and HIV-2 determine immune detection of the viral cDNA by the innate sensor cGAS in dendritic cells. Immunity 39, 1132–1142. [DOI] [PubMed] [Google Scholar]
- Liu S, Cai X, Wu J, Cong Q, Chen X, Li T, Du F, Ren J, Wu YT, Grishin NV, et al. (2015). Phosphorylation of innate immune adaptor proteins MAVS, STING, and TRIF induces IRF3 activation. Science 347, aaa2630. [DOI] [PubMed] [Google Scholar]
- Luban J (2012). Innate immune sensing of HIV-1 by dendritic cells. Cell Host Microbe 12, 408–418. [DOI] [PMC free article] [PubMed] [Google Scholar]
- Manel N, Hogstad B, Wang Y, Levy DE, Unutmaz D, and Littman DR (2010). A cryptic sensor for HIV-1 activates antiviral innate immunity in dendritic cells. Nature 467, 214–217. [DOI] [PMC free article] [PubMed] [Google Scholar]
- Mangeot PE, Negre D, Dubois B, Winter AJ, Leissner P, Mehtali M, Kaiserlian D, Cosset FL, and Darlix JL (2000). Development of minimal lentivirus vectors derived from simian immunodeficiency virus (SIVmac251) and their use for gene transfer into human dendritic cells. Journal of virology 74, 8307–8315. [DOI] [PMC free article] [PubMed] [Google Scholar]
- Monroe KM, Yang Z, Johnson JR, Geng X, Doitsh G, Krogan NJ, and Greene WC (2014). IFI16 DNA sensor is required for death of lymphoid CD4 T cells abortively infected with HIV. Science 343, 428–432. [DOI] [PMC free article] [PubMed] [Google Scholar]
- Nasr N, Alshehri AA, Wright TK, Shahid M, Heiner BM, Harman AN, Botting RA, Helbig KJ, Beard MR, Suzuki K, et al. (2017). Mechanism of Interferon-Stimulated Gene Induction in HIV-1-Infected Macrophages. Journal of virology 91. [DOI] [PMC free article] [PubMed] [Google Scholar]
- Pertel T, Hausmann S, Morger D, Zuger S, Guerra J, Lascano J, Reinhard C, Santoni FA, Uchil PD, Chatel L, et al. (2011). TRIM5 is an innate immune sensor for the retrovirus capsid lattice. Nature 472, 361–365. [DOI] [PMC free article] [PubMed] [Google Scholar]
- Rasaiyaah J, Tan CP, Fletcher AJ, Price AJ, Blondeau C, Hilditch L, Jacques DA, Selwood DL, James LC, Noursadeghi M, et al. (2013). HIV-1 evades innate immune recognition through specific cofactor recruitment. Nature 503, 402–405. [DOI] [PMC free article] [PubMed] [Google Scholar]
- Sandler NG, Bosinger SE, Estes JD, Zhu RT, Tharp GK, Boritz E, Levin D, Wijeyesinghe S, Makamdop KN, del Prete GQ, et al. (2014). Type I interferon responses in rhesus macaques prevent SIV infection and slow disease progression. Nature 511, 601–605. [DOI] [PMC free article] [PubMed] [Google Scholar]
- Sato M, Tanaka N, Hata N, Oda E, and Taniguchi T (1998). Involvement of the IRF family transcription factor IRF-3 in virus-induced activation of the IFN-beta gene. FEBS Lett 425, 112–116. [DOI] [PubMed] [Google Scholar]
- Schoggins JW, MacDuff DA, Imanaka N, Gainey MD, Shrestha B, Eitson JL, Mar KB, Richardson RB, Ratushny AV, Litvak V, et al. (2014). Pan-viral specificity of IFNinduced genes reveals new roles for cGAS in innate immunity. Nature 505, 691–695. [DOI] [PMC free article] [PubMed] [Google Scholar]
- Schoggins JW, Wilson SJ, Panis M, Murphy MY, Jones CT, Bieniasz P, and Rice CM (2011). A diverse range of gene products are effectors of the type I interferon antiviral response. Nature 472, 481–485. [DOI] [PMC free article] [PubMed] [Google Scholar]
- Schulz O, Pichlmair A, Rehwinkel J, Rogers NC, Scheuner D, Kato H, Takeuchi O, Akira S, Kaufman RJ, and Reis e Sousa C (2010). Protein kinase R contributes to immunity against specific viruses by regulating interferon mRNA integrity. Cell Host Microbe 7, 354–361. [DOI] [PMC free article] [PubMed] [Google Scholar]
- Silvin A, Yu CI, Lahaye X, Imperatore F, Brault JB, Cardinaud S, Becker C, Kwan WH, Conrad C, Maurin M, et al. (2017). Constitutive resistance to viral infection in human CD141+ dendritic cells. Sci Immunol 2. [DOI] [PMC free article] [PubMed] [Google Scholar]
- Sloan RD, and Wainberg MA (2011). The role of unintegrated DNA in HIV infection. Retrovirology 8, 52. [DOI] [PMC free article] [PubMed] [Google Scholar]
- Smed-Sorensen A, Lore K, Vasudevan J, Louder MK, Andersson J, Mascola JR, Spetz AL, and Koup RA (2005). Differential susceptibility to human immunodeficiency virus type 1 infection of myeloid and plasmacytoid dendritic cells. Journal of virology 79, 8861–8869. [DOI] [PMC free article] [PubMed] [Google Scholar]
- Sultana T, Zamborlini A, Cristofari G, and Lesage P (2017). Integration site selection by retroviruses and transposable elements in eukaryotes. Nat Rev Genet 18, 292–308. [DOI] [PubMed] [Google Scholar]
- Thanos D, and Maniatis T (1995). Identification of the rel family members required for virus induction of the human beta interferon gene. Mol Cell Biol 15, 152–164. [DOI] [PMC free article] [PubMed] [Google Scholar]
- Tong AJ, Liu X, Thomas BJ, Lissner MM, Baker MR, Senagolage MD, Allred AL, Barish GD, and Smale ST (2016). A Stringent Systems Approach Uncovers Gene-Specific Mechanisms Regulating Inflammation. Cell 165, 165–179. [DOI] [PMC free article] [PubMed] [Google Scholar]
- Vermeire J, Roesch F, Sauter D, Rua R, Hotter D, Van Nuffel A, Vanderstraeten H, Naessens E, Iannucci V, Landi A, et al. (2016). HIV Triggers a cGAS-Dependent, Vpu- and Vpr-Regulated Type I Interferon Response in CD4+ T Cells. Cell Rep 17, 413–424. [DOI] [PubMed] [Google Scholar]
- Villani AC, Satija R, Reynolds G, Sarkizova S, Shekhar K, Fletcher J, Griesbeck M, Butler A, Zheng S, Lazo S, et al. (2017). Single-cell RNA-seq reveals new types of human blood dendritic cells, monocytes, and progenitors. Science 356. [DOI] [PMC free article] [PubMed] [Google Scholar]
- West AP, Khoury-Hanold W, Staron M, Tal MC, Pineda CM, Lang SM, Bestwick M, Duguay BA, Raimundo N, MacDuff DA, et al. (2015). Mitochondrial DNA stress primes the antiviral innate immune response. Nature 520, 553–557. [DOI] [PMC free article] [PubMed] [Google Scholar]
- Yan N, Regalado-Magdos AD, Stiggelbout B, Lee-Kirsch MA, and Lieberman J (2010). The cytosolic exonuclease TREX1 inhibits the innate immune response to human immunodeficiency virus type 1. Nature immunology 11, 1005–1013. [DOI] [PMC free article] [PubMed] [Google Scholar]
- Yoh SM, Schneider M, Seifried J, Soonthornvacharin S, Akleh RE, Olivieri KC, De Jesus PD, Ruan C, de Castro E, Ruiz PA, et al. (2015). PQBP1 Is a Proximal Sensor of the cGAS-Dependent Innate Response to HIV-1. Cell 161, 1293–1305. [DOI] [PMC free article] [PubMed] [Google Scholar]
- Yoneyama M, Suhara W, Fukuhara Y, Fukuda M, Nishida E, and Fujita T (1998). Direct triggering of the type I interferon system by virus infection: activation of a transcription factor complex containing IRF-3 and CBP/p300. EMBO J 17, 1087–1095. [DOI] [PMC free article] [PubMed] [Google Scholar]
- York AG, Williams KJ, Argus JP, Zhou QD, Brar G, Vergnes L, Gray EE, Zhen A, Wu NC, Yamada DH, et al. (2015). Limiting Cholesterol Biosynthetic Flux Spontaneously Engages Type I IFN Signaling. Cell 163, 1716–1729. [DOI] [PMC free article] [PubMed] [Google Scholar]
- Yu X, Cai B, Wang M, Tan P, Ding X, Wu J, Li J, Li Q, Liu P, Xing C, et al. (2016). Cross-Regulation of Two Type I Interferon Signaling Pathways in Plasmacytoid Dendritic Cells Controls Anti-malaria Immunity and Host Mortality. Immunity 45, 1093–1107. [DOI] [PMC free article] [PubMed] [Google Scholar]
Associated Data
This section collects any data citations, data availability statements, or supplementary materials included in this article.
Supplementary Materials
Gene-associated open chromatin peak values from ATAC-seq during HIV-1 infection. Related to Figure 2.
Regression analysis from time course transcriptomics data in DCs infected with HIV-GFP +/− RAL. Related to Figure 6.
shRNA, sgRNA, and primer sequences used in this study. Related to STAR METHODS.