Abstract
Wetlands across the globe provide extensive ecosystem services. However, many wetlands – especially those surrounded by uplands, often referred to as geographically isolated wetlands (GIWs) – remain poorly protected. Protection and restoration of wetlands frequently requires information on their hydrologic connectivity to other surface waters, and their cumulative watershed-scale effects. The integration of measurements and models can supply this information. However, the types of measurements and models that should be integrated are dependent on management questions and information compatibility. We summarize the importance of GIWs in watersheds and discuss what wetland connectivity means in both science and management contexts. We then describe the latest tools available to quantify GIW connectivity and explore crucial next steps to enhancing and integrating such tools. These advancements will ensure that appropriate tools are used in GIW decision making and maintaining the important ecosystem services that these wetlands support.
Wetlands perform hydrologic, biogeochemical, and biological functions that provide ecosystem services linked to human health and well-being (Junk et al. 2013). Despite considerable global policy attention toward improving their conservation in recent years, many wetlands remain poorly protected (Figure 1). At particular risk are so-called geographically isolated wetlands (GIWs) (Tiner 2003; Mushet et al. 2015; Leibowitz 2015), which are completely surrounded by uplands and lack apparent surface water connections to downstream waters.
Figure 1.
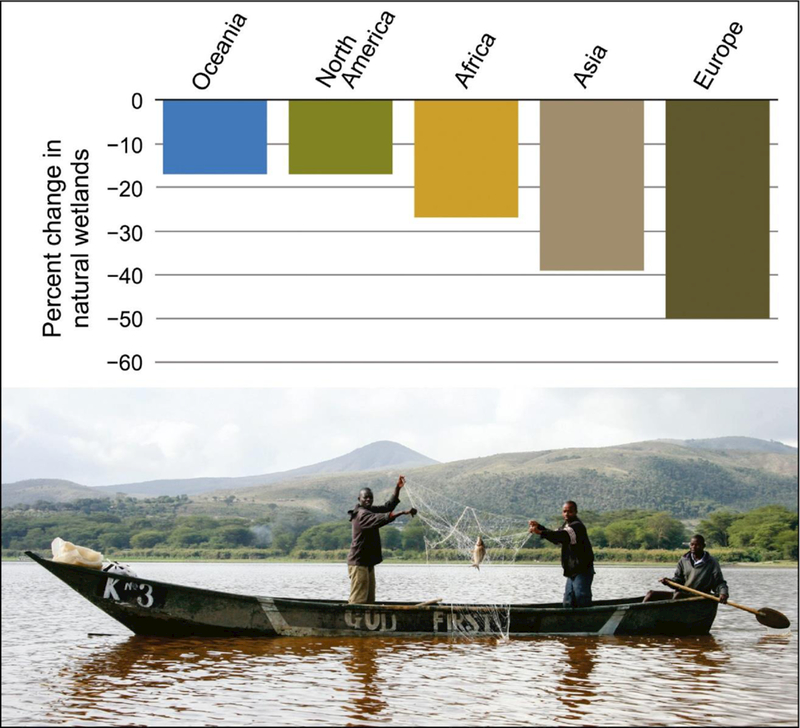
The average global loss of wetlands – many of which are GIWs – is estimated at 31% since 1970 (Dixon et al. 2016). These losses have major societal consequences, including increased floods, impaired water supplies, impoverished biodiversity, and degraded fisheries. International policies (eg the Ramsar Convention on Wetlands) have sought to curb wetland loss with varying degrees of success. Although slowing in some parts of the world (eg North America), rates of wetland loss elsewhere (eg Europe) remain high. The photograph depicts Lake Naivasha, Kenya, a Ramsar Wetland of International Importance.
IF Creed
GIWs exhibit wide spatial and temporal variations in their hydrologic connections to downstream waters. It is through the variability of these hydrologic connections and disconnections (ie their isolation) that GIWs support numerous watershed and ecosystem functions, including hydrologic regulation (Rains et al. 2016), nutrient retention (Marton et al. 2015), and provision of habitat or refugia for many organisms (EPA 2015; Cohen et al. 2016). GIWs are also important in the decision-making context because of their limited, and often case-by-case jurisdictional, protection (Creed et al. 2017). To help prioritize GIW protection and restoration, natural resource agency personnel around the world need better tools to quantify the hydrologic connectivity of these wetlands. For example, for management purposes, recent federal US policies require a clear demonstration of GIW connectivity to, and their individual and cumulative effects on, downstream waters (Alexander 2015).
At present, management objectives to protect and restore GIWs are often applied at the landscape scale and are meant to counteract adverse impacts on ecosystems and human health. In these cases, currently available tools (ie measurements and models) are insufficient if used singularly or incorrectly. For instance, it is not possible to make management decisions for the existing 8.3 million GIWs across the conterminous US (Lane and D’Amico 2016) based on individual data collection and analyses alone. This is also true for the potentially large number of GIWs that make up the remaining global wetland extent. Therefore, scientists need to advance the integration of existing and new tools to efficiently gather evidence on these systems. This supportive science could then be used by natural resource managers, who make challenging and multifaceted local, state, provincial and national land management decisions.
Here we address the real-world challenge of protecting, conserving, restoring, and otherwise managing wetlands across the globe by: (1) discussing the need for GIW management tools, (2) describing the concept of GIW connectivity, (3) synthesizing current knowledge on the integration of GIW connectivity into measurements and models, (4) providing guidance for selecting tools to characterize GIW connectivity, and (5) identifying future advancements toward integrating GIWs into the next generation of hydrologic data and models.
Integrating GIWs into science and management
Evidence-based natural resource management is crucial for water stewardship, particularly for the protection and restoration of GIWs. Unfortunately, successful arguments in the public sphere are commonly local and contextual, focusing more on reacting to public comments than on analysis of data (Depew and Lyne 2013). For example, public discourse led to a decrease in vaccinations for preventable diseases even though the data indicated the validity and success of such vaccines for individual and public health (Kata 2009). For GIW management, a measurement (ie the data) may demonstrate that water from a GIW flows into another water body, but a counterargument in the public sphere might be that the measurement only represents a specific outcome at one point in time. Adding models that verify measurements and confirm how GIWs connect to and functionally affect other water bodies under a wide range of plausible environmental conditions can further support science-based decision making.
Natural resource managers can therefore improve their effectiveness by integrating and adding new approaches to make decisions based on converging evidence (ie a set of similar conclusions derived from diverse independent sources). This may include an “ensemble approach” – combining multiple measurements and models. For GIW management, the most scientifically defensible information for decision making is based on a proportional mix of knowledge derived from measured, modeled, and hypothesized (often via models, data, and professional judgement) connections to other water bodies (Figure 2). Often, however, only a portion of that knowledge mix is available to managers, so that information frequently trends toward the vertices in Figure 2 (eg 100% hypothesized connections). Recognizing the challenges that managers face, we have attempted to show that novel measurements combined with models can assist in decision making by providing multiple lines of, or convergent, scientific evidence.
Figure 2.
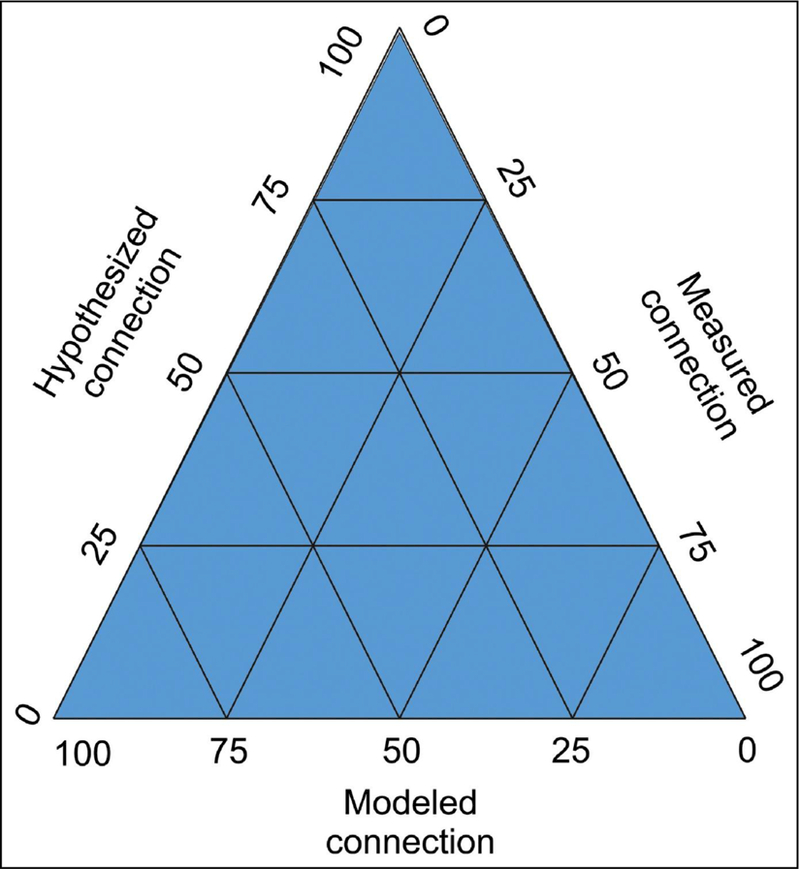
Knowledge regarding GIW connectivity for a particular management objective is a balance between hypotheses, model outputs, and measured data. Any point within the figure (a ternary diagram) represents the relative percent of connectivity knowledge from each source, which will add to 100%. For example, the vertex at the top of the figure represents a 100% hypothesized connection. A point in the middle of the diagram may represent connectivity knowledge from all three sources (eg 25% measured, 25% modeled, and 50% hypothesized connections).
Defining GIW connectivity
A factor that contributes to disagreements regarding how to approach GIW management is the ambiguity associated with the phrase “hydrologic connectivity” (Ali and Roy 2009; WebTable 1). There are many definitions of hydrologic connectivity, which, broadly speaking, can be grouped into structural and functional connectivity. The former describes the spatial relationships between landscape elements (eg a GIW, a stream) to infer potential water movement, while the latter quantifies the actual movement of water across the landscape (Bracken et al. 2013; Okin et al. 2015).
We define GIW connectivity as the degree to which GIWs are linked to each other and to other landscape elements by surface-water flows (across the land surface), shallow subsurface-water flows (just below the land surface), and deep groundwater flows (over long distances and through large underground formations) – or a combination of the three (Figure 3a; Rains et al. 2016). These flows can vary temporally in their frequency, magnitude, duration, and direction (Figure 3b; Rains et al. 2016) and result from watershed properties relating to climate, geology and soils, topography, and land cover/land use (WebTable 2). Likewise, these flows may demonstrate spatial variation, such as through localized effects of individual GIWs on water movement (eg to groundwater), wetland-to-wetland water transfers within groups of GIWs, or cumulative effects of GIWs at the watershed scale.
Figure 3.
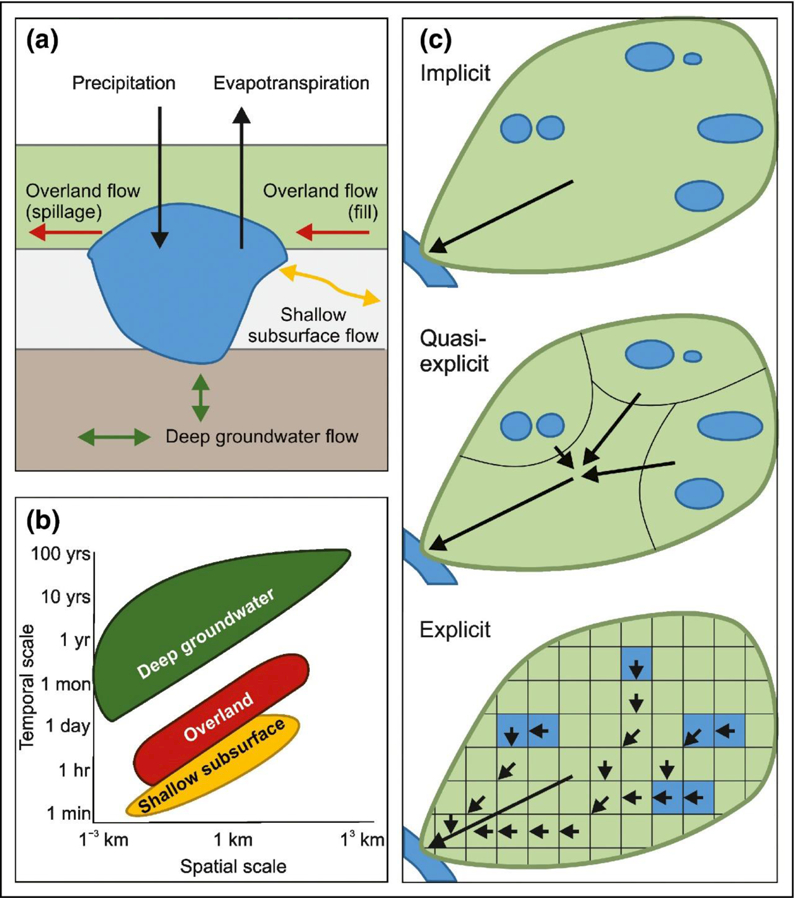
Measuring, modeling, and representing GIW connectivity: critical needs for science and management. (a) Important flowpaths for GIWs, including precipitation and evapotranspiration as major wetland water inputs/outputs. (b) Generalized spatial and temporal scales of different GIW flowpaths (adapted from Blöschl and Sivapalan [1995]). (c) Types of GIW connectivity information provided by different spatial representations of connectivity: implicit (connectivity is assumed similar at the watershed scale, which is often associated with spatially lumped models), quasi-explicit (connectivity is assumed to be similar for portions of the watershed area, which is often associated with semi-distributed models), and explicit (each GIW’s connectivity flowpath is measured or modeled individually, which is often associated with fully distributed models).
Despite connectivity concepts being central to hydrology, the discipline has made only small contributions to decision making (Bracken et al. 2013), particularly with respect to GIWs. The variety of definitions of connectivity – together with the complexity of the connections over time and space – has led to the adoption of a wide assortment of measurement and modeling approaches. A synthesis of information to guide the selection of emerging tools to measure and model GIW connectivity has – until now – been absent.
Characterizing GIW connectivity
On the ground (in situ) and remotely sensed (satellite or aircraft) measurements can be used independently, in combination with other measurements, and in support of modeling efforts to characterize GIW hydrologic connectivity (WebTable 2). Measurements provide evidence that supports the development of a conceptual model of GIW connectivity in a specific system. Modeling, in turn, reduces the uncertainty of this conceptualization by corroborating measurements and also by projecting data beyond their original temporal and spatial boundaries. Therefore, the integration of measurements and models can improve and facilitate our understanding of the connectivity of GIWs, their downstream cumulative effects, and their functions at a broad range of spatial and temporal scales (Golden et al. 2014).
Measurements
Measured data (ie data derived from direct measurements) can be collected to produce GIW connectivity information that is implicit, quasi-explicit, or explicit with regard to its spatial detail or resolution (Figure 3c). We define implicit connectivity information as that which is estimated from data without spatial or locational detail. For example, the percent of GIWs in a watershed that potentially connect to other wetlands after a long rainfall event would be considered implicit connectivity information. Quasi-explicit connectivity information is produced when GIW connectivity is measured, and considered similar within smaller subsections of a larger system. In such a case, the measured length of time that one GIW within a subwatershed is hydrologically connected to another during the year may be assumed to represent that of all GIWs across that particular subwatershed. Explicit connectivity information is developed when each GIW and its individual flowpaths are separately measured across the entire area of interest. For instance, measurements of the frequency of water moving out of each GIW within a watershed would yield explicit information on the timing of its connectivity.
In situ approaches such as sensors and tracers (eg chemical compounds or isotopes used to track flowpaths) are particularly useful for assessing functional GIW connectivity. They can do so implicitly, quasi-explicitly, or explicitly (Figure 4), and at different temporal scales. Sensors can be used to infer GIW flow rates, flowpaths, and downstream connections. Examples include water-level recorders to calculate groundwater flows to and from wetlands at high temporal resolutions (McLaughlin and Cohen 2013), data loggers to mark the presence or absence of GIW surface water connections (McDonough et al. 2014), soil moisture or water table sensors to assess the spatial and temporal patterns of flowpaths (Jencso et al. 2009), and stream discharge measurements to correlate GIW inundation and downstream dynamics (Vanderhoof et al. 2016). Conservative tracers (ie chemicals, such as chloride, that undergo limited reactive processes while in transport) can provide direct evidence of connections by linking source and receiving waters (Rains et al. 2006).
Figure 4.
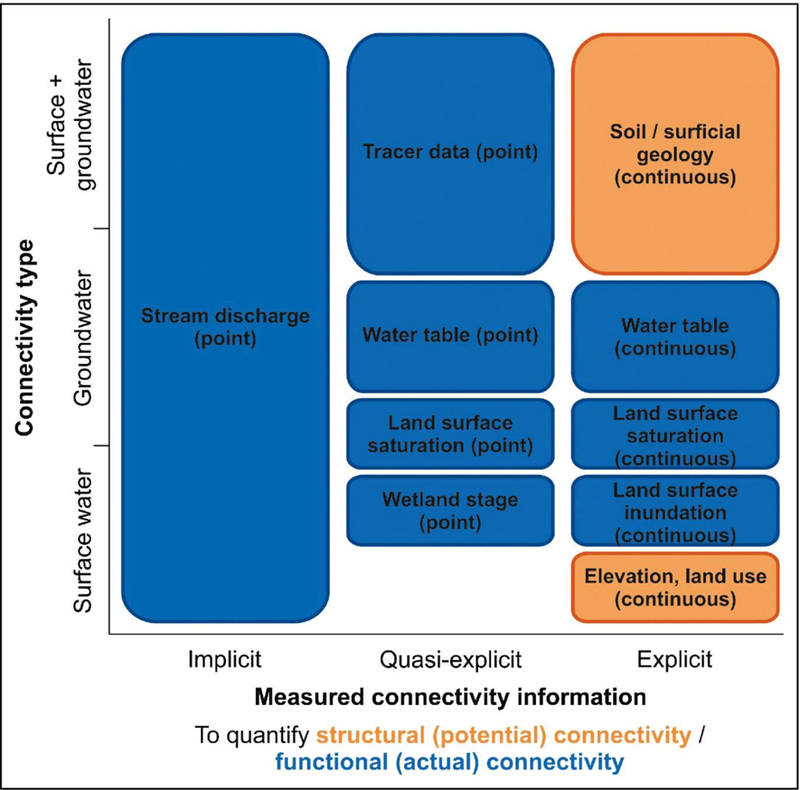
The presence or absence of GIW connectivity can be demonstrated by data to varying degrees, ranging in spatial detail from implicit (no connectivity represented) to explicit (each GIW’s connectivity flowpath is measured individually). Examples of existing connectivity information derived from measured data are included here (detailed in WebTable 2). Point measurements are taken at specific locations and are often sparse. Continuous measurements are taken at regularly spaced intervals across the landscape, which allows continuous mapped surfaces to be produced from the measurements.
Remote sensing, combined with Geographic Information Systems (GIS), can produce explicit information concerning both structural and functional GIW connectivity. The former type of connectivity is often quantified using the relationship between mapped wetlands (eg US Fish and Wildlife Service [USFWS] National Wetland Inventory Geospatial Data Layer) and streams (US Geological Survey [USGS] National Hydrography Dataset). Structural GIW connectivity also can be estimated from land elevation information, particularly from digital terrain models (DTMs) and the remote-sensing data used to produce them. DTMs are three-dimensional representations of surface terrain that can help to estimate volume of water or elevation thresholds above which connectivity occurs – both potentially key model parameters. Functional connectivity can be characterized using a wide variety of sensor types (eg various instruments on Landsat, Sentinel-1, Radarsat-1 and -2 satellites). With these sensors, scientists can assess functional GIW connectivity through the detection of GIW inundation and soil moisture changes over space and time (Lang et al. 2008, 2012; Huang et al. 2014; Vanderhoof et al. 2016). The spatial and temporal resolutions of remotely sensed data are important considerations for detecting GIW connectivity. The required resolution depends on management goals and landscape and climate characteristics.
Models
A suite of models are available to estimate GIW connectivity (WebFigure 1; WebTable 3) and, similar to measurements, provide implicit, quasi-explicit, and explicit connectivity information (Figure 3c). Few models were specifically developed for estimating GIW connectivity; however, many can be repurposed to do so (Golden et al. 2014). Prior to selecting a specific model, the following questions need to be answered:
What are the dominant GIW flowpaths (eg surface water, groundwater, or both) for the management area?;
How should these GIW flowpaths be represented across the landscape? (eg is the GIW connectivity information needed implicit, quasi-explicit, or explicit?); and
How should thresholds that determine GIW connections and isolation be represented in the model?
Flowpaths can vary in time and among landscape types. The dominant flowpaths across a network of wetlands or within a watershed guide the selection of the GIW modeling approach. Surface flowpaths can be determined through a broad range of approaches including graph theory and simulations. Graph theory approaches are mathematical ways of representing a landscape through the relationship between points (such as wetlands) and lines (such as flowpaths; eg Larsen et al. 2012). Alternatively, some methods can simulate the full spatial and temporal range of surface-water routing from and into wetlands (eg Chu et al. 2013). Groundwater flowpaths are relatively more complex but can be estimated through groundwater models (eg Harbaugh 2005) or models that couple surface and groundwater flow (eg Therrien et al. 2008).
Representations of GIW connectivity in models across the landscape are classified into three general groups, based on the type of GIW connectivity information they provide (WebFigure 1; WebTable 3). Spatially lumped models have no spatial detail and supply implicit GIW connectivity information (eg Liu and Schwartz 2011). Semi-distributed models break the watershed into subdivisions and produce information on quasi-explicit GIW connectivity (eg Evenson et al. 2016). Fully distributed models represent each point within the watershed and yield explicit GIW connectivity (eg Therrien et al. 2008; Ameli and Creed 2017).
Thresholds in connectivity modeling are values or equations that provide a switch to indicate when and where in the landscape GIWs transition from being isolated to being connected, or vice versa. Connectivity thresholds are used in models in different ways, producing either structural or functional connectivity. Otherwise, a model may rely on structural connectivity (eg land elevation across the landscape) as an input threshold and produce functional connectivity (eg the actual movement of water) as an output (WebFigure 1; WebTable 3). These thresholds can be modeled with empirically or process-based modeling approaches.
Empirically based models of GIW connectivity are primarily statistical or conceptual, requiring direct observations of connections to develop correlations between measured properties (eg wetland saturated area and streamflow; Creed et al. 2003). In contrast, process-based models simulate GIW connectivity processes. These models rely on rule-based thresholds above which the GIWs connect. For instance, connections may occur once a simulated maximum wetland water depth is reached and water spills out of the wetland. Alternately, they may allow connections to emerge in the landscape based on process laws (Bracken et al. 2013), such as the conservation of mass and momentum. Process-based models are generally more computationally and resource intensive than empirically based models.
Selecting tools for GIW management
Model trade-offs
Model selection is one of the most formidable challenges when assessing the appropriate tools for extensive or complex GIW protection or restoration management projects. The model selection process involves trade-offs that balance the fidelity and complexity required and the resources – such as the skill, data, time, and money – available for a particular management objective (Figure 5). Model fidelity is the degree to which a model faithfully represents the actual attributes and processes of the system (eg a wetland or watershed) being modeled. Model complexity refers to the number of factors (parameters, variables) and fluxes (eg the movement of water), and the degree to which physical processes of the system are represented in the model (Clark et al. 2015). In general, models with higher fidelity are also more complex.
Figure 5.
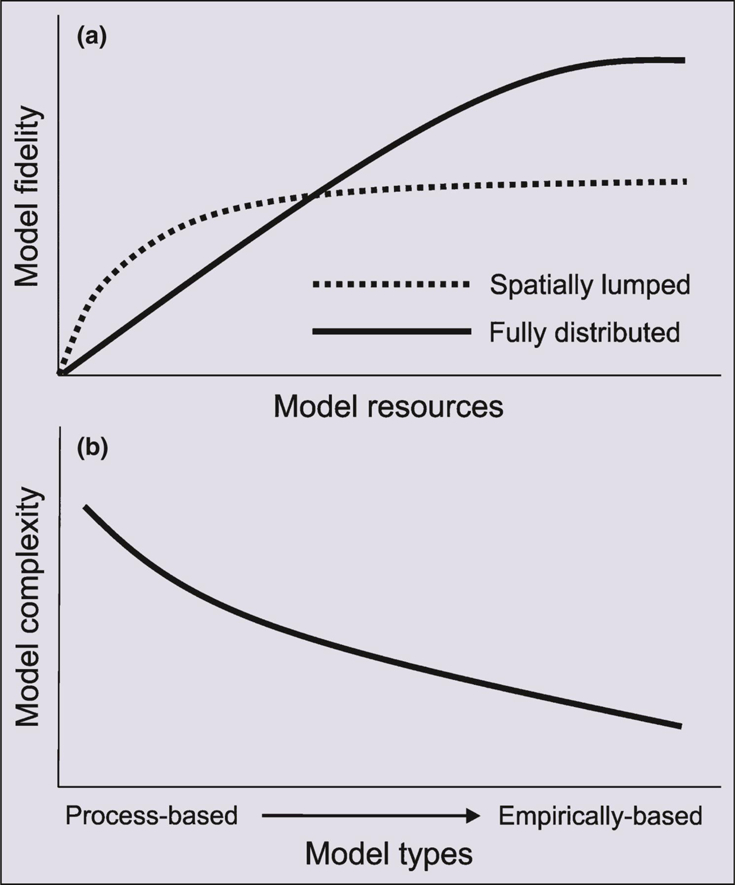
A manager’s guide to modeling GIW connectivity. (a) Trade-offs between model fidelity (the degree to which a model faithfully represents wetland or watershed attributes and processes) and resources are required for model selection. This hypothesized curve is modified by how connectivity is represented in the model, from spatially lumped (no spatial detail, providing implicit connectivity information) to fully distributed (represents each point within the watershed, providing explicit connectivity information). (b) Changes in model complexity (the number of model factors and fluxes, and the degree to which wetland and watershed physical processes are represented) occur along a process-based (simulated GIW connectivity) to empirically based (statistically or conceptually represented GIW connectivity) model gradient.
As the need for model fidelity increases, so too does the necessity for resources (Figure 5a). In most cases, fewer resources are required to reach the potential fidelity of a spatially lumped model (which provides implicit connectivity information) compared to that of a fully distributed model (which produces explicit connectivity information). However, potential fidelity is often higher in the latter. Ultimately, selecting the lowest fidelity model needed to answer a given question is the best choice to minimize resource expenditures.
The information required for a management objective should influence the level of model complexity necessary to evaluate GIW connectivity. If limited resources are available, or if only implicit information is needed on GIW connectivity, a model with low levels of fidelity and complexity could be used (Figure 5b; eg an empirically based model such as that of Rains et al. 2006). Alternately, in some situations, modeling skills and data on GIW connectivity are more abundant, or quasi-explicit or explicit connectivity information about GIWs is needed. These instances require models with greater fidelity and complexity, primarily process-based models. Such models may simulate a wide range of GIW flowpath dynamics (eg Min et al. 2010; Ameli and Creed 2017) and can provide greater support for data-driven decision making regarding GIW connectivity.
An effective and efficient science–policy interface
Scientists and managers need to collaborate and communicate to ensure that the most important GIW connectivity information is derived from models and measurements that will lead to optimal decision making. We argue that the primary issue for GIW protection and management targets is selecting the “right” set of tools, not the “best” single tool. This is because different management questions regarding GIWs require different types of information. For example, predicting how a 10% reduction in GIWs within a basin will affect total nutrient runoff requires information regarding implicit connectivity; details regarding the spatial placement of GIWs on the landscape are not relevant to this question. Employing spatially lumped models and complementary measurements are most efficient in terms of resources expended for the knowledge gained. In contrast, predicting which particular GIWs most affect nutrient runoff requires explicit connectivity information, in which case details regarding the spatial placement of the GIWs on the landscape are highly relevant. Here, employing fully distributed models and complementary measurements is most efficient. Irrespective of which management question is posed, it is important that concordance among the different estimates be sought; that is, simple to complex approaches should all converge on the same answer.
The potential for such complementary use of measurements and models can be illustrated in the management of the Lake Winnipeg Watershed of North America (Panel 1). In recent years, the frequency and magnitude of eutrophication events has increased, leading to the 2013 listing of Lake Winnipeg as the most threatened lake in the world (Global Nature Fund 2013). The integration of measurements and models will play an important role in mitigating nutrient runoff by designing GIW restoration strategies to maximize retention of nutrients.
Panel 1. Science to meet management needs – a spotlight on eutrophication
The financial cost of sound GIW management can be optimized by clearly defining the management question, understanding what information is required to answer that question, and using the appropriate type and combination of models and measurements.
For example, modifications to the Prairie Pothole Region (PPR) landscape of North America (Figure 6, a and b) have led to substantial GIW loss in the Lake Winnipeg Watershed (Figure 6c). The removal of GIWs in the watershed is known to decrease the capacity of the landscape to sequester nutrient runoff, facilitating phosphorus (P) inputs from agricultural areas to surface waters and contributing to severe algal blooms in Lake Winnipeg (Ulrichet al. 2016). As a result, Lake Winnipeg was designated as the 2013 “Threatened Lake of the Year” (Global Nature Fund 2013). Restoration of GIWs to reduce P loads to Lake Winnipeg is one management strategy being considered.
Figure 6.
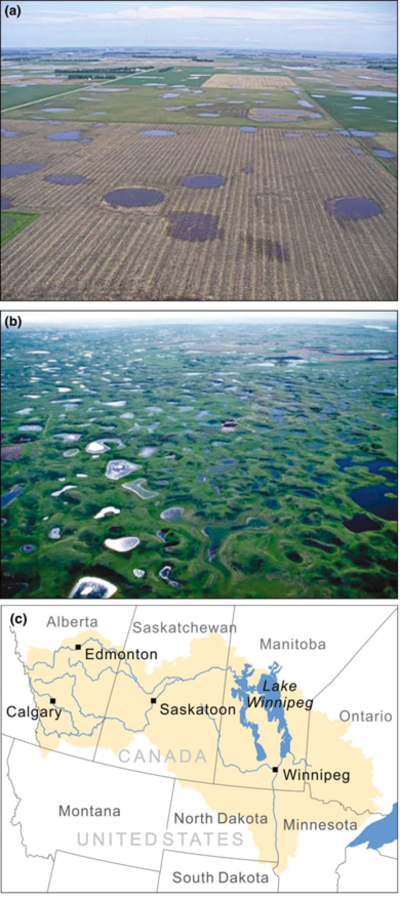
(a) GIWs in an agricultural landscape versus (b) the “original” distributions of GIWs in a landscape prior to human modification; (c) Lake Winnipeg Watershed.
US Fish and Wildlife Service
J Ringelman/Ducks Unlimited
A range of management questions are relevant to this issue. Each is associated with information at different spatial resolutions and requires different models and measurements, including:
What are the cumulative effects of current drivers (eg agriculture) and pressures (eg loss of GIWs) on P loads to Lake Winnipeg?;
What wetland restoration targets will help to lower P loading to the point where the risk of eutrophication events is reduced to acceptable levels?; and
Where within the watershed should wetland restoration be prioritized?
As a manager goes from question 1 to question 3, the necessary knowledge about connectivity shifts from implicit to explicit, and the most efficient measurement and modeling approaches shift from spatially lumped to fully distributed.
Integrating tools for GIW connectivity
Scientists have reached a pivotal junction in the development of tools for quantifying GIW connectivity. The adoption of multiple measurements and models (ie an “ensemble approach”) will be at the forefront of future developments. Convergence of these measurements and models will lead to greater certainty in evidence, less reliance on hypothesized connections (Figure 2), and therefore increased progress toward an integrated approach to decision making.
Measurements obtained from novel or advanced technology provide not only the measured data (ie “hard” data) but also sets of qualitative knowledge interpreted from them (ie “soft” data). This interpreted knowledge does not include exact numbers but enables insights about how a system works (Seibert and McDonnell 2002). In some cases, interpreted knowledge derived from measured data can be more helpful for modeling than the measured data themselves. For example, Vaché and McDonnell (2006) relied on measurements of surface flowpath distances (the measured data) to estimate variations in how long water is stored across a watershed (the interpreted knowledge). The interpreted knowledge was more effective as input to their watershed model. Scientists who collect measurements and those who develop models must therefore be willing to consider both the direct use of measured data and the knowledge interpreted from them. The former can empirically demonstrate GIW connectivity, and the latter can provide insights on how to conceptualize GIW connectivity processes.
Modelers must become increasingly adaptable in terms of (1) modifying their models to better align with data produced by GIW connectivity measurements, and (2) incorporating potential feedbacks as new data become available. Model advances should also follow the principle of Occam’s razor where appropriate – meaning that models should have just as much complexity as needed to capture GIW connectivity for the targeted management question and context. At the same time, scientists should focus on developing interfaces for managers that interpret outputs of complex models.
Integrated measurement and modeling tools can also help to estimate and quantify how GIW connectivity varies in space and time. For instance, Horton’s scaling laws, such as those that scale small streams to river networks (Leopold et al. 1964), are used to develop simple models of water flowpaths and nitrogen transport (eg Gomez-Velez et al. 2015). Similar approaches could be developed to scale measurements at individual GIWs to multiple GIWs connecting across a landscape. Furthermore, better assessment of GIW dynamics – including expanding, contracting, and merging of GIWs based on climatic and landscape conditions – is needed. Such information can be obtained from remotely sensed data and extrapolated to other domains through modeling. Literature that describes approaches for estimating temporally varying connections of ephemeral streams (eg Czuba and Foufoula-Georgiou 2015) could inform methods for temporally varying connections in GIWs – both among GIWs and between GIWs and streams.
Conclusions
GIWs are frequently excluded from policy and management directives because evidence of their connections to, and consequent effects on, downstream waters is lacking. Recent recognition of extensive GIW declines combined with the growing importance of protecting wetlands equates to a crucial issue: scientists and natural resource managers alike are increasingly challenged to develop and select efficient tools to demonstrate GIW connectivity in the landscape. Scientists and managers must therefore collaborate to design appropriate models, standardize model input, and then translate model output into evidence.
Quantifying GIW connectivity through measurements is useful for developing conceptual models of hydrologic functions among groups of GIWs or within a watershed. However, measurements alone are resource intensive and often cost-prohibitive to collect, may not be comprehensive enough to provide the necessary evidence, and could contribute to misunderstandings about watershed systems. Models, combined with measurements, can reduce uncertainty (by reproducing measured data) and increase generalizability (by simulating GIW connections or isolation across a range of spatial and temporal scales). Integrating measurements with models will help to provide converging evidence of GIW connectivity, which is essential for improved decision making.
Supplementary Material
Acknowledgements
This paper arose from a meeting associated with the John Wesley Powell Center for Analysis and Synthesis “North American Synthesis on the Connectivity of Geographically Isolated Wetlands to Downstream Waters” Working Group, funded by the USGS. We thank S Leibowitz, N Smucker, and K Kowalski for helpful insights and final editing, as well as D Aldred and J Serran for graphical editing assistance. Findings and conclusions in this article are those of the authors and the USGS, and do not necessarily reflect or represent the views or policies of the EPA or the USFWS.
References
- Alexander LC. 2015. Science at the boundaries: scientific support for the Clean Water Rule. Freshwater Sci 34: 1588–94. [Google Scholar]
- Ali GA and Roy AG. 2009. Revisiting hydrologic sampling strategies for an accurate assessment of hydrologic connectivity in humid temperate systems. Geogr Compass 3: 350–74. [Google Scholar]
- Ameli AA and Creed IF. 2017. Quantifying hydrologic connectivity of wetlands to surface water systems. Hydrol Earth Syst Sci 21: 1791–808. [Google Scholar]
- Blöschl G and Sivapalan M. 1995. Scale of issues in hydrological modelling: a review. Hydrol Process 9: 251–90. [Google Scholar]
- Bracken LJ, Wainwright J, Ali GA, et al. 2013. Concepts of hydrological connectivity: research approaches, pathways and future agendas. Earth- Sci Rev 119: 17–34. [Google Scholar]
- Chu X, Yang J, Chi Y, et al. 2013. Dynamic puddle delineation and modeling of puddle- to- puddle filling- spilling- merging- splitting overland flow processes. Water Resour Res 49: 3825–29. [Google Scholar]
- Clark MP, Ying F, Lawrence DM, et al. 2015. Improving the representation of hydrologic processes in Earth System Models. Water Resour Res 51: 5929–56. [Google Scholar]
- Cohen MJ, Creed IF, Alexander LC, et al. 2016. Do geographically isolated wetlands influence landscape functions? P Natl Acad Sci USA 113: 1978–86. [DOI] [PMC free article] [PubMed] [Google Scholar]
- Creed IF, Aldred DA, Serran JN, et al. 2017. Maintaining the portfolio of wetland functions on landscapes: a rapid evaluation tool for estimating wetland functions and values. In: Dorney J, Savage R, Tiner R, and Adamus P (Eds). Wetland and stream rapid assessments: development, validation, and application Elsevier; In press. [Google Scholar]
- Creed IF, Sanford SE, Beall FD, et al. 2003. Cryptic wetlands: integrating hidden wetlands in regression models of the export of dissolved organic carbon from forested landscapes. Hydrol Process 17: 3629–48. [Google Scholar]
- Czuba JA and Foufoula-Georgiou E. 2015. Dynamic connectivity in a fluvial network for identifying hotspots of geomorphic change. Water Resour Res 51: 1401–21. [Google Scholar]
- Depew DJ and Lyne J. 2013. The productivity of scientific rhetoric. Poroi 9: art4. [Google Scholar]
- Dixon MJR, Loh J, Davidson NC, et al. 2016. Tracking global change in ecosystem area: the Wetland Extent Trends index. Biol Conserv 193: 27–35. [Google Scholar]
- EPA (US Environmental Protection Agency). 2015. Connectivity of streams and wetlands to downstream waters: a review and synthesis of the scientific evidence. Technical report EPA/600/R-14/475F Washington, DC: EPA. [Google Scholar]
- Evenson GR, Golden HE, Lane CR, and D’Amico E. 2016. An improved representation of geographically isolated wetlands in a watershed-scale hydrologic model. Hydrol Process 30: 4168–84. [Google Scholar]
- Global Nature Fund. 2013. Threatened Lake of the Year 2013: Lake Winnipeg in Canada www.globalnature.org/35753/Living-Lakes/Threatened-Lake-2016/Threatened-Lake-2013/resindex.aspx. Viewed 19 Apr 2017.
- Golden HE, Lane CR, Amatya DM, et al. 2014. Hydrologic connectivity between geographically isolated wetlands and surface water systems: a review of select modeling methods. Environ Model Softw 53: 190–206. [Google Scholar]
- Gomez-Velez JD, Harvey JW, Cardenas MB, et al. 2015. Denitrification in the Mississippi River network controlled by flow through river bedforms. Nat Geosci 8: 941–45. [Google Scholar]
- Harbaugh AW. 2005. MODFLOW-2005, the US Geological Survey modular ground-water model: the ground-water flow process. US Geological Survey Techniques and Methods 6-A16 Reston, VA: USGS. [Google Scholar]
- Huang C, Peng Y, Lang M, et al. 2014. Wetland inundation mapping and change monitoring using Landsat and airborne LiDAR data. Remote Sens Environ 141: 231–42. [Google Scholar]
- Jencso KG, McGlynn BL, Gooseff MN, et al. 2009. Hydrologic connectivity between landscapes and streams: transferring reach- and plot-scale understanding to the catchment scale. Water Resour Res 45: W04428. [Google Scholar]
- Junk WJ, An S, Finlayson CM, et al. 2013. Current state of knowledge regarding the world’s wetlands and their future under global climate change: a synthesis. Aquat Sci 75: 151–67. [Google Scholar]
- Kata A 2010. A postmodern Pandora’s box: anti-vaccination misinformation on the Internet. Vaccine 28: 1709–16. [DOI] [PubMed] [Google Scholar]
- Lane CR and D’Amico E. 2016. Identification of putative geographically isolated wetlands of the conterminous United States. J Am Water Resour Assoc 52: 705–22. [Google Scholar]
- Lang M, Kasischke E, Prince S, et al. 2008. Assessment of C-band synthetic aperture radar data for mapping coastal plain forested wetlands in the Mid-Atlantic region. Remote Sens Environ 112: 4120–30. [Google Scholar]
- Lang M, McCarty G, McDonough O, et al. 2012. Enhanced detection of wetland-stream connectivity using LiDAR. Wetlands 32: 461–73. [Google Scholar]
- Larsen LG, Choi J, Nungesser MK, et al. 2012. Directional connectivity in hydrology and ecology. Ecol Appl 22: 2204–20. [DOI] [PubMed] [Google Scholar]
- Leibowitz SG. 2015. Geographically isolated wetlands: why we should keep the term. Wetlands 35: 997–1003. [Google Scholar]
- Leopold LB, Wolman MG, and Miller JP. 1964. Fluvial processes in geomorphology Mineola, NY: Courier Dover Publications. [Google Scholar]
- Liu G and Schwartz FW. 2011. An integrated observational and model-based analysis of the hydrologic response of prairie pothole systems to variability in climate. Water Resour Res 47: W02504. [Google Scholar]
- Marton JM, Creed IF, Lewis DB, et al. 2015. Geographically isolated wetlands are important biogeochemical reactors on the landscape. BioScience 65: 408–15. [Google Scholar]
- McDonough OT, Lang MW, Hosen JD, and Palmer MA. 2014. Surface hydrologic connectivity between Delmarva bay wetlands and nearby streams along a gradient of agriculture alteration. Wetlands 35: 41–53. [Google Scholar]
- McLaughlin DL and Cohen MJ. 2013. Realizing ecosystem services: wetland hydrologic function along a gradient of ecosystem condition. Ecol Appl 23: 1619–31. [DOI] [PubMed] [Google Scholar]
- Min J-H, Paudel R, and Jawitz JW. 2010. Spatially distributed modeling of surface water flow dynamics in the Everglades ridge and slough landscape. J Hydrol 390: 1–12. [Google Scholar]
- Mushet DM, Calhoun AJ, Alexander LC, et al. 2015. Geographically isolated wetlands: rethinking a misnomer. Wetlands 35: 423–31. [Google Scholar]
- Okin GS, Moreno-de las Heras M, Saco PM, et al. 2015. Connectivity in dryland landscapes: shifting concepts of spatial interactions. Front Ecol Environ 13: 20–27. [Google Scholar]
- Rains MC, Fogg GE, Harter T, et al. 2006. The role of perched aquifers in hydrological connectivityand biogeochemical processes in vernal pool landscapes, Central Valley, California. Hydrol Process 20: 1157–75. [Google Scholar]
- Rains MC, Leibowitz SG, Cohen MJ, et al. 2016. Geographically isolated wetlands are part of the hydrological landscape. Hydrol Process 30: 153–60. [Google Scholar]
- Seibert J and McDonnell JJ. 2002. On the dialog between experimentalist and modeler in catchment hydrology: use of soft data for multicriteria model calibration. Water Resour Res 38: 1241. [Google Scholar]
- Therrien R, McLaren R, Sudicky E, et al. 2008. HydroGeoSphere: a three-dimensional numerical model describing fully-integrated subsurface and surface flow and solute transport Waterloo, Canada: Groundwater Simulations Group. [Google Scholar]
- Tiner RW. 2003. Geographically isolated wetlands of the United States. Wetlands 23: 494–516. [Google Scholar]
- Ulrich AE, Malley DF, and Watts PD. 2016. Lake Winnipeg Basin: advocacy, challenges and progress for sustainable phosphorus and eutrophication control. Sci Total Environ 542, Part B: 1030–39. [DOI] [PubMed] [Google Scholar]
- Vaché KB and McDonnell JJ. 2006. A process-based rejectionist framework for evaluating catchment runoff model structure. Water Resour Res 42: W02409. [Google Scholar]
- Vanderhoof MK, Alexander LC, and Todd JM. 2016. Temporal and spatial patterns of wetland extent influence variability of surface water connectivity in the Prairie Pothole Region, United States. Landscape Ecol 31: 805–24. [Google Scholar]
Associated Data
This section collects any data citations, data availability statements, or supplementary materials included in this article.


