

Abstract
Cells are regularly exposed to a range of naturally occurring stress that can restrict growth or cause lethality. In response, cells activate expression networks with hundreds of genes that together increase resistance to common environmental insults. However, stress response networks can be insufficient to ensure survival, which raises the question of whether cells possess genetic programs that can promote adaptation to novel forms of stress. We found transposable element (TE) mobility in Schizosaccharomyces pombe was greatly increased when cells were exposed to unusual forms of stress such as heavy metals, caffeine, and the plasticizer phthalate. By subjecting TE-tagged cells to CoCl2, we found the TE integration provided the major path to resistance. Groups of insertions that provided resistance were linked to TOR regulation and metal response genes. We extended our study of adaptation by analyzing TE positions in 57 genetically distinct wild strains. The genomic positions of 1048 polymorphic LTRs were strongly associated with a range of stress response genes, indicating TE integration promotes adaptation in natural conditions. These data provide strong support for the idea, first proposed by Barbara McClintock, that TEs provide a system to modify the genome in response to stress.
Cells are regularly challenged by environmental stress, to which rapid and robust responses are critical to their survival. To cope with adverse conditions, cells activate transient programs of transcription that alter expression of hundreds to thousands of genes (Morimoto 1998; Chen et al. 2003; Mahat et al. 2016; Vihervaara et al. 2018). Global response pathways such as those activated by heat shock or hypoxia induce pools of transcriptional trans-activators to trigger rapid expression of gene networks.
Specific and prewired transcription responses have evolved due to frequent exposure to a common set of external stresses. However, it is not clear how cells cope when confronted with environmental shock, defined here as novel stresses or conditions that are unusually prolonged or extreme for which existing responses are inadequate to support survival. Adaptation to environmental shock requires genetic alterations that would typically occur in regulatory regions but could also alter coding sequence. These genetic modifications can clearly be achieved through spontaneous mutations. However, preexisting single-nucleotide mutations are randomly distributed, are mostly neutral or detrimental, and, as a result, would not allow survival to abrupt environmental shock if population sizes are limited. One potential solution is the hypothesis that cells possess a mechanism that responds to environmental changes by increasing errors in DNA replication (Cairns et al. 1988; Cairns and Foster 1991). However, this possibility remains unresolved because model reporters suggest stress-induced growth limitation may not influence replication errors (Roth et al. 2006; Maisnier-Patin and Roth 2015; Yamayoshi et al. 2018). Thus, while point mutations in regulatory or coding sequences have the potential to allow survival following environmental shock, they may often be inadequate.
Transposable elements (TEs) are genetically diverse mobile sequences that have proliferated extensively throughout eukaryotic genomes. These mobile elements respond to stress and through integration alter genome structure (Horvath et al. 2017). In her seminal studies of maize, Barbara McClintock discovered TEs and found their mobility allows them to “enter and take over control of genes” (McClintock 1984). We now know that TEs carry regulatory elements that can control genes by altering their transcription and splicing (Jordan et al. 2003; Bourque et al. 2008; Faulkner et al. 2009). The high copy numbers of TEs, together with their regulatory sequences, cause them to have a large role in shaping the transcriptome. TE sequences are estimated to be present in 25% of human promoters (Jordan et al. 2003), and genome-wide studies of transcription demonstrate that TEs provide a substantial fraction of tissue-specific and alternative promoters (Faulkner et al. 2009; Macfarlan et al. 2012; Mele et al. 2015). This ability of TEs to impact transcription adds support to McClintock's proposal that TEs provide a means to overcome the threat of environmental shock by reorganizing the genome (McClintock 1984). Despite many reports that TEs are induced by stress and despite examples of individual integration events that result in growth phenotypes, the tenet that TE mobility provides a program that overcomes environmental stress has not been directly tested.
TEs of model organisms provide a unique opportunity to study the biological impact of active transposition in genetically tractable systems (Curcio et al. 2015; Eickbush and Eickbush 2015; Esnault and Levin 2015; Majumdar and Rio 2015; Sandmeyer et al. 2015; Sultana et al. 2017). Integration of the LTR retrotransposon Tf1 of Schizosaccharomyces pombe has been studied by determining as many as 1 million integration events with high-throughput sequencing (Guo and Levin 2010; Chatterjee et al. 2014; Esnault and Levin 2015; Hickey et al. 2015). The overwhelming majority of de novo insertions cluster in the nucleosome-depleted region of RNA polymerase Pol II–transcribed promoters. Importantly, the insertions are directed to approximately 1000 promoters with an enrichment for stress response genes (Guo and Levin 2010; Chatterjee et al. 2014). This highly selective integration pattern is mediated by Sap1, a factor that interacts with Tf1 integrase and binds selectively to the promoters at the precise positions where insertions occur (Hickey et al. 2015; Jacobs et al. 2015). A stress response enhancer imbedded in Tf1 causes integration to induce the expression of adjacent promoters (Leem et al. 2008; Feng et al. 2013). The prominent clustering of integration in promoters and the influence of the Tf1 enhancer on adjacent genes suggest the intriguing possibility that Tf1 may be wired to provide a genetic system for efficient adaptation to environmental stress.
Results
Diverse forms of stress activate transcription and retrotransposition
The expression of many TEs is induced by stress conditions (McClintock 1984; Chen et al. 2003; Hashida et al. 2003; Todeschini et al. 2005; Hashida et al. 2006; Sehgal et al. 2007; Chénais et al. 2012; Jardim et al. 2015; Miousse et al. 2015; Morales et al. 2015). This includes single-copy Tf1 elements previously shown to be induced by heat shock and oxidative stress (Feng et al. 2013). We explored the possibility that Tf1 responds to environmental shock by measuring its expression in cells subjected to the heavy metal CoCl2 (Fig. 1A). Of four single-copy Tf1 elements previously found to be induced by heat shock, CoCl2 significantly increased expression of three out of four (Fig. 1B; Feng et al. 2013).
Figure 1.
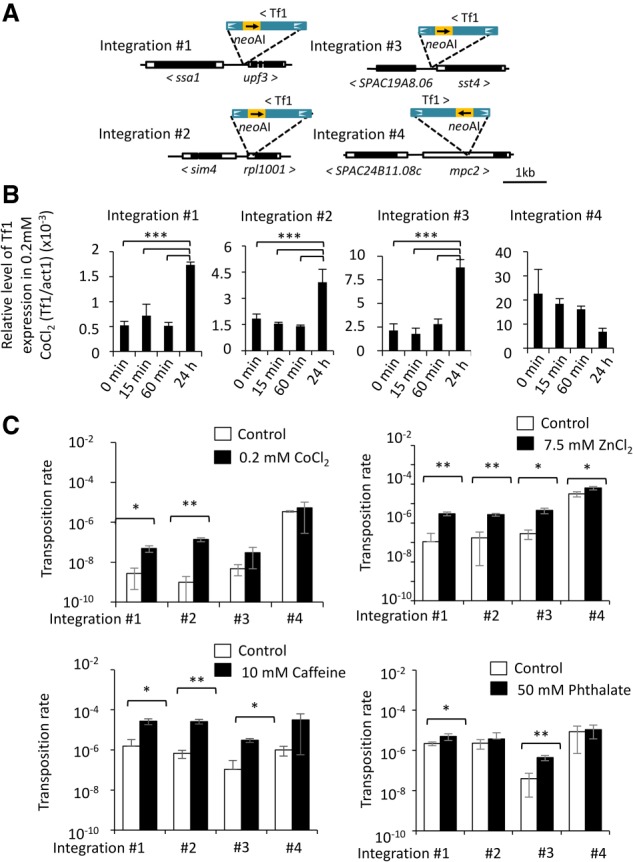
Diverse forms of environmental stress induce Tf1 expression and transposition. (A) Tf1 integration sites generated in a previous study (Feng et al. 2013). For mobility assays, we added an artificial intron in neo (neoAI). White boxes indicate UTR; black boxes, ORF; line, intergenic region. (B) Relative level of Tf1 mRNA over time during exposure to CoCl2. (C) Tf1 transposition rate after exposure to CoCl2, ZnCl2, caffeine, and phthalate. Differences that are significant are indicated as follows: (*) P ≤ 0.05; (**) P ≤ 0.005; (***) P ≤ 0.0005.
Although stress-induced transcription of many TEs can be readily documented, it is difficult to determine whether this expression results in increased transposition events. We were able to measure transposition rates of the same four single-copy Tf1 elements using an assay that relies on a neo gene disrupted with an artificial intron (AI) (Atwood et al. 1998; Rai et al. 2017). We found three of the four single-copy Tf1 elements generated six- to 139-fold higher rates of transposition when cells were exposed to CoCl2 for 24 h (Fig. 1C). We further explored the biological importance of activated transposition by exposing cells to a range of unusual stress conditions. Indeed, transposition of these single-copy Tf1 elements was induced by growing cells in another heavy metal, ZnCl2 (Fig. 1C). Importantly, transposition was also stimulated by agents foreign to S. pombe such as caffeine and a ubiquitous environmental pollutant, the plasticizer phthalate (Fig. 1C). Interestingly, no correlation was observed between rates of transposition and growth rates on media containing the stress agents (Supplemental Fig. S1). Transposition induced by such a range of unusual stress conditions indicates that Tf1 may stimulate adaptation of S. pombe to environmental shock.
Competition in CoCl2 identifies groups of insertions that improve resistance
Although the distribution of insertions to stress promoters (Guo and Levin 2010; Chatterjee et al. 2014; Esnault and Levin 2015; Hickey et al. 2015) and the activation of adjacent genes (Feng et al. 2013) suggest Tf1 has the means to increase resistance to stress, there are other scenarios. To test whether transposition does play a significant role in adaptation, we conducted controlled experiments with laboratory strains. We challenged populations of highly characterized laboratory isolates by passaging them in medium containing different concentrations of a broad range toxin that is not common in natural substrates. We selected CoCl2 in part because it generates reactive oxygen species, causes DNA damage, induces apoptosis, and mimics hypoxia (Lee et al. 2007; Simonsen et al. 2012; Gallo et al. 2014; Zhong et al. 2014, 2015; Yang et al. 2015; Tan and Miyamoto 2016). Unlike the experiments in Figure 1 where CoCl2 stimulated rates of de novo integration of 1 × 10⁻⁷ per cell per generation, here we used cultures where each cell contained one of 41,000 preestablished insertions of Tf1-neo that we created by overexpression of Tf1 followed by selection for integration events (Methods; Supplemental Fig. S2). Each cell contained a specific insertion that served as a tag that we used to measure clonal expansion during competitive growth. With high-throughput sequencing of the Tf1-neo tags, we monitored clonal expansion in cultures grown for 80 generations in 0.0, 0.2, or 1.2 mM CoCl2 (Fig. 2A). Three independent passaging experiments were conducted for each CoCl2 concentration. The 0.2 mM CoCl2 caused modest reductions in growth in each passage, while 1.2 mM CoCl2 resulted in greater impairment, particularly during passage no. 2 (Fig. 2B).
Figure 2.

A reproducible set of Tf1 integration tags showed improved growth in CoCl2. (A) Cells with Tf1 integration tags were passaged for 80 generations in CoCl2. Changes in clonal populations were monitored by sequencing the tags at T = 0 and T = 80 generations. (B) Number of generations observed per 24-h passage. (C–E) Proportions of cells in the cultures containing a Tf1 integration tag at each of the insertion sites at the beginning (T = 0; x-axis) versus the end (T = 80; y-axis) of the passages without CoCl2 (C) or in the presence of 0.2 mM (D) or 1.2 mM (E) CoCl2. Insertion site tags that changed twofold or more in all three replicated experiments are considered to have expanded (red) or diminished (green).
We monitored changes in the populations of clones in the final cultures (T = 80) relative to their prominence in the initial culture (T = 0). Spontaneous mutations that improve growth would lead to significant increases in the integration tag present in the mutated cell, while the same tag would be unlinked to the spontaneous mutation in other independent passaging experiments and would not be expected to increase. We assessed the occurrence of this type of mutation and found no evidence that after 80 generations the passaging experiments were dominated by tags that were exclusive to single experiments.
We next assessed whether the Tf1 insertions themselves provided a prominent path to improved growth by identifying clones that expanded in each of the three independent passaging experiments. If after 80 generations an individual insertion site increased twofold or more in proportion in all three replicated experiments, we considered that site to have expanded (Fig. 2C–E, red), while we considered a site that decreased twofold or more in all replicated experiments to have diminished (Fig. 2C–E, green). In cultures grown without CoCl2, the bulk of the insertions (97.6%,) (Table 1) did not change in proportion after 80 generations of growth (Fig. 2C, gray; Supplemental Table S1). When these positions were plotted based on their average proportion at T = 0 versus T = 80, they fell largely on the diagonal, indicating Tf1 did not significantly impact growth in the absence of CoCl2 (Fig. 1C).
Table 1.
Proportion of clonal populations that changed in three independent passaging experiments

Much larger changes occurred in the cultures that contained CoCl2. With 0.2 mM CoCl2, 106 integration positions reproducibly increased in proportion after 80 generations (Fig. 2D, red; Table 1). That the three sets of enriched positions contained an overlap of 106 sites was highly significant with a hypergeometric P < 1.47 × 10−44. These positions accounted for 3.1% of the initial culture and expanded strikingly to become 58%, 52%, and 31% (average of 47%) of the final cultures for passaging experiments 1, 2, and 3, respectively. These substantial percentages of reproducible tags indicate that the Tf1 insertions contributed significantly to improved growth. There were 6041 positions that decreased twofold or more, accounting for 59.3% of the culture at T = 0, and that were reduced to 4.0% in T = 80 (Table 1). In the cultures grown in 1.2 mM CoCl2, just five integration positions increased twofold or more in the three independent cultures (Fig. 2E, red; Table 1). Growth during the second passage of the 1.2 mM CoCl2 cultures was greatly restricted, suggesting there was a severe bottleneck that may have limited the diversity of insertions that were beneficial. As a result, the enriched sites differed from culture to culture. A total of 51 integration positions expanded twofold or more in at least one of the independent passaging experiments containing 1.2 mM CoCl2. As expected for growth in the higher concentration of CoCl2, more integration positions decreased in the cultures that contained 1.2 mM CoCl2 versus 0.2 mM CoCl2 (Fig. 2E, green).
By analyzing insertion clones in the individual 0.2 mM CoCl2 passaging experiments, we found a reproducible set of 106 competition-enriched insertions marked the cells with the greatest increase, indicating that the Tf1 insertions themselves contributed the most to improved growth. Sixteen of the 51 positions expanded in 1.2 mM CoCl2 were also identified in the three replica cultures grown in 0.2 mM, suggesting these sites also improved growth. The increased representation of insertion sites in cells grown in CoCl2 suggested the possibility that Tf1 improved cell growth by modulating the expression of specific groups of genes. To determine whether specific pathways were implicated, we analyzed the 141 (0.2 mM + 1.2 mM) enriched Tf1 positions and found all but six were in intergenic regions. Two hundred fifty genes adjacent to enriched Tf1 positions in intergenic sequences were evaluated for Gene Ontology (GO) enrichment (Fig. 3A). We found five function, process, and phenotype ontologies were enriched among our gene set (Supplemental Table S2). Ontologies enriched with P-values <0.05 included three networks of coregulated genes: Cd-induced, H2O2-induced, and Tor1-regulated genes. Altering expression of genes induced by the heavy metal Cd and the oxidizing agent H2O2 has the potential to improve growth in CoCl2. Other processes with P-values <0.05 were the 11.6- and 4.9-fold enrichments associated with resistance to canavanine and amino acid import, respectively. It is striking that three groups of significantly enriched genes are associated with the target of rapamycin (TOR) pathways. Amino acid transporters are regulators of the TOR pathways (Chantranupong et al. 2015, 2016; Wang et al. 2015b; Eltschinger and Loewith 2016; Goberdhan et al. 2016; Saxton et al. 2016), and because canavanine is a toxic analog of L-arginine, the resistance mutations are involved in arginine transport (Rosenthal 1977). The enrichment of factors involved in arginine transport is particularly relevant because arginine is a key regulator of TOR (Chantranupong et al. 2015; Rebsamen et al. 2015; Wang et al. 2015b). This association of enriched groups involved in TOR regulation is notable and consistent with the possibility that TOR activity reduces CoCl2 toxicity.
Figure 3.

TOR pathways provide resistance to CoCl2. (A) Ontology of genes adjacent to competition-enriched Tf1 insertions are associated with TOR signaling, stress response, and cation transport. P-values based on hypergeometric tests were corrected per gene set by false-discovery rate. (*) P ≤ 0.05; (**) P ≤ 0.005. (B) Regulatory relationships of genes in the TOR pathways. Intracellular amino acid concentrations regulate TORC1 and TORC2, leading to the regulation of various downstream processes. Thirty-six genes shown in blue were adjacent to competition-enriched Tf1 insertion tags. Reproduction* indicates genes involved in mating and meiosis. (C) Growth phenotype on solid media containing CoCl2 of cells lacking factors in TORC1 and TORC2 pathways.
TOR pathways provide resistance to CoCl2
TOR pathways rely on highly conserved serine/threonine kinases that control proliferation, survival of environmental stress, and protein translation (Loewith and Hall 2011; Workman et al. 2014; Chantranupong et al. 2015; Weisman 2016). Two evolutionarily conserved TOR complexes (TORC1 and TORC2) participate in pathways that regulate separate and sometimes overlapping processes. The TORC1 complex plays a primary role in regulating growth, while TORC2 is required to survive starvation and a variety of other environmental stresses. In S. pombe the nomenclature is awkward as Tor2 is the kinase of the TORC1 complex and Tor1 assembles in the TORC2 complex.
Thirty-six of the genes adjacent to the competition-enriched positions participate in TOR signaling, are involved in amino acid transport, or are regulated by TORC1 (Fig. 3B, blue text). Genes in these groups include Mip1, a core subunit of TORC1; Gtr2 and Vma10, inducers of TORC1; and two key inhibitors of TORC1, Tsc1 and Npr2. Importantly, sat1, a direct inducer of TORC2, was also adjacent to an enriched insertion.
We tested whether the TORC1 and TORC2 pathways mitigate cobalt toxicity by growing strains lacking TOR factors on solid media containing a high concentration of CoCl2. Although wild-type cells grew slowly on plates with CoCl2, greater defects were observed for strains lacking Tco89 and Tor1, key subunits of TORC1 and TORC2, respectively (Fig. 3C). It was equally significant that strains lacking inhibitors of TORC1 (Tsc1, Tsc2, and Npr2) showed improved growth on CoCl2. Lack of Sat1, the TORC2 activator, greatly increased sensitivity to CoCl2. The absence of Sin1, a component of TORC2, also resulted in sensitivity to CoCl2. These results demonstrate that both TORC1 and TORC2 activity provide resistance to CoCl2.
Single Tf1 insertions are sufficient for resistance to CoCl2
The contribution of the TOR pathways to CoCl2 resistance argues that the Tf1 insertions improved growth by modifying the expression of TOR factors. However, it is possible that the enriched insertions detected are simply passenger mutations and make no direct contribution to CoCl2 resistance. In addition, the enriched insertions might function in combination with second site mutations to create resistance. Although the reproducibility of the enriched positions indicated the Tf1 insertions play a key role in resistance to CoCl2 we decided to test directly whether single Tf1 insertions were sufficient to improve growth in CoCl2.
We tested the contribution of a cadmium-induced gene by recreating a strain with Tf1-neo inserted next to zrt1 at the same nucleotide position and orientation that was enriched in the competition experiments (Fig. 4A, integration 5). We also tested the contribution of modified TORC1 and TORC2 activity by recreating the insertions adjacent to tsc1 and sat1, again at the same nucleotide position and orientation that expanded in the competition cultures (Fig. 4A, integrations 6 and 7). To evaluate their fitness, each of the recreated insertions was combined with equal proportions of cells lacking the insertion and grown in competition for 80 generations. Three independent passaging experiments were performed for each of the reconstructed strains. Surprisingly, wild-type cells lacking the insertions outcompeted each of the three insertions when grown without CoCl2 (Fig. 4B, left). These results demonstrate that the insertions imposed an overall burden on growth. Importantly, in competition cultures containing CoCl2, all three insertions significantly outcompeted the wild-type cells lacking the insertions (Fig. 4B, right). This demonstrates these Tf1-neo integrations were sufficient to improve growth in CoCl2.
Figure 4.

Single Tf1 insertions were sufficient for resistance to CoCl2 by regulating expression of adjacent genes. (A) The genomic context of enriched Tf1 integration tags reconstructed by homologous recombination. (B) Competition in 0.0 mM (left), 0.2 or 1.2 mM (right) CoCl2 between cells lacking Tf1 and cells containing genomic integrations 5, 6, or 7. (C) Relative level of expression of genes adjacent to Tf1 integration sites. (ON) Overnight exposure to stress.
We next tested whether the inserts altered expression of their adjacent genes. Integration 5 occurred within the 5′ UTR of zrt1 69 bp downstream from the start of transcription. RT-qPCR analysis of RNA from cultures showed that this Tf1 insert profoundly reduced zrt1 mRNA regardless of whether CoCl2 was present (Fig. 4C). This insertion had no effect on the expression of the other flanking gene, mok13 (located 2.3 kb upstream). These results indicate that the improved growth in CoCl2 caused by integration 5 was likely due to reduced expression of zrt1.
Integration 6 was inserted 130 bp upstream of the 5′ UTR of tsc1 and 625 bp upstream of the 5′ UTR of rgs1. This insertion significantly reduced both tsc1 and rgs1 mRNA in cultures lacking CoCl2. However, in the presence of CoCl2, only the expression of tsc1 was reduced, indicating that the lower levels of tsc1 expression likely caused the improved growth in the competition experiments (Fig. 4C).
Integration 7 was positioned in the 3′ UTR of sat1 193 bp after the stop codon and 3.8 kb upstream of the ssn6 5′ UTR. This insertion caused increases in sat1 mRNA especially in the presence of CoCl2, whereas no change in ssn6 mRNA was observed (Fig. 4C). It is therefore likely that integration 7 improved growth in CoCl2 by increasing expression of sat1. Taken together, the changes in mRNA levels caused by Tf1 integration in the reconstructed strains likely improved growth in CoCl2 by increasing TOR activity or reducing amounts of a key metal uptake factor, Zrt1 (Dainty et al. 2008).
In wild isolates of S. pombe, LTRs are enriched in promoters of stress response genes
If transposition makes an important contribution to adaptation, we expect that in wild isolates of S. pombe, insertions would be associated with genes known to mitigate stress. We explored this possibility by examining the genomic positions of 1048 LTRs from 57 genetically distinct wild strains of S. pombe isolated from around the globe (Jeffares et al. 2015). These LTRs clustered in promoter sequences similar to what is observed for de novo integration of Tf1 (Supplemental Fig. S3; Guo and Levin 2010; Chatterjee et al. 2014; Esnault and Levin 2015; Hickey et al. 2015). We evaluated the potential impact of recent integration events on adaptation to stress by analyzing the 859 LTRs that are polymorphic among the collection of wild strains. Ontology screens of the genes flanking the LTRs revealed high enrichment of activity that contributes to sporulation frequency in many of the wild isolates (Fig. 5A). These enrichments occurred in multiple yeast clades, indicating the clusters of LTRs adjacent to sporulation efficiency genes formed independently in different populations (Fig. 5B). The reoccurring clusters of LTRs at sporulation frequency genes are consistent with the independent adaptation that would be expected to enhance survival of strains challenged by environmental stress. Genes adjacent to polymorphic LTRs were also enriched with other survival functions such as resistance to heat shock, sensitivity to high osmolarity, and induction by peroxide (Supplemental Fig. S4). A formal possibility was that these promoters were under reduced purifying selection, which would account for their observed enrichment of LTRs. However, a test that uses single-nucleotide polymorphisms (Tajima's D) (Tajima 1989) found selection in regions adjacent to stress and sporulation frequency genes was similar to the regions adjacent to genes used as background. The enrichment of polymorphic LTRs adjacent to genes involved in sporulation and stress conditions indicates that retrotransposition in S. pombe could promote survival in wild conditions. The insertion of these LTRs may have been induced by stress conditions since the associated genes respond to the same stresses that in laboratory strains activate Tf1 and the closely related element Tf2 (Chen et al. 2003; Feng et al. 2013).
Figure 5.

Polymorphic Tf insertions found in wild strains clustered next to sporulation frequency genes. (A) Enrichment for the term “decreased sporulation frequency” for genes adjacent to polymorphic LTRs in wild strains. The number of sporulation genes among the total number of genes adjacent to polymorphic LTRs is given in parentheses. Significant enrichments (FDR-adjusted P-values) are indicated in red. (B) Cluster dendrogram of wild strains calculated from the presence–absence of polymorphic Tf1 insertions. Approximately unbiased (AU) P-values are indicated for each node. Significant AUs are indicated in red.
Discussion
Ever since Barbara McClintock discovered transposable (“controlling”) elements in maize, it was appreciated that they are activated by changes in environmental conditions (Levin and Moran 2011; Horvath et al. 2017). Although increased mobility has long been thought to benefit the host, the precise impact and importance of this activity have not been directly studied.
In asking how cells adapt to stress, we found that TE integration into specific groups of promoters can provide a major path to resistance. The enrichment of LTRs in the stress response promoters of wild isolates of S. pombe is evidence that TEs do promote adaptation in natural conditions. Our TE tagging of strains with individual insertions allowed us to quantify the fraction of cells that gained resistance to CoCl2 in independent passaging experiments. While the 106 competition enriched positions represented 3.1% of the starting culture, 80 generations of growth in 0.2 mM CoCl2 caused the enriched positions to comprise 58.1%, 51.5%, and 31.2% of the three passaged cultures. In addition to the substantial resistance provided by integration, it is noteworthy that the fraction of TE-mutated cells that provide resistance (3.1% at T0) actually represented a surprisingly large proportion of all the TE generated mutations. Together, these results indicate that the integration activity of Tf1 provides substantial benefit when cells are subjected to stress.
The high impact of the Tf1 insertions is due in part to the targeting mechanism that directs integration to promoters (Guo and Levin 2010; Hickey et al. 2015) and due to the fact that Tf1 carries an enhancer that increases expression of adjacent genes (Feng et al. 2013). Another key feature of Tf1 function that increases its contribution to adaptation is a bias in the integration mechanism that targets promoters. While insertions occur broadly among about 20% of promoters, they are enriched for promoters induced by the core stress response (Chen et al. 2003), which includes conditions such as heavy metal (Cd), reactive oxygen, heat, DNA damage (MMS), and osmotic stress (Guo and Levin 2010; Chatterjee et al. 2014). A critical feature of Tf1 activity and that of the closely related Tf2 is that their promoters participate in the core stress response showing significant activation when cells are exposed to these stresses (Chen et al. 2003; Feng et al. 2013). Significantly, the activation of Tf1 transcription results in increased integration frequencies (Fig. 1C). As a result, each of these features, increased mobility, targeting of promoters, and the stimulation of adjacent genes, promotes adaptation. Having observed these properties, we propose that Tf1 is a highly evolved mutagenic system that benefits the host by driving adaptation to environmental insults (Fig. 6).
Figure 6.

Model for adaptation through stress-induced mobilization of transposable elements. A single chromosome out of the three S. pombe chromosomes is represented to illustrate the mechanism. Repeated exposure to stress results in cycles of increased transposition. Insertions target different regions on any of the S. pombe chromosomes. Competition between cells containing new insertions results in the selection of sets of insertions that improve survival.
The activation of Tf1 mobility is observed in a surprising diversity of stress conditions, including CoCl2, caffeine, and phthalate. While this is not an exhaustive list, it supports the McClintock proposal that TEs reorganize the genome when cells are exposed to unfamiliar forms of stress, a condition she termed genome shock. The integration of Tf1 at a 1000 different promoters allows cells to fine-tune their individual stress responses in ways that are more likely to allow survival than relying on the existing broad network of the core stress response. An intriguing additional possibility is that through continued exposure to an unfamiliar stress, multiple insertions could accumulate in individual cells that together could form the foundation of a new gene regulatory network (GRN). These networks would be specific depending on the nature of the insult. The assembly of GRNs due to integration activity of TEs is a compelling model for how regulatory sequences of TEs have undergone widespread domestication in controlling GRNs (Feschotte 2008; Rebollo et al. 2012; Sundaram et al. 2014; Lynch et al. 2015; Chuong et al. 2016; Thompson et al. 2016). The network of LTRs associated with sporulation and other survival genes found in wild strains provides strong support that TE integration can create GRNs in natural populations.
Methods
The lists of yeast strains, plasmids, and oligonucleotides used in this study are available in Supplemental Tables S3 through S5, respectively.
Media and growth of S. pombe
Rich media consisted of YES media (Forsburg and Rhind 2006). Minimal media consisted of PMG media supplemented with all amino acids (Forsburg and Rhind 2006). When indicated, vitamin B1 (Sigma) was added to a final concentration of 10 µM to repress the promoter nmt1, 5-fluoroorotic acid (5-FOA; US Biologicals) to a final concentration of 1 mg/mL, and antibiotic Geneticin (G418; Gibco by Life Technologies) to a final concentration of 500 µg/mL.
All S. pombe strains were grown at 32°C. The exposure to stress was carried out by supplementing the media as indicated: PMG liquid media were supplemented with CoCl2 hexahydrate (Sigma) to a final concentration of 0.2 mM or 1.2 mM; PMG 2% agar Petri dishes were supplemented with CoCl2 to a final concentration of 0.2 mM or 8 mM; caffeine (Sigma) 10 mM; ZnCl2 (Sigma) 7.5 mM; or 50 mM potassium phthalate.
Yeast strains and plasmid construction
To monitor new transposition events occurring from the genomic copies of Tf1, an AI was introduced by homologous recombination within the sequence coding for the neo-resistance gene located within Tf1-neo. Briefly, strains containing Tf1 integrations 1, 2, 3, and 4 were obtained by introducing 5–10 µg of a fragment containing the AI purified from the plasmid pHL692 into the Tf1-containing strains YHL9629, YHL9631, YHL9632, and YHL9638 (Feng et al. 2013) along with the leu selectable plasmid pHL1288 by the lithium acetate transformation (Forsburg and Rhind 2006). Cells that allowed transformation were selected on media PM lacking leucine. The resulting colonies were then screened on media YES + G418 to identify cells that have lost their ability to grow on G418, indicating the presence of the AI within neo. The presence of the AI was confirmed by amplification of a 137-bp fragment between primers HL3510 and 3511.
The library of S. pombe containing genome-wide integration of Tf1-neo was constructed as previously described (Chatterjee et al. 2014) with the following modification: All incubations were carried out in PM media. Briefly, transposition was induced by expressing Tf1-neo from the plasmid pHL2944 in the diploid strain YHL5661, which lacked endogenous copies of Tf1. Transposition induced in media lacking vitamin B1 was then inhibited by addition of vitamin B1. The transposition frequency was monitored by transposition assay. When the transposition frequency reached 2%, cells containing a genomic Tf1-neo integration and lacking the plasmid pHL2944 were selected on YES media containing FOA and G418.
Strains containing deletions of nonessential genes were purchased from the Bioneer Company (library version 2; http://pombe.bioneer.co.kr/).
We reconstructed by homologous recombination the Tf1 integrations 5, 6, and 7, identified at Chr II position 3607268 (−), Chr I position 678437 (–), and Chr II position 3858489 (+), respectively. The diploid strain YHL5661 was transformed with 2–8 µg of fragments containing the full-length Tf1-neo flanked by 80–500 bp of the target sequence, using the lithium acetate transformation. The fragment corresponding to Tf1 integrated at Chr II position 3858489 (+) was amplified with 80 bp of homology to the target site by fusion PCR using primers pairs HL3701-HL3702 and HL3703-HL3704 and then HL3710-HL3711. The amplification was performed using Expand long range dNTPack (Roche) according to the manufacturer's recommendations. The fragments corresponding to the two other positions were commercially synthesized (https://www.dna20.com/ for Chr II position 3607268 [–]; Life Technologies for Chr I 678437 [–]). Fragments contained a 500-bp homology to the target site, the 5′ sequence of Tf1 up to the AvrII restriction site, the 3′ sequence of Tf1 up to the XhoI restriction site, and another 500 bp homology to the target site. The full-length Tf1 flanked by target homologies was then assembled by ligating the AvrII-XhoI fragment central section of Tf1 from pHL414 into the plasmids containing partial Tf1-neo flanked by sequences of the integration site (Supplemental Table S5). The resulting plasmids containing full Tf1-neo flanked by sequences of the integration site (Supplemental Table S5) were digested with 10 units of SpeI and used for lithium acetate transformation in order to achieve homologous recombination. Cells with Tf1 integrated at the loci of interest were selected onto YES containing G418. The presence of Tf1 at the expected integration site was confirmed by PCR amplification of a fragment spanning neo and the adjacent genomic region (primer pairs described in Supplemental Table S6) and by DNA blot (data not shown). The resulting yeast strains are described in Supplemental Table S4.
Transposition assay
Transposition frequency was calculated according to the protocol described previously (Chatterjee et al. 2014), with the following modifications to monitor new genomic integrations of Tf1. Cultures starting at OD = 0.05 were incubated in 50 mL of PM media containing 0.2 mM CoCl2, 7.5 mM ZnCl2, 10 mM caffeine, or 50 mM phthalates. A solution of HCl was added at 8 mM to the media containing ZnCl2 and the corresponding control media for ZnCl2 solubility. Cultures were diluted to OD = 5 and then diluted in a series of five 10-fold dilutions. The three lowest dilutions were spread onto YES plates, and the highest dilution, as well as a number of cells equivalent to 25 mL of culture, was spread on YES containing G418. The AI allows the expression of the G418 resistance only in cells that have undergone a new genomic integration event (Levin 1995). After 3 d, the number of colonies were counted for three biological replicates, apart from integration 4 in 10 mM caffeine with only two biological replicates, and extrapolated to the number of cells in 1 mL of culture. The transposition frequency corresponds to the percentage of colonies resistant to G418. The number of generations achieved during the culture was determined by measuring the OD at the beginning and end of cultures. Transposition rates were calculated by dividing the transposition frequency by the number of generations. The P-values were calculated using Student's t-test.
Competitive growth of the genome-wide library and determination of Tf1 integration profile
Triplicate 50-mL cultures were inoculated in PM with the library of S. pombe diploid cells YHL5661 containing Tf1-neo at an initial OD = 0.1. CoCl2 was either omitted or added to a final concentration of 0.2 or 1.2 mM. The cultures were passaged for 80 generations. Each 24-h passage was diluted to OD = 0.05 before adding CoCl2. Aliquots of 200 OD taken from the initial (T = 0) and last (T = 80) passage of each replicate cultures were spun down 5 min at 2187g, and the pellets were stored at −80°C. Genomic DNA was isolated and processed for Illumina sequencing of Tf1 integration sites according to the method of Chatterjee et al. (2014), with the following modifications: Genomic DNA was isolated using a MasterPure yeast DNA purification kit (Epicentre); four different barcodes located in sequencing custom primers HL3498, HL3512, HL3513, and HL3514 were coupled with the linker-specific primer HL2216 for multiplexing the Illumina sequencing reaction. The sequencing was performed on an HiSeq 2000 system at the University of California, Irvine Genomics High-Throughput Facility and the DNA Sequencing and Genomics Core of the National Heart, Lung, and Blood Institute.
Analysis of Tf1 integration profiles
The mapping of Tf1 integration sites to the S. pombe genome (unmasked EMBL release ASM294v2.21 from September 2009, ftp://ftp.ensemblgenomes.org/pub/fungi/release-21/fasta/schizosaccharomyces_pombe/dna/Schizosaccharomyces_pombe.ASM294v2.21.dna.genome.fa.gz) was performed using the custom scripts suite HTtools (Guo and Levin 2010; Supplemental Software S1). The relative proportion of cells containing a given Tf1 integration was extrapolated from the number of sequence reads and normalized to the total number of mapped sequence reads per replicate sample. An integration position was categorized as enriched when the number of sequence reads at this position and genomic orientation were increased by greater than two between the resulting culture (T = 80) of each of the triplicate and the average of the starting culture (T = 0). Only positions with five or greater sequence reads in the resulting cultures (T = 80) were considered. Inversely, a position was categorized as depleted when the ratio was lower than 0.5 and had five or greater sequence reads in the initial cultures (T = 0). To assess the statistical significance of intersections among the three sets of enriched positions in the 0.2 mM CoCl2 cultures, we computed the probabilities of multiset intersections using SuperExactTest, an R package based on a density function of a hypergeometric model. The P-value for 106 enriched insertions overlapping in three replicates was P < 1.47 × 10−44 (Wang et al. 2015a).
Functional enrichment analysis
The 250 gene set analyzed was adjacent to positions enriched twofold or more in three replicas grown in 0.2 mM of cobalt or was adjacent to positions enriched in at least one replicate in 1.2 mM of cobalt (Supplemental Table S1).
Functional enrichment analyses were performed against different sets of ontology annotations: S. pombe Process annotation (GO Term Finder; http://go.princeton.edu/cgi-bin/GOTermFinder), Fission Yeast Phenotype Ontology annotation (Harris et al. 2013), the set of genes up-regulated in tor2 mutants (Matsuo et al. 2007), the set of genes up-regulated and down-regulated in tor1Δ strain (Schonbrun et al. 2009), and the set of genes induced by environmental stresses (Chen et al. 2003). Enrichments were calculated as the ratio of the proportion of ontology genes in the query relative to the proportion of the ontology genes among all RNA Pol II–transcribed genes (Supplemental Software S2). The P-values were calculated using the default setting of the GO Term Finder application for the Process annotation, using a hypergeometric test, and were corrected per gene set for false-discovery rates. As a control, we measured the length of intergenic regions with five or more insertions and found that regions flanking GO-annotated genes associated with enriched Tf1 integration were not significantly larger than the ones flanking all genes used as background for the GO enrichment (Student's t-test followed by FDR adjustment).
Directional selection within intergenic regions was measured by averaging the Tajima's D based on the SNPs collection described previously (Jeffares et al. 2015). Tajima's D values were calculated using the option --TajimaD from VCFtools with a nonoverlapping sliding window of 200 bp (Danecek et al. 2011).
Drop assay
The resistance to CoCl2 was determined by placing 10-µL drops of five consecutive fivefold dilutions of cells starting at OD600 = 0.5 on PMG agar plates containing 0 or 8 mM of CoCl2. The plates were incubated for 4 d at 32°C.
Quantification of gene expression
Triplicate 5-mL cultures were inoculated in PM media at an initial OD600 = 0.01. CoCl2 was either omitted or added to a final concentrations as follows: For integrations 5 or 7, CoCl2 was added at a concentration of 1.2 mM, and the cells were incubated for 24 h. For integration 6, cells were first incubated until they reached an OD600 = 1, CoCl2 was added at the concentration of 0.2 mM, and the cells were incubated an additional 1 h after addition of cobalt. For integrations 1, 2, 3, and 4, CoCl2 was added at the concentration of 0.2 mM, and the cells were incubated for 24 h. Cells were then promptly spun down for 5 min at 2187g, and the pellets were stored at −80°C. Total RNA were isolated using the MasterPure yeast RNA purification kit (Epicentre). DNA traces were removed using TurboDNA-free (Ambion RNA by Life Technologies). Five hundred nanograms of RNAs were then reverse transcribed into cDNA using a high-capacity cDNA reverse-transcription kit (Applied Biosystems by Life Technologies). Gene expression was determined by quantitative PCR on a StepOnePlus system, with the following procedure: 6 µL cDNAs previously diluted to 10 ng/µL, 10 µL of SYBR green PCR master mix (Applied Biosystems by Life Technologies), and 4 µL of forward and reverse primers mixed at 1 µM. The samples were analyzed in triplicate. Genes and Tf1 expressions were normalized to that of act1 expression. Relative changes in expression were determined by the comparative CT (ΔCT) method (Schmittgen and Livak 2008). The P-values were calculated using Student's t-test.
Quantification of Tf1 transcription was carried out according to the same protocol with the following modifications: Cultures were inoculated in PM media at an initial OD600 = 0.05 and incubated for 24 h at 32°C.
Data access
All raw data are publicly available. The DNA sequence data from this study have been submitted to the NCBI Sequence Read Archive (SRA; https://www.ncbi.nlm.nih.gov/sra) under accession number SRP142766. All custom codes used in this paper are available in Supplemental Software S1 and S2.
Supplementary Material
Acknowledgments
This research was supported by the Intramural Research Program of the National Institutes of Health (NIH) from the Eunice Kennedy Shriver National Institute of Child Health and Human Development.
Author contributions: C.E. and H.L.L. contributed to study design and manuscript preparation. C.E., M.L., and C.H. contributed to experimental results.
Footnotes
[Supplemental material is available for this article.]
Article published online before print. Article, supplemental material, and publication date are at http://www.genome.org/cgi/doi/10.1101/gr.239699.118.
References
- Atwood A, Choi J, Levin HL. 1998. The application of a homologous recombination assay revealed amino acid residues in an LTR-retrotransposon that were critical for integration. J Virol 72: 1324–1333. [DOI] [PMC free article] [PubMed] [Google Scholar]
- Bourque G, Leong B, Vega VB, Chen X, Lee YL, Srinivasan KG, Chew JL, Ruan Y, Wei CL, Ng HH, et al. 2008. Evolution of the mammalian transcription factor binding repertoire via transposable elements. Genome Res 18: 1752–1762. 10.1101/gr.080663.108 [DOI] [PMC free article] [PubMed] [Google Scholar]
- Cairns J, Foster PL. 1991. Adaptive reversion of a frameshift mutation in Escherichia coli. Genetics 128: 695–701. [DOI] [PMC free article] [PubMed] [Google Scholar]
- Cairns J, Overbaugh J, Miller S. 1988. The origin of mutants. Nature 335: 142–145. 10.1038/335142a0 [DOI] [PubMed] [Google Scholar]
- Chantranupong L, Wolfson RL, Sabatini DM. 2015. Nutrient-sensing mechanisms across evolution. Cell 161: 67–83. 10.1016/j.cell.2015.02.041 [DOI] [PMC free article] [PubMed] [Google Scholar]
- Chantranupong L, Scaria SM, Saxton RA, Gygi MP, Shen K, Wyant GA, Wang T, Harper JW, Gygi SP, Sabatini DM. 2016. The CASTOR proteins are arginine sensors for the mTORC1 pathway. Cell 165: 153–164. 10.1016/j.cell.2016.02.035 [DOI] [PMC free article] [PubMed] [Google Scholar]
- Chatterjee AG, Esnault C, Guo Y, Hung S, McQueen PG, Levin HL. 2014. Serial number tagging reveals a prominent sequence preference of retrotransposon integration. Nucleic Acids Res 42: 8449–8460. 10.1093/nar/gku534 [DOI] [PMC free article] [PubMed] [Google Scholar]
- Chen DR, Toone WM, Mata J, Lyne R, Burns G, Kivinen K, Brazma A, Jones N, Bahler J. 2003. Global transcriptional responses of fission yeast to environmental stress. Mol Biol Cell 14: 214–229. 10.1091/mbc.e02-08-0499 [DOI] [PMC free article] [PubMed] [Google Scholar]
- Chénais B, Caruso A, Hiard S, Casse N. 2012. The impact of transposable elements on eukaryotic genomes: from genome size increase to genetic adaptation to stressful environments. Gene 509: 7–15. 10.1016/j.gene.2012.07.042 [DOI] [PubMed] [Google Scholar]
- Chuong EB, Elde NC, Feschotte C. 2016. Regulatory evolution of innate immunity through co-option of endogenous retroviruses. Science 351: 1083–1087. 10.1126/science.aad5497 [DOI] [PMC free article] [PubMed] [Google Scholar]
- Curcio MJ, Lutz S, Lesage P. 2015. The Ty1 LTR-retrotransposon of budding yeast, Saccharomyces cerevisiae. Microbiol Spectr 3: MDNA3-0053-2014 10.1128/microbiolspec.MDNA3-0053-2014 [DOI] [PubMed] [Google Scholar]
- Dainty SJ, Kennedy CA, Watt S, Bähler J, Whitehall SK. 2008. Response of Schizosaccharomyces pombe to zinc deficiency. Eukaryot Cell 7: 454–464. 10.1128/EC.00408-07 [DOI] [PMC free article] [PubMed] [Google Scholar]
- Danecek P, Auton A, Abecasis G, Albers CA, Banks E, DePristo MA, Handsaker RE, Lunter G, Marth GT, Sherry ST, et al. 2011. The variant call format and VCFtools. Bioinformatics 27: 2156–2158. 10.1093/bioinformatics/btr330 [DOI] [PMC free article] [PubMed] [Google Scholar]
- Eickbush TH, Eickbush DG. 2015. Integration, regulation, and long-term stability of R2 retrotransposons. Microbiol Spectr 3: MDNA3-0011-2014 10.1128/microbiolspec.MDNA3-0011-2014 [DOI] [PMC free article] [PubMed] [Google Scholar]
- Eltschinger S, Loewith R. 2016. TOR complexes and the maintenance of cellular homeostasis. Trends Cell Biol 26: 148–159. 10.1016/j.tcb.2015.10.003 [DOI] [PubMed] [Google Scholar]
- Esnault C, Levin HL. 2015. The long terminal repeat retrotransposons Tf1 and Tf2 of Schizosaccharomyces pombe. Microbiol Spectr 3: MDNA3-0040-2014 10.1128/microbiolspec.MDNA3-0040-2014 [DOI] [PMC free article] [PubMed] [Google Scholar]
- Faulkner GJ, Kimura Y, Daub CO, Wani S, Plessy C, Irvine KM, Schroder K, Cloonan N, Steptoe AL, Lassmann T, et al. 2009. The regulated retrotransposon transcriptome of mammalian cells. Nat Genet 41: 563–571. 10.1038/ng.368 [DOI] [PubMed] [Google Scholar]
- Feng G, Leem YE, Levin HL. 2013. Transposon integration enhances expression of stress response genes. Nucleic Acids Res 41: 775–789. 10.1093/nar/gks1185 [DOI] [PMC free article] [PubMed] [Google Scholar]
- Feschotte C. 2008. Transposable elements and the evolution of regulatory networks. Nat Rev Genet 9: 397–405. 10.1038/nrg2337 [DOI] [PMC free article] [PubMed] [Google Scholar]
- Forsburg SL, Rhind N. 2006. Basic methods for fission yeast. Yeast 23: 173–183. 10.1002/yea.1347 [DOI] [PMC free article] [PubMed] [Google Scholar]
- Gallo S, Gatti S, Sala V, Albano R, Costelli P, Casanova E, Comoglio PM, Crepaldi T. 2014. Agonist antibodies activating the Met receptor protect cardiomyoblasts from cobalt chloride-induced apoptosis and autophagy. Cell Death Dis 5: e1185 10.1038/cddis.2014.155 [DOI] [PMC free article] [PubMed] [Google Scholar]
- Goberdhan DC, Wilson C, Harris AL. 2016. Amino acid sensing by mTORC1: Intracellular transporters mark the spot. Cell Metab 23: 580–589. 10.1016/j.cmet.2016.03.013 [DOI] [PMC free article] [PubMed] [Google Scholar]
- Guo Y, Levin HL. 2010. High-throughput sequencing of retrotransposon integration provides a saturated profile of target activity in Schizosaccharomyces pombe. Genome Res 20: 239–248. 10.1101/gr.099648.109 [DOI] [PMC free article] [PubMed] [Google Scholar]
- Harris MA, Lock A, Bahler J, Oliver SG, Wood V. 2013. FYPO: the fission yeast phenotype ontology. Bioinformatics 29: 1671–1678. 10.1093/bioinformatics/btt266 [DOI] [PMC free article] [PubMed] [Google Scholar]
- Hashida SN, Kitamura K, Mikami T, Kishima Y. 2003. Temperature shift coordinately changes the activity and the methylation state of transposon Tam3 in Antirrhinum majus. Plant Physiol 132: 1207–1216. 10.1104/pp.102.017533 [DOI] [PMC free article] [PubMed] [Google Scholar]
- Hashida SN, Uchiyama T, Martin C, Kishima Y, Sano Y, Mikami T. 2006. The temperature-dependent change in methylation of the Antirrhinum transposon Tam3 is controlled by the activity of its transposase. Plant Cell 18: 104–118. 10.1105/tpc.105.037655 [DOI] [PMC free article] [PubMed] [Google Scholar]
- Hickey A, Esnault C, Majumdar A, Chatterjee AG, Iben JR, McQueen PG, Yang AX, Mizuguchi T, Grewal SI, Levin HL. 2015. Single-nucleotide-specific targeting of the Tf1 retrotransposon promoted by the DNA-binding protein Sap1 of Schizosaccharomyces pombe. Genetics 201: 905–924. 10.1534/genetics.115.181602 [DOI] [PMC free article] [PubMed] [Google Scholar]
- Horvath V, Merenciano M, Gonzalez J. 2017. Revisiting the relationship between transposable elements and the eukaryotic stress response. Trends Genet 33: 832–841. 10.1016/j.tig.2017.08.007 [DOI] [PubMed] [Google Scholar]
- Jacobs JZ, Rosado-Lugo JD, Cranz-Mileva S, Ciccaglione KM, Tournier V, Zaratiegui M. 2015. Arrested replication forks guide retrotransposon integration. Science 349: 1549–1553. 10.1126/science.aaa3810 [DOI] [PMC free article] [PubMed] [Google Scholar]
- Jardim SS, Schuch AP, Pereira CM, Loreto EL. 2015. Effects of heat and UV radiation on the mobilization of transposon mariner-Mos1. Cell Stress Chaperones 20: 843–851. 10.1007/s12192-015-0611-2 [DOI] [PMC free article] [PubMed] [Google Scholar]
- Jeffares DC, Rallis C, Rieux A, Speed D, Prevorovsky M, Mourier T, Marsellach FX, Iqbal Z, Lau W, Cheng TM, et al. 2015. The genomic and phenotypic diversity of Schizosaccharomyces pombe. Nat Genet 47: 235–241. 10.1038/ng.3215 [DOI] [PMC free article] [PubMed] [Google Scholar]
- Jordan IK, Rogozin IB, Glazko GV, Koonin EV. 2003. Origin of a substantial fraction of human regulatory sequences from transposable elements. Trends Genet 19: 68–72. 10.1016/S0168-9525(02)00006-9 [DOI] [PubMed] [Google Scholar]
- Lee H, Bien CM, Hughes AL, Espenshade PJ, Kwon-Chung KJ, Chang YC. 2007. Cobalt chloride, a hypoxia-mimicking agent, targets sterol synthesis in the pathogenic fungus Cryptococcus neoformans. Mol Microbiol 65: 1018–1033. 10.1111/j.1365-2958.2007.05844.x [DOI] [PubMed] [Google Scholar]
- Leem YE, Ripmaster TL, Kelly FD, Ebina H, Heincelman ME, Zhang K, Grewal SIS, Hoffman CS, Levin HL. 2008. Retrotransposon Tf1 is targeted to Pol II promoters by transcription activators. Molecular Cell 30: 98–107. 10.1016/j.molcel.2008.02.016 [DOI] [PMC free article] [PubMed] [Google Scholar]
- Levin HL. 1995. A novel mechanism of self-primed reverse transcription defines a new family of retroelements. Mol Cell Biol 15: 3310–3317. 10.1128/MCB.15.6.3310 [DOI] [PMC free article] [PubMed] [Google Scholar]
- Levin HL, Moran JV. 2011. Dynamic interactions between transposable elements and their hosts. Nat Rev Genet 12: 615–627. 10.1038/nrg3030 [DOI] [PMC free article] [PubMed] [Google Scholar]
- Loewith R, Hall MN. 2011. Target of rapamycin (TOR) in nutrient signaling and growth control. Genetics 189: 1177–1201. 10.1534/genetics.111.133363 [DOI] [PMC free article] [PubMed] [Google Scholar]
- Lynch VJ, Nnamani MC, Kapusta A, Brayer K, Plaza SL, Mazur EC, Emera D, Sheikh SZ, Grutzner F, Bauersachs S, et al. 2015. Ancient transposable elements transformed the uterine regulatory landscape and transcriptome during the evolution of mammalian pregnancy. Cell Rep 10: 551–561. 10.1016/j.celrep.2014.12.052 [DOI] [PMC free article] [PubMed] [Google Scholar]
- Macfarlan TS, Gifford WD, Driscoll S, Lettieri K, Rowe HM, Bonanomi D, Firth A, Singer O, Trono D, Pfaff SL. 2012. Embryonic stem cell potency fluctuates with endogenous retrovirus activity. Nature 487: 57–63. 10.1038/nature11244 [DOI] [PMC free article] [PubMed] [Google Scholar]
- Mahat DB, Salamanca HH, Duarte FM, Danko CG, Lis JT. 2016. Mammalian heat shock response and mechanisms underlying its genome-wide transcriptional regulation. Mol Cell 62: 63–78. 10.1016/j.molcel.2016.02.025 [DOI] [PMC free article] [PubMed] [Google Scholar]
- Maisnier-Patin S, Roth JR. 2015. The origin of mutants under selection: how natural selection mimics mutagenesis (adaptive mutation). Cold Spring Harb Perspect Biol 7: a018176 10.1101/cshperspect.a018176 [DOI] [PMC free article] [PubMed] [Google Scholar]
- Majumdar S, Rio DC. 2015. P transposable elements in Drosophila and other eukaryotic organisms. Microbiol Spectr 3: MDNA3-0004-2014 10.1128/microbiolspec.MDNA3-0004-2014 [DOI] [PMC free article] [PubMed] [Google Scholar]
- Matsuo T, Otsubo Y, Urano J, Tamanoi F, Yamamoto M. 2007. Loss of the TOR kinase Tor2 mimics nitrogen starvation and activates the sexual development pathway in fission yeast. Mol Cell Biol 27: 3154–3164. 10.1128/MCB.01039-06 [DOI] [PMC free article] [PubMed] [Google Scholar]
- McClintock B. 1984. The significance of responses of the genome to challenge. Science 226: 792–801. 10.1126/science.15739260 [DOI] [PubMed] [Google Scholar]
- Mele M, Ferreira PG, Reverter F, DeLuca DS, Monlong J, Sammeth M, Young TR, Goldmann JM, Pervouchine DD, Sullivan TJ, et al. 2015. Human genomics: the human transcriptome across tissues and individuals. Science 348: 660–665. 10.1126/science.aaa0355 [DOI] [PMC free article] [PubMed] [Google Scholar]
- Miousse IR, Chalbot MC, Lumen A, Ferguson A, Kavouras IG, Koturbash I. 2015. Response of transposable elements to environmental stressors. Mutat Res Rev Mutat Res 765: 19–39. 10.1016/j.mrrev.2015.05.003 [DOI] [PMC free article] [PubMed] [Google Scholar]
- Morales ME, Servant G, Ade C, Roy-Engel AM. 2015. Altering genomic integrity: Heavy metal exposure promotes transposable element-mediated damage. Biol Trace Elem Res 166: 24–33. 10.1007/s12011-015-0298-3 [DOI] [PMC free article] [PubMed] [Google Scholar]
- Morimoto RI. 1998. Regulation of the heat shock transcriptional response: cross talk between a family of heat shock factors, molecular chaperones, and negative regulators. Genes Dev 12: 3788–3796. 10.1101/gad.12.24.3788 [DOI] [PubMed] [Google Scholar]
- Rai SK, Sangesland M, Lee M Jr, Esnault C, Cui Y, Chatterjee AG, Levin HL. 2017. Host factors that promote retrotransposon integration are similar in distantly related eukaryotes. PLoS Genet 13: e1006775 10.1371/journal.pgen.1006775 [DOI] [PMC free article] [PubMed] [Google Scholar]
- Rebollo R, Romanish MT, Mager DL. 2012. Transposable elements: an abundant and natural source of regulatory sequences for host genes. Annu Rev Genet 46: 21–42. 10.1146/annurev-genet-110711-155621 [DOI] [PubMed] [Google Scholar]
- Rebsamen M, Pochini L, Stasyk T, de Araujo ME, Galluccio M, Kandasamy RK, Snijder B, Fauster A, Rudashevskaya EL, Bruckner M, et al. 2015. SLC38A9 is a component of the lysosomal amino acid sensing machinery that controls mTORC1. Nature 519: 477–481. 10.1038/nature14107 [DOI] [PMC free article] [PubMed] [Google Scholar]
- Rosenthal GA. 1977. The biological effects and mode of action of L-canavanine, a structural analogue of L-arginine. Q Rev Biol 52: 155–178. 10.1086/409853 [DOI] [PubMed] [Google Scholar]
- Roth JR, Kugelberg E, Reams AB, Kofoid E, Andersson DI. 2006. Origin of mutations under selection: the adaptive mutation controversy. Annu Rev Microbiol 60: 477–501. 10.1146/annurev.micro.60.080805.142045 [DOI] [PubMed] [Google Scholar]
- Sandmeyer S, Patterson K, Bilanchone V. 2015. Ty3, a position-specific retrotransposon in budding yeast. Microbiol Spectr 3: MDNA3-0057-2014 10.1128/microbiolspec.MDNA3-0057-2014 [DOI] [PubMed] [Google Scholar]
- Saxton RA, Chantranupong L, Knockenhauer KE, Schwartz TU, Sabatini DM. 2016. Mechanism of arginine sensing by CASTOR1 upstream of mTORC1. Nature 536: 229–233. 10.1038/nature19079 [DOI] [PMC free article] [PubMed] [Google Scholar]
- Schmittgen TD, Livak KJ. 2008. Analyzing real-time PCR data by the comparative CT method. Nat Protoc 3: 1101–1108. 10.1038/nprot.2008.73 [DOI] [PubMed] [Google Scholar]
- Schonbrun M, Laor D, Lopez-Maury L, Bahler J, Kupiec M, Weisman R. 2009. TOR complex 2 controls gene silencing, telomere length maintenance, and survival under DNA-damaging conditions. Mol Cell Biol 29: 4584–4594. 10.1128/MCB.01879-08 [DOI] [PMC free article] [PubMed] [Google Scholar]
- Sehgal A, Lee CY, Espenshade PJ. 2007. SREBP controls oxygen-dependent mobilization of retrotransposons in fission yeast. PLoS Genet 3: e131 10.1371/journal.pgen.0030131 [DOI] [PMC free article] [PubMed] [Google Scholar]
- Simonsen LO, Harbak H, Bennekou P. 2012. Cobalt metabolism and toxicology: a brief update. Sci Total Environ 432: 210–215. 10.1016/j.scitotenv.2012.06.009 [DOI] [PubMed] [Google Scholar]
- Sultana T, Zamborlini A, Cristofari G, Lesage P. 2017. Integration site selection by retroviruses and transposable elements in eukaryotes. Nat Rev Genet 18: 292–308. 10.1038/nrg.2017.7 [DOI] [PubMed] [Google Scholar]
- Sundaram V, Cheng Y, Ma Z, Li D, Xing X, Edge P, Snyder MP, Wang T. 2014. Widespread contribution of transposable elements to the innovation of gene regulatory networks. Genome Res 24: 1963–1976. 10.1101/gr.168872.113 [DOI] [PMC free article] [PubMed] [Google Scholar]
- Tajima F. 1989. Statistical method for testing the neutral mutation hypothesis by DNA polymorphism. Genetics 123: 585–595. [DOI] [PMC free article] [PubMed] [Google Scholar]
- Tan VP, Miyamoto S. 2016. Nutrient-sensing mTORC1: integration of metabolic and autophagic signals. J Mol Cell Cardiol 95: 31–41. 10.1016/j.yjmcc.2016.01.005 [DOI] [PMC free article] [PubMed] [Google Scholar]
- Thompson PJ, Macfarlan TS, Lorincz MC. 2016. Long terminal repeats: from parasitic elements to building blocks of the transcriptional regulatory repertoire. Mol Cell 62: 766–776. 10.1016/j.molcel.2016.03.029 [DOI] [PMC free article] [PubMed] [Google Scholar]
- Todeschini AL, Morillon A, Springer M, Lesage P. 2005. Severe adenine starvation activates Ty1 transcription and retrotransposition in Saccharomyces cerevisiae. Mol Cell Biol 25: 7459–7472. 10.1128/MCB.25.17.7459-7472.2005 [DOI] [PMC free article] [PubMed] [Google Scholar]
- Vihervaara A, Duarte FM, Lis JT. 2018. Molecular mechanisms driving transcriptional stress responses. Nat Rev Genet 10.1038/s41576-018-0001-6 [DOI] [PMC free article] [PubMed] [Google Scholar]
- Wang M, Zhao Y, Zhang B. 2015a. Efficient test and visualization of multi-set intersections. Sci Rep 5: 16923 10.1038/srep16923 [DOI] [PMC free article] [PubMed] [Google Scholar]
- Wang T, Birsoy K, Hughes NW, Krupczak KM, Post Y, Wei JJ, Lander ES, Sabatini DM. 2015b. Identification and characterization of essential genes in the human genome. Science 350: 1096–1101. 10.1126/science.aac7041 [DOI] [PMC free article] [PubMed] [Google Scholar]
- Weisman R. 2016. Target of rapamycin (TOR) regulates growth in response to nutritional signals. Microbiol Spectr 4: FUNK-0006-2016 10.1128/microbiolspec.FUNK-0006-2016 [DOI] [PubMed] [Google Scholar]
- Workman JJ, Chen H, Laribee RN. 2014. Environmental signaling through the mechanistic target of rapamycin complex 1: mTORC1 goes nuclear. Cell Cycle 13: 714–725. 10.4161/cc.28112 [DOI] [PMC free article] [PubMed] [Google Scholar]
- Yamayoshi I, Maisnier-Patin S, Roth JR. 2018. Selection-enhanced mutagenesis of lac genes is due to their coamplification with dinB encoding an error-prone DNA polymerase. Genetics 208: 1009–1021. 10.1534/genetics.117.300409 [DOI] [PMC free article] [PubMed] [Google Scholar]
- Yang T, Li D, Liu F, Qi L, Yan G, Wang M. 2015. Regulation on Beclin-1 expression by mTOR in CoCl2-induced HT22 cell ischemia-reperfusion injury. Brain Res 1614: 60–66. 10.1016/j.brainres.2015.04.016 [DOI] [PubMed] [Google Scholar]
- Zhong X, Lin R, Li Z, Mao J, Chen L. 2014. Effects of Salidroside on cobalt chloride-induced hypoxia damage and mTOR signaling repression in PC12 cells. Biol Pharm Bull 37: 1199–1206. 10.1248/bpb.b14-00100 [DOI] [PubMed] [Google Scholar]
- Zhong R, Xu H, Chen G, Zhao G, Gao Y, Liu X, Ma S, Dong L. 2015. The role of hypoxia-inducible factor-1α in radiation-induced autophagic cell death in breast cancer cells. Tumour Biol 36: 7077–7083. 10.1007/s13277-015-3425-z [DOI] [PubMed] [Google Scholar]
Associated Data
This section collects any data citations, data availability statements, or supplementary materials included in this article.