Abstract
Granulocyte-colony stimulating factor receptor (G-CSFR) controls myeloid progenitor proliferation and differentiation to neutrophils. Mutations in CSF3R (encoding G-CSFR) have been reported in patients with chronic neutrophilic leukemia (CNL) and acute myeloid leukemia (AML); however, despite years of research, the malignant downstream signaling of the mutated G-CSFRs is not well understood. Here, we utilized a quantitative phospho-tyrosine analysis to generate a comprehensive signaling map of G-CSF induced tyrosine phosphorylation in the normal versus mutated (proximal: T618I and truncated: Q741x) G-CSFRs. Unbiased clustering and kinase enrichment analysis identified rapid induction of phospho-proteins associated with endocytosis by the wild-type G-CSFR only; while G-CSFR mutants showed abnormal kinetics of canonical STAT3, STAT5 and MAPK phosphorylation, and aberrant activation of Bruton’s Tyrosine Kinase (Btk). Mutant-G-CSFR-expressing cells displayed enhanced sensitivity (3 to 5-fold lower IC50) for Ibrutinib-based chemical inhibition of Btk. Primary murine progenitor cells from G-CSFR-Q741x knock-in mice validated activation of Btk by the mutant receptor and retrovirally-transduced human CD34+ umbilical cord blood cells expressing mutant receptors displayed enhanced sensitivity to Ibrutinib. A significantly lower clonogenic potential was displayed by both murine and human primary cells expressing mutated receptors upon ibrutinib treatment. Finally, a dramatic synergy was observed between ibrutinib and ruxolinitib at lower dose of the individual drug. Together, these data demonstrate the strength of unsupervised proteomics analyses in dissecting oncogenic pathways, and suggest repositioning Ibrutinib for therapy of myeloid leukemia bearing CSF3R mutations. Phospho-tyrosine data is available via ProteomeXchange with identifier PXD009662.
Keywords: Phospho-tyrosine, SILAC, G-CSFR, BTK, Ibrutinib
Introduction
Myeloid disorders attributed to mutations in CSF3R (encoding G-CSFR) include severe congenital neutropenia (SCN), chronic neutrophilic leukemia (CNL), myelodysplastic syndrome (MDS), acute myeloid leukemia (AML), and atypical chronic myelogenous leukemia (aCML) (1–3). SCN patients treated with G-CSF regain a sufficient level of neutrophils to reduce infection related mortality, but are at increased risk for transformation to AML and MDS. During pre-leukemic clonal evolution, SCN patients frequently acquire somatic frame-shift or nonsense mutations in CSF3R, which result in truncation of the cytoplasmic region of G-CSFR (1–5, 13–14). SCN-associated AML may progress to factor-independent growth through the additional acquisition of a point mutation close to the membrane proximal region (e.g. “proximal mutation” T618I). Proximal mutations are also observed in de novo CNL and are characterized by hyper responsiveness to G-CSF, leading to an uncontrolled number of neutrophils (5–12). Herein, a global, unbiased phospho-tyrosine profiling approach using SILAC methods (16) was used to dissect wild type and aberrant G-CSF signaling. Specifically, cell lines were engineered to express low levels of wild type (WT), membrane proximal (T618I) and truncation (Q741x) mutant G-CSFR, and temporally characterized for phospho-tyrosine signaling after G-CSF stimulation. SILAC labeling, phospho-tyrosine enrichment, high-resolution nano-LC-MS/MS analysis and functional bioinformatics studies, reveal a number of known and novel phosphorylation changes. First, the data confirm the abnormal kinetics of canonical G-CSF stimulated signaling, and extend prior knowledge of receptor recycling mechanisms (22). Importantly, the study identified consistent activation of Bruton’s Tyrosine Kinase (Btk) downstream of mutated G-CSFRs (but not WT), which was further validated in the cell lines, primary murine bone marrow cells and retrovirally-transduced human CD34+ umbilical cord blood cells expressing mutant receptors. These studies support Btk as a potential therapeutic target downstream of mutant G-CSFR, and suggest repositioning the approved Btk inhibitor, Ibrutinib, as a treatment for CSF3R-mutant myeloid leukemia.
Material and Methods
Cell line and quantitative phosphoproteomics methodology
Full details of the experimental approach are presented in Supplementary Methods. In summary, a retroviral transduction approach was used with BaF3 cells to set-up an in vitro model system expressing WT, T618I, and Q741x G-CSFRs expressing cells. SILAC labelling was used to culture the transduced BaF3 cells in ‘light’ SILAC medium (containing 12C, 14N Lysine and Arginine) and ‘heavy’ SILAC medium (containing 13C, 15N Lysine and Arginine). After mixing the comparative samples and digesting them with trypsin, the SILAC-labelled peptides were further enriched for phospho-tyrosine using immobilized pY-1000 phosphotyrosine antibodies peptides as previously described (15–17). Enriched phospho-peptides were analyzed on a TripleTOF 5600+ MS (Sciex, Concord, ON, Canada) coupled to an Eksigent (Dublin, CA) nanoLC Ultra nanoflow system. Details of data analysis and validation of the phospho-tyrosine experiments are presented in Supplementary Methods.
Primary cell isolation, cell proliferation/viability, and CFU experiments
All mouse breeding/maintenance and treatment procedures were performed with full IACUC approval. Bone marrow cells were isolated from freshly sacrificed mice and enriched for stem/progenitor cells using CD117 MicroBeads and separated on an AutoMACS Pro separator (Miltenyi) according to manufacturer specifications. For cell proliferation and viability assays, 20 thousand 32D or c-Kit+ cells from bone marrow were seeded in 96 well plate in 200 μl of RPMI medium supplemented with 10% FBS in a titration of Ibrutinib. Ibrutinib concentrations ranged from 5 nM-5000 nM in a final concentration of 0.1% DMSO for 32D cells and 1 nM-1000 nM in a final concentration of 0.1% DMSO for c-Kit+ cells incubated at 37C and 5% CO2 for 24 h. Cell proliferation and viability was determined using Trypan Blue live/dead hemocytometer cell counting. For clonogenic assays, c-Kit+ cells were plated in triplicate at 2,000 cells/mL in M3434 (Stemcell Technologies) supplemented with 40 ng/mL G-CSF and either 0.1% DMSO, 100 nM Ibrutinib, or 1 μM Ruxolitinib and the total colony number was determined 7 days later. For human cell viability assays, human CD34+ cells were plated at 20,000 cells/100 μL in IMDM supplemented with 20% BIT9500 (Stemcell Technologies), 55 μM β-mercaptoethanol, and 40 ng/mL G-CSF with 0.1% DMSO or a dose titration of Ibrutinib or Ruxolitinib. For synergy assays, sorted human CD34+ cells were plated in triplicate at 1,000 cells/mL in H4434 supplemented with 40 ng/mL G-CSF with 0.1% DMSO, 100 μM Ibrutinib or 100 μM Ruxolitinib and the total colony number was determined 7 days later. Additional details of the primary cell isolation and analysis are given in Supplementary Methods.
Results
Generation and validation of BaF3 expressing WT and mutant G-CSFRs
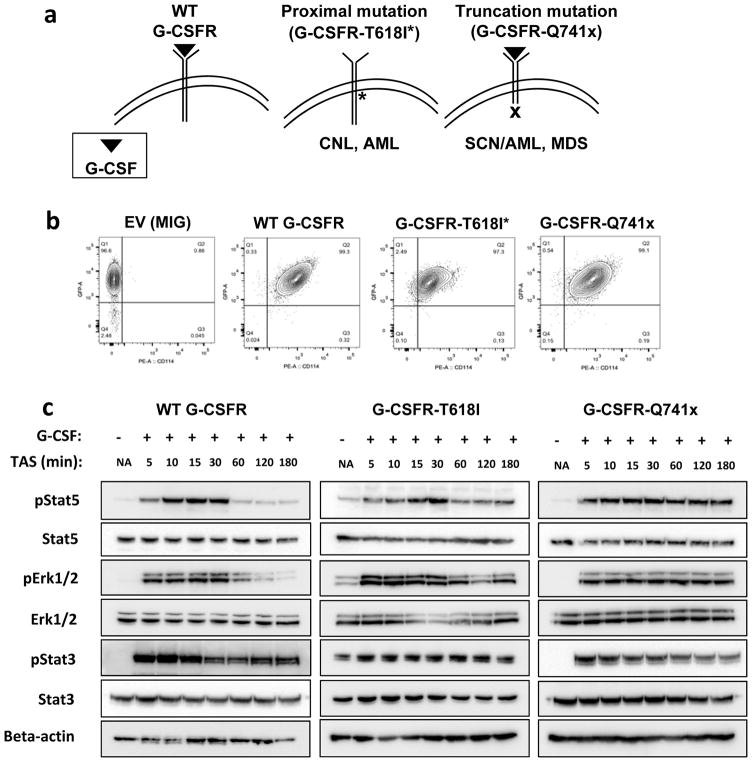
To study the comprehensive phospho-tyrosine signaling of normal and mutated G-CSFRs, an in vitro model system using BaF3 cells was implemented. BaF3 cells are a well-established model system to study the biology of G-CSFRs (2–5). A robust model system was necessary to grow enough cells (100 million) to obtain sufficient depth of phospho-tyrosine proteome coverage that could not be achieved using limited amounts of primary progenitor cells. Using a retroviral transduction approach, normal (WT-G-CSFR), proximal mutation (T618I-G-CSFR), and truncation mutation (Q741x-G-CSFR) protein expressing vectors were transduced in BaF3 cells that stably express each of the receptors (Figure 1a). To avoid unwanted signaling effects caused by over or unequal expression of mutant receptors, several rounds of cell sorting and collection were performed to achieve comparable expression for the WT and each of the G-CSFR variants as confirmed in Figure 1b. In parallel, an empty vector expressing cell line was also designed as a control for the transduction experiments (Figure 1b). To evaluate the receptor activation dynamics in the BaF3 system and to ensure consistency with those reported previously during G-CSFRs activation, an induction experiment was performed using the WT and both mutated receptors for up to 3 h post serum starvation. Immunoblot analyses of phospho-Stat3, phospho-Stat5, total Stat3, total Stat5, phospho-Erk1/2, and total Erk1/2 were used to evaluate the G-CSF signaling dynamics. Similar to a previous report (7), WT-G-CSFR showed upregulation of Stat5 through 30 min with peak activation levels between 10–15 min and a return to pre-stimulation levels by 60 min (Figure 1c). Phospho-Stat3 activation in WT followed a similar trend as Stat5 with maximal activation by 10–15 min, however it showed a prolonged activation with >50% of its activation level persisting even after 3 h (Figure 1c). Phospho-Erk1/2 activity downstream of WT-G-CSFR also showed a drop off in activation after 30 min (Figure 1c) following a similar activation pattern as pStat5. In contrast, mutant receptor signaling in the BaF3 system showed signaling patterns mimicking those reported for patient derived samples (10). Specifically, T618I-G-CSFR in the BaF3 model system showed a constitutive activity of Stat3/Stat5/Erk even in the absence of G-CSF, but otherwise showed the similar pattern of GCSFR activation as WT, with maximal activation at 10–15 min returning to the constitutive levels of pSTAT5 by 60 min (10). Furthermore, the BaF3 expressing Q741x-G-CSFR showed the normal induction of signaling patterns with maximal activity by 10–15 min, but maintained activation even at 3 h (Figure 1c); consistent with what has been reported in patient derived cells (10). Overall, the BaF3-based in vitro model system recapitulated the previously reported major signaling biology (Jak/Stat and Mapk/Erk pathways) of the normal and mutated G-CSFRs (1–14), supporting its validity as a model system for the global phospho-tyrosine analysis.
Figure 1. Generation and validation of BaF3 expressing WT and mutant G-CSFRs.
(a) Schematic of G-CSF/G-CSFR topology in the plasma membrane and sites of mutations found in the indicated disease phenotypes. (b) Flow cytometry plots of transduced BaF3 cells validating equivalent levels of G-CSFR expression after FACS-sorting (EV: empty vector, MIG: MSCVIRES-GFP). (c) Immunoblot analyses of the transduced BaF3 cells after 6 hour serum starvation and G-CSF stimulation (TAS: Time after Stimulation). The immunoblots shown here are representative of two independent experiments (n=2).
SILAC- based quantitative phospho-tyrosine analysis of the normal and mutated G-CSFR signaling
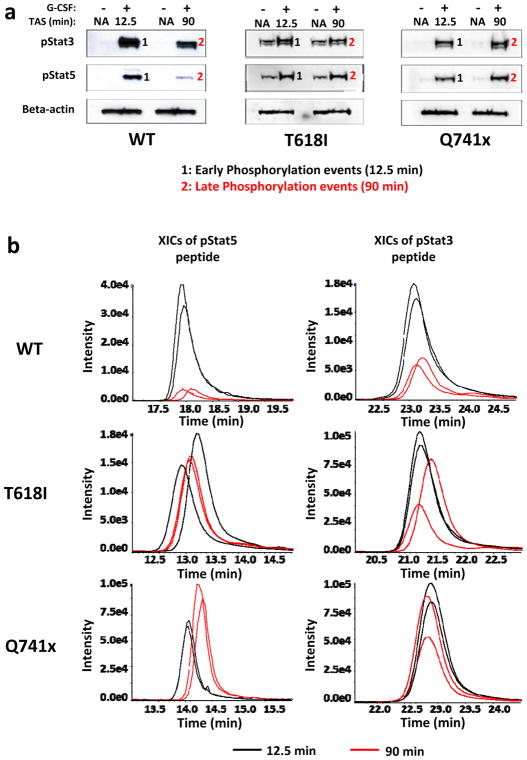
A well-established quantitative metabolic labeling technique, SILAC, was used to evaluate a comprehensive quantitative phospho-tyrosine signaling of G-CSFRs (Supplementary Figure 1a). Details of SILAC labeling are provided in the supplemental methods section. 12.5 min and 90 min of G-CSF induction were used for the global phospho-tyrosine analysis based on the time-course established in Figure 1c to capture the early and late events of the phosphorylation of the activated G-CSFRs and to understand a dynamic signaling landscape. Each experiment was performed as two independent biological replicates with the cells grown in light SILAC medium for the non-G-CSF induced control and the heavy SILAC medium as the GCSF-induced experimental samples. After the heavy amino acid incorporation was confirmed to be greater than 95% by mass spectrometry, the G-CSF induction was initiated for collection of cells at the early and late time points. To rule out any signaling variability caused by the SILAC culture medium on the cellular machinery, phospho-Stat3/5 immunoblots on the SILAC lysates were evaluated. As expected, Jak/Stats signaling mechanism upon G-CSF induction was not altered in the SILAC medium (Figure 2a).
Figure 2. SILAC-based quantitative phospho-tyrosine analysis of the normal and mutated G-CSFR signaling.
(a) Immunoblot analysis of the SILAC-cultured BaF3 cells showing similar G-CSFR signaling kinetics to those seen in Fig 1a. (b) Comparative Extracted Ion Chromatograms (XICs) of pStat3 and pStat5 from the complete SILAC data set (n=2 for each condition). Black lines represent the 12.5 min levels and the red lines the 90 min levels. All XICs are displaying two biological replicates for both time points (TAS: Time after Stimulation).
The enrichment and relative quantitative analysis of phospho-tyrosine in each of the replicate samples for the WT and two mutated receptors was accomplished by immuno-affinity purification (IAP) on the pY1000 column, nano LC-MS/MS and data analysis as described in the supplemental methods section. Pearson correlation coefficient (r) for the replicate samples were used to verify the level of reproducibility. Based on Pearson coefficient values, a high reproducibility was observed between replicates (Supplementary Figure 1b). To further verify that the mass spectrometry readout was consistent with the timing of the Stat3/Stat5 signaling seen by the immunoblot experiments, extracted ion chromatograms (XICs) of phospho-Stat3 (pY705) and phospho-Stat5 (pY694) peptides from the individual mass spectrometry data sets were examined (Figure 2b). As expected, the XICs recapitulated the expected pattern of Stat activation downstream of GCSF induction. Specifically, Stat5 activation returned to near pre-induction levels at 90 min, while Stat3 maintained a longer activation with about 40% the pY705 site still present after 90 min in the WT samples (Figure 2b). The XICs for the 90 min time point of both mutants also showed prolonged activation of pStat5 and pStat3 as was detected by immunoblot (Figures 1c, 2a). Overall, the quantitative mass spectrometry data successfully recapitulated the expected pattern of G-CSFR activation for both the WT and mutated receptors.
Effect of G-CSF induction on normal and malignant G-CSFR phospho-tyrosine proteome
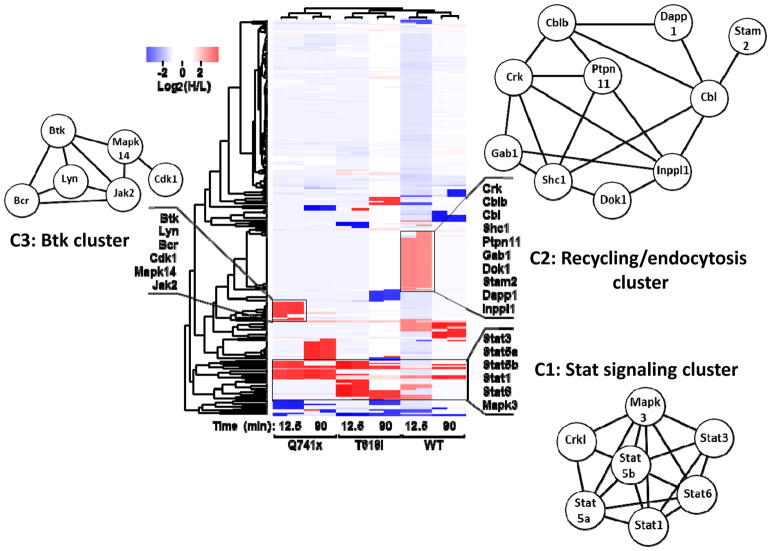
The global phospho-tyrosine study was designed to evaluate the discovery hypothesis of a likely divergence of the G-CSF induced signaling between the WT and mutants receptors. Examination of the SILAC data with the WT and mutant receptors resulted in more that 250 phospho-tyrosine sites identified and quantified (Supplementary Table 1–3). A series of bioinformatics tools were applied to the data set to gain insight into the common and divergent regulatory pathways in WT and mutated G-CSFR signaling. These tools included an unbiased clustering analysis, protein-protein interaction network and biological processes based analyses using STRING (18), and Kinase enrichment analysis (KEA) (19). As evident from the clustering analysis and STRING analysis (Figure 3) combining all differentially-regulated sites together, the most common phosphorylation events across the profiles were the Stats (Stat 5A, Stat5B, Stat3, Stat1, Stat6) collectively represented as Cluster 1 (C1): the Stat signaling cluster. This is consistent with the known literature for both WT and these specific mutations. Similarly, the major enriched biological processes (GO: Biological Processes) in cluster 1 were cytokine mediated signaling (FDR = 5.5e-08) and JAK/STAT pathway (4.74e-07) (Supplementary Table 2), which further supports the previously known first biological responses after G-CSF activation. Thus, the unbiased analysis of SILAC-based mass spectrometry data matches to many of the known signaling events in G-CSF induction.
Figure 3. Effect of G-CSF induction on the normal and malignant G-CSFR phosphotyrosine proteome.
R based unsupervised hierarchical clustering heat map analyses was performed using log2 transformed heavy to light phospho-tyrosine peptide ratios (H/L). The color key denotes red as up-regulated and blue as down-regulated phospho-tyrosine sites after G-CSF induction. The clusters were further analyzed using the STRING network analysis tool. Protein network diagrams are displayed for three clusters of uniquely up-regulated or downregulated phospho-tyrosine sites (C1, C2, C3). The length of the edges between two nodes represents the association/interaction score generated by STRING, with higher scores illustrated as shorter lines.
When examining the data set for divergence in WT vs mutants, another set of phosphotyrosine sites comprising of Stam2, Crk, Dok1, Gab1, Ptpn11, Cbl proteins formed a unique cluster (C2) in the heat map (Figure 3) referred to as the endocytosis/receptor recycling cluster (Supplementary Table 4). Most of these phospho-tyrosine sites were detected in the WT but not in the mutants (Figure 3 and Supplementary Table 1–3). The major enriched biological processes from cluster 2 were endocytosis (FDR=9.29e-05), transmembrane receptor protein tyrosine kinase signaling (FDR=2.97e-05), and cell surface receptor signaling (FDR=7.68e-04) (Supplementary Table 2). These findings suggest that this layer of phospho-tyrosine signaling induced by G-CSF might be controlling aspects of receptor endocytosis. Given that several research labs including Touw’s group have previously described (20–22) the perturbed receptor endocytosis/recycling of mutated G-CSFRs, our findings are also consistent with these receptor recycling defects. Moreover, they also provide greater granularity with respect to the specific phosphorylation changes that may be controlling these processes. Furthermore, the absence of this cluster in T618I group is a new finding which hints that a disrupted receptor endocytosis might be implicated in the constitutive activity of the membrane proximal mutation.
Another up-regulated cluster was detected with the Q741x group consisting of several kinases, Btk, Lyn, Mapk14, Mapk8, Jak2 and Bcr (Figure 3, C3: Cluster 3) referred to as the Btk cluster (Supplementary Table 2). The major enriched biological processes associated with this cluster were cell surface receptor signaling pathway (FDR=4.64e-08), and protein tyrosine kinase signaling (FDR=7.40e-08) (Supplementary Table 2). This cluster implicates that these kinases might be behind the sustained activation pattern exhibited by Q741x. Specifically, Bruton’s Tyrosine Kinase (Btk) was upregulated in the truncation mutation at its most prominent activating tyrosine (pY223) site and with no apparent change in the WT group. The tyrosine 223 of Btk is a well-documented activation site in B cell lymphomas and more recently has been identified in some AML cases (23–25).
G-CSF induced upregulation of Bruton’s Tyrosine Kinase (Btk) in the mutants but not in WT-G-CSFR
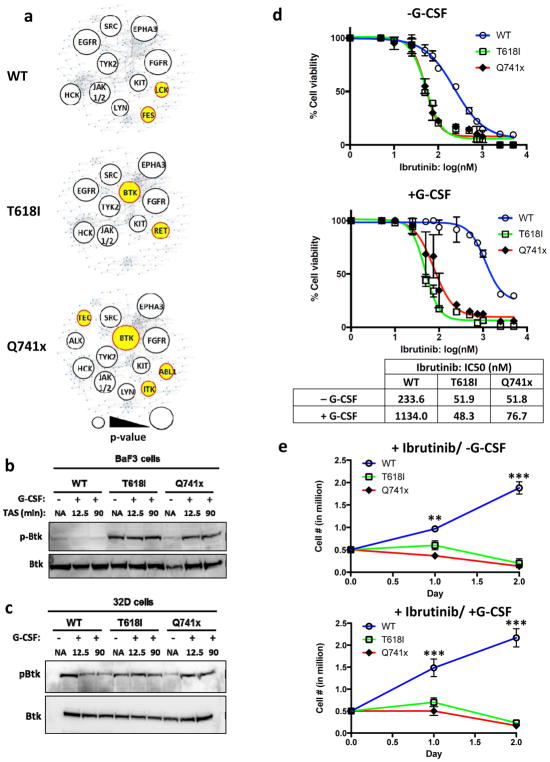
The STRING and pathway analysis algorithms (18) used above correlate protein interaction with cellular processes based on the function and relationships of the intact proteins. When evaluating the data that result from the pY profiling, one must also consider that the changes in any given site of phosphorylation result from the sum of the activities of associated kinases and phosphatases. As such, to evaluate the regulatory kinases behind the divergence of phospho-tyrosine signaling between the WT and mutant receptor signaling, Kinase Enrichment Analysis (KEA) (19) was applied to identify candidate kinases. The KEA tool is designed to predict which kinases are most likely responsible for the specific sites of phosphorylation that are detected showing differential regulation (up- or, down) in each group compared to non-G-CSF stimulated condition. When KEA was applied to the current data set, as expected, most of the kinases identified among all three groups (WT, and both mutants) were known kinases for G-CSFR signaling (e.g. Jak2, Src) (Figure 4a). However, we noted that Bruton’s Tyrosine Kinase (Btk) activity was significantly changed in the mutant data sets (Q741x: p-value= 0.001, T618I: p-value= 0.031) (Figure 4a). Btk activation in B-cell malignancies leads to a hyperproliferative response (23–25). Importantly, Ibrutinib is a clinically-approved Btk-inhibitor drug for the treatment of B-cell lymphomas (23). Therefore, we focused further analyses on validating Btk as a potential downstream effector of mutant G-CSFRs.
Figure 4. Aberrant Btk activation and dependence of mutant G-CSFR-expressing cell lines.
(a) Kinase Enrichment Analysis was used to identify the potential kinases behind the differential phospho-tyrosine landscape observed in the global phospho-tyrosine data. Kinases enriched are depicted as a bubble blot, with lower p-values illustrated as larger bubbles. The p-value cut-off was less than or equal to 0.05. The unique kinases identified only in the mutant or WT group are depicted in yellow. (b–c) Representative immunoblots using lysates from BaF3 or 32D cell lines after 6 hour serum starvation and G-CSF stimulation (TAS: Time after Stimulation). (d) Ibrutinib dose curves of 32D cell viability with and without G-CSF stimulation. IC50 values were calculated in Prism statistical analysis software using the three-parameter logistic method. (e) Growth curves of 32D cell lines treated with 100 nM Ibrutinib and cultured with or without G-CSF. Experiments in panels d and e were performed as three independent biological replicates (n=3) (*** = p value < 0.001, ** = p value < 0.01, student t-test).
In addition to the KEA analysis, Btk was also observed upregulated in the global phospho-tyrosine data set, with particularly high level in the Q741x mutant at 12.5 min of G-CSF induction as described in the previous section (Supplementary Table 1–3). The proximal mutation also showed up-regulation of Btk and in WT, Btk was recorded as slightly downregulated upon stimulation with G-CSF (Figure 3 and Supplementary Table 1–3). To further confirm the findings of the global phospho-tyrosine data and KEA analysis, the Btk activation pattern was verified using the immunoblot experiments in BaF3 cell lysates expressing WT and mutant G-CSFRs (Figure 4b). In WT, no appreciable change in phospho-Btk level (phospho-Y 223) upon G-CSF activation was observed, however it was constitutively active in T618I and showed increased activation post G-CSF induction with Q741x expressing cells (Figure 4b).
To further verify the relevance of Btk activation in a myeloid lineage model, myeloid progenitor 32D cell lines were generated that express WT and the mutant G-CSFRs (Supplementary Figure 2 a, b). These cell lines were prepared using the same retroviral transduction vectors, flow cytometry-based sorting experiment and G-CSF induction kinetic experiment as the BaF3 cells (Supplementary Figure 2 a, b). Notably, phospho-Btk levels in cytokine-starved 32D cells were higher in WT receptor expressing cells (compared to BaF3 cells), and G-CSF stimulation of the WT receptor downregulated Btk activation (Figure 4c). These data suggest that Btk may be activated by cytokine-withdrawal stress in WT myeloid cells but not in the BaF3 cells (Figure 4c). However consistent with the WT BaF3 cells, the levels of activated Btk decrease with G-CSF stimulation.
Sensitivity of mutant G-CSFR expressing 32D cells to Ibrutinib suggests dependence on activated Btk for cell survival and proliferation
The activation status of Btk in both mutant receptors compared to the WT support the hypothesis that mutant G-CSFR signaling is dependent on Btk for the survival and proliferation. To test this hypothesis, and to further verify the functional role of Btk with respect to aberrant GCSFR signaling, several functional assays were performed. First, using increasing concentrations of Ibrutinib, cell viability assays using Trypan Blue based live/dead cell counting were performed. WT receptor expressing 32D cells revealed an IC50 around 250 nM with Ibrutinib (Figure 4d). It has been previously reported that tumor or stromal-secreted cytokine can rescue cancer cells from the effects of tyrosine kinase inhibitor (TKI) (26). To test whether G-CSF could relieve Ibrutinib effects, IC50 values were also captured in the presences of G-CSF. Consistent with other TKIs, the inhibitory effect of Ibrutinib was dramatically reduced upon G-CSF induction in the WT receptor cells, with the IC50 shifting from 250nM into the micromolar range (Figure 4d). In contrast, both the mutant-receptor-expressing 32D cells displayed an IC50 near 50 nM, which was independent of G-CSF activation (Figure 4d). These results are consistent with the concept that mutant receptors require Btk activation for viability, thus resulting in greater susceptibility towards Btk inhibition. To this end, the effect of Ibrutinib on cell proliferation was also evaluated in 32D cells grown in Ibrutinib supplemented medium (+/−) G-CSF stimulation (Figure 4e). The WT G-CSFR expressing 32D cells more than tripled in numbers in 2 days, even in the presence of Ibrutinib, which further supported the findings from the cell viability experiment. However, T618I and Q741x receptor-expressing cells showed a dramatic loss of proliferation and cell viability with less than 50% of the cells viable by day 2 in the presence of Ibrutinib, thus showing a dramatic decrease in proliferation when Btk activation is blocked (Figure 4e). Collectively, both the IC50 and the cell proliferation experiments in 32D cells support the hypothesis that mutant receptor expressing cells are dependent of Btk activation and thus can be suppressed by Btk inhibition using Ibrutinib.
Activation of Btk in the primary bone marrow cells of G-CSFR-Q741x mutant mice
To further support the findings of the dependency of the mutant receptor expressing 32D on Btk beyond a simple cell-line based model, we analyzed c-Kit+ bone marrow cells (hematopoietic progenitors) isolated from WT and Csf3r-Q741x knock-in mice (11). To determine the pattern of Btk activation in these primary cells, immunoblot experiments were performed and showed a pattern of Btk phosphorylation similar to 32D cells (Figure 5a). Namely, starved WT cells showed activation of Btk, which was downregulated by the addition of G-CSF; whereas, the Q741x starved cells show no activation of Btk, but robust induction after G-CSF (Figure 5a). Next, cell viability/proliferation changes in response to Ibrutinib treatment were examined. WT c-Kit+ cells showed an IC50 to Ibrutinib at 129 nM. However, the mutant c-Kit+ cells were 4-fold more sensitive to Ibrutinib with an IC50 of 32 nM (Figure 5b). This decrease in IC50 indicated a higher susceptibility of mutant BM cells to Btk inhibition compared to WT. To determine the impact of Ibrutinib upon the colony forming capacity of hematopoietic progenitors, c-Kit+ bone marrow cells isolated for the Q741x knock-in mice were treated with the IC50 dose of Ibrutinib in parallel with the standard-of-care in the field, Ruxolitinib (14). While WT cells were unaffected by either drug, those bearing the Q741x mutation were equally sensitive to Ibrutinib and Ruxolitinib (Figure 5c). Taken together with the 32D cells and primary cell based experiments, the increased sensitivity of the Q741x mutant progenitor cells to Ibrutinib further supports the dependency of the mutant cells on Btk activation. Furthermore, these findings suggest that the disease phenotypes associated with the most common clinical mutations in the G-CSFR might be targeted for treatment with Ibrutinib.
Figure 5. Activation of Btk in the primary bone marrow cells of Q741x mutant mice.
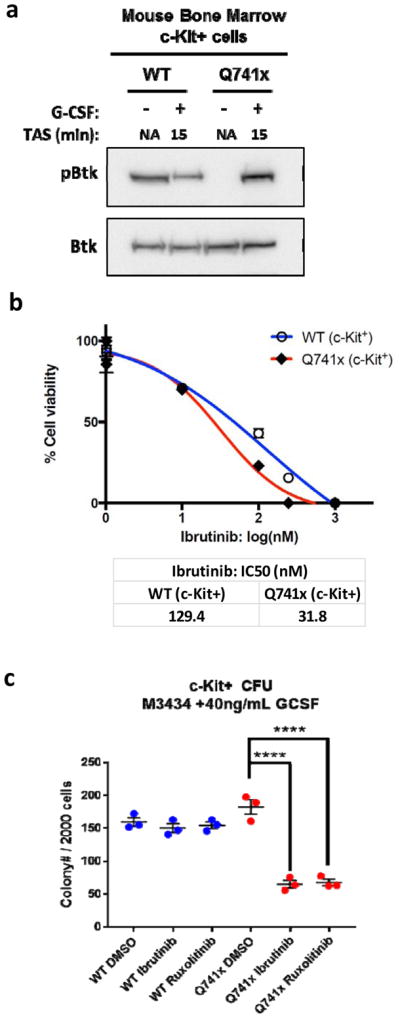
(a) Representative immunoblots using lysates of c-Kit+ bone marrow cells after 2 hour serum starvation and G-CSF stimulation (TAS: Time after Stimulation). The experiment was performed twice (n=2). (b) Ibrutinib dose curves of c-Kit+ bone marrow cell viability. IC50 values were calculated in Prism statistical analysis software using the three-parameter logistic method. The experiment was performed in three independent biological replicates (n=3). (c) Graphical representation of the colony forming units (CFU) of murine c-Kit+ bone marrow cells. The results represent three independent biological replicates (n=3) (**** = p value < 0.0001, student t-test).
Human G-CSFR-mutant cells are sensitive to BTK inhibition
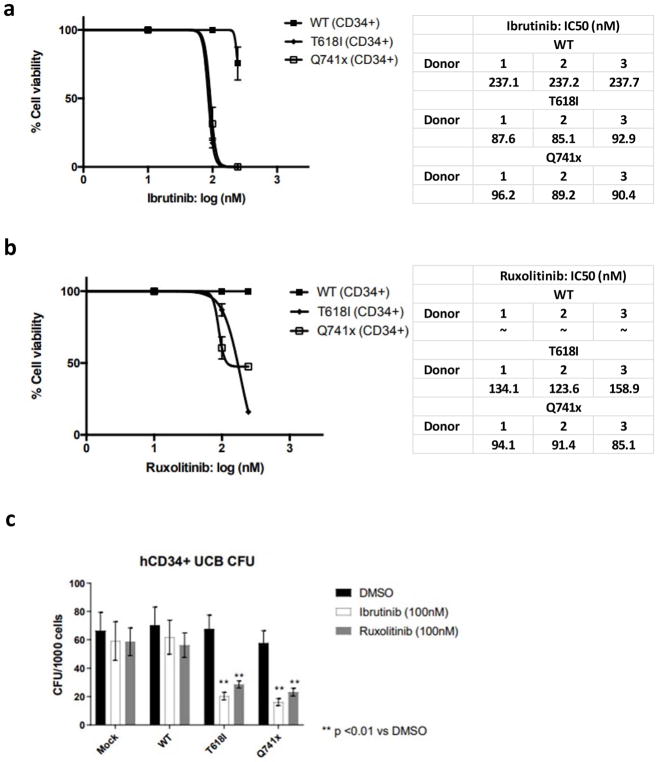
To determine if BTK inhibition presents a clinically-actionable susceptibility of G-CSFR-mutant cells, we used retroviral transduction to develop a model system of primary human CD34+ umbilical cord blood cells expressing G-CSFR WT, T618I, or Q741x. CD34+ cells that expressed low levels of G-CSFR were FACS-sorted (Supplementary Figure 3) and treated with a dose titration of Ibrutinib. Cells expressing T618I and Q741x were equally sensitive to Ibrutinib as compared to WT cells, displaying a greater than 2-fold decrease in IC50 values (Figure 6a). Next, we compared the efficacy of Ibruitinib to that of a JAK2 inhibitor by performing a dose titration of Ruxolitinib. Similar to Ibrutinib, cells expressing T618I and Q741x were sensitive to Ruxolitinib (Figure 6b) as compared to WT cells. The IC50 doses of both Ibrutinib and Ruxolitinib (100nM) were also efficient at reducing the clonogenicity of cells expressing T618I and Q741x while ineffective against WT cells (Figure 6c). A significant reduction in the total colony number was observed in both mutant G-CSFRs expressing primary cells compared to WT (Figure 6c) similar to the results from the mouse CFU experiments. These findings suggest that Ibrutinib presents a potential new therapy against the growth and survival of G-CSFR-mutant clones.
Figure 6. Human G-CSFR-mutant cells are sensitive to BTK inhibition.
(a) Ibrutinib or (b) Ruxolitinib dose curves of retroviral-transduced human CD34+ umbilical cord blood cell viability. IC50 values were calculated in Prism statistical analysis software using the three-parameter logistic method. The experiment was performed in three independent biological replicates (n=3) from 3 separated donors. (c) Graphical representation of the colony forming units (CFU) of human CD34+ umbilical cord blood cells. The results represent five independent biological replicates (n=5) (** = p value < 0.01, student t-test).
Ibrutinib and Ruxolitinib are synergistic against G-CSFR-mutant human CD34+ cells
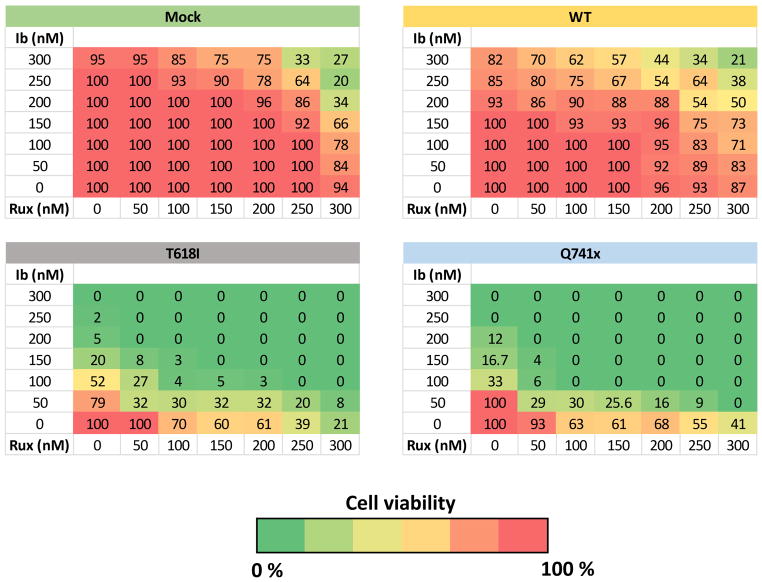
Finally, since human cells expressing CSF3R-mutations were sensitive to treatment with both Ibrutinib or Ruxolitinib, we tested the hypothesis that a combination of these drugs would be synergistic, such that lower doses of the combined inhibitors would demonstrated greater clearance of the receptors bearing mutations than the single therapies. This was accomplished using a checkboard assays with increasing concentration of each of the inhibitors on human CD34+ cells expressing WT control or T618I or Q741x mutations in the presence of G-CSF (Figure 7). In each case the mutant expressing receptors were sensitive to either Ibrutinib or Ruxolitinib treatment alone compared to controls; however, this sensitivity was dramatically enhanced with the combination treatment (Figure 7 and Supplemental Table 5). These results suggest that combination therapy with these two clinically-available drugs may provide a substantial therapeutic window to eradicate CSF3R-mutant clones prior to transformation while leaving the normal cells unharmed.
Figure 7. Ibrutinib and Ruxolitinib are synergistic against G-CSFR-mutant human CD34+ cells.
Checkerboard assays showing percent viability of sorted retroviral-vector-transduced human CD34+ umbilical cord blood cells treated with the indicated doses of Ibrutinib (Ib) and/or Ruxolitinib (Rux).
Discussion
Apart from basic knowledge about Jak/Stat signaling as major pathway associated with G-CSFR signaling, there is still a large gap in the understanding of overall biology of normal and malignant signaling of G-CSFR. Therefore, to understand the global landscape of normal and mutated G-CSFR signaling, we undertook a nano-LC-MS/MS based quantitative phosphotyrosine screening approach. As expected, a significant difference in the overall tyrosine phosphorylation between the normal and mutated G-CSFR was observed in this study. The systemic approach applied here led us to identify additional kinases that may be involved in the endocytosis and receptor recycling defect that has previously been reported (20–22) and importantly has identified an apparent proliferative dependency of the mutant G-CSFR receptor phenotypes on Bruton’s Tyrosine Kinase (Btk) which opens a therapeutic opportunity to target these diseases with ibrutinib.
Based on previous reporting on the differences between normal (WT) and malignant mutation (T618I, Q741x) to the G-CSFR, the expected differences in Jak/Stat signaling in terms of Stat3/Stat5’s amplitude and duration of the phosphorylation were observed in our global pY profiling study (Figure 2a,b). However, our data reveals for the first time that the difference is beyond a single pathway when it comes to the comparison between normal and malignant signaling of G-CSFR. Specially, proteins involved in the receptor endocytosis showed upregulation in their phosphorylation in WT only but not with mutants (Figure 3). Prior work has described hindered receptor recycling of the truncation mutant G-CSFR (20, 21). Our phosphotyrosine signaling study confirms those data, and extends this to additional proteins (Crk, Stam2, Ptpn11, Gab1, Cbl) involved in the overall endocytosis process. Moreover, these data implicate a similarly defective endocytosis pathway for the proximally mutated G-CSFR. For example, Stam2 has already been shown as a part of endosomal cell sorting complex (ESCRT) which is required for the receptor lysosomal degradation (27–28). Furthermore, tyrosine phosphorylation of Stam2 is tightly controlled by protein tyrosine phosphatase 1b: Ptp1b (27–28). Whether there is any correlation between the absence of phosphorylation in the mutant GCSFRs compared to WT and its implication with the overall receptor endocytosis, needs to be validated. Another protein, Cbl: a ubiquitin ligase which was phosphorylated post G-CSF induction in the WT and T618I, however not with Q741x group. Cbl has been shown as a major adaptor protein in cell growth and cytoskeleton organization predominantly in hematopoietic cells (27–29) which raises a possibility about the potential role of this protein in G-CSFR receptor recycling mechanism. Therefore, future experimental validation of the protein showing differential phosphorylation might lead us to the mechanistic details of a perturbed endocytosis behind leukemogenesis with the mutated G-CSFR.
When Kinase Enrichment Analysis (KEA) was applied to the global dataset, we identified Btk as a major upregulated kinase node in the mutated receptor signaling but not with WT (Figure 3 and Figure 4a). Phospho-Btk immunoblot analyses with BaF3 and 32D cells expressing G-CSFRs further confirmed the findings of the global phosphotyrosine data, and KEA analyses (Figure 4b & c). Additionally, in the functional experiments, the mutated G-CSFRs showed lower viability and higher susceptibility towards the chemical inhibitor of Btk in cell culture. Based on these findings, it is possible that apart from Jak/Stat signaling as a major mode for the survival and proliferation, mutated G-CSFRs may acquire an additional dependence on Btk leading to malignant phenotypes. Our findings suggest that inhibiting Btk with Ibrutinib in the mutant G-CSFRs expressing 32D cells and c-Kit+ cells from Q741x mice, resulted not just in lower proliferation, but to loss of cell viability (Figure 4 and 5). These findings were also confirmed in that primary murine bone marrow cells displayed lower clonogenicity upon ibrutinib treatment (Figure 5c) which further supports the dependency of mutated G-CSFR on Btk.
Evaluation of BTK dependency in transduced human CD34+ umbilical cord blood cells expressing mutated G-CSFRs showed lower IC50 and clonogenicity in CFU assay treated with ibrutinib and ruxolitinib compared to WT (Figure 6a–c), similar to mouse primary cells. These findings consistently corroborate the findings of BTK as a required factor for the mutated G-CSFR signaling. Finally, in a drug synergy assay, we did observe a dramatic synergy between ibrutinib and ruxolitinib at much lower dose (Figure 7). This finding has a direct implication to improve standard of care for the leukemia patients carrying CSF3R mutations. Unlike other TKI-sensitive leukemia models (31), we did not observe cytokine rescue of Ibrutinib-based TKI with mutants, but this may be due to the fact that the inhibitor is not targeting the driver mutation. We conclude that in G-CSFR mutant leukemia, Btk may be an “oncorequisite” factor; a protein that is not mutated in the tumor, but upon which the tumor depends for maintenance (32). The reported findings suggest that Ibrutinib might be repositioned for clinical intervention in CSF3R-mutant myeloid malignancies to exploit this Btk dependency. The ability to perhaps eliminate or at least prolong the conversion of SCN patients on G-CSF induction therapy by clearing CSF3R-mutant clones early during leukemia evolution through surveillance testing could dramatically improve the outcome for this patient group.
Phosphoproteomics data deposition
The mass spectrometry proteomics data have been deposited to the ProteomeXchange Consortium via the PRIDE [1] partner repository with the dataset identifier PXD009662
Supplementary Material
(a) Schematic of the SILAC-based phospho-tyrosine work flow. (b) Pearson’s Correlation coefficient (r) were calculated and plotted to verify the biological reproducibility of the relative quantitation between the two biological replicates.
(a) Schematic of the workflow for generation of G-CSFR expressing 32D cells. (b) Flow cytometry plots of transduced 32D cells validating the expected levels of G-CSFR expression after FACS-sorting.
FACS plots of retroviral-transduced human CD34+ umbilical cord cells displaying the gate used to sort cells for downstream assays.
Acknowledgments
The authors thank Dr. Fan Dong (University of Toledo, Ohio) for providing 32D cell line and Dr. Dan Link (University of Washington, St. Louis, MO) for providing the truncation mutation G-CSFR mice. The authors are also grateful to Drs. Julia Maxson (Oregon Health Science University, Portland, OR) and D Ivo Touw (Erasmus Medical Center, Rotterdam, The Netherlands) for insightful suggestions during the study and Mr. Glenn Doermann for his expertise in graphic design for the figures. This article and our research work associated with G-CSFR are supported by several sources, including National Institutes of Health (NIH) Grant 1S10 RR027015-01 (KDG), the University of Cincinnati Millennium Scholars Fund (KDG), and the Cincinnati Children’s Hospital Research Foundation (KDG), Graduate Student Governance Association (GSGA) funding resources (PD), National Institutes of Health T32 ES007250-06 (DEM) as well as R01 CA196658 (HLG) and a grant from CancerFree Kids (HLG).
List of abbreviations
- SILAC
Stable Isotope Labeling by Amino Acids in Cell Culture
- G-CSF
Granulocyte-Colony Stimulating Factor
- G-CSFR
Granulocyte-Colony Stimulating Factor Receptor
- CNL
Chronic Neutrophilic Leukemia
- AML
Acute Myeloid Leukemia
- SCN
Severe Congenital Neutropenia
- MDS
Myelodysplastic Syndrome
- BTK
Bruton’s Tyrosine Kinase
Footnotes
CONFLICT OF INTEREST
The authors declare no conflict of interest.
Author contribution
PD, DEM, MA, HLG, and KDG designed, performed, and analyzed all of the experiments. MA, HLG and KDG provided funding, intellectual direction and overall progression of the study. MW played an instrumental role in the data sorting and processing.
References
- 1.Touw IP, Palande K, Beekman R. Granulocyte colony-stimulating factor receptor signaling: Implications for G-CSF responses and leukemic progression in severe congenital neutropenia. Hematol Oncol Clin North Am. 2013;27:61–73. doi: 10.1016/j.hoc.2012.10.002. [DOI] [PubMed] [Google Scholar]
- 2.Dwivedi P, Greis KD. Granulocyte colony-stimulating factor receptor signaling in severe congenital neutropenia, chronic neutrophilic leukemia, and related malignancies. Exp Hematology. 2017;46:9–20. doi: 10.1016/j.exphem.2016.10.008. [DOI] [PMC free article] [PubMed] [Google Scholar]
- 3.Beekman R, Touw IP. G-CSF and its receptor in myeloid malignancy. Blood. 2010;115:5131–5136. doi: 10.1182/blood-2010-01-234120. [DOI] [PubMed] [Google Scholar]
- 4.Rosenberg PS, Alter BP, Bolyard AA, Bonilla MA, Boxer LA, Chem B, et al. The incidence of leukemia and mortality from sepsis in patients with severe congenital neutropenia receiving long-term G-CSF therapy. Blood. 2006;107:4628–4635. doi: 10.1182/blood-2005-11-4370. [DOI] [PMC free article] [PubMed] [Google Scholar]
- 5.Gotlib J, Maxson JE, George TI, Tyner JW. The new genetics of chronic neutrophilic leukemia and atypical CML: implications for diagnosis and treatment. Blood. 2013;122:1707–1711. doi: 10.1182/blood-2013-05-500959. [DOI] [PMC free article] [PubMed] [Google Scholar]
- 6.Touw IP, Beekman R. Severe congenital neutropenia and chronic neutrophilic leukemia: An intriguing molecular connection unveiled by oncogenic mutations in CSF3R. Haematologica. 2013;98:1490–1492. doi: 10.3324/haematol.2013.090571. [DOI] [PMC free article] [PubMed] [Google Scholar]
- 7.Zhang H, Nguyen-Jackson H, Panopoulos AD, Li HS, Murray PJ, Watowich SS. STAT3 controls myeloid progenitor growth during emergency granulopoiesis. Blood. 2010;116:2462–2471. doi: 10.1182/blood-2009-12-259630. [DOI] [PMC free article] [PubMed] [Google Scholar]
- 8.Beekman R, Valkhof MG, Sanders MA, van Strien PM, Haanstra JR, Broeders L, et al. Sequential gain of mutations in severe congenital neutropenia progressing to acute myeloid leukemia. Blood. 2012;119:5071–5077. doi: 10.1182/blood-2012-01-406116. [DOI] [PubMed] [Google Scholar]
- 9.Mehta HM, Glaubach T, Long A, Lu H, Przychodzen B, Makishima H, et al. Granulocyte colony stimulating factor receptor T595I (T618I) mutation confers ligand independence and enhanced signaling. Leukemia. 2013;27:2407–2410. doi: 10.1038/leu.2013.164. [DOI] [PubMed] [Google Scholar]
- 10.Maxson JE, Gotlib J, Pollyea DA, Fleischman AG, Agarwal A, Eide CA, et al. Oncogenic CSF3R mutations in chronic neutrophilic leukemia and atypical CML. N Engl J Med. 2013;368:1781–1790. doi: 10.1056/NEJMoa1214514. [DOI] [PMC free article] [PubMed] [Google Scholar]
- 11.Liu F, Kunter G, Krem MM, Eades WC, Cain JA, Tomasson MH, et al. Csf3r mutations in mice confer a strong clonal HSC advantage via activation of Stat5. J Clin Invest. 2008;118:946–955. doi: 10.1172/JCI32704. [DOI] [PMC free article] [PubMed] [Google Scholar]
- 12.Pardanani A, Lasho TL, Laborde RR, Elliott M, Hanson CA, Knudson RA, et al. CSF3R T618I is a highly prevalent and specific mutation in chronic neutrophilic leukemia. Leukemia. 2013;27:1870–1873. doi: 10.1038/leu.2013.122. [DOI] [PMC free article] [PubMed] [Google Scholar]
- 13.Dao KH, Solti MB, Maxson JE. Significant clinical response to JAK1/2 inhibition in a patient with CSF3R-T618I-positive atypical chronic myeloid leukemia. Leuk Res Rep. 2014;3:67–69. doi: 10.1016/j.lrr.2014.07.002. [DOI] [PMC free article] [PubMed] [Google Scholar]
- 14.Rohrabaugh S, Kesarwani M, Kincaid Z, Huber E, Leddonne J, Siddiqui Z, et al. Enhanced MAPK signaling is essential for CSF3R-induced leukemia. Leukemia. 2017;31(8):1770–1778. doi: 10.1038/leu.2016.376. [DOI] [PMC free article] [PubMed] [Google Scholar]
- 15.Hunter Tony. Tyrosine phosphorylation: thirty years and counting. Curr Opin Cell Biol. 2009;21(2):140–146. doi: 10.1016/j.ceb.2009.01.028. [DOI] [PMC free article] [PubMed] [Google Scholar]
- 16.Ong SE, Mann M. A practical recipe for stable isotope labeling by amino acids in cell culture (SILAC) Nat Proto. 2006;1(6):2650–60. doi: 10.1038/nprot.2006.427. [DOI] [PubMed] [Google Scholar]
- 17.Rush J, Moritz A, Lee KA, Guo A, Goss VL, Spek EJ, et al. Immunoaffinity profiling of tyrosine phosphorylation in cancer cells. Nat Biotech. 2005;23:94–101. doi: 10.1038/nbt1046. [DOI] [PubMed] [Google Scholar]
- 18.Szklarczyk D, Franceschini A, Wyder S, Forslund K, Heller D, Huerta-Cepas J, et al. STRING v10: protein-protein interaction networks, integrated over the tree of life. Nuc Acid Res. 2015;(43):D447–D452. doi: 10.1093/nar/gku1003. [DOI] [PMC free article] [PubMed] [Google Scholar]
- 19.Lachmann A, Ma’ayan A. KEA: kinase enrichment analysis. Bioinformatics. 2009;25:684–686. doi: 10.1093/bioinformatics/btp026. [DOI] [PMC free article] [PubMed] [Google Scholar]
- 20.Maxson JE, Luty SB, MacManiman JD, Abel ML, Druker BJ, Tyner JW. Ligand independence of the T618I mutation in the granulocyte colony-stimulating factor 3 receptor (CSF3R) protein results from loss of O-linked glycosylation and increased receptor dimerization. J Biol Chem. 2014;289:5820–5827. doi: 10.1074/jbc.M113.508440. [DOI] [PMC free article] [PubMed] [Google Scholar]
- 21.Hermans MH, Antonissen C, Ward AC, Mayen AE, Ploemacher RE, Touw IP. Sustained receptor activation and hyperproliferation in response to granulocyte colony-stimulating factor (G-CSF) in mice with a severe congenital neutropenia/acute myeloid leukemia derived mutation in the G-CSF receptor gene. J Exp Med. 1999;189:683–692. doi: 10.1084/jem.189.4.683. [DOI] [PMC free article] [PubMed] [Google Scholar]
- 22.Aarts LH, Roovers O, Ward AC, Touw IP. Receptor activation and 2 distinct COOH terminal motifs control G-CSF receptor distribution and internalization kinetics. Blood. 2004;104:571–579. doi: 10.1182/blood-2003-07-2250. [DOI] [PubMed] [Google Scholar]
- 23.Wilson WH, Young RM, Schmitz RS, Yang Y, Pittaluga S, Wright G, et al. Targeting B cell receptor signaling with ibrutinib in diffuse large B cell lymphoma. Nat Med. 2015;21:922–926. doi: 10.1038/nm.3884. [DOI] [PMC free article] [PubMed] [Google Scholar]
- 24.Rushworth SA, Murray MY, Zaitseva L, Bowles KM, MacEwan DJ. Identification of Bruton’s tyrosine kinase as a therapeutic target in acute myeloid leukemia. Blood. 2014;123:1229–1238. doi: 10.1182/blood-2013-06-511154. [DOI] [PubMed] [Google Scholar]
- 25.Oellerich T, Mohr S, Corso J, Beck J, Dobele C, Braun H, et al. FLT3-ITD and TLR9 use Bruton Tyrosine kinase to activate distinct transcriptional programs mediating AML cell survival and proliferation. Blood. 2015;125(12):1936–1947. doi: 10.1182/blood-2014-06-585216. [DOI] [PubMed] [Google Scholar]
- 26.Wilson TR, Fridlyand J, Yan Y, Penuel E, Burton L, Chan E, et al. Widespread potential for growth-factor-driven resistance to anticancer kinase inhibitors. Nature. 2012;487:505–509. doi: 10.1038/nature11249. [DOI] [PMC free article] [PubMed] [Google Scholar]
- 27.Stuible M, Abella JV, Feldhammer M, Nossov M, Sangwan V, Blagoev B, et al. Ptpb1b targets the endosomal sorting machinery: dephosphorylation of regulatory sites in the endosomal sorting complex required for transport component STAM2. J Biol Chem. 2010;285(31):23899–907. doi: 10.1074/jbc.M110.115295. [DOI] [PMC free article] [PubMed] [Google Scholar]
- 28.Wang L, Rudert WA, Loutaev I, Roginskaya V, Corey SJ. Repression of c-Cbl leads to enhanced G-CSF Jak-STAT signaling without increased cell proliferation. Oncogene. 2002;21:5346–5355. doi: 10.1038/sj.onc.1205670. [DOI] [PubMed] [Google Scholar]
- 29.Joffre C, Barrow R, Menard L, Calleja V, Hart IP, Kermogrant S. A direct role for Met endocytosis in tumorigenesis. Nat Cell Biol. 2011;13:827–837. doi: 10.1038/ncb2257. [DOI] [PubMed] [Google Scholar]
- 30.Weinstein IB. Addiction to oncogenes-the Achilles heal of Cancer. Science. 2002;297:63–64. doi: 10.1126/science.1073096. [DOI] [PubMed] [Google Scholar]
- 31.Kesharwani M, Kincaid Z, Gomaa A, Huber E, Rohrabaugh S, Siddiqui Z, et al. Trageting c-Fos and DUSP1 abrogates intrinsic resistance to tyrosine-kinase inhibitor therapy in BCR-ABL-induced leukemia. Nat Med. 2017;23:472–482. doi: 10.1038/nm.4310. [DOI] [PMC free article] [PubMed] [Google Scholar]
- 32.Khandanpour C, Phelan JD, Vassen L, Schutte J, Chen R, Horman SR, et al. Growth factor independence 1 antagonizes a p53-induced DNA damage response pathway in lymphoblastic leukemia. Cancer Cell. 2013;23(2):200–14. doi: 10.1016/j.ccr.2013.01.011. [DOI] [PMC free article] [PubMed] [Google Scholar]
Associated Data
This section collects any data citations, data availability statements, or supplementary materials included in this article.
Supplementary Materials
(a) Schematic of the SILAC-based phospho-tyrosine work flow. (b) Pearson’s Correlation coefficient (r) were calculated and plotted to verify the biological reproducibility of the relative quantitation between the two biological replicates.
(a) Schematic of the workflow for generation of G-CSFR expressing 32D cells. (b) Flow cytometry plots of transduced 32D cells validating the expected levels of G-CSFR expression after FACS-sorting.
FACS plots of retroviral-transduced human CD34+ umbilical cord cells displaying the gate used to sort cells for downstream assays.


