

Abstract
Dopamine D2 receptor signaling is central for striatal function and movement, while abnormal activity is associated with neurological disorders including the severe early‐onset DYT1 dystonia. Nevertheless, the mechanisms that regulate D2 receptor signaling in health and disease remain poorly understood. Here, we identify a reduced D2 receptor binding, paralleled by an abrupt reduction in receptor protein level, in the striatum of juvenile Dyt1 mice. This occurs through increased lysosomal degradation, controlled by competition between β‐arrestin 2 and D2 receptor binding proteins. Accordingly, we found lower levels of striatal RGS9‐2 and spinophilin. Further, we show that genetic depletion of RGS9‐2 mimics the D2 receptor loss of DYT1 dystonia striatum, whereas RGS9‐2 overexpression rescues both receptor levels and electrophysiological responses in Dyt1 striatal neurons. This work uncovers the molecular mechanism underlying D2 receptor downregulation in Dyt1 mice and in turn explains why dopaminergic drugs lack efficacy in DYT1 patients despite significant evidence for striatal D2 receptor dysfunction. Our data also open up novel avenues for disease‐modifying therapeutics to this incurable neurological disorder.
Keywords: beta‐arrestin, lysosomal degradation, striatum
Subject Categories: Neuroscience, Pharmacology & Drug Discovery
Introduction
Striatal dopaminergic transmission is central to movement control and several disease conditions (Redgrave et al, 2010; Gittis & Kreitzer, 2012). Dopaminergic dysfunction has been implicated in early‐onset generalized DYT1‐TOR1A dystonia, a highly disabling and incurable neurological disease typically manifesting in childhood, which generalizes within a few years causing involuntary movements and abnormal postures (Balint et al, 2018). This disorder is most frequently caused by an autosomal dominant ∆gag mutation in the TOR1A gene, causing loss of function of the gene product torsinA, a member of the AAA+ (ATPases associated with cellular activities) family of proteins (Ozelius et al, 1997). Mutant ∆E‐torsinA is mislocalized from the endoplasmic reticulum to the nuclear envelope, causing abnormalities in folding, assembly, and trafficking of proteins targeted for secretion or to membranes (Torres et al, 2004; Burdette et al, 2010; Granata et al, 2011).
Clinical neuroimaging studies have revealed decreased caudate–putamen dopamine D2 receptor (DRD2) availability in DYT1 patients compared to controls (Asanuma et al, 2005; Carbon et al, 2009). Reduced striatal DRD2 binding and protein level have also been reported in several different DYT1 experimental models (Napolitano et al, 2010; Yokoi et al, 2011; Dang et al, 2012). Notably, multiple lines of evidence demonstrated reduced coupling between the DRD2 and its cognate G proteins and severely altered receptor function (Pisani et al, 2006; Napolitano et al, 2010; Sciamanna et al, 2011, 2012a; Martella et al, 2014; Scarduzio et al, 2017).
DRD2 signaling via G proteins inhibits cAMP production and in turn PKA activity. However, there is also accumulating evidence for G protein‐independent DRD2 signaling functions (Beaulieu & Gainetdinov, 2011), as well as G protein‐independent regulation of the GPCR activity of DRD2. The reciprocal interactions of DRD2 with spinophilin or arrestin represent a regulatory mechanism for fine‐tuning receptor‐mediated signaling. Indeed, β‐arrestin 2 (β‐Arr2) is involved in internalization and G protein‐independent signaling of DRD2 (Beaulieu et al, 2011; Del'guidice et al, 2011), while spinophilin antagonizes arrestin actions (Wang et al, 2004). In addition, the striatal‐enriched regulator of G protein signaling 9‐2 (RGS9‐2) regulates the amplitude of the behavioral responses to DRD2 activation (Rahman et al, 2003; Gold et al, 2007; Traynor et al, 2009), inhibits DRD2 internalization (Celver et al, 2010), and specifically modulates DRD2 signaling in striatal neuronal subtypes (Cabrera‐Vera et al, 2004). On the other hand, the receptor can target the RGS protein to the plasma membrane (Kovoor et al, 2005; Celver et al, 2012), and exposure to DRD2 ligands can alter RGS9‐2 level in wild‐type animals (Seeman et al, 2007) indicating a reciprocal modulation.
In the present work, we investigated the molecular mechanisms underlying DRD2 reduced levels and altered signaling in the striatum of DYT1 dystonia models, Tor1a +/−‐knock‐out and Tor1a ∆gag/+‐knock‐in mice (Goodchild et al, 2005). Our findings shed new light on DRD2 dysfunction in DYT1 striatum and show that in vivo delivery of RGS9‐2 is able to rescue DRD2 expression levels and to recover striatal D2DR signaling. These findings might explain the paradox of the lack of efficacy of dopaminergic drugs in DYT1‐TOR1A dystonia patients, despite strong evidence that abnormal dopamine signaling is central to disease pathophysiology. Further, they also define a potential therapeutic target that restores dopaminergic responses.
Results
DRD2 and RGS9‐2 protein levels are simultaneously downregulated in DYT1 striatum
In order to analyze the molecular mechanisms of DRD2 dysfunction, we utilized the Tor1a +/− mouse model that mimics the loss of function effect of the DYT1 dystonia TOR1A mutation.
First, we measured receptor expression levels in the striatum of adult (P60–P90) Tor1a +/+ (Fig EV1) and Tor1a +/− male littermates. Tor1a +/− samples showed, as expected, lower amounts of torsinA protein (Fig 1A1; Tor1a +/+ 1.000 ± 0.053 N = 7, Tor1a +/− 0.602 ± 0.055 N = 6, t‐test P = 0.0003). In lysates of Tor1a +/− striatum, we also observed significantly reduced levels of DRD2 protein compared to Tor1a +/+ control samples (Fig 1A1; Tor1a +/+ 1.000 ± 0.027 N = 18, Tor1a +/− 0.839 ± 0.044 N = 16, t‐test P = 0.0029), despite similar mRNA levels (Fig EV2; 2−dCt: Tor1a +/+ 0.649 ± 0.081 N = 3, Tor1a +/− 0.587 ± 0.175 N = 3; Mann–Whitney test P = 1.0000). Based on the well‐characterized reciprocal regulatory relationship between GPCRs and regulator of G protein signaling (RGS) proteins, we next examined whether RGS protein levels were affected and might give further insight on the nature of the impairment of D2R‐mediated transmission in DYT1 mutant mice. We focused this analysis on striatal levels of RGS9‐2, an R7 RGS family member specifically regulating DRD2 function, and the closely related RGS7. Western blotting (WB) analysis revealed significantly reduced RGS9‐2 levels in Tor1a+/− mice (Fig 1A1; Tor1a +/+ 1.000 ± 0.036 N = 32, Tor1a +/− 0.844 ± 0.049 N = 33, t‐test P = 0.0115). Conversely, RGS7 levels were comparable between genotypes (Fig 1A1; Tor1a +/+ 1.000 ± 0.077 N = 7; Tor1a +/− 0.980 ±0.097 N = 7, t‐test P = 0.8721), ruling out a generalized protein downregulation and pointing to a specific deficit of DRD2 and its signaling pathway.
Figure EV1. Representative DRD2 immunoblotting of striatal tissue.
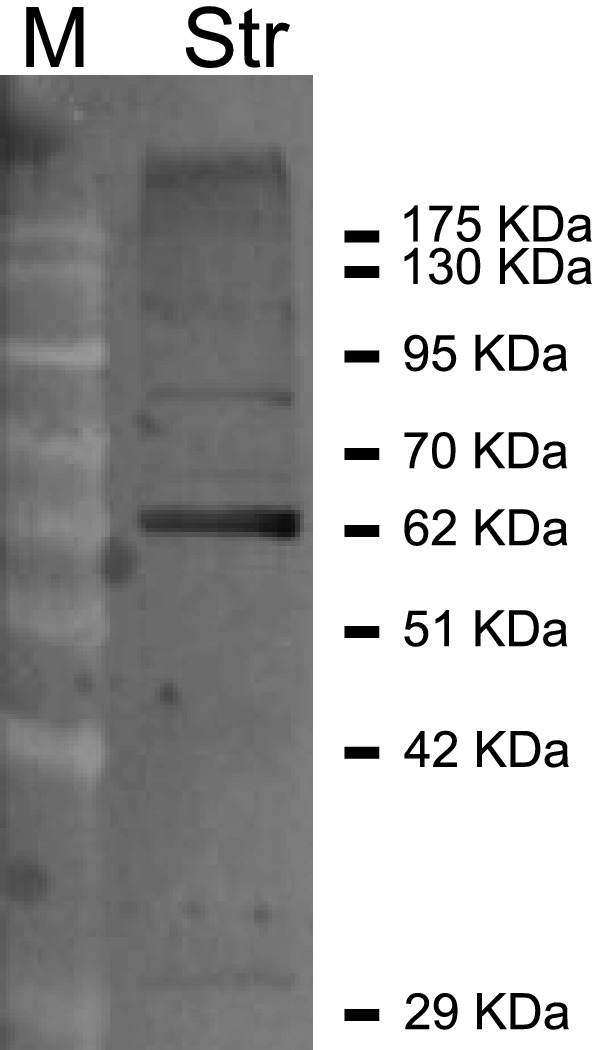
Pattern of DRD2 immunolabeling in the striatum of adult wild‐type Tor1a+/+ mice. 30 μg of striatal (Str) lysate was loaded. DRD2 antibody recognized a prominent band at ~ 63 kDa.
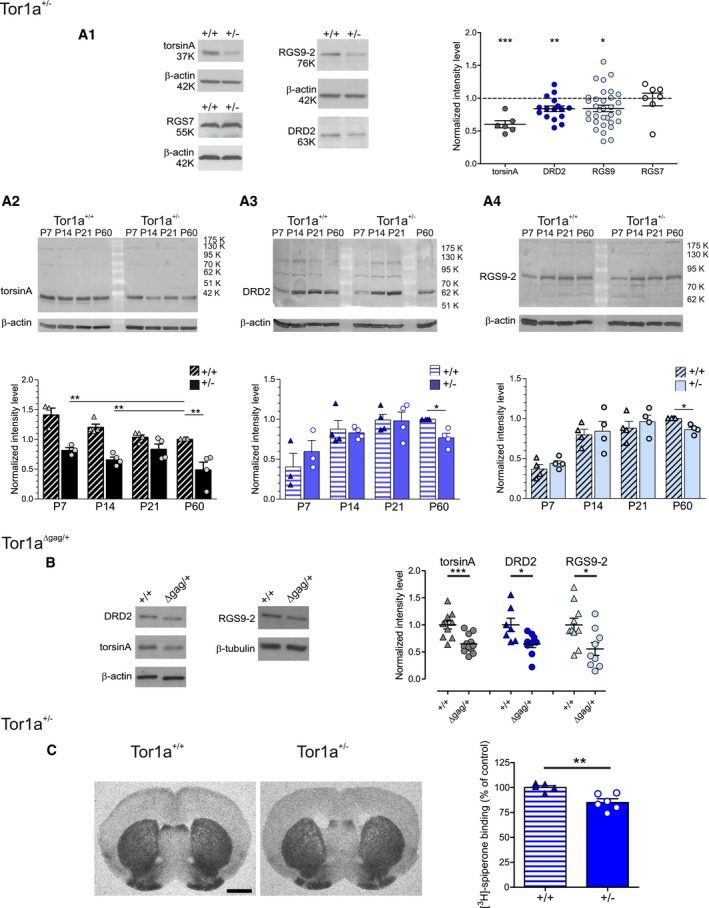
Figure 1. Striatal levels of DRD2 and RGS9‐2 are reduced in the Tor1a +/− and Tor1a ∆gag/+ DYT1 dystonia mouse models.
-
A(A1) Representative WBs showing DRD2 and RGS9‐2 downregulation in adult (P60–P90) Tor1a +/− (+/−) striata, characterized by a reduced torsinA protein level with respect to Tor1a +/+ (+/+) littermates. The striatal level of RGS7 is unchanged. The dot plot shows Tor1a +/− data, normalized to Tor1a +/+ controls of the same experiment. TorsinA: Tor1a +/+ N = 7, Tor1a +/− N = 6, t‐test ***P = 0.0003; DRD2: Tor1a +/+ N = 18, Tor1a +/− N = 16, t‐test **P = 0.0029; RGS9‐2: Tor1a +/+ N = 32, Tor1a +/− N = 33, t‐test *P = 0.0115; RGS7: Tor1a +/+ N = 7, Tor1a +/− N = 7, t‐test P = 0.8721. WB quantification data, expressed as the ratio of protein vs. loading control intensity level, are normalized to the wild‐type samples of the same experiment. (A2–A4) Time‐course of changes in torsinA, DRD2, and RGS9‐2 striatal levels along postnatal development. Summary plot data are normalized to the Tor1a +/+ P60 sample of each independent experiment. (A2) TorsinA level is significantly reduced in mutants throughout the developmental period considered (P7 N = 3; P14–P60 N = 4; one‐way ANOVA P < 0.0001 and Bonferroni's multiple comparison test **P < 0.01 at P7, P14, and P60). (A3, A4) DRD2 and RGS9‐2 levels show parallel courses, with a similar increase from P7 to P21 in Tor1a +/+ as well as Tor1a +/− striatal lysates (P7: DRD2 N = 3, RGS9‐2 N = 4; P14–P21 N = 4; one‐way ANOVA with Bonferroni's multiple comparison test P > 0.05). At P60, a simultaneous reduction of DRD2 and RGS9‐2 levels is observed in Tor1a +/− striatal lysates (N = 4; Tor1a +/− one‐sample t‐test DRD2: *P = 0.0250, RGS9‐2: *P = 0.0175). WB quantification data, expressed as the ratio of protein vs. loading control intensity level, are normalized to the wild‐type P60 sample of the same experiment. Mean ± SEM is represented in the graphs.
-
BRepresentative WB images and the dot plot show downregulation of torsinA, DRD2, and RGS9‐2 striatal levels also in adult P60–P90 Tor1a ∆gag/+ (∆gag/+) mice. TorsinA: Tor1a +/+ N = 10, Tor1a Δgag/+ N = 12, t‐test ***P = 0.0006; DRD2: Tor1a +/+ N = 7, Tor1a Δgag/+ N = 9, t‐test *P = 0.0183; RGS9‐2: Tor1a +/+ N = 10, Tor1a Δgag/+ N = 9, t‐test *P = 0.0192. WB quantification data, expressed as the ratio of protein vs. loading control intensity level, are normalized to the wild‐type samples of the same experiment. Mean ± SEM is represented in the graph.
-
CLeft: Representative image of coronal striatal slices of fresh‐frozen brains of wild‐type and Tor1a +/− mice probed with the DRD2 radioligand 3H‐spiperone. Scale bar 1.5 mm. Right: Graph showing DRD2 binding density in Tor1a +/− striatal sections, obtained from the densitometric quantification analysis, expressed as percentage variation compared to control animals. Tor1a +/+ N = 5, Tor1a +/− N = 6, t‐test **P = 0.0042. Mean ± SEM is represented.
Source data are available online for this figure.
Figure EV2. Similar DRD2 mRNA expression in Tor1a +/+ and Tor1a +/− striatum.
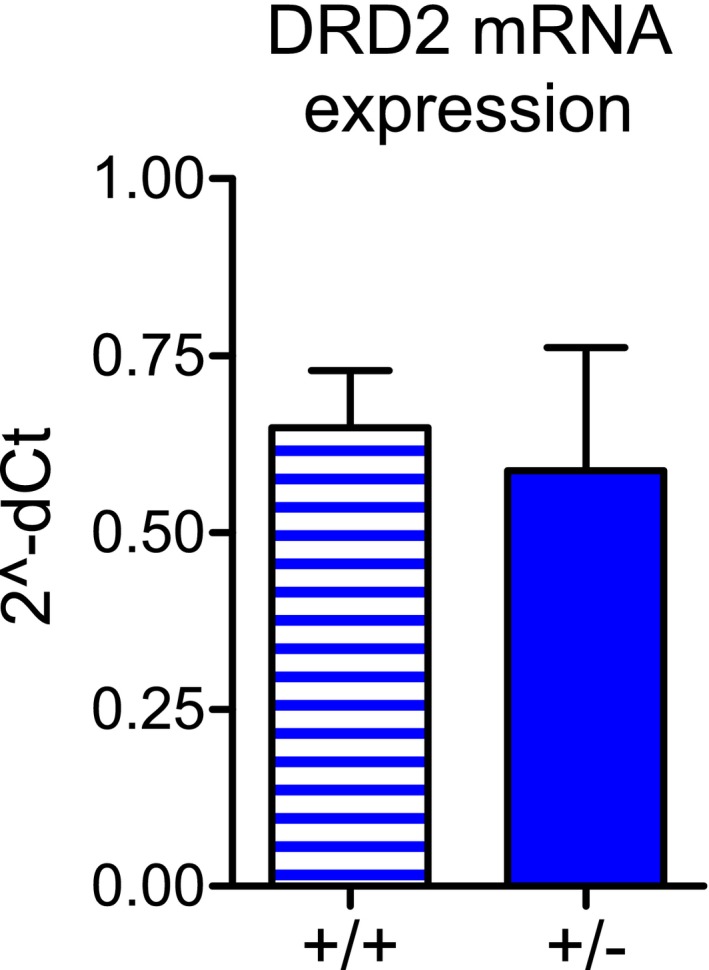
DRD2 mRNA expression is unaltered in the striatum of Tor1a +/− mice (N = 3) with respect to wild‐types (N = 3), as determined by qRT–PCR (Mann–Whitney test P > 0.05). Data are represented as mean ± SEM.
To assess the reciprocal relationship among these dysregulated proteins, we then analyzed the time‐course of striatal expression levels of torsinA, DRD2, and RGS9‐2 during postnatal development (P7, P14, P21, P60). TorsinA levels (Fig 1A2) were significantly reduced in Tor1a +/− with respect to control mice at P7, P14 and P60 (one‐way ANOVA P < 0.0001 and Bonferroni's multiple comparison test P < 0.01). In contrast, DRD2 levels increased similarly between P7 and P21 in both genotypes (Fig 1A3; Tor1a +/+: P7 0.404 ± 0.169, P21 0.991 ± 0.072; Tor1a +/−: P7 0.595 ±0.140, P21 0.980 ± 0.111; one‐way ANOVA P = 0.0023 and Bonferroni's multiple comparison test: Tor1a +/+ vs. Tor1a +/− P > 0.05), consistent with the previously reported developmental progression of mRNA levels in the murine striatum (Araki et al, 2007). However, while the receptor remained at steady level at P60 in Tor1a +/+ striatum, it showed a significant reduction in P60 Tor1a +/− samples (DRD2 P60 Tor1a +/− 0.768 ± 0.055, N = 4, one‐sample t‐test P = 0.0250). Interestingly, in Tor1a +/+ mice the developmental profile of RGS9‐2 protein expression (Anderson et al, 2007a) was superimposable to that of DRD2 (Pearson's r correlation test: R 2 0.97, P = 0.0152). Similarly, in Tor1a +/− striatum, RGS9‐2 expression levels paralleled the course of DRD2 protein and showed a significant decrease at P60 (Fig 1A4; RGS9‐2 P60 Tor1a +/− 0.861 ± 0.029, N = 4, one‐sample t‐test P = 0.0175).
To confirm the involvement of DRD2 dysregulation in DYT1 dystonia, we measured striatal receptor levels in a different model, the Tor1aΔgag/+ mouse. TorsinA levels were reduced in adult (P60–P90) male mutant mice with respect to wild‐type littermates (Fig 1B; Tor1a +/+ 1.000 ± 0.075 N = 10, Tor1a Δgag/+ 0.649 ± 0.048 N = 12; t‐test P = 0.0006), providing further evidence that the Δgag is a loss of function mutation that alters torsinA protein expression level (Goodchild et al, 2005; Gordon & Gonzalez‐Alegre, 2008). Of note, DRD2 and RGS9‐2 protein expression levels were also reduced in Tor1a Δgag/+ striatum (Fig 1B; DRD2: Tor1a +/+ 1.000 ± 0.123 N = 7, Tor1a Δgag/+ 0.648 ± 0.067 N = 9, t‐test P = 0.0183; RGS9‐2: Tor1a+/+ 1.000 ± 0.123 N = 10, Tor1a Δgag/+ 0.556 ± 0.119 N = 9, t‐test P = 0.0192), similarly to what we observed in Tor1a +/− mice, further strengthening the relevance of dopaminergic dysfunction in DYT1 dystonia.
Finally, we performed an in situ DRD2 binding study with 3H‐spiperone (Zeng et al, 2004). As reported in Fig 1C, a significant 15% decrease in DRD2 binding density was found in Tor1a+/− as compared to wild‐type striatum, in accordance with Western blot analysis (Fig 1C; Tor1a+/+ 100.00 ± 1.83, N = 5; Tor1a+/− 84.94 ± 3.83, N = 6, t‐test P = 0.0042).
DRD2 downregulation in Tor1a +/− striatum is mediated by lysosomal degradation
RGS9‐2 possesses specific determinants which target the protein for constitutive degradation by lysosomal proteases, unless it is shielded by its membrane anchor R7 binding protein (R7BP; Anderson et al, 2007b). Additionally, RGS9‐2 interacts with another binding partner, the atypical G protein subunit type 5 G protein beta (Gβ5) subunit (Masuho et al, 2011). We therefore investigated whether RGS9‐2 downregulation may be determined by changes in striatal levels of its binding partners. Unexpectedly, we found that striatal levels of R7BP were significantly increased, whereas Gβ5 protein amount was unaltered (Fig 2A1–A3; Gβ5 Tor1a +/+: 1.000 ± 0.049 N = 11, Tor1a +/−: 1.002 ± 0.036 N = 10, Mann–Whitney test P = 0.2453; R7BP Tor1a +/+: 1.000 ± 0.057 N = 12, Tor1a +/−: 1.279 ± 0.051 N = 12, t‐test P = 0.0014). Therefore, we evaluated the stability of RGS9‐2 protein, by measuring its degradation by lysosomal proteases. Tor1a +/+ and Tor1a +/− dorsal striatum contralateral slices were incubated with or without the lysosomal protease inhibitor leupeptin (Anderson et al, 2007a; leu, 100 μM; Fig 2B1 and B2). In the absence of lysosomal proteolysis inhibition, we observed a similar extent of RGS9‐2 degradation in Tor1a +/− and wild‐type mice (Fig 2B2; Tor1a +/+: with leu 1.000 ± 0.115 N = 5, without leu 0.712 ± 0.041 N = 5, t‐test P = 0.0464; Tor1a +/−: with leu 0.917 ± 0.095 N = 5, without leu 0.610 ± 0.043 N = 5, t‐test P = 0.0190; Tor1a +/+ 74.00 ± 7.58% reduction; Tor1a +/− 70.58 ± 10.26% reduction, Tor1a +/+ vs. Tor1a +/− t‐test P = 0.7956), indicating that RGS9‐2 protein turnover is unaltered in mutant mice. Since also the long‐lived DRD2 protein can be targeted to lysosomal degradation (Li et al, 2012), we wondered whether the lower DRD2 levels in the Tor1a +/− striatum could be caused by increased lysosomal degradation. Thus, we quantified DRD2 protein expression level in the previously described experimental conditions, and found similar levels in lysates of Tor1a +/+ striatal slices incubated with or without leu, indicating a long protein half‐life (Fig 2B2; Tor1a +/+: with leu 1.000 ± 0.049 N = 4, without leu 0.925 ± 0.076 N = 4, t‐test P = 0.4376). Surprisingly, however, in Tor1a +/− striatal lysates incubated without leu we observed a reduced level of the DRD2 protein (Fig 2B2; Tor1a +/−: with leu 0.904 ± 0.088 N = 4, without leu 0.664 ± 0.030 N = 4, t‐test P = 0.0427), suggesting that loss of torsinA may disrupt DRD2 protein stability.
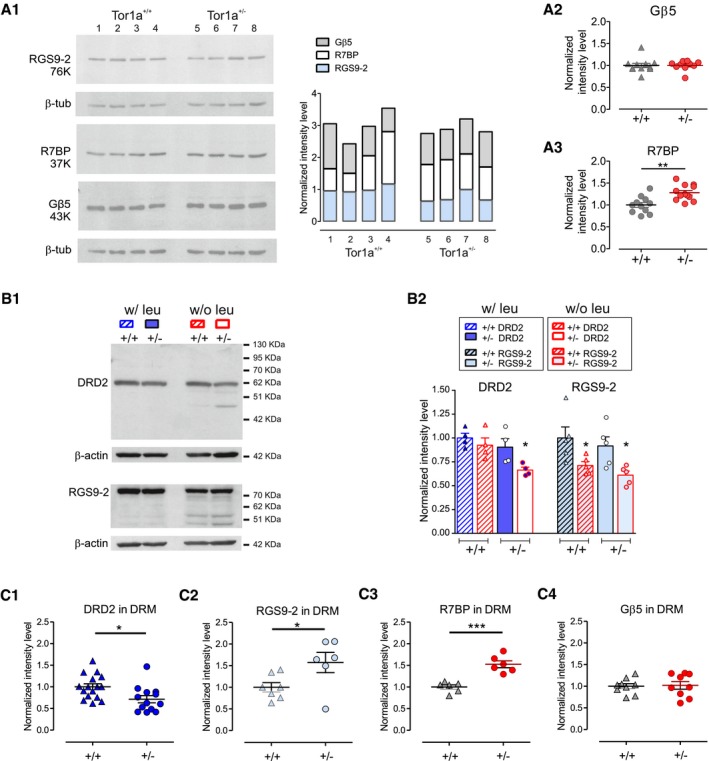
Figure 2. DRD2 downregulation is mediated by lysosomal degradation.
-
A(A1) Representative WB of RGS9‐2, R7BP, and Gβ5 proteins on four Tor1a +/+ and four Tor1a +/− striatal lysates. The bar histogram on the right shows the quantification of the three proteins in each sample. (A2) Dot plot showing that Gβ5 striatal levels are unchanged in Tor1a +/− mice (Tor1a +/+ N = 11, Tor1a +/− N = 10, Mann–Whitney test P = 0.2453). (A3) Conversely, the level of the R7 binding protein R7BP is increased in Tor1a +/− striatum (Tor1a +/+ N = 12, Tor1a +/− N = 12, t‐test **P = 0.0014). Values are represented as ratio of protein vs. loading control intensity level, normalized to the mean of Tor1a +/+ control values of the same experiment. Mean ± SEM is represented.
-
B(B1) Representative WB of lysates of Tor1a +/+ and Tor1a +/− dorsal striatum slices incubated for 5 h in the presence (w/ leu) or absence (w/o leu; contralateral striatum) of the protease inhibitor leupeptin. Samples showing enhanced degradation of DRD2 and/or RGS9‐2 proteins show additional bands at lower molecular weight. (B2) Summary plot reporting mean ± SEM of RGS9‐2 and DRD2 protein level values, expressed as the ratio of protein vs. loading control intensity level, normalized to the value of the Tor1a +/+ w/leu sample measured in the same experiment. DRD2: Tor1a +/+ N = 4, t‐test P = 0.4376; Tor1a +/− N = 4, t‐test *P = 0.0427; RGS9‐2: Tor1a +/+ N = 5, t‐test *P = 0.0464; Tor1a +/− N = 5, t‐test *P = 0.0190.
-
CDot plots showing DRD2, RGS9‐2, R7BP, and Gβ5 protein levels measured in striatal detergent‐resistant‐membrane (DRM) preparations from Tor1a +/− (+/−) and WT (+/+) mice (DRD2: Tor1a +/+ N = 16, Tor1a +/− N = 13, t‐test *P = 0.0129; RGS9‐2: Tor1a +/+ N = 7, Tor1a +/− N = 6, t‐test *P = 0.0396; R7BP: Tor1a +/+ N = 6, Tor1a +/− N = 6, t‐test ***P = 0.0002; Gβ5: Tor1a +/+ N = 9, Tor1a +/− N = 9, t‐test P = 0.8461). Values are reported as ratio of protein vs. PSD‐95 intensity level, normalized to the mean value of the Tor1a +/+ samples measured in the same experiment. Mean ± SEM is represented.
Source data are available online for this figure.
Detergent‐resistant membranes (DRM) are thought to contain structures such as lipid rafts and to be involved in membrane compartmentalization. Notably, torsinA levels affect cellular lipid metabolism (Grillet et al, 2016) and therefore may alter the portion of DRD2 and RGS9‐2 that is expressed in the DRM fraction. We therefore measured the level of DRD2 and RGS9‐2 expressed in the DRM of control and Tor1a +/− striatum (Celver et al, 2012). We observed a reduction of DRD2 protein expression level in the DRM of Tor1a +/− striatum (Fig 2C1; Tor1a +/+ 1.000 ± 0.070 N = 16; Tor1a +/− 0.714 ± 0.083 N = 13; t‐test P = 0.0129), further supporting a downregulation of the receptor. Notably, we found instead an increase in RGS9‐2 in the DRM of Tor1a +/− striatum (Fig 2C2; Tor1a +/+ 1.000 ± 0.108 N = 7; Tor1a +/− 1.572 ± 0.234 N = 6; t‐test P = 0.0396). This observation may explain the reduced RGS9‐2 level in striatal lysates in the absence of changes in protein stability, suggesting an increased compartmentalization of the protein in the DRM. Indeed, the level of the RGS9‐2 binding partner R7BP, a small SNARE‐like membrane anchor which determines RGS plasma membrane localization (Drenan et al, 2006; Song et al, 2006; Anderson et al, 2007b), was increased in the Tor1a +/− striatum DRM with respect to control mice (Fig 2C3; Tor1a +/+ 1.000 ± 0.050 N = 6, Tor1a +/− 1.526 ± 0.079 N = 6; t‐test P = 0.0002). Conversely, the level of Gβ5 subunit, which is constitutively associated with R7 RGS proteins (Masuho et al, 2011), was found unaltered in the DRM (Fig 2C4; Tor1a +/+ 1.000 ± 0.059 N = 9, Tor1a +/− 1.021 ± 0.089 N = 9; t‐test P = 0.8461).
DRD2 downregulation is mediated by endolysosomal trafficking and mimicked by RGS9‐2 silencing
Our experiments provide evidence of normal DRD2 mRNA levels (Fig EV1), on one hand, but reduced protein stability and levels, on the other. We therefore investigated the pathway of protein quality control targeting plasma membrane proteins to endocytic trafficking and lysosomal degradation (MacGurn, 2014).
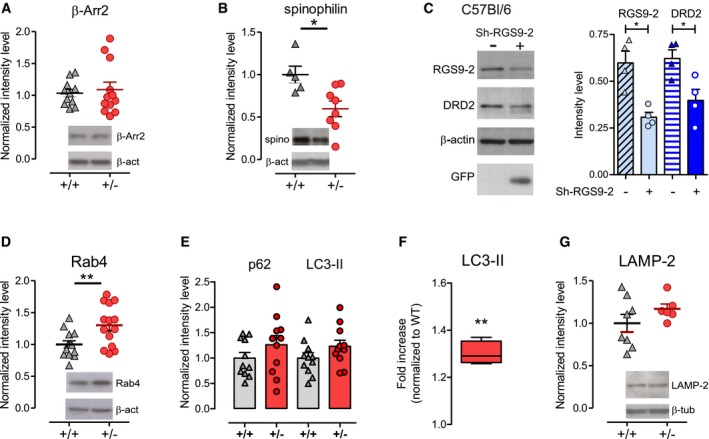
At membrane level, the reciprocal interactions of GPCRs with spinophilin and arrestin represent a regulatory mechanism for fine‐tuning receptor‐mediated signaling (Wang et al, 2004). β‐Arrestin 2 (β‐Arr2) is involved in internalization and G protein‐independent signaling of DRD2 (Beaulieu et al, 2005), while spinophilin interacts with DRD2 and antagonizes arrestin actions (Smith et al, 1999; Wang et al, 2004). WB quantification of β‐Arr2 showed no significant differences in lysates from Tor1a +/+ and Tor1a +/− striata (Fig 3A; Tor1a +/+ 1.033 ± 0.059 N = 11; Tor1a+/− 1.088 ± 0.119 N = 12; t‐test P = 0.6796). Conversely, the level of spinophilin was significantly reduced in Tor1a +/− striatum (Fig 3B; Tor1a +/+ 1.000 ± 0.010 N = 5; Tor1a +/− 0.597 ± 0.091 N = 8; t‐test P = 0.0151), suggesting an imbalance in β‐Arr2‐mediated actions that may favor DRD2 removal from the plasma membrane. Of note, β‐Arr2 co‐immunoprecipitates with RGS9‐2 (Zheng et al, 2011) and RGS9‐2 inhibits DRD2 internalization (Celver et al, 2010). Thus, we asked whether changes in RGS9‐2 content would affect DRD2 level. To address this issue, we silenced RGS9‐2 in wild‐type mouse dorsal striatum. ShRNA‐mediated downregulation of RGS9‐2 caused a decrease in striatal DRD2 protein level with respect to the sham contralateral striatum (Fig 3C; RGS9‐2: sham 0.598 ± 0.063, sh‐RGS9‐2 0.308 ± 0.026, N = 4, paired t‐test P = 0.0100; DRD2: sham 0.622 ± 0.046, sh‐RGS9‐2 0.398 ± 0.059, N = 4; paired t‐test P = 0.0432), suggesting that RGS9‐2‐DRD2 interaction prevents β‐Arr2‐mediated constitutive recycling and downregulation of the receptor. Indeed, DRD2 constitutive recycling through Rab4‐expressing endosomes serves as a quality control system, by sorting receptors toward either the plasma membrane or degradation pathways (Li et al, 2012). In line with our hypothesis, we found an increased level of Rab4 in Tor1a +/− striatal samples (Fig 3D Tor1a +/+ 1.000 ± 0.058 N = 13; Tor1a +/− 1.301 ± 0.087 N = 14; t‐test P = 0.0087).
Figure 3. DRD2 downregulation is mediated by enhanced degradative trafficking and mimicked by RGS9‐2 silencing.
-
A, B(A) The level of β‐arrestin 2 (β‐Arr2) is not altered (Tor1a +/+ N = 11, Tor1a +/− N = 12, t‐test P = 0.6796), whereas the level of spinophilin (B) is decreased (Tor1a +/+ N = 5, Tor1a +/− N = 8, t‐test *P = 0.0151).
-
CA Sh‐RGS9‐2‐GFP viral preparation injected into the right striatum (+) of C57BL/6 mice effectively reduces both RGS9‐2 and DRD2 protein levels, with respect to the contralateral striatum (−).The summary plot reports mean ± SEM values (RGS9‐2: N = 4, paired t‐test *P = 0.0100; DRD2: N = 4, paired t‐test *P = 0.0432).
-
DThe endosomal marker Rab4 is upregulated in the Tor1a +/− striatum (Tor1a +/+ N = 13, Tor1a +/− N = 14, t‐test **P = 0.0087).
-
EBasal levels of markers of the degradative pathway, p62 and LC3‐II, show a trend toward upregulation in Tor1a +/− striatal lysates (p62: Tor1a +/+ N = 11, Tor1a +/− N = 11, t‐test P = 0.2292; LC3‐II: Tor1a +/− N = 9, Tor1a +/− N = 11, t‐test P = 0.1574).
-
FTreatment with bafilomycin A1 (BafA1) induces a significantly more pronounced increase in LC3‐II in Tor1a +/− than in wild‐type dorsal striatum slices. BafA1‐induced increase in LC3‐II level measured in Tor1a +/− slices was normalized to the increase observed in the Tor1a +/+ samples of the same experiment (N = 4, one‐sample t‐test **P = 0.0012). The bottom and top edges of the box indicate the 25th and 75th percentiles, respectively; the line indicates the median value; and the whiskers indicate the minimum and maximum values.
-
GLAMP‐2, a lysosomal marker, shows a trend for upregulation (Tor1a +/+ N = 8; Tor1a +/− N = 6, t‐test P = 0.2232).
The autophagy–lysosomal pathway operates constitutively at low rate and exerts a key role in quality control and turnover of long‐lived proteins (Hara et al, 2006; Komatsu & Ichimura, 2010). The ubiquitin‐ and LC3‐binding protein p62 (also known as SQSTM1) links targeted proteins to the microtubule‐associated protein light chain 3 (LC3), an ubiquitin‐like modifier that, in its lipidated form LC3‐II, plays crucial roles in the formation of autophagosomes (Bjørkøy et al, 2005; Tanida et al, 2005). We thus measured striatal levels of p62 and LC3‐II to monitor this pathway, and observed a nearly 25% increase, though not statistically significant, of both proteins in Tor1a +/− mice (Fig 3E; p62: Tor1a +/+ 1.000 ± 0.111 N = 11, Tor1a+/− 1.263 ± 0.180 N = 11, t‐test P = 0.2292; LC3‐II: Tor1a+/− 1.100 ± 0.100 N = 9, Tor1a +/− 1.233 ± 0.118 N = 11, t‐test P = 0.1574). We therefore utilized bafilomycin A1, a blocker of the autophagosome–lysosome fusion and acidification, in order to prevent LC3‐II degradation into autophagolysosomes. In this experimental condition, a more pronounced increase in LC3‐II level is observed in Tor1a +/− with respect to wild‐type striatum (Fig 3F; Tor1a +/− 1.303 ± 0.025 N = 4; one‐sample t‐test P = 0.0012), indicating an increased lysosomal turnover of the autophagosomal marker LC3‐II (Tanida et al, 2008). Then, to measure the number of lysosomes in Tor1a+/− striatum, we used the marker lysosome‐associated membrane protein‐2 (LAMP‐2; Eskelinen, 2006). WB of dorsal striatum lysates showed a trend for an increase in LAMP‐2 levels in mutant mice (Fig 3G; Tor1a +/+1.000 ± 0.104 N = 8; Tor1a +/− 1.168 ± 0.058 N = 6; t‐test P = 0.2232). Overall, these data indicate a selective enhancement of the endosomal trafficking and lysosomal‐mediated degradation of DRD2 in the Tor1a +/− striatum.
The autophagy–lysosomal pathway is upregulated in striatal DRD2‐expressing cholinergic interneurons
Our previous work consistently demonstrated electrophysiological alterations of DRD2 in the population of striatal cholinergic interneurons (ChIs) in multiple DYT1 dystonia models (Pisani et al, 2006; Sciamanna et al, 2011, 2012a; Martella et al, 2014). We therefore wondered whether increased receptor turnover could be responsible for the observed DRD2 dysfunction in DYT1 ChIs. Indeed, we observed a significant enhancement of p62 signal in ChIs, identified by choline acetyltransferase (ChAT) immunolabeling in Tor1a +/− striatal sections (Fig 4A1–A3; Tor1a +/+ 1.000 ± 0.086 n = 20 cells, N = 6 mice; Tor1a +/− 1.648 ± 0.120 n = 20 cells, N = 6 mice; t‐test P = 0.00008).
Figure 4. Increased p62 immunolabeling in striatal ChIs.
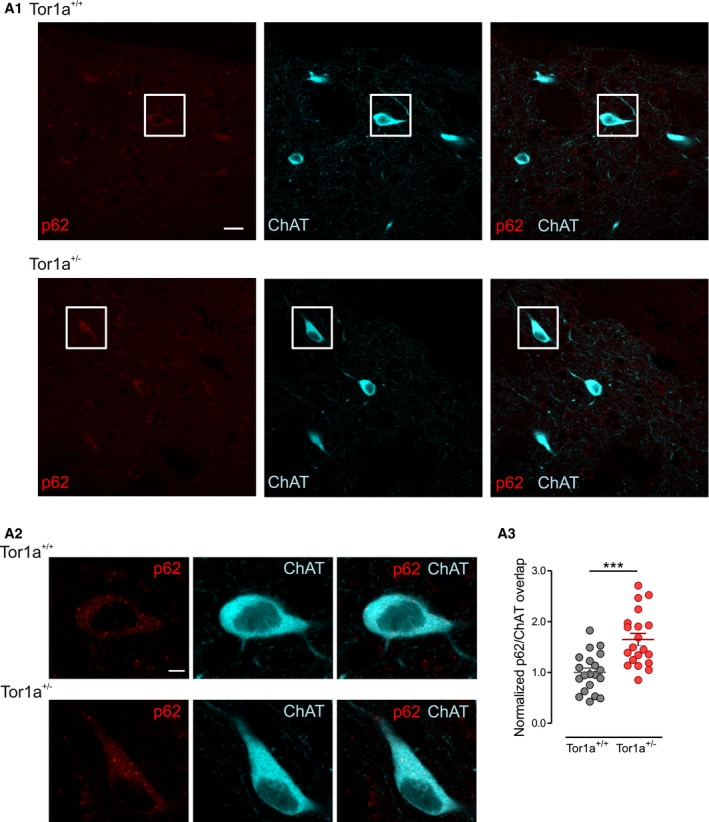
Representative double‐immunofluorescence confocal images of coronal sections of the dorsal striatum showing p62 immunolabeling (red) in choline acetyltransferase (ChAT)‐positive (cyano) ChIs of Tor1a +/+ and Tor1a +/− mice. (A1) Two representative ChIs identified by the white box in the low‐magnification images (scale bar = 20 μm) are shown at higher magnification in (A2) (scale bar = 5 μm). (A3) The graph reporting mean ± SEM values of p62/ChAT signal overlap in ChIs, normalized to Tor1a +/+ values of the same experiment, shows a significant increase in p62 in Tor1a +/− neurons (Tor1a +/+ n = 20 cells, N = 6 mice; Tor1a +/− n = 20 cells, N = 6 mice, t‐test ***P = 0.00008).
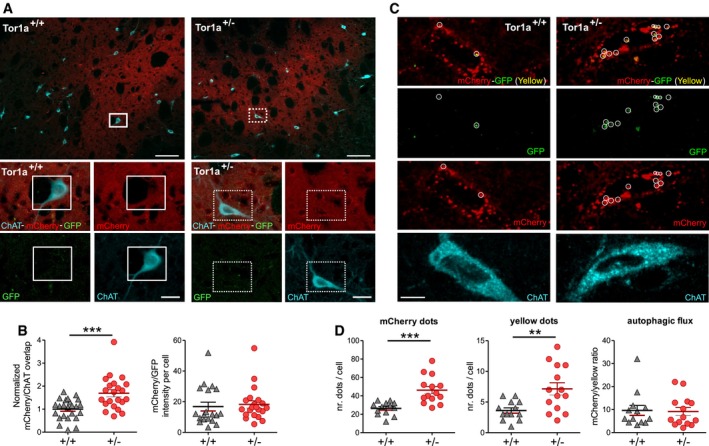
Next, in order to measure autophagy flux in vivo, specifically in ChIs, we utilized as a reporter an adeno‐associated virus carrying a monomeric tandem mCherry‐GFP‐LC3 construct (AAV2/9‐mCherry‐GFP‐LC3; Castillo et al, 2013). The GFP fluorescent signal of the reporter is sensitive to acidic conditions; thus, co‐localization of green and red fluorescence (yellow puncta) indicates that the tandem protein is not localized in compartments fused with a lysosome, while detection of red puncta indicates that the protein is located in the autophagolysosome (Matus et al, 2014). Figure 5A shows representative images of successful viral transduction of the dorsal striatum of control and Tor1a +/− mice, 4 weeks after stereotactic delivery of AAV2/9‐mCherry‐GFP‐LC3. Quantification of the mCherry/ChAT co‐localization demonstrated a significant increase in mCherry signal in ChIs from Tor1a +/− mice (Fig 5B; Tor1a +/+ 1.00 ± 0.09 n = 24 cells, N = 8 mice; Tor1a +/− 1.69 ± 0.15 n = 22 cells, N = 8 mice; t‐test P = 0.0005). The ratio of mCherry/GFP fluorescence per cell area, measuring LC3 flux, was unchanged (Fig 5B; Tor1a +/+ 16.85 ± 2.89 n = 19 cells; Tor1a +/− 18.27 ± 2.37 n = 21 cells; Mann–Whitney test P = 0.2334). Then, we quantified red and yellow dots in ChAT‐positive neurons and found a significant increase in both mCherry dots (Fig 5C and D; Tor1a +/+ 26.38 ± 1.95 dots/cell n = 13 cells, Tor1a +/− 46.21 ± 3.98 dots/cell n = 14 cells; N = 5 mice/genotype; t‐test P = 0.0003) and yellow puncta (Fig 5B and C; Tor1a +/+ 3.62 ± 0.43 dots/cell, n = 13 cells, Tor1a +/− 7.14 ± 0.99 dots/cell, n = 14 cells; N = 5 mice/genotype; t‐test P = 0.0048) in ChIs from Tor1a +/− mice, indicating an increase in LC3 in all the compartments of the autophagy–lysosomal pathway. Indeed, measurement of the mCherry/yellow ratio indicated that the autophagic flux was not altered (Fig 5D; Tor1a +/+ 9.65 ± 2.16 dots/cell, n = 13 cells; Tor1a +/− 9.14 ± 1.75 dots/cell, n = 14 cells; N = 5 mice/genotype; Mann–Whitney test P = 0.8842).
Figure 5. The AAV2/9‐mCherry‐GFP‐LC3 reporter indicates upregulation of the autophagy pathway in ChIs.
-
ATop: Low‐magnification merged confocal images of coronal striatal sections showing ChAT‐labeled (cyano) ChIs in the area of mCherry fluorescence (red) indicating viral infection. Scale bar = 100 μm. Bottom: Higher magnification images of the ChIs identified by the white box in the upper images show viral‐induced expression of mCherry and GFP signal. Scale bar = 20 μm.
-
BThe mCherry/ChAT overlap is increased in ChIs from Tor1a +/− mice (Tor1a +/+ n = 24 cells, Tor1a +/− n = 22 cells, N = 8 mice/genotype, t‐test ***P = 0.0005), but the mCherry/GFP fluorescence ratio indicated that the LC3 flux was unchanged (Tor1a +/+ n = 19 cells, Tor1a +/− n = 21 cells, N = 8 mice/genotype, Mann–Whitney test P = 0.2334).
-
C, D(C) Merged and split channel confocal images (scale bar = 10 μm) of representative Tor1a +/+ and Tor1a +/− ChIs showing red dots and yellow puncta (indicated by white circles), quantified in (D): red dots: Tor1a +/+ n = 13 cells, Tor1a +/− n = 14 cells, t‐test ***P = 0.0003; yellow dots: Tor1a +/+ n = 13 cells, Tor1a +/− n = 14 cells, t‐test **P = 0.0048, N = 5 mice/genotype. Measurement of the mCherry/yellow dots ratio indicated that the autophagic flux was not altered (Tor1a +/+ n = 13 cells; Tor1a +/− n = 14 cells, Mann–Whitney test P = 0.8842).
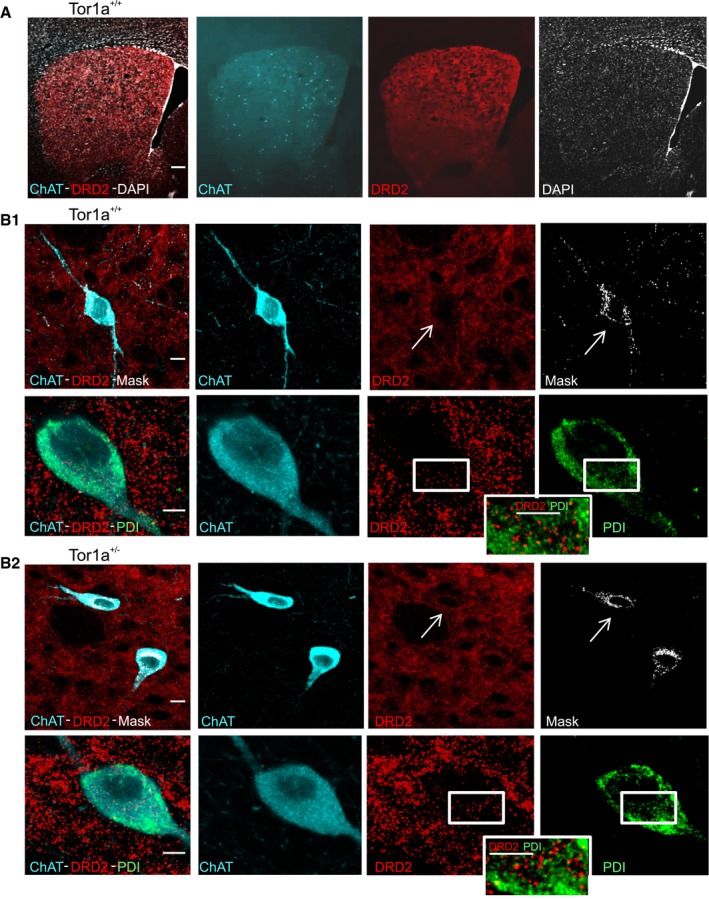
Immunoblotting and immunohistochemical data jointly suggest an increased trafficking of DRD2 from the plasma membrane to the endolysosomal pathway, causing its downregulation. Nevertheless, reduced torsinA levels in DYT1 mice may cause DRD2 retention into the endoplasmic reticulum (ER), where torsinA resides (Cascalho et al, 2017) and may influence receptor protein maturation and export processes. However, our confocal microscopy analysis (Fig 6A, B1 and B2) seems to rule out this possibility, as we did not observe co‐localization of DRD2 with the ER marker protein disulfide isomerase (PDI; Fig 6B1 and B2).
Figure 6. Subcellular localization of DRD2 in striatal ChIs.
-
ALow‐magnification merged and split channel confocal images of striatal sections showing immunolabeling for ChAT (cyano), DRD2 (red), and the nuclear stain DAPI (white). Scale bar = 200 μm.
-
BTop: Representative ChAT‐positive (cyano) cholinergic interneurons, labeled for DRD2 (red), from a Tor1a +/+ (B1) or Tor1a +/− (B2) striatal section. The co‐localization mask of the two signals is shown in white (right). Arrows indicate the interneuron identified by ChAT immunolabeling. Scale bar = 10 μm. Bottom: Higher magnification images (scale bar = 5 μm) of representative Tor1a +/+ (B1) and Tor1a +/− (B2) ChIs showing the lack of co‐localization of DRD2 with the ER marker PDI (green). A detail at higher magnification is shown in the insets.
Restoration of RGS9‐2 protein levels rescues DRD2 level and function
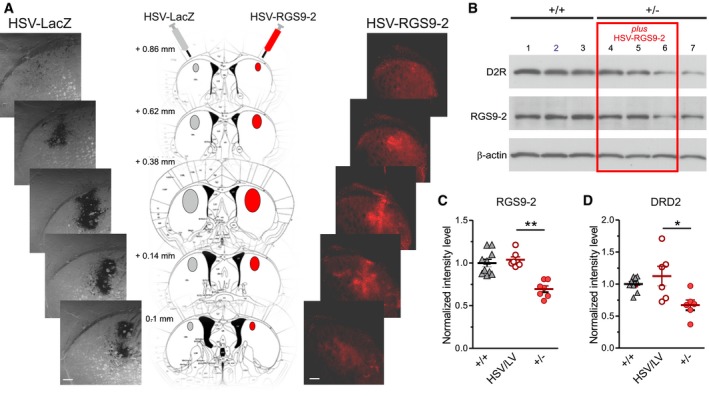
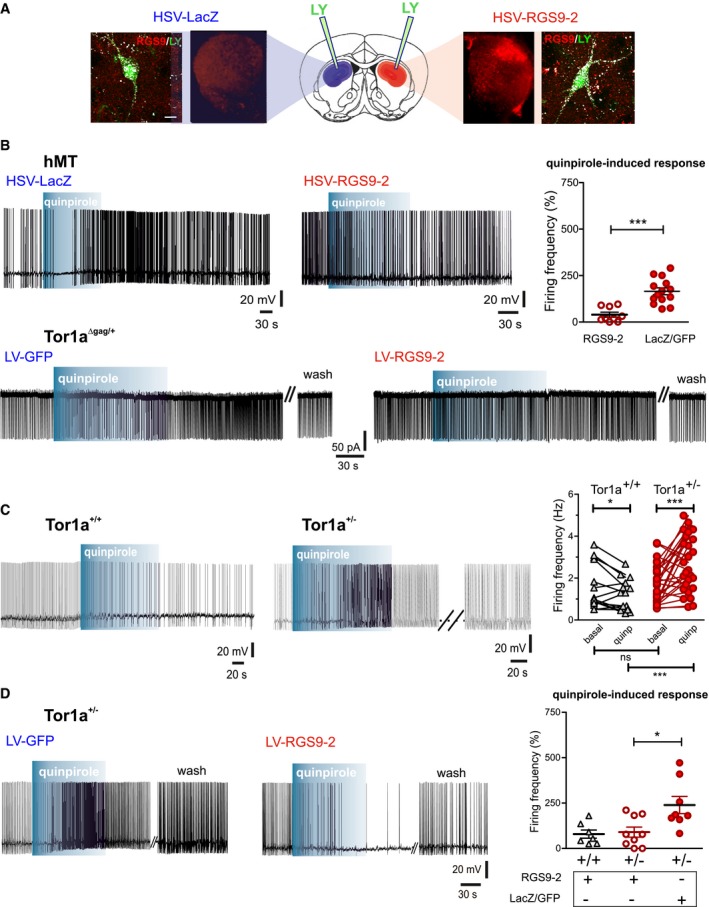
Our gene interference experiments showed that viral‐mediated downregulation of RGS9‐2 causes a reduction in striatal DRD2 protein level in wild‐type mice. We therefore asked whether, by increasing RGS9‐2 protein amount, we could rescue DRD2 level in the DYT1 mouse striatum. We thus injected into the dorsal striatum of Tor1a +/− mice either a herpesvirus (HSV‐RGS9‐2; Gold et al, 2007) or a lentivirus (LV‐RGS9‐2) both carrying the RGS9‐2 construct, while the contralateral striatum was injected with the respective sham vectors (HSV‐LacZ or LV‐GFP, respectively; Fig 7A). The two different vectors were chosen because the HSV‐mediated transduction is transient and RGS9‐2 shows a peak of expression at 3–5 days after injection, whereas the LV‐induced maximal expression is reached more slowly (3 weeks) but is stable over time (Mandolesi et al, 2009; Sciamanna et al, 2012b). Both HSV‐RGS9‐2 and LV‐RGS9‐2 delivery rescued RGS9‐2 content in Tor1a +/− striatum to control level (Fig 7B and C; Tor1a +/+: 1.000 ± 0.044 N = 10; Tor1a +/−: HSV/LV‐RGS9‐2‐injected striatum 1.038 ± 0.033 N = 7; Tor1a +/− contralateral striatum 0.696 ±0.037 N = 7; Tor1a +/− injected vs. contralateral: paired t‐test P = 0.0011). Notably, Tor1a +/− striata showing a restoration of RGS9‐2 level (Fig 7B, lanes 4 and 5), indicating a successful infection, also showed a complete rescue of DRD2 level (Fig 7B and D; Tor1a +/+: 1.000 ± 0.038 N = 9, Tor1a +/−: HSV/LV‐RGS9‐2‐injected 1.124 ± 0.153 N = 6; Tor1a +/−: contralateral striatum 0.671 ± 0.079 N = 6; Tor1a +/− injected vs. contralateral: paired t‐test P = 0.0380). Finally, in order to obtain a functional rescue, we tested the electrophysiological responses to DRD2 activation after restoration of RGS9‐2 content. Indeed, though most DYT1 rodent models do not express an overt motor phenotype, they however share a common electrophysiological alteration consisting in an aberrant excitatory response of striatal ChIs to DRD2 activation, instead of the physiological inhibition recorded in wild‐type littermates (Pisani et al, 2006; Sciamanna et al, 2011, 2012a; Martella et al, 2014). We therefore performed patch‐clamp recordings from ChIs of different DYT1 mouse models in the area of viral transduction, as confirmed by post‐recording immunohistochemistry (Fig 8A), either 3–5 days or 3 weeks after injection of HSV‐RGS9‐2 or LV‐RGS9‐2, respectively. Initially, we analyzed the effect of HSV/LV‐RGS9‐2 in two DYT1 mouse models where we had consistently reported an abnormal excitatory response of striatal ChIs to the DRD2 agonist quinpirole (10 μM, 2 min), transgenic hMT mice (N = 6), and knock‐in Tor1a Δgag/+ (N = 3; Pisani et al, 2006; Sciamanna et al, 2011; Martella et al, 2014). As shown in Fig 8A, HSV/LV‐RGS9‐2 infection restored a physiological effect of quinpirole, consisting in a reduction of action potential firing frequency, with respect to the contralateral striatum, both in Tor1a Δgag/+ mice (LV‐GFP 199.0 ± 75.88% of basal frequency, n = 7; LV‐RGS9‐2 112.5 ± 13.52% of basal frequency, n = 4; t‐test P = 0.3048) and in transgenic hMT mice (Fig. 8B; HSV‐LacZ 165.60 ± 18.25% of basal frequency, n = 14; HSV‐RGS9‐2 39.49 ± 13.10% of basal frequency, n = 9; t‐test P < 0.0001).
Figure 7. In vivo viral‐mediated delivery of RGS9‐2 into Tor1a +/− dorsal striatum rescues DRD2 protein level.
-
AMiddle: Graphic reconstruction of an anteroposterior sequence of coronal sections of mouse striatum, reporting the coordinates relative to Bregma. HSV‐LacZ (left, gray) and HSV‐RGS9‐2 (right, red) were injected into the left and right striata, respectively, and mice sacrificed after 3–5 days. Left: Serial confocal images showing the extent of viral infection, as indicated by the robust dark β‐gal staining. Right: The RGS9‐2 immunolabeling (red) is particularly intense near the injection site, indicating enhanced protein expression with respect to the endogenous level. Scale bar = 200 μm.
-
BA representative WB shows correlated viral‐mediated increases in RGS9‐2 and DRD2 protein levels in Tor1a +/− dorsal striata (lanes 4 and 5), while in a sample where RGS9‐2 level was not increased by viral infection (lane 6), DRD2 level remained low as in the sham‐injected striatum (lane 7).
-
C, DThe summary plots report mean ± SEM values of the ratio of protein vs. loading control intensity level measured from the injected (HSV/LV) or sham contralateral Tor1a +/− (+/−) striata, normalized to the Tor1a +/+ (+/+) samples of the same experiment. (C) RGS9‐2: Tor1a +/+ (N = 10); Tor1a +/− injected (N = 7) vs. contralateral (N = 7): paired t‐test **P = 0.0011; (D) DRD2: Tor1a +/+ (N = 9); Tor1a +/− injected (N = 6) vs. contralateral (N = 6): paired t‐test *P = 0.0380.
Source data are available online for this figure.
Figure 8. RGS9‐2 rescues DRD2 function in striatal ChIs.
-
AAs depicted in the cartoon and shown by representative confocal images, patch‐clamp recordings were performed in the dorsal striatum, in the area of HSV‐LacZ (blue, left) and HSV‐RGS9‐2 (red, right) viral infection, the latter showing an increased RGS9‐2 immunolabeling with respect to the sham contralateral striatum of the same mouse. Representative confocal images at higher magnification show co‐localization of RGS9‐2 immunolabeling with Lucifer Yellow (LY) fluorescence in two ChIs loaded intracellularly with LY during whole‐cell recordings in the infected area. Scale bar = 10 μm.
-
BRepresentative patch‐clamp recordings of ChIs from hMT (top, perforated configuration) and Tor1a Δgag/+ (bottom, cell‐attached configuration) mice, showing that viral‐mediated delivery of RGS9‐2 rescues the physiological response to the DRD2 agonist quinpirole (10 μM, 2 min). The dot plot reports the firing frequency changes induced by quinpirole in hMT striata (N = 6, HSV‐RGS9‐2 n = 9, HSV‐LacZ n = 14, t‐test ***P < 0.0001).
-
CRepresentative traces show a typical response of Tor1a +/+ ChIs to quinpirole, characterized by a reduction in the frequency of the ongoing firing activity of the cell, as opposed to an aberrant increase in firing frequency in Tor1a +/− ChIs, quantified in the plot (right, Tor1a +/+ N = 6, n = 14; Tor1a +/− N = 10, n = 27; Tor1a +/+ vs. Tor1a +/− in quinpirole t‐test ***P = 0.0005; Tor1a +/− basal vs. quinpirole paired t‐test ***P = 0.0009).
-
DLV‐mediated delivery of RGS9‐2 rescues the physiological response to quinpirole in Tor1a +/− slices. Dot plot reporting firing frequency changes induced by quinpirole in Tor1a +/+ (N = 3) and Tor1a +/− (N = 6) striatal ChIs infected with LV/HSV‐RGS9‐2 or control LV‐GFP and HSV‐LacZ ChIs (Tor1a +/+ RGS9‐2 n = 7; Tor1a +/− RGS9‐2 n = 9; Tor1a +/− LacZ/GFP n = 8; Tor1a +/−: LacZ/GFP vs. RGS9‐2 t‐test *P = 0.0136). Mean ± SEM is represented.
We now show that an abnormal excitatory response to DRD2 activation is observed also in ChIs from Tor1a +/− mice (Fig 8C; Tor1a +/+: basal 1.589 ± 0.2901 Hz, in quinpirole 1.232 ± 0.2023 Hz, N = 6, n = 14, paired t‐test P = 0.0395; Tor1a +/−: 1.739 ± 0.1801 Hz, in quinpirole 2.702 ± 0.2567, N = 10, n = 27, paired t‐test P = 0.0009). Expectedly, ChIs recorded from the sham‐injected contralateral striatum of Tor1a +/− mice still showed an aberrant excitatory response to quinpirole. Conversely, neurons recorded from slices of HSV‐ and LV‐RGS9‐2‐infected Tor1a +/− (N = 6) striata showed a recovery of the physiological inhibitory response to DRD2 activation (Fig 8D; LacZ/GFP: 239.30 ± 47.33% of basal frequency, n = 8; RGS9‐2: 90.19 ± 27.75% of basal frequency, n = 9; t‐test P = 0.0136). In ChIs from Tor1a +/+ mice (N = 3), we did not observe significant effects of RGS9‐2 overexpression on DRD2 function (Fig 8D; 79.08 ± 22.40% of basal frequency, n = 7).
In conclusion, viral vector‐mediated restoration of striatal RGS9–2 content is effective in rescuing DRD2 protein expression and function in different mouse models of DYT1 dystonia.
Discussion
GPCRs are central mediators of neurotransmission and are proven therapeutic targets for disease (Hauser et al, 2017). The mechanisms by which cells control GPCR trafficking and signaling are therefore topics of intensive study, and a large number of interacting pathways and partners have been uncovered. However, it is also clear that these do not yet represent the full picture of GPCR regulation. This also includes our relatively weak understanding of how the striatal D2DR is regulated, despite the fact that this receptor is central to movement control and its dysfunction is a key event in the pathogenesis of several neurological and psychiatric diseases.
DYT1 dystonia is an incurable movement disorder, strongly associated with abnormal striatal dopaminergic responses, but its symptoms are nonresponsive to dopaminergic drugs. We show in vivo that: In wild‐type striatum, changes in DRD2 and RGS9‐2 levels are correlated during postnatal development, and RGS9‐2 silencing causes DRD2 downregulation; in DYT1 striatum: (i) DRD2 downregulation is determined by an altered receptor stability and mediated by lysosomal degradation; (ii) accordingly, changes in endosomal and autophagy–lysosomal markers support an enhanced DRD2 trafficking through the degradative pathway; (iii) reduced spinophilin and RGS9‐2 levels favor β‐Arr2‐mediated actions; (iv) hence, RGS9‐2 upregulation rescues DRD2 level and function.
Our data demonstrate in wild‐type striatum a parallel increase in DRD2 and RGS9‐2 protein level during postnatal development, further pointing to their close functional relationship. Though in Tor1a +/− mice the two proteins undergo a similar increase during early postnatal development (P7–P21), however, both exhibit a simultaneous abrupt reduction at P60. Notably, the comparable reduction of DRD2 and RGS9‐2 observed in the striatum of Tor1a +/− and Tor1a Δgag/+ mice strongly suggests that these alterations are caused by torsinA loss of function (Torres et al, 2004; Goodchild et al, 2005). Indeed, we found similarly reduced torsinA levels in P60 Tor1a +/− and Tor1a Δgag/+ striatum, in accordance with the notion that the Δgag mutation destabilizes torsinA protein (Giles et al, 2008).
Surprisingly, our data demonstrate that different mechanisms underlie the similar reduction of DRD2 and RGS9‐2 levels. Wild‐type DRD2 is a stable long‐lived protein, whereas RGS9‐2 possesses specific degradation determinants targeting the protein for constitutive lysosomal breakdown (Hara et al, 2006). In Tor1a +/− mice, we found a decreased DRD2 protein half‐life, whereas the sensitivity of RGS9‐2 protein to lysosomal degradation was unaffected. Indeed, our data show that the reduction of RGS9‐2 level in mutant mice is attributable to an enhanced localization to the DRM, in line with the increased level of its specific membrane anchor R7BP. The observation that striatal levels of a different R7 RGS family member, RGS7, and of the RGS9‐2 binding partner Gβ5 are unaffected further rules out a generalized dysregulation of protein turnover in DYT1 striatum.
Functional or structural modifications may cause a selective reduction of DRD2 protein stability in Tor1a +/− mice. Integral membrane proteins with limited structural/conformational defects, such as an altered post‐translational modification, may escape the ER and reach the plasma membrane. This seems to be the case of DRD2 in Tor1a +/− striatum, since our confocal analysis shows the absence of co‐localization of DRD2 and PDI signals. Commonly, these proteins are in turn identified and targeted for lysosomal proteolysis by the quality control system (Tansky et al, 2007; Apaja et al, 2010). Interestingly, modifications at the N‐terminal or C‐terminal regions of DRD2, altering the level of post‐translational modifications, extensively affect receptor internalization rate, plasma membrane expression, and protein stability (Cho et al, 2012; Ebersole et al, 2015). Alternatively, a failure in the developmental switch from the hypersensitive “juvenile” activity to the mature state of reduced sensitivity (Kim et al, 2002; McDougall et al, 2015) may cause an increased rate of desensitization of DRD2 through the endocytic‐degradative pathway after P21. The increase in Rab4 protein level observed in Tor1a +/− striatum is indeed suggestive of an accelerated trafficking of the receptor through the constitutive recycling pathway, which acts as a quality control system, to redirect internalized receptors toward either the plasma membrane or the degradation pathways (Apaja et al, 2010; Li et al, 2012). Endosomal recycling depends on arrestin‐dependent receptor endocytosis from the plasma membrane (Kim et al, 2001; Zheng et al, 2016). Though we did not observe changes in the level of β‐Arr2 in Tor1a +/− striatum, we found a significant decrease in spinophilin, a scaffolding protein known to interact with DRD2 (Smith et al, 1999) and to antagonize β‐Arr2‐dependent signaling and trafficking of GPCRs (Wang et al, 2004). Thus, spinophilin downregulation would favor β‐Arr2‐dependent internalization and signaling of DRD2 in Tor1a +/− striatum. Further, the observation that RGS9‐2 co‐immunoprecipitates with β‐Arr2 and inhibits DRD2 internalization in vitro indicates antagonistic actions between RGS9‐2 and β‐Arr2 as well (Celver et al, 2010; Zheng et al, 2011). Our in vivo data strongly support this notion. Indeed, we demonstrate that RGS9‐2 silencing causes DRD2 downregulation in wild‐type striatum, while restoration of striatal RGS9–2 level in Tor1a +/− and Tor1a Δgag/+ striatum rescues both protein expression and signaling of the receptor.
Thus, we hypothesize that a genetic modification resulting in torsinA loss of function might alter DRD2 maturation in the ER, causing disruption of the receptor signaling complex at the plasma membrane. The ensuing increased interaction of the receptor with β‐Arr2 in turn leads to an increased DRD2 internalization rate, redirecting receptor either to a variety of alternative signaling pathways (Beaulieu & Gainetdinov, 2011) or to degradation. In support of this view, uncoupling of DRD2 from its cognate G‐proteins has been reported in a DYT1 mouse model (Napolitano et al, 2010). Our autoradiography data showing a 15% reduction of DRD2 binding density in Tor1a +/− striatal sections are in striking resemblance with DRD2 binding reduction reported in caudate and putamen of DYT1 mutation carriers (Asanuma et al, 2005) and support the hypothesis of an enhanced degradation of the receptor, in accordance with previous data from different DYT1 dystonia models (Yokoi et al, 2011; Dang et al, 2012). This hypothesis is further supported by our confocal microscopy analysis, ruling out DRD2 retention into the ER, and by immunoblotting experiments showing an increase in markers of the autophagy–lysosomal pathway, which operates constitutively at low rate to ensure quality control and turnover of long‐lived proteins (Hara et al, 2006; Komatsu & Ichimura, 2010; Johansen & Lamark, 2011; Lilienbaum, 2013). In particular, we observed an increased lysosomal turnover of LC3‐II (Tanida et al, 2005) in Tor1a +/− striatum. The observation that changes in basal LC3‐II, p62, and LAMP‐2 levels did not reach statistical significance rules out an overt dysregulation of autophagy and supports a more confined impairment involving targeting of DRD2 to degradation. In line with this view, the mCherry‐GFP‐LC3 reporter (Castillo et al, 2013) was increased both in the autolysosomes and in other compartments of ChIs (Matus et al, 2014).
Our findings may explain why, despite a clear DRD2 involvement, dopaminergic drugs do not provide clinical benefit in DYT1 dystonia. Furthermore, they suggest that strategies targeting β‐Arr2‐biased signaling or DRD2 interacting proteins, like RGS9‐2, can effectively rescue striatal DRD2 function.
Alterations of DRD2‐mediated dopaminergic transmission have been implicated in different neurologic and neuropsychiatric disorders. Interestingly, the clinical efficacy of antipsychotics and mood‐stabilizing drugs has been ascribed to blockade of β‐Arr2‐biased signaling of DRD2 (Peterson & Luttrell, 2017). Furthermore, a recent study demonstrated an ameliorating effect of β‐Arr2 upregulation on levodopa‐induced dyskinesia in pre‐clinical animal models (Urs et al, 2015). On the other hand, manipulation of RGS9‐2 levels in animal models of levodopa‐induced or tardive dyskinesia was shown to affect the manifestation of these abnormal movements (Kovoor et al, 2005; Gold et al, 2007).
With such premises, β‐Arr2 and RGS9‐2, as well as DRD2‐biased drugs, have been proposed as drug targets (Traynor et al, 2009; Peterson & Luttrell, 2017; Urs et al, 2015; Sjögren, 2017). Accordingly, RGS9 has now been added to the IUPHAR/BPS Guide to Pharmacology database of drug targets. Such novel therapeutic approaches hold great promise for an effective treatment of DYT1 dystonia.
Materials and Methods
Animal model and tissue preparation
C57BL/6, Tor1a +/−, Tor1a ∆gag/+ (Goodchild et al, 2005), and hMT (Sciamanna et al, 2012b) mouse strains were bred at Fondazione Santa Lucia Animal Facility. Mice were housed under a controlled 12‐h light/12‐h dark cycle and with free access to food and water. DNA was isolated and amplified from 1‐ to 2‐mm tail fragments with the Extract‐N‐Amp Tissue polymerase chain reaction (PCR) kit (XNAT2 kit; Sigma‐Aldrich), and genotyping performed as previously described (Sciamanna et al, 2012b; Ponterio et al, 2018). Mice were sacrificed by cervical dislocation and brains quickly removed from the skull. Preparation of corticostriatal slices was carried out as previously described (Sciamanna et al, 2011, 2012b; Ponterio et al, 2018). Briefly, coronal slices (210 μm) were cut with a vibratome in oxygenated Krebs’ solution (in mM): 126 NaCl, 2.5 KCl, 1.3 MgCl2, 1.2 NaH2PO4, 2.4 CaCl2, 10 glucose, 18 NaHCO3). After 30‐min recovery, a single slice was transferred to the recording chamber, on the stage of an upright microscope (BX51WI, Olympus), submerged in continuously flowing oxygenated (95% O2/5% CO2) Krebs’ solution (2.5–3 ml/min). ChIs were visualized by means of IR‐DIC videomicroscopy (C6790 CCD, Hamamatsu).
Experimental design
Age‐ and sex‐matched wild‐type and mutant mice were randomly allocated to experimental groups and processed by a blinded investigator. Sample size for any measurement was based on the ARRIVE recommendations on refinement and reduction of animal use in research, as well as on our previous studies. For data analysis of WB, confocal and binding images, and electrophysiology experiments, the investigator was blinded to genotype/treatment. Each observation was obtained from an independent biological sample. The number of biological replicates is represented with N for number of animals and n for number of cells. For electrophysiology, each cell was recorded from a different brain slice.
Immunoblotting
WB of striatal lysates was performed as previously described (Napolitano et al, 2010). Mouse striata were homogenized in cold buffer: 50 mM Tris–HCl pH 7.4, 150 mM NaCl, 1% Triton X‐100, 0.25% Na deoxycholate, 5 mM MgCl2, 0.1% SDS, 1 mM EDTA, and 1% protease inhibitor cocktail (Sigma‐Aldrich). Samples were sonicated and kept on ice for 1 h. Then, crude lysates were centrifuged (15,600 g, 15 min, 4°C), the supernatant collected, and protein quantified with Bradford assay (Bio‐Rad). Protein extracts (15–30 μg) were loaded with NuPAGE LDS sample buffer (Invitrogen, Life Technologies Italia), containing DTT. Samples were denatured (95°C, 5 min) and loaded onto 8–15% SDS–PAGE gels. Gels were blotted onto 0.45‐μm polyvinylidene fluoride (PVDF) membranes. The following primary antibodies were used (Appendix Table S1): guinea pig anti‐p62 (1:300, GP62‐C; Progen), mouse anti‐LC3 (1:250, 0231‐100; NanoTools), goat anti‐RGS9 (1:1,000, sc‐8142; Santa Cruz), rabbit anti‐DRD2 (1:1,000, AB5084P; Millipore), rabbit anti‐torsinA (1:800, AB34540; Abcam), goat anti‐RGS7 (1:200, sc‐8139; Santa Cruz), rabbit anti‐Gβ5 (1:1,000, 071208; Millipore), goat anti‐R7BP (1:500, sc‐50170; Santa Cruz), rabbit anti‐Rab4 (1:1,000, ab13252; Abcam), rabbit anti‐spinophilin/neurabin‐II (1:3,000, 5162; Sigma‐Aldrich), rat anti‐LAMP‐2 (1:200, GTX13524; Genetex), mouse anti‐β‐arrestin‐2 (1:500, sc‐13140; Santa Cruz), rabbit anti‐GFP (1:200, sc‐8334; Santa Cruz), 1 overnight at 4°C; mouse anti‐β‐actin (1:20,000, A5441; Sigma‐Aldrich), mouse anti‐β‐tubulin (1:20,000, T4026; Sigma‐Aldrich), mouse anti‐PSD‐95 (1:20,000, MAB1598; Millipore), 30–60 min at RT. Anti‐goat, anti‐guinea pig, anti‐mouse, anti‐rat, and anti‐rabbit horseradish peroxidase (HRP)‐conjugated secondary antibodies were used (GE Healthcare). Immunodetection was performed by ECL reagent (GE Healthcare), and membrane was exposed to film (Amersham). Quantification was achieved by ImageJ software (NIH). Detergent‐resistant membrane fractions were prepared according to Celver and coll. (Celver et al, 2012). Treatment of slices with bafilomycin A1 (BafA1, 5 nM, 1 h) was performed as previously described (Dehay et al, 2012). For the protein degradation assay, slices were incubated for 5 h in oxygenated ACSF at 32°C with or without leupeptin (100 μM; Anderson et al, 2007a). After treatments, slices were immediately lysed for immunoblotting, as described. Sample exclusion criteria were loading control signal saturation or high background.
Receptor autoradiography
The radioligand binding protocol has been modified from Fasano et al (2009). Briefly, fresh‐frozen dissected mouse brains were sliced coronally at 16 μm on a cryostat at the level of the caudate–putamen (plate 15–36 of Franklin & Paxinos, 2008). Unfixed slides were preincubated in assay buffer for 60 min [50 mM Tris–Cl (pH 7.4), 120 mM NaCl, 5 mM KCl, 1 mM MgCl2, and 40 nM ketanserin]. Sections were then incubated for 60 min at room temperature in the same buffer with the addition of 5 nM 3H‐spiperone (PerkinElmer, Boston, MA) and 40 nM ketanserin. Cold competition of tritiated spiperone with 10 μM cold spiperone was used to assess nonspecific signal. After ligand binding, slides were rinsed twice for 10 min in the same buffer, allowed to dry, and exposed to Hyperfilm MP film (Merck) for 4 weeks.
Image analysis and quantification
Quantification analyses were performed in blind, and sample identity was not revealed until correlations were completed. Densitometric analyses and ROD measurements were performed as previously described (Pratelli et al, 2017). Briefly, 10 sections per animal along the whole rostro‐caudal extent of the striatum were used. Optical density (OD) was evaluated in the caudate–putamen, and background OD value was determined in structures of the same section devoid of specific signal and subtracted for correction to obtain the relative OD (ROD) value. Results were expressed as percentage increase/decrease in 3H‐spiperone density. Data were analyzed by Student's t‐test.
Confocal imaging
Slices processing and confocal image acquisition were performed as previously described (Vanni et al, 2015; Ponterio et al, 2018). Mice were deeply anesthetized and perfused with cold 4% paraformaldehyde in 0.12 M phosphate buffer (pH 7.4). The striatum was dissected, post‐fixed for at least 3 h at 4°C and equilibrated with 30% sucrose overnight. Coronal striatal sections (30 μm thick) were cut with a freezing microtome. Slices were dehydrated with serial alcohol dilutions (50–70–50%) and then incubated 1 h at RT in 10% donkey serum solution in PBS 0.25%‐Triton X‐100 (PBS‐Tx). The following primary antibodies were utilized (3 days at 4°C; Appendix Table S2): goat anti‐ChAT (1:500, NBPI30052; Novus Biologicals); rabbit anti‐DRD2 (1:500, AB5084P; Millipore); goat anti‐RGS9 (1:1,000, sc‐8142; Santa Cruz), mouse anti‐PDI (1:500, SPA891; StressGene); guinea pig anti‐P62 (1:300, GP62‐C; Progen). The following secondary antibodies were used (1:200, RT, 2 h): Alexa 488 and Alexa 647 (Invitrogen), and cyanine 3 (cy3)‐conjugated secondary antibodies (Jackson ImmunoResearch). After washout, slices were mounted on plus polarized glass slides with Vectashield mounting medium (Super Frost Plus; Thermo Scientific) and coverslipped. Images were acquired with a LSM700 Zeiss confocal laser scanning microscope (Zeiss, Germany), with a 5×, a 20× objective, or a 63× oil immersion lens (1.4 numerical aperture) with an additional digital zoom factor (1×–1.5×–2×). Single‐section images (1,024 × 1,024) or z‐stack projections in the z‐dimension (z‐spacing, 1 μm) were collected. Z‐stack images were acquired to analyze the whole neuronal soma, which spans multiple confocal planes. The confocal pinhole was kept at 1, the gain and the offset were adjusted to prevent saturation of the brightest signal and sequential scanning for each channel was performed. The confocal settings, including laser power, photomultiplier gain, and offset, were kept constant for each marker. For quantitative analysis, images were collected from at least 3–4 slices processed simultaneously from each striatum (n ≥ 3 mice/genotype) and exported for analysis with ImageJ software (NIH). Software background subtraction was utilized to reduce noise. To quantify the density of a specific marker on a defined area, we calculated the “overlapping signal” by utilizing a region of interest (ROI), as previously described (Vanni et al, 2015). When neurons were loaded with lucifer yellow (0.2%) through the patch pipette during the electrophysiological recordings, slices were fixed overnight with 4% paraformaldehyde in 0.12 M phosphate buffer (pH 7.4), washed in PBS, mounted with Vectashield mounting medium on plus polarized glass slides (Super Frost Plus Thermo Scientific), and coverslipped (Ponterio et al, 2018).
Viral constructs and preparations
For RGS9‐2 silencing by lentiviral (LV) particles, two candidate shRNA sequences were designed to specifically silence mouse RGS9‐2 gene (NCBI GenBank AF125046), according to the clone sequences provided by Sigma‐Aldrich (clones shRNA_RGS9‐2: 37134 e 37135). Each sequence was inserted into the miR30a backbone sequence (formed by the stem loop and by 100‐bp downstream and upstream the premiR30a) to increase the expression efficiency of the shRNA (Denti et al, 2004).
shRNA37134: TTATCTTTTCCACCCAAGCTTTGTAAAAATAAATCAAAGAGAAAGCAAGGTATTGGTTTCAGCCAACAAGATAATTACTCCCTTGAAGTTGGAGGCAGTAGGCACCCAAGTGCATTAGGATAATACCCATTTGTGGCTTCACAGTATTATCCTAATGCACTTGGGGTCGCTCACTGTCAACGTTGATATGCCTTCTTCAGCATTCTGTCTTACTGACCTGAGAAGTGCTCTGCGGGAGTTTCTGAAATGTACAGGCAACATTCTGTAAAC
shRNA37135: GTTTACAGAATGTTGCCTGTACATTTCAGAAACTCCCGCAGAGCACTTCTCAGGTCAGTAAGACAGAATGCTGAAGAAGGCATATCAACGTTGACAGTGAGCGACCCGATTTCAGACGCCATATTTCTGTGAAGCCACAAATGGGAAATATGGCGTCTGAAATCGGTGCCTACTGCCTCCAACTTCAAGGAGTAATTATCTTGTTGGCTGAAACCAATACCTTGCTTTCTCTTTGATTTATTTTTACAAAGCTTGGGTGGAAAAGATAA
The sequences were cloned into the p207.pRRLsinPPTs.hCMV.GFP.WPREp207 plasmid (kindly provided by L. Naldini, Milan, Italy) under the U1 promoter for shRNA expression (p207 was modified as p207‐U1: p207_U1 shRNA‐34 and p207_U1 shRNA‐35) upstream to the CMV promoter. Both plasmids carrying each sequence were used for a single LV preparation. After cloning, the VSV‐G‐pseudotyped lentiviral vectors were generated by calcium phosphate transfection of HEK293T cells with a mixture of the four plasmids required to produce third‐generation lentiviruses (kindly provided by L. Naldini, San Raffaele Scientific Institute, Milan, Italy). The LV particles were prepared and purified according to previously published protocols (Mandolesi et al, 2009; Sciamanna et al, 2012b).
For overexpression of RGS9‐2 by LV particles, the RGS9‐2 cDNA sequence (NCBI GenBank AF125046) was cloned in the p207.pRRLsinPPTs.hCMV.WPREp207 under the CMV promoter. After cloning, the VSV‐G‐pseudotyped lentiviral vectors were prepared as described above.
The herpes simplex viral (HSV) vector used for overexpressing mouse RGS9‐2 (NCBI GenBank AF125046) has been previously described and validated (Rahman et al, 2003; Gold et al, 2007). The description of the control HSV‐LacZ (β‐galactosidase) vector is provided elsewhere (Carlezon et al, 1997). After cloning, HSV constructs were grown and purified according to previously published protocols (Coopersmith & Neve, 1999; Carlezon et al, 2000).
To monitor in vivo autophagy flux in ChIs, we utilized an adeno‐associated virus (AAV2/9) carrying a monomeric tandem mCherry‐GFP‐LC3 construct (AAV2/9‐mCherry‐GFP‐LC3; kindly provided by C. Hetz) as a reporter (Castillo et al, 2013). The GFP fluorescent signal of the reporter is sensitive to acidic conditions; thus, co‐localization of green and red fluorescence (yellow puncta) indicates that the tandem protein is not localized in compartments fused with a lysosome, while detection of red puncta indicates that the protein is located in the autolysosome (Matus et al, 2014).
Stereotactic injection of viral particles
Viral injection into the dorsal striatum was performed as previously described (Mandolesi et al, 2009; Fasano et al, 2010; Sciamanna et al, 2012b; Bourdenx et al, 2015; Urs et al, 2015). Briefly, male Tor1a +/− and Tor1a Δgag/+ mice were anesthetized with tiletamine/zolazepam (80 mg/kg) and xylazine (10 mg/kg). Viral preparation suspensions were injected into the dorsal striatum, using a glass capillary (Sutter Instruments) connected to a picospritzer (Parker Inst, USA) as previously described (e.g., see Mandolesi et al, 2009; Fasano et al, 2010; Sciamanna et al, 2012b; Bourdenx et al, 2015; Urs et al, 2015). The following coordinates from Bregma were used for dorsal striatum: anteroposterior +0.4 mm; lateral ±2.5 mm; and ventral at −1.7 and −2 mm from the dura. Mice received 2 μl of viral preparation administered at 0.1 ml/min rate. At the end of the injection, the capillary was left in place for 5 min before being slowly removed. The skin was sutured, and mice were allowed to recover. In line with preliminary immunofluorescence experiments assessing the time‐course and extent of viral infection, mice were sacrificed either 3–5 days after injection of HSV particles, or 3–4 weeks following LV or AAV particles.
Electrophysiology
Electrophysiological patch‐clamp recordings were performed as previously described from individual ChIs in striatal coronal slices, prepared as previously described from P60 to P90 old mice (Sciamanna et al, 2011, 2012b; Ponterio et al, 2018). ChIs were visualized using standard IR‐DIC microscopy and identified based on their large somatic size and distinctive electrophysiological properties. Electrophysiological signals were detected using Multiclamp 700B and AxoPatch 200 amplifiers (Molecular Devices), using borosilicate glass pipettes pulled on a P‐97 Puller (Sutter Instruments). For cell‐attached recordings, the electrodes were filled with a solution containing the following (in mM): 140.5 KMeSO4, 0.2 EGTA, 7.5 NaCl, 10 HEPES, 2 NaATP, and 0.2 NaGTP, adjusted to a pH of 7.3 with KOH. For perforated‐patch recordings, gramicidin was added at a final concentration of 20 μg/ml and the perforation process was considered complete when both the amplitude of the action potentials and electrode resistance were steady. Action potential firing frequency was analyzed with Clampfit 10 (pClamp 10, Molecular Devices); neurons with frequencies outside the 0.5–4.5 range were excluded from further analysis.
Statistics
All data were obtained from at least two independent experiments. Sample size for any measurement was based on the ARRIVE recommendations on refinement and reduction of animal use in research, as well as on our previous studies. Age‐ and sex‐matched wild‐type and mutant mice were randomly allocated to experimental groups and processed by a blinded investigator. For data analysis of WB, confocal and binding images, and electrophysiology experiments, the investigator was blinded to genotype/treatment. Each observation was obtained from an independent biological sample. The number of biological replicates is represented with N for number of animals and n for number of cells. For electrophysiology, each cell was recorded from a different brain slice. Data analysis was performed with Clampfit 10 (pClamp 10), ImageJ (NIH), and Prism 5.3 (GraphPad). Data are reported as mean ± SEM. Statistical significance was evaluated as indicated in the text, with Pearson's r correlation test, one‐way ANOVA with post hoc tests between groups corrected for multiple comparisons, and two‐tailed two‐sample t‐test (parametric or nonparametric, unpaired, or paired) as appropriate according to each test assumptions. For example, normality tests were used to assess Gaussian distribution. F‐test was used to compare variances between groups; when variance was different, Welch's correction was used. Statistical tests were two‐tailed, the confidence interval was 95%, and the alpha‐level used to determine significance was set at P < 0.05.
Study approval
Animal breeding and handling were performed in compliance with the ethical and safety rules and guidelines for the use of animals in biomedical research provided by the European Union's directives and Italian laws (2010/63EU, D.lgs. 26/2014; 86/609/CEE, D.Lgs 116/1992). The experimental procedures were approved by Fondazione Santa Lucia Animal Care and Use Committee and the Italian Ministry of Health (authorization # 223/2017‐PR).
Author contributions
PB and AP conceived and designed the study. GP, VV, AT, GS, GM, MM, SM, and ED performed the experiments and analyzed the data. PB supervised data analysis, evaluated the results, and wrote the manuscript. GP, VV, and AT contributed to critical evaluation of the results. BD, VZ, REG, MDA, MP, and EB provided experimental resources and contributed to critical evaluation of the results. AP, BD, REG, NBM, MDA, MP, and EB edited the manuscript. All authors approved the manuscript.
Conflict of interest
The authors declare that they have no conflict of interest.
The paper explained.
Problem
DYT1 dystonia is a progressive and highly disabling disease, with symptom onset frequently between childhood and adolescence. DYT1 causative mutation has been identified in the Tor1a gene. However, the molecular mechanisms underlying symptom manifestation are far from being clarified and medical treatments are unavailable. Dysfunction of dopamine D2 receptors in the striatum, a brain region involved primarily in motor control and motor learning, has been reported in DYT1 patients and rodent models. Therefore, restoring striatal D2 receptor function represents a potential therapeutic strategy.
Results
We investigated the molecular mechanisms of striatal dopamine D2 receptor dysfunction in multiple mouse models of DYT1 dystonia. We found that the striatal levels of D2 receptor, and of its regulatory proteins spinophilin and RGS9‐2, are reduced. We show that D2 receptor downregulation is mediated by an abnormal, selective trafficking to lysosomal degradation. Furthermore, we present evidence that viral‐induced expression of RGS9‐2 is able to restore both the striatal level and the function of dopamine D2 receptor.
Impact
These results provide an explanation for the lack of effectiveness of dopaminergic drugs in DYT1 dystonia, despite a clear involvement of dopamine receptors in disease pathophysiology. More importantly, our work identifies therapeutic targets that are effective in rescuing the dopaminergic dysfunction in DYT1 dystonia.
For more information
(i) OMIM #128100—DYSTONIA 1, TORSION, AUTOSOMAL DOMINANT; DYT1 http://omim.org/entry/128100
(ii) MDS Gene overview of studies for DYT‐TOR1A http://www.mdsgene.org/d/4/g/14?fc=0&_mu=1
(iii) gene #1861—TOR1A, torsin family 1 member A [Homo sapiens] https://www.ncbi.nlm.nih.gov/gene/1861
(iv) gene #30931—Tor1a, torsin family 1, member A (torsin A) [Mus musculus] https://www.ncbi.nlm.nih.gov/gene/30931
(v) gene #19739—Rgs9, regulator of G protein signaling 9 [Mus musculus] https://www.ncbi.nlm.nih.gov/gene/19739
(vi) gene #13489—Drd2, dopamine receptor D2 [Mus musculus] https://www.ncbi.nlm.nih.gov/gene/13489
(vii) Dystonia Europe: https://dystonia-europe.org/
(viii) Dystonia Coalition: https://www.rarediseasesnetwork.org/cms/dystonia
Supporting information
Appendix
Expanded View Figures PDF
Review Process File
Source Data for Figure 1
Source Data for Figure 2
Source Data for Figure 3
Source Data for Figure 5
Source Data for Figure 7
Acknowledgements
We are grateful to Dr. Georgia Mandolesi for the lentiviral preparations and to Mr. Massimo Tolu and Mr. Vladimiro Batocchi for their excellent technical assistance. We wish to thank Prof. Claudio Hetz for kindly providing AAV2/9‐mCherry‐GFP‐LC3, Prof. L. Naldini (San Raffaele Scientific Institute, Milan, Italy) for kindly providing the lentiviral plasmids, Dr. Nutan Sharma and Prof. David Standaert for kindly providing the hMT mice. We are also grateful to Prof. Xandra O. Breakefield for critical reading of the manuscript, Prof. Emiliana Borrelli and Dr. Marcello Serra for critical discussion and providing samples for DRD2 antibody validation, and Dr. Tilmann Achsel for valuable technical suggestions. A.P. and R.E.G. are grateful for the support and effort of the Dystonia Medical Research Foundation and the Foundation for Dystonia Research. This work was supported by grants to A.P. from Dystonia Medical Research Foundation (DMRF, 2011 Stanley Fahn Award) and the Italian Ministry of Health, Ricerca Finalizzata (RF‐2010‐2311657), and to M.D.A. from the Italian Ministry of Health (Progetto Giovani Ricercatori GR‐2011‐02351457) and from the Alzheimer's Association, United States (AARG‐18‐566270).
EMBO Mol Med (2019) 11:e9283
Contributor Information
Paola Bonsi, Email: p.bonsi@hsantalucia.it.
Antonio Pisani, Email: pisani@uniroma2.it.
References
- Anderson GR, Lujan R, Semenov A, Pravetoni M, Posokhova EN, Song JH, Uversky V, Chen CK, Wickman K, Martemyanov KA (2007a) Expression and localization of RGS9‐2/G 5/R7BP complex in vivo is set by dynamic control of its constitutive degradation by cellular cysteine proteases. J Neurosci 27: 14117–14127 [DOI] [PMC free article] [PubMed] [Google Scholar]
- Anderson GR, Semenov A, Song JH, Martemyanov KA (2007b) The membrane anchor R7BP controls the proteolytic stability of the striatal specific RGS protein, RGS9‐2. J Biol Chem 282: 4772–4781 [DOI] [PubMed] [Google Scholar]
- Apaja PM, Xu H, Lukacs GL (2010) Quality control for unfolded proteins at the plasma membrane. J Cell Biol 191: 553–570 [DOI] [PMC free article] [PubMed] [Google Scholar]
- Araki KY, Sims JR, Bhide PG (2007) Dopamine receptor mRNA and protein expression in the mouse corpus striatum and cerebral cortex during pre‐ and postnatal development. Brain Res 1156: 31–45 [DOI] [PMC free article] [PubMed] [Google Scholar]
- Asanuma K, Ma Y, Okulski J, Dhawan V, Chaly T, Carbon M, Bressman SB, Eidelberg D (2005) Decreased striatal D2 receptor binding in non‐manifesting carriers of the DYT1 dystonia mutation. Neurology 64: 347–349 [DOI] [PubMed] [Google Scholar]
- Balint B, Vincent A, Meinck HM, Irani SR, Bhatia KP (2018) Movement disorders with neuronal antibodies: syndromic approach, genetic parallels and pathophysiology. Brain 141: 13–36 [DOI] [PMC free article] [PubMed] [Google Scholar]
- Beaulieu JM, Sotnikova TD, Marion S, Lefkowitz RJ, Gainetdinov RR, Caron MG (2005) An Akt/beta‐arrestin 2/PP2A signaling complex mediates dopaminergic neurotransmission and behavior. Cell 122: 261–273 [DOI] [PubMed] [Google Scholar]
- Beaulieu JM, Del'guidice T, Sotnikova TD, Lemasson M, Gainetdinov RR (2011) Beyond cAMP: the regulation of Akt and GSK3 by dopamine receptors. Front Mol Neurosci 4: 38 [DOI] [PMC free article] [PubMed] [Google Scholar]
- Beaulieu JM, Gainetdinov RR (2011) The physiology, signaling, and pharmacology of dopamine receptors. Pharmacol Rev 63: 182–217 [DOI] [PubMed] [Google Scholar]
- Bjørkøy G, Lamark T, Brech A, Outzen H, Perander M, Overvatn A, Stenmark H, Johansen T (2005) p62/SQSTM1 forms protein aggregates degraded by autophagy and has a protective effect on huntingtin‐induced cell death. J Cell Biol 171: 603–614 [DOI] [PMC free article] [PubMed] [Google Scholar]
- Bourdenx M, Dovero S, Engeln M, Bido S, Bastide MF, Dutheil N, Vollenweider I, Baud L, Piron C, Grouthier V et al (2015) Lack of additive role of ageing in nigrostriatal neurodegeneration triggered by α‐synuclein overexpression. Acta Neuropathol Commun 3: 46 [DOI] [PMC free article] [PubMed] [Google Scholar]
- Burdette AJ, Churchill PF, Caldwell GA, Caldwell KA (2010) The early‐onset torsion dystonia‐associated protein, torsinA, displays molecular chaperone activity in vitro . Cell Stress Chaperones 15: 605–617 [DOI] [PMC free article] [PubMed] [Google Scholar]
- Cabrera‐Vera TM, Hernandez S, Earls LR, Medkova M, Sundgren‐Andersson AK, Surmeier DJ, Hamm HE (2004) RGS9‐2 modulates D2 dopamine receptor‐mediated Ca2+ channel inhibition in rat striatal cholinergic interneurons. Proc Natl Acad Sci USA 101: 16339–16344 [DOI] [PMC free article] [PubMed] [Google Scholar]
- Carbon M, Niethammer M, Peng S, Raymond D, Dhawan V, Chaly T, Ma Y, Bressman S, Eidelberg D (2009) Abnormal striatal and thalamic dopamine neurotransmission: genotype‐related features of dystonia. Neurology 72: 2097–2103 [DOI] [PMC free article] [PubMed] [Google Scholar]
- Carlezon WA, Boundy VA, Haile CN, Lane SB, Kalb RG, Neve RL, Nestler EJ (1997) Sensitization to morphine induced by viral‐mediated gene transfer. Science 277: 812–814 [DOI] [PubMed] [Google Scholar]
- Carlezon WA, Nestler EJ, Neve RL (2000) Herpes simplex virus‐mediated gene transfer as a tool for neuropsychiatric research. Crit Rev Neurobiol 14: 47–67 [DOI] [PubMed] [Google Scholar]
- Cascalho A, Jacquemyn J, Goodchild RE (2017) Membrane defects and genetic redundancy: are we at a turning point for DYT1 dystonia? Mov Disord 32: 371–381 [DOI] [PubMed] [Google Scholar]
- Castillo K, Valenzuela V, Matus S, Nassif M, Oñate M, Fuentealba Y, Encina G, Irrazabal T, Parsons G, Court FA et al (2013) Measurement of autophagy flux in the nervous system in vivo . Cell Death Dis 4: e917 [DOI] [PMC free article] [PubMed] [Google Scholar]
- Celver J, Sharma M, Kovoor A (2010) RGS9‐2 mediates specific inhibition of agonist‐induced internalization of D2‐dopamine receptors. J Neurochem 114: 739–749 [DOI] [PubMed] [Google Scholar]
- Celver J, Sharma M, Kovoor A (2012) D(2)‐Dopamine receptors target regulator of G protein signaling 9‐2 to detergent‐resistant membrane fractions. J Neurochem 120: 56–69 [DOI] [PMC free article] [PubMed] [Google Scholar]
- Cho DI, Min C, Jung KS, Cheong SY, Zheng M, Cheong SJ, Oak MH, Cheong JH, Lee BK, Kim KM (2012) The N‐terminal region of the dopamine D2 receptor, a rhodopsin‐like GPCR, regulates correct integration into the plasma membrane and endocytic routes. Br J Pharmacol 166: 659–675 [DOI] [PMC free article] [PubMed] [Google Scholar]
- Coopersmith R, Neve RL (1999) Expression of multiple proteins within single primary cortical neurons using a replication deficient HSV vector. Biotechniques 27: 1156–1160 [DOI] [PubMed] [Google Scholar]
- Dang MT, Yokoi F, Cheetham CC, Lu J, Vo V, Lovinger DM, Li Y (2012) An anticholinergic reverses motor control and corticostriatal LTD deficits in Dyt1 ΔGAG knock‐in mice. Behav Brain Res 226: 465–472 [DOI] [PMC free article] [PubMed] [Google Scholar]
- Dehay B, Ramirez A, Martinez‐Vicente M, Perier C, Canron MH, Doudnikoff E, Vital A, Vila M, Klein C, Bezard E (2012) Loss of P‐type ATPase ATP13A2/PARK9 function induces general lysosomal deficiency and leads to Parkinson disease neurodegeneration. Proc Natl Acad Sci USA 109: 9611–9616 [DOI] [PMC free article] [PubMed] [Google Scholar]
- Del'guidice T, Lemasson M, Beaulieu JM (2011) Role of Beta‐arrestin 2 downstream of dopamine receptors in the Basal Ganglia. Front Neuroanat 25: 58 [DOI] [PMC free article] [PubMed] [Google Scholar]
- Denti MA, Rosa A, Sthandier O, De Angelis FG, Bozzoni I (2004) A new vector, based on the PolII promoter of the U1 snRNA gene, for the expression of siRNAs in mammalian cells. Mol Ther 10: 191–199 [DOI] [PubMed] [Google Scholar]
- Drenan RM, Doupnik CA, Jayaraman M, Buchwalter AL, Kaltenbronn KM, Huettner JE, Linder ME, Blumer KJ (2006) R7BP augments the function of RGS7*Gbeta5 complexes by a plasma membrane‐targeting mechanism. J Biol Chem 281: 28222–28231 [DOI] [PubMed] [Google Scholar]
- Ebersole B, Petko J, Woll M, Murakami S, Sokolina K, Wong V, Stagljar I, Lüscher B, Levenson R (2015) Effect of C‐Terminal S‐Palmitoylation on D2 dopamine receptor trafficking and stability. PLoS One 10: e0140661 [DOI] [PMC free article] [PubMed] [Google Scholar]
- Eskelinen EL (2006) Roles of LAMP‐1 and LAMP‐2 in lysosome biogenesis and autophagy. Mol Aspects Med 27: 495–502 [DOI] [PubMed] [Google Scholar]
- Fasano S, Pittenger C, Brambilla R (2009) Inhibition of CREB activity in the dorsal portion of the striatum potentiates behavioral responses to drugs of abuse. Front Behav Neurosci 9: 29 [DOI] [PMC free article] [PubMed] [Google Scholar]
- Fasano S, Bezard E, D'Antoni A, Francardo V, Indrigo M, Qin L, Doveró S, Cerovic M, Cenci MA, Brambilla R (2010) Inhibition of Ras‐guanine nucleotide‐releasing factor 1 (Ras‐GRF1) signaling in the striatum reverts motor symptoms associated with L‐dopa‐induced dyskinesia. Proc Natl Acad Sci USA 107: 21824–21829 [DOI] [PMC free article] [PubMed] [Google Scholar]
- Franklin KBJ, Paxinos G (2008) The mouse brain in stereotaxic coordinates, 3rd edn Amsterdam: Academic Press; [Google Scholar]
- Giles LM, Chen J, Li L, Chin LS (2008) Dystonia‐associated mutations cause premature degradation of torsinA protein and cell‐type‐specific mislocalization to the nuclear envelope. Hum Mol Genet 17: 2712–2722 [DOI] [PMC free article] [PubMed] [Google Scholar]
- Gittis AH, Kreitzer AC (2012) Striatal microcircuitry and movement disorders. Trends Neurosci 35: 557–564 [DOI] [PMC free article] [PubMed] [Google Scholar]
- Gold SJ, Hoang CV, Potts BW, Porras G, Pioli E, Kim KW, Nadjar A, Qin C, LaHoste GJ, Li Q et al (2007) RGS9‐2 negatively modulates L‐3,4‐dihydroxyphenylalanine‐induced dyskinesia in experimental Parkinson's disease. J Neurosci 27: 14338–14348 [DOI] [PMC free article] [PubMed] [Google Scholar]
- Goodchild RE, Kim CE, Dauer WT (2005) Loss of the dystonia‐associated protein torsinA selectively disrupts the neuronal nuclear envelope. Neuron 48: 923–932 [DOI] [PubMed] [Google Scholar]
- Gordon KL, Gonzalez‐Alegre P (2008) Consequences of the DYT1 mutation on torsinA oligomerization and degradation. Neuroscience 157: 588–595 [DOI] [PMC free article] [PubMed] [Google Scholar]
- Granata A, Koo SJ, Haucke V, Schiavo G, Warner TT (2011) CSN complex controls the stability of selected synaptic proteins via a torsinA‐dependent process. EMBO J 30: 181–193 [DOI] [PMC free article] [PubMed] [Google Scholar]
- Grillet M, Dominguez Gonzalez B, Sicart A, Pöttler M, Cascalho A, Billion K, Hernandez Diaz S, Swerts J, Naismith TV, Gounko NV et al (2016) Torsins are essential regulators of cellular lipid metabolism. Dev Cell 38: 235–247 [DOI] [PubMed] [Google Scholar]
- Hara T, Nakamura K, Matsui M, Yamamoto A, Nakahara Y, Suzuki‐Migishima R, Yokoyama M, Mishima K, Saito I, Okano H et al (2006) Suppression of basal autophagy in neural cells causes neurodegenerative disease in mice. Nature 441: 885–889 [DOI] [PubMed] [Google Scholar]
- Hauser AS, Attwood MM, Rask‐Andersen M, Schiöth HB, Gloriam DE (2017) Trends in GPCR drug discovery: new agents, targets and indications. Nat Rev Drug Discov 16: 829–842 [DOI] [PMC free article] [PubMed] [Google Scholar]
- Johansen T, Lamark T (2011) Selective autophagy mediated by autophagic adapter proteins. Autophagy 7: 279–296 [DOI] [PMC free article] [PubMed] [Google Scholar]
- Kim KM, Valenzano KJ, Robinson SR, Yao WD, Barak LS, Caron MG (2001) Differential regulation of the dopamine D2 and D3 receptors by G protein‐coupled receptor kinases and beta‐arrestins. J Biol Chem 276: 37409–37414 [DOI] [PubMed] [Google Scholar]
- Kim DS, Froelick GJ, Palmiter RD (2002) Dopamine‐dependent desensitization of dopaminergic signaling in the developing mouse striatum. J Neurosci 22: 9841–9849 [DOI] [PMC free article] [PubMed] [Google Scholar]
- Komatsu M, Ichimura Y (2010) Physiological significance of selective degradation of p62 by autophagy. FEBS Lett 584: 1374–1378 [DOI] [PubMed] [Google Scholar]
- Kovoor A, Seyffarth P, Ebert J, Barghshoon S, Chen CK, Schwarz S, Axelrod JD, Cheyette BN, Simon MI, Lester HA et al (2005) D2 dopamine receptors colocalize regulator of G‐protein signaling 9‐2 (RGS9‐2) via the RGS9 DEP domain, and RGS9 knock‐out mice develop dyskinesias associated with dopamine pathways. J Neurosci 25: 2157–2165 [DOI] [PMC free article] [PubMed] [Google Scholar]
- Li Y, Roy BD, Wang W, Zhang L, Zhang L, Sampson SB, Yang Y, Lin DT (2012) Identification of two functionally distinct endosomal recycling pathways for dopamine D2 receptor. J Neurosci 32: 7178–7190 [DOI] [PMC free article] [PubMed] [Google Scholar]
- Lilienbaum A (2013) Relationship between the proteasomal system and autophagy. Int J Biochem Mol Biol 4: 1–26 [PMC free article] [PubMed] [Google Scholar]
- MacGurn JA (2014) Garbage on, garbage off: new insights into plasma membrane protein quality control. Curr Opin Cell Biol 29: 92–98 [DOI] [PMC free article] [PubMed] [Google Scholar]
- Mandolesi G, Autuori E, Cesa R, Premoselli F, Cesare P, Strata P (2009) GluRdelta2 expression in the mature cerebellum of hotfoot mice promotes parallel fiber synaptogenesis and axonal competition. PLoS One 4: e5243 [DOI] [PMC free article] [PubMed] [Google Scholar]
- Martella G, Maltese M, Nisticò R, Schirinzi T, Madeo G, Sciamanna G, Ponterio G, Tassone A, Mandolesi G, Vanni V et al (2014) Regional specificity of synaptic plasticity deficits in a knock‐in mouse model of DYT1 dystonia. Neurobiol Dis 65: 124–132 [DOI] [PubMed] [Google Scholar]
- Masuho I, Wakasugi‐Masuho H, Posokhova EN, Patton JR, Martemyanov KA (2011) Type 5 G protein beta subunit (Gbeta5) controls the interaction of regulator of G protein signaling 9 (RGS9) with membrane anchors. J Biol Chem 286: 21806–21813 [DOI] [PMC free article] [PubMed] [Google Scholar]
- Matus S, Valenzuela V, Hetz C (2014) A new method to measure autophagy flux in the nervous system. Autophagy 10: 710–714 [DOI] [PMC free article] [PubMed] [Google Scholar]
- McDougall SA, Eaton SE, Mohd‐Yusof A, Crawford CA (2015) Age‐dependent changes in cocaine sensitivity across early ontogeny in male and female rats: possible role of dorsal striatal D2(High) receptors. Psychopharmacology 232: 2287–2301 [DOI] [PMC free article] [PubMed] [Google Scholar]
- Napolitano F, Pasqualetti M, Usiello A, Santini E, Pacini G, Sciamanna G, Errico F, Tassone A, Di Dato V, Martella G et al (2010) Dopamine D2 receptor dysfunction is rescued by adenosine A2A receptor antagonism in a model of DYT1 dystonia. Neurobiol Dis 38: 434–445 [DOI] [PMC free article] [PubMed] [Google Scholar]
- Ozelius LJ, Hewett JW, Page CE, Bressman SB, Kramer PL, Shalish C, de Leon D, Brin MF, Raymond D, Corey DP et al (1997) The early‐onset torsion dystonia gene (DYT1) encodes an ATP‐binding protein. Nat Genet 17: 40–48 [DOI] [PubMed] [Google Scholar]
- Peterson YK, Luttrell LM (2017) The diverse roles of arrestin scaffolds in g protein‐coupled receptor signaling. Pharmacol Rev 69: 256–297 [DOI] [PMC free article] [PubMed] [Google Scholar]
- Pisani A, Martella G, Tscherter A, Bonsi P, Sharma N, Bernardi G, Standaert DG (2006) Altered responses to dopaminergic D2 receptor activation and N‐type calcium currents in striatal cholinergic interneurons in a mouse model of DYT1 dystonia. Neurobiol Dis 24: 318–325 [DOI] [PubMed] [Google Scholar]
- Ponterio G, Tassone A, Sciamanna G, Vanni V, Meringolo M, Santoro M, Mercuri NB, Bonsi P, Pisani A (2018) Enhanced mu opioid receptor‐dependent opioidergic modulation of striatal cholinergic transmission in DYT1 dystonia. Mov Disord 33: 310–320 [DOI] [PubMed] [Google Scholar]
- Pratelli M, Migliarini S, Pelosi B, Napolitano F, Usiello A, Pasqualetti M (2017) Perturbation of serotonin homeostasis during adulthood affects serotonergic neuronal circuitry. eNeuro 4: 0376‐16 [DOI] [PMC free article] [PubMed] [Google Scholar]
- Rahman Z, Schwarz J, Gold SJ, Zachariou V, Wein MN, Choi KH, Kovoor A, Chen CK, DiLeone RJ, Schwarz SC et al (2003) RGS9 modulates dopamine signaling in the basal ganglia. Neuron 38: 941–952 [DOI] [PubMed] [Google Scholar]
- Redgrave P, Rodriguez M, Smith Y, Rodriguez‐Oroz MC, Lehericy S, Bergman H, Agid Y, DeLong MR, Obeso JA (2010) Goal‐directed and habitual control in the basal ganglia: implications for Parkinson's disease. Nat Rev Neurosci 11: 760–772 [DOI] [PMC free article] [PubMed] [Google Scholar]
- Scarduzio M, Zimmerman CN, Jaunarajs KL, Wang Q, Standaert DG, McMahon LL (2017) Strength of cholinergic tone dictates the polarity of dopamine D2 receptor modulation of striatal cholinergic interneuron excitability in DYT1 dystonia. Exp Neurol 295: 162–175 [DOI] [PMC free article] [PubMed] [Google Scholar]
- Sciamanna G, Tassone A, Martella G, Mandolesi G, Puglisi F, Cuomo D, Madeo G, Ponterio G, Standaert DG, Bonsi P et al (2011) Developmental profile of the aberrant dopamine D2 receptor response in striatal cholinergic interneurons in DYT1 dystonia. PLoS One 6: e24261 [DOI] [PMC free article] [PubMed] [Google Scholar]
- Sciamanna G, Hollis R, Ball C, Martella G, Tassone A, Marshall A, Parsons D, Li X, Yokoi F, Zhang L et al (2012a) Cholinergic dysregulation produced by selective inactivation of the dystonia‐associated protein torsinA. Neurobiol Dis 47: 416–427 [DOI] [PMC free article] [PubMed] [Google Scholar]
- Sciamanna G, Tassone A, Mandolesi G, Puglisi F, Ponterio G, Martella G, Madeo G, Bernardi G, Standaert DG, Bonsi P et al (2012b) Cholinergic dysfunction alters synaptic integration between thalamostriatal and corticostriatal inputs in DYT1 dystonia. J Neurosci 32: 11991–12004 [DOI] [PMC free article] [PubMed] [Google Scholar]
- Seeman P, Ko F, Jack E, Greenstein R, Dean B (2007) Consistent with dopamine supersensitivity, RGS9 expression is diminished in the amphetamine‐treated animal model of schizophrenia and in postmortem schizophrenia brain. Synapse 61: 303–309 [DOI] [PubMed] [Google Scholar]
- Sjögren B (2017) The evolution of regulators of G protein signaling proteins as drug targets – 20 years in the making: IUPHAR Review 21. Br J Pharmacol 174: 427–437 [DOI] [PMC free article] [PubMed] [Google Scholar]
- Smith FD, Oxford GS, Milgram SL (1999) Association of the D2 dopamine receptor third cytoplasmic loop with spinophilin, a protein phosphatase‐1‐interacting protein. J Biol Chem 274: 19894–19900 [DOI] [PubMed] [Google Scholar]
- Song JH, Waataja JJ, Martemyanov KA (2006) Subcellular targeting of RGS9‐2 is controlled by multiple molecular determinants on its membrane anchor, R7BP. J Biol Chem 281: 15361–15369 [DOI] [PubMed] [Google Scholar]
- Tanida I, Minematsu‐Ikeguchi N, Ueno T, Kominami E (2005) Lysosomal turnover, but not a cellular level, of endogenous LC3 is a marker for autophagy. Autophagy 1: 84–91 [DOI] [PubMed] [Google Scholar]
- Tanida I, Ueno T, Kominami E (2008) LC3 and autophagy. Methods Mol Biol 445: 77–88 [DOI] [PubMed] [Google Scholar]
- Tansky MF, Pothoulakis C, Leeman SE (2007) Functional consequences of alteration of N‐linked glycosylation sites on the neurokinin 1 receptor. Proc Natl Acad Sci USA 104: 10691–10696 [DOI] [PMC free article] [PubMed] [Google Scholar]
- Torres GE, Sweeney AL, Beaulieu JM, Shashidharan P, Caron MG (2004) Effect of torsinA on membrane proteins reveals a loss of function and a dominant‐negative phenotype of the dystonia‐associated DeltaE‐torsinA mutant. Proc Natl Acad Sci USA 101: 15650–15655 [DOI] [PMC free article] [PubMed] [Google Scholar]
- Traynor JR, Terzi D, Caldarone BJ, Zachariou V (2009) RGS9‐2: probing an intracellular modulator of behavior as a drug target. Trends Pharmacol Sci 30: 105–111 [DOI] [PMC free article] [PubMed] [Google Scholar]
- Urs NM, Bido S, Peterson SM, Daigle TL, Bass CE, Gainetdinov RR, Bezard E, Caron MG (2015) Targeting β‐arrestin2 in the treatment of L‐DOPA‐induced dyskinesia in Parkinson's disease. Proc Natl Acad Sci USA 112: E2517–E2526 [DOI] [PMC free article] [PubMed] [Google Scholar]
- Vanni V, Puglisi F, Bonsi P, Ponterio G, Maltese M, Pisani A, Mandolesi G (2015) Cerebellar synaptogenesis is compromised in mouse models of DYT1 dystonia. Exp Neurol 271: 457–467 [DOI] [PubMed] [Google Scholar]
- Wang Q, Zhao J, Brady AE, Feng J, Allen PB, Lefkowitz RJ, Greengard P, Limbird LE (2004) Spinophilin blocks arrestin actions in vitro and in vivo at G protein‐coupled receptors. Science 304: 1940–1944 [DOI] [PubMed] [Google Scholar]
- Yokoi F, Dang MT, Li J, Standaert DG, Li Y (2011) Motor deficits and decreased striatal dopamine receptor 2 binding activity in the striatum‐specific Dyt1 conditional knock‐out mice. PLoS One 6: e24539 [DOI] [PMC free article] [PubMed] [Google Scholar]
- Zeng BY, Heales SJ, Canevari L, Rose S, Jenner P (2004) Alterations in expression of dopamine receptors and neuropeptides in the striatum of GTP cyclohydrolase‐deficient mice. Exp Neurol 190: 515–524 [DOI] [PubMed] [Google Scholar]
- Zheng M, Cheong SY, Min C, Jin M, Cho DI, Kim KM (2011) β‐arrestin2 plays permissive roles in the inhibitory activities of RGS9‐2 on G protein‐coupled receptors by maintaining RGS9‐2 in the open conformation. Mol Cell Biol 31: 4887–4901 [DOI] [PMC free article] [PubMed] [Google Scholar]
- Zheng M, Zhang X, Sun NN, Min C, Zhang X, Kim KM (2016) RalA employs GRK2 and β‐arrestins for the filamin A‐mediated regulation of trafficking and signaling of dopamine D2 and D3 receptor. Biochim Biophys Acta 1863: 2072–2083 [DOI] [PubMed] [Google Scholar]
Associated Data
This section collects any data citations, data availability statements, or supplementary materials included in this article.
Supplementary Materials
Appendix
Expanded View Figures PDF
Review Process File
Source Data for Figure 1
Source Data for Figure 2
Source Data for Figure 3
Source Data for Figure 5
Source Data for Figure 7