

Abstract
Purpose
To summarize the literature by performing a systematic review and pooled analysis of the data, to understand the extent of variability among studies of native T1 and extracellular volume (ECV) measurements, and to identify covariates that account for heterogeneity between studies.
Materials and Methods
PubMed, Web of Science, and Cochrane Central were searched for native T1 and ECV measurements of the left ventricle in health adult study participants. The search terms used were “T1 mapping heart,” “Native T1 heart,” and “ECV heart.” Summary means were generated with random-effects modeling. Heterogeneity was assessed by using the inconsistency factor (I 2). Subgroup analyses and meta-regression analyses were conducted to identify etiologic causes of heterogeneity.
Results
This systematic review of native T1 included 120 articles, with 5541 participants (mean age, 50 years; 51.0% men [2826 of 5541]). The pooled mean of native T1 was 976 msec (95% confidence interval [CI]: 969 msec, 983 msec) at 1.5 T and 1159 msec (95% CI: 1143 msec, 1175 msec) at 3.0 T. I 2 was 99% at both field strengths. Eighty-one articles were included in the systematic review of ECV, with 3872 participants (mean age, 52 years; 50.0% men [1936 of 3872]). The pooled mean of ECV was 25.9% at field strength of 1.5 T (95% CI: 25.5%, 26.3%) and 3.0 T (95% CI: 25.4%, 26.5%). I 2 was 94% and 90% at 1.5 and 3.0 T, respectively.
Conclusion
The pooled means of extracellular volume and native T1 measurements in healthy adult participants are summarized in this analysis. There was significant heterogeneity found among studies, highlighting the importance of standardized cardiac MRI protocols and the derivation of institution specific reference ranges.
© RSNA, 2018
Online supplemental material is available for this article.
See also the editorial by Dodd and Dewey in this issue.
Summary
We evaluated normal values and variability of native T1 and extracellular volume measurements at cardiac MRI in the literature. Marked heterogeneity was found among studies, emphasizing the importance of standardizing cardiac MRI protocols.
Implications for Patient Care
■ Native T1 values vary with field strength and vendor, and published cut-off values for disease need to be interpreted with caution. Extracellular volume values are similar at 1.5 T and 3.0 T and thus may be preferred for comparisons across field strengths.
■ Native T1 and extracellular volume values depend in part on protocol and pulse sequence parameters. Institution should standardize MRI protocol and pulse sequences.
■ Whenever possible, internal control groups should be used to derive institution-specific reference ranges for native T1 and extracellular volume values.
Introduction
T1 mapping techniques at cardiovascular MRI are rapidly emerging as viable surrogate markers for assessing diffuse fibrosis and infiltrative processes (1–8). The current standard, endomyocardial biopsy, is prone to sampling error and confers a procedural risk (9). The advancement of T1 mapping parameters, namely native T1 and extracellular volume (ECV), stems from the need for noninvasive methods to characterize the myocardium. Extensive work has been performed by using native T1 and ECV to characterize the myocardium, and these measures demonstrated promising diagnostic and prognostic utility (10–22). A variety of factors such as differences in center-specific protocols, population studied, vendor, and pulse sequence have made specific cut-offs for native T1 and ECV difficult to define. To improve intra- and interpatient variability, the recently published parametric mapping guidelines from the Society for Cardiovascular Magnetic Resonance (23) recommends that local institutions validate a specific set of sequence parameters and that these parameters remain fixed over time. It is important to understand and quantify the magnitude and etiologic cause of the variability so that T1 mapping measurements can be reliably used in clinical and research settings.
To date there have been several studies that compare participants who have known pathologic conditions, such as hypertrophic cardiomyopathy or amyloidosis, with control participants (10,13,14,16,24–26). Although there have been some larger-scale studies that define normal ranges for a specific pulse sequence (24,26), to our knowledge there has not been a comprehensive analysis of the literature to determine what is considered normal across different studies. The primary goals of our study were to summarize the literature by performing a systematic review and pooled analysis of the data, to understand the extent of variability among studies of native T1 and ECV measurements, and to identify covariates that account for heterogeneity between studies.
Materials and Methods
Search Strategy
Two independent reviewers (M.G., a cardiology fellow with 4 years of experience, and M.S., a senior faculty member with over 15 years of experience) systematically searched PubMed, Web of Science, and Cochrane Central for articles of myocardial T1 measurements in healthy subjects. The search terms used were “T1 mapping ‘AND’ heart,” “Native T1 ‘AND’ heart,” and “ECV ‘AND’ heart.” The search terms were used separately rather than in combination. Date limits were not placed. The initial search was performed on October 1, 2016, and the last search was performed on March 5, 2018. Abstracts were reviewed if the title of the article indicated that the study involved T1 measurements of the heart or if the applicability of the study was not made clear by the title. Reviewers further searched reference lists of eligible articles to identify any additional articles not discovered through database searches.
Study Selection
Studies were included if myocardial native T1 or ECV measurements were performed by using cardiac MRI in a study group of healthy participants. For inclusion, a study had to contain at least either native T1 or ECV data; a study did not have to contain both native T1 and ECV data for inclusion. Each study was considered for inclusion in the analysis if it included a study group of at least 10 healthy participants who were older than 18 years of age, free of any known heart disease or overt symptoms of heart disease, and free of any findings of myocardial scar on cardiac MRI. Studies that included participants who were considered low probability for heart disease or had risk factors for heart disease such as hypertension, hyperlipidemia, diabetes mellitus, or tobacco use were also included. Studies of athletes or participants who underwent cardiac MRI after exercise or following pharmacological stress were excluded. Both studies that retrospectively and prospectively recruited control participants were included. There was a large number of T1 mapping pulse sequences described in the literature. Specific techniques, defined by field strength, vendor, and pulse sequence scheme, that were used in fewer than five studies meeting the above criteria were not included in the analysis. As a result of this criterion, studies performed on GE (Waukesha, Wis) scanners were excluded. Although there were six studies found in the literature, five different pulse sequence schemes were used in these six studies. Studies were included only if they were published in peer-reviewed journals in English; conference presentations were excluded. Discrepancies regarding inclusion were resolved by a consensus of reviewers. The included studies are shown in Tables E1 and E2 (online). This systematic review and meta-analysis was conducted in accordance with guidelines of Preferred Reporting Items for Systematic Reviews and Meta-Analyses (PRISMA) (27).
Data Collection
Data abstraction and study appraisal were performed by two authors (M.G. and M.S.). Because the clinical measurements of interest were native T1 and ECV in healthy participants, authors directly abstracted native T1 myocardium, native T1 blood pool, postcontrast T1 myocardium, postcontrast T1 blood pool, partition coefficient, and ECV from text and tables of fully reviewed articles.
Details of the cardiac MRI protocol used, including vendor, field strength, pulse sequence scheme, flip angle, matrix size, repetition time, echo time, interpulse delay (defined as the time between the first and subsequent inversions for modified Look-Locker inversion recovery [MOLLI] and shortened MOLLI pulse sequences), contrast agent, and contrast dose, were abstracted.
If an article presented data at different field strengths or from varied pulse sequences, each data set acquired was handled as a unique study group, even if multiple pulse sequences were applied to the same cohort of healthy participants. When data were acquired from multiple planes, data from the midventricular short axis plane was abstracted.
When data were acquired both during systole and diastole, data acquired at end diastole were abstracted. If ECV values were reported at different points after contrast agent administration, values from the latest postcontrast time within 30 minutes were abstracted. Study size and demographic information was abstracted from text and tables.
Data Analysis
The summary means and confidence intervals (CIs) of native T1 and ECV were calculated by using random-effects models weighted by the inverse of the variance. Heterogeneity was assessed by using Cochran Q test; τ2; and the inconsistency factor, I 2; with values of 25%, 50%, and 75% representing mild, moderate, and severe inconsistency, respectively. Sensitivity analyses, subgroup analysis, and meta-regression were performed to determine which variables likely affect native T1 and ECV measurements and, thus, account for some or all of the heterogeneity. Cochran QE test was used to assess residual heterogeneity and R2 was used to assess the proportion of total variance that could be explained by the covariates. Small study and publication biases were examined with funnel plots and the Egger test.
Statistical analysis was performed by using software (R version 3.3.3; R Foundation for Statistical Computing, Vienna, Austria) with the threshold for statistical significance set at α value less than .05, two-tailed level. Meta-analysis was performed by using the package metaphor in R.
Results
Results of the Literature Search
The database search identified 2334 articles; 1153 from PubMed (Native T1 AND Heart, 230 articles; T1 Mapping AND Heart, 571 articles; ECV AND Heart, 352 articles), 944 from Web of Science (Native T1 AND Heart, 156 articles; T1 Mapping AND Heart, 533 articles; ECV AND Heart, 255 articles), and 237 from Cochrane Central (Native T1 AND Heart, 22 articles; T1 Mapping AND Heart, 171 articles; ECV AND Heart, 44 articles). Duplicate articles were removed. The titles of the 1207 unique articles were reviewed for applicability and 380 met criteria for abstract review.
At review of the abstracts, 186 articles met the criteria for full-text review. Whereas our search included all vendors, the pooled analysis only included studies that used Philips or Siemens scanners because these were the only two vendors with adequate numbers of studies for pooled analysis. Likewise, whereas our search included all pulse sequence techniques, only two techniques, MOLLI and shortened MOLLI, were used in a sufficient number of studies to be included in the pooled analysis. Most clinical studies in the literature used either MOLLI or shortened MOLLI as the pulse sequence scheme.
Fifty-seven full-text articles were excluded because of study size, technique, or pulse sequence used, or because of incomplete data. Ultimately, 129 articles met selection criteria; 120 of the 129 articles were included in the native T1 meta-analysis and 81 of the 129 articles were included in the ECV meta-analysis (references for articles included in the meta-analysis can be found in Appendix E1 [online]). Some articles included multiple study groups that varied by the field strength, technique, pulse sequence, flip angle, contrast agent, or contrast dose used in the study. Details of the search strategy are outlined in the Quality of Reporting of Meta-Analyses Standards diagram in Figure 1.
Figure 1:

Preferred Reporting Items for Systematic Reviews and Meta-Analyses (PRISMA) flowchart of the study review process. ECV = extracellular volume, MOLLI = modified Look-Locker inversion recovery, ShMOLLI = shortened modified Look-Locker inversion recovery.
Study Characteristics
Study characteristics are shown in Tables E1 and E2 (online).
The 120 articles on native T1 included 5541 healthy participants. Ten articles presented multiple study groups for a total of 138 study groups. One-hundred-sixteen of 138 study groups (84.1%) in the native T1 meta-analysis included less than 50 participants and only three study groups (2.2%) included more than 100 participants. Mean age of participants was 50 years and 51.0% (2826 of 5541) were men.
The 81 ECV articles included a total of 3872 healthy participants. Seven articles presented multiple study groups for a total of 95 study groups. Similarly, 81 of 95 study groups (85%) in the ECV meta-analysis included less than 50 participants and only two studies (2%) included more than 100 participants. In these studies, the mean age of the study participants was 52 years and 50.0% (1936 of 3872) were men. The largest study was conducted by Liu et al (24) and included 1231 participants; this study was included in both native T1 and ECV meta-analyses.
Pooled Analysis of Native T1
The summary mean of all native T1 study groups studied at 1.5 T was 976 msec (95% CI: 969, 983) and at 3.0 T it was 1159 msec (95% CI: 1143, 1175) (Table 1). There was substantial heterogeneity in both pools; I 2 was 99% in both the 1.5-T and 3.0-T pools. The forest plots of native T1 study groups at 1.5 T and 3.0 T are shown in Figures 2 and 3, respectively. Table 1 shows the overall mean native T1 by field strength and the mean native T1 subgrouped by field strength, vendor, and pulse sequence. Table 2, A and B show significant differences in the pooled mean native T1 by field strength, vendor, and pulse sequence. The Siemens shortened MOLLI pulse sequences showed on average a 23 msec shorter T1 time at 1.5 T, and a 22 msec shorter T1 time at 3.0 T than the Siemens MOLLI pulse sequences. Philips MOLLI yielded T1 values that were 17 msec longer at 1.5 T, and 70 msec shorter at 3.0 T compared with Siemens MOLLI.
Table 1:
Results of Meta-Analysis by Subgroup
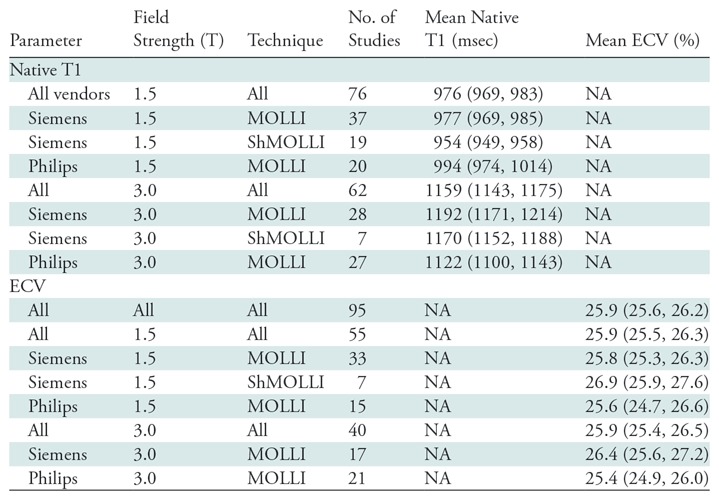
Note.—Data in parentheses are 95% confidence intervals. ECV = extracellular volume, MOLLI = modified Look-Locker inversion recovery, NA = not applicable, ShMOLLI = shortened modified Look-Locker inversion recovery.
Figure 2a:

Forest plots of native T1 studies at 1.5-T cardiac MRI in healthy participants. Studies are grouped by vendor and pulse sequence scheme. (a) Native T1 studies from Philips modified Look-Locker inversion recovery (MOLLI) subgroup, (b) native T1 studies from Siemens MOLLI subgroup, and (c) native T1 studies from Siemens MOLLI subgroup. Studies with multiple subgroups are noted by author last name and year of publication..
Figure 3a:

Forest plots of native T1 studies at 3.0-T cardiac MRI in healthy participants. Studies are grouped by vendor and pulse sequence scheme. (a) Native T1 studies from Philips modified Look-Locker inversion recovery (MOLLI) subgroup, (b) native T1 studies from Siemens MOLLI subgroup, and (c) native T1 studies from Siemens shortened MOLLI subgroup. Studies with multiple subgroups are noted by author last name and year of publication.
Table 2:
Analyses According to Subgroup
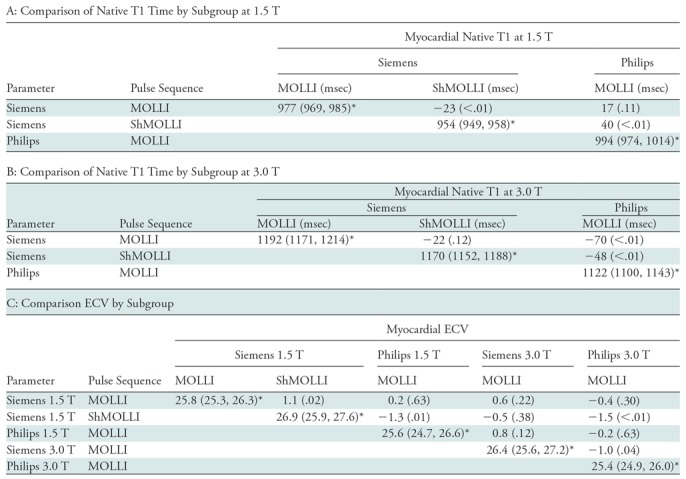
Note.—Unless otherwise indicated, data are the difference between the subgroup in the row and the subgroup in the column; the associated P value is in parentheses. ECV = extracellular volume, MOLLI = modified Look-Locker inversion recovery, ShMOLLI = shortened modified Look-Locker inversion recovery.
*Data are pooled mean of each subgroup; data in parentheses are 95% confidence intervals.
Figure 2b:

Forest plots of native T1 studies at 1.5-T cardiac MRI in healthy participants. Studies are grouped by vendor and pulse sequence scheme. (a) Native T1 studies from Philips modified Look-Locker inversion recovery (MOLLI) subgroup, (b) native T1 studies from Siemens MOLLI subgroup, and (c) native T1 studies from Siemens MOLLI subgroup. Studies with multiple subgroups are noted by author last name and year of publication..
Figure 2c:

Forest plots of native T1 studies at 1.5-T cardiac MRI in healthy participants. Studies are grouped by vendor and pulse sequence scheme. (a) Native T1 studies from Philips modified Look-Locker inversion recovery (MOLLI) subgroup, (b) native T1 studies from Siemens MOLLI subgroup, and (c) native T1 studies from Siemens MOLLI subgroup. Studies with multiple subgroups are noted by author last name and year of publication..
Figure 3b:

Forest plots of native T1 studies at 3.0-T cardiac MRI in healthy participants. Studies are grouped by vendor and pulse sequence scheme. (a) Native T1 studies from Philips modified Look-Locker inversion recovery (MOLLI) subgroup, (b) native T1 studies from Siemens MOLLI subgroup, and (c) native T1 studies from Siemens shortened MOLLI subgroup. Studies with multiple subgroups are noted by author last name and year of publication.
Figure 3c:

Forest plots of native T1 studies at 3.0-T cardiac MRI in healthy participants. Studies are grouped by vendor and pulse sequence scheme. (a) Native T1 studies from Philips modified Look-Locker inversion recovery (MOLLI) subgroup, (b) native T1 studies from Siemens MOLLI subgroup, and (c) native T1 studies from Siemens shortened MOLLI subgroup. Studies with multiple subgroups are noted by author last name and year of publication.
There was no evidence of a small study or publication bias in the 1.5-T or 3.0-T pools as assessed by the funnel plot and Egger test.
Pooled Analysis of ECV
The summary mean of all ECV study groups was 25.9% (95% CI: 25.6%, 26.2%; Table 1). The summary mean of all ECV study groups at 1.5 T was 25.9% (95% CI: 25.5%, 26.3%). This was equal to the summary mean of all study groups at 3.0 T (25.9%; 95% CI: 25.4%, 26.5%). Again, there was substantial heterogeneity found in the pools of study groups separated by field strength (I 2 was 94% and 90% at 1.5 T and 3.0 T, respectively) and in the pool of all ECV study groups (I 2 was 93%). The forest plots of ECV studies are shown in Figures 4 and 5. Subgroup analysis was performed to determine the magnitude and statistical significance of the difference between subgroups of studies on the basis of field strength, vendor, and pulse sequence scheme, as shown in Table 2, C. The difference in pooled mean ECV between subgroups ranged from 0.2% to 1.5%, with the largest difference found between the 1.5 T-Siemens shortened MOLLI subgroup and the 3.0-T Philips MOLLI subgroup. The subgroups with the most similar pooled mean ECV were 1.5-T Siemens MOLLI (pooled mean, 25.8%), 1.5-T Philips MOLLI (pooled mean, 25.6%), and 3.0-T Philips MOLLI (pooled mean, 25.4%).
Figure 4a:

Forest plots of extracellular volume (ECV) studies at 1.5-T cardiac MRI in healthy participants. Studies are grouped by vendor and pulse sequence scheme. (a) ECV studies from Philips modified Look-Locker inversion recovery (MOLLI) subgroup, (b) ECV studies from Siemens MOLLI subgroup, and (c) ECV studies from Siemens shortened MOLLI subgroup. Studies with multiple subgroups are noted by author last name and year of publication.
Figure 5a:

Forest plots of extracellular volume (ECV) studies at 3.0-T cardiac MRI in healthy participants. Studies are grouped by vendor and pulse sequence scheme. (a) ECV studies from Philips modified Look-Locker inversion recovery (MOLLI) subgroup and (b) ECV studies from Siemens MOLLI subgroup. Studies with multiple subgroups are noted by author last name and year of publication.
Figure 4b:

Forest plots of extracellular volume (ECV) studies at 1.5-T cardiac MRI in healthy participants. Studies are grouped by vendor and pulse sequence scheme. (a) ECV studies from Philips modified Look-Locker inversion recovery (MOLLI) subgroup, (b) ECV studies from Siemens MOLLI subgroup, and (c) ECV studies from Siemens shortened MOLLI subgroup. Studies with multiple subgroups are noted by author last name and year of publication.
Figure 4c:

Forest plots of extracellular volume (ECV) studies at 1.5-T cardiac MRI in healthy participants. Studies are grouped by vendor and pulse sequence scheme. (a) ECV studies from Philips modified Look-Locker inversion recovery (MOLLI) subgroup, (b) ECV studies from Siemens MOLLI subgroup, and (c) ECV studies from Siemens shortened MOLLI subgroup. Studies with multiple subgroups are noted by author last name and year of publication.
Figure 5b:

Forest plots of extracellular volume (ECV) studies at 3.0-T cardiac MRI in healthy participants. Studies are grouped by vendor and pulse sequence scheme. (a) ECV studies from Philips modified Look-Locker inversion recovery (MOLLI) subgroup and (b) ECV studies from Siemens MOLLI subgroup. Studies with multiple subgroups are noted by author last name and year of publication.
There was no evidence of a small study or publication bias in the pool of ECV studies, assessed by the funnel plot and Egger test.
Metaregression Analysis of Native T1 and ECV
The metaregression analysis of the pool of native T1 studies conducted at 1.5 T identified vendor (β = –25.02 [Philips as the reference vendor]; P < .01) and pulse sequence scheme (β = –29.25 [MOLLI as the reference pulse sequence scheme]; P < .01) as covariates that have statistically significant associations with native T1. Metaregression of the pool of native T1 studies conducted at 3.0 T identified vendor (β = 67.31 [Philips as reference vendor]; P < .01), flip angle (β = –4.98; P ≤ .01), and interpulse delay (β = 22.19; P = .03) as covariates that have a statistically significant association with native T1. Metaregression did not identify any statistically significant association with age (P = .51 and P = .81 at 1.5 T and 3 T, respectively), percentage of male participants (P = .16 and P = .41 at 1.5 T and 3 T, respectively), and native T1 time at either field strength.
The meta-regression of all ECV study groups identified pulse sequence scheme (β = 1.17 [MOLLI as the reference pulse sequence scheme]; P = .02), percentage of male participants (β = –2.43; P = < .01), and contrast agent (Gadovist, β = –1.36 [P < .01]; Magnevist, β = –1.28 [P < .01]; and Multihance, β = –1.89 [P < .01]; gadoterate meglumine was the reference contrast agent) as covariates that affect measured ECV values.
Coefficient of Variance of Native T1 and ECV and Sensitivity Analyses
The coefficients of variance of the pools of native T1 and ECV studies are shown in Table E3, A and B (online). The pooled coefficient of variance of all ECV studies was 0.12, which was higher than both the pooled coefficient of variance of native T1 at 1.5 T (coefficient of variance, 0.04) and at 3.0 T (coefficient of variance, 0.03).
Discussion
Our study comprehensively analyzed studies in the literature that measured native T1 and ECV in healthy adult participants. The mean native T1 was 976 msec (95% CI: 969, 983) at 1.5 T, and 1159 msec (95% CI: 1143, 1175) at 3.0 T. The difference in native T1 between 1.5 T and 3.0 T field strengths was expected because of the known dependence of T1 on magnetic field strength. For ECV, we found equal values at 1.5 T and 3.0 T (25.9% and 25.9%, respectively) with a mean value of 25.9% (95% CI: 25.6%, 26.2%). Given that ECV is proportional to the ratio of the gadolinium concentration in the myocardium to that of the blood-pool, which as a given field strength is proportional to the 1/T1 after contrast administration – 1/T1 before contrast administration of the myocardium and blood pools, respectively. These results suggest that pooled ECV values determined from current clinically available pulse sequences should be comparable between examinations performed at 1.5 T and 3.0 T.
We also determined the uncertainty in native T1 and ECV within the individual studies, as defined by the coefficient of variance. We found that the mean coefficient of variance of native T1 of studies performed at 1.5 T was 0.04 and the mean coefficient of variance of native T1 at 3.0 T was 0.03. For ECV, the coefficient of variance was similar at both field strengths with an average coefficient of variance of 0.12. Because the cohorts were composed of healthy participants, this finding is consistent with a higher precision for measuring native T1 compared with measuring ECV. The higher coefficient of variance of the ECV measurement results from propagation of the uncertainties of at least four T1 measurements and the hematocrit, which are used to calculate this parameter. The direct implication is that the greater coefficient of variance of ECV may require a larger relative change in ECV to detect differences between healthy participants and those with cardiac pathologic results.
There are a number of factors which likely contributed to the heterogeneity of T1 parameters between studies. One factor of particular interest was flip angle; a flip angle of 50° was associated with a lower native T1 value compared with a flip angle of 35°. The etiologic cause of this effect is due to differences in the effective T1 during steady-state free precession readouts, as well as potentially magnetization transfer effects that result in underestimation of native T1 at a higher flip angle (28). At 3.0 T, issues related to both B0 and B1 inhomogeneity could also be confounding factors. Further, the timing between inversion pulses, which affects the amount of signal recovery, and the assumption of full recovery between inversions can cause biases in T1 values, particularly at a higher heart rate where there may not be complete recovery between inversion pulses (28,29). There are also a number of patient-level covariates such as sex, age, and hematocrit that can affect the T1 measurements in individual participants.
Sex differences in native T1, particularly in women before menopause also need to be considered because, prior to menopause, women tend to have higher T1 values (24,30). MOLLI-based sequences are sensitive to a number of confounding factors which have been well described in the literature resulting in an underestimate of so-called true T1 as measured by standard techniques in phantoms (31). Whereas pulse sequences such as saturation recovery single-shot acquisition or saturation pulse prepared heart rate independent inversion recovery result in more accurate estimates of native T1, the relatively lower precision and lack of widespread implementation limited the prevalence of these techniques in the literature (32,33). Free breathing approaches could potentially overcome some of the precision issues enabling the use of these more accurate techniques, which are less sensitive to systematic variations (34).
In an effort to limit intra- and interpatient variability, it is important that individual institutions establish optimized protocols and sequence parameters for T1 mapping and minimize changes to these parameters over time; this is emphasized in the 2017 Society for Cardiovascular Magnetic Resonance parametric mapping guidelines (23). Regarding ECV, although this measurement is robust across field strengths, it is important that institutions use a consistent contrast agent, dosage, and postcontrast measurement time. Further, rather than accept ranges provided by vendors, local institutional control groups should be used to derive institution-specific reference ranges for native T1 and ECV values, which is also recommended in the Society for Cardiovascular Magnetic Resonance guidelines (23). Finally, phantom validation should be used to ensure the longitudinal stability of native T1 and ECV measurements, and to understand and quantify potential biases in multicenter trials (4,7).
As a result of the existing heterogeneity in native T1 and ECV measurements across imaging centers, a universal normal range cannot be determined. Despite this statistical heterogeneity, however, the relatively small absolute variations in T1 measurements and ECV should be considered when making clinical decisions. With further standardization of sequence parameters among sites and vendors, broader or at least sequence-vendor specific normal ranges could potentially be established.
There were several limitations to our study, a number of which are common to most meta-analyses and some that are unique to our study. There was nonuniform reporting of participant recruitment methods and data, and, likewise, details of all pulse sequence parameters and how they may have varied between scans were not available for analysis. There was only sufficient data to investigate for vendor-specific differences between Philips and Siemens scanners and, similarly, we chose to only include studies that used MOLLI and shortened MOLLI as the pulse sequence scheme because of the dearth of other schemes in the literature. It is possible that by excluding other vendors and pulse sequences we have artificially decreased the measured heterogeneity of the data. However, the vast majority of the studies reported in the literature used a MOLLI-based pulse sequence, and thus this meta-analysis provided an assessment of the variability by using these clinically available pulse sequences. Data from other pulse sequences and vendors is included in the supplemental information for completeness (Table E4 [online]). Because of nonuniform reporting, we could not specifically analyze covariates, such as heart rate, which may be of interest because some pulse sequences have potential heart rate dependence for acquisition of native T1 (29). Further, T1 values could not be assessed on a per-subject basis because only study-level covariates were available for analysis. These covariates all likely contribute to the residual heterogeneity that was present despite subgroup analyses and metaregression analysis.
It is important to recognize that I 2 simply indicates that observed heterogeneity is real; it should not be used to determine whether or not the observed heterogeneity is clinically relevant (31,35). Whether or not the differences appreciated between studies represents a clinically significant difference is yet to be determined. Nonetheless, the observed degree of heterogeneity in this study precludes the derivation of a universal normal range for native T1 and ECV from the current data in the literature. An important caveat is that a study-level meta-analysis provides an estimate and 95% CI of the pooled mean, but cannot define the “normal range” for native T1 and ECV, which would require patient-level data (35). Notably, a significant majority of studies had small sample sizes, most less than 50 participants and almost all fewer than 100 participants. It is unclear how relevant traditional measures of publication bias, which are geared at identifying a relationship between effect size and likelihood of publication, are to meta-analysis of healthy participants. In this study, which was systematic review of control groups, it seems unlikely that individual studies would be more or less likely to be published on the basis of the mean native T1 or ECV value of the control group.
We determined the mean native T1 and ECV at 1.5 T and 3.0 T by using data abstracted from over 100 articles in a comprehensive analysis of the current T1 mapping literature. Our analysis revealed a small coefficient of variance and relatively small range of differences in native T1 and ECV across studies. Whereas there was heterogeneity in the measured native T1 and ECV, a portion of this heterogeneity was explained by population demographics and cardiac MRI covariates including field strength, vendor, pulse sequence, and flip angle. Of note, there was no relationship between date of publication and native T1 or ECV. Our analysis highlights the importance of fixed T1 mapping protocols and pulse sequence parameters in the minimization of intra- and interpatient variability and strongly supports the derivation of local reference ranges of native T1 and ECV at individual institutions to guide clinical decision making. The implications of this meta-analysis strongly align with the current Society for Cardiovascular Magnetic Resonance guidelines for parametric mapping (23). Finally, our analysis highlights the paramount importance of standardizing cardiac MRI protocols across imaging centers to reduce heterogeneity and facilitate the development of standardized normal ranges, which will broaden the clinical effect of T1 and ECV measurements.
APPENDIX
Acknowledgments
Acknowledgment
The authors acknowledge Caroline Flournoy, PhD, for her assistance with the initial literature search.
Study supported by Siemens Medical Solutions and the National Institutes of Health (5T32 EB003841, K23 HL112910, R01 HL079110, R01 HL131919).
Disclosures of Conflicts of Interest: M.G. disclosed no relevant relationships. C.M.K. Activities related to the present article: disclosed no relevant relationships. Activities not related to the present article: disclosed money paid to author by Abbott and Bayer for consultancy; disclosed money to author’s institution for grants or grants pending from Regeneron and Biotelemetry. Other relationships: disclosed no relevant relationships. M.S. Activities related to the present article: disclosed no relevant relationships. Activities not related to the present article: disclosed grants/grants pending from Astra Zeneca; disclosed money paid to author’s institution from Siemens Healthcare for lectures; disclosed money paid to author for multiple patents related to MRI techniques that are licensed to Siemens. Other relationships: disclosed no relevant relationships.
Abbreviations:
- CI
- confidence interval
- ECV
- extracellular volume
- MOLLI
- modified Look-Locker inversion recovery
References
- 1.Messroghli DR, Radjenovic A, Kozerke S, Higgins DM, Sivananthan MU, Ridgway JP. Modified Look-Locker inversion recovery (MOLLI) for high-resolution T1 mapping of the heart. Magn Reson Med 2004;52(1):141–146. [DOI] [PubMed] [Google Scholar]
- 2.Messroghli DR, Greiser A, Fröhlich M, Dietz R, Schulz-Menger J. Optimization and validation of a fully-integrated pulse sequence for modified look-locker inversion-recovery (MOLLI) T1 mapping of the heart. J Magn Reson Imaging 2007;26(4):1081–1086. [DOI] [PubMed] [Google Scholar]
- 3.Ugander M, Oki AJ, Hsu LY, et al. Extracellular volume imaging by magnetic resonance imaging provides insights into overt and sub-clinical myocardial pathology. Eur Heart J 2012;33(10):1268–1278. [DOI] [PMC free article] [PubMed] [Google Scholar]
- 4.Moon JC, Messroghli DR, Kellman P, et al. Myocardial T1 mapping and extracellular volume quantification: a Society for Cardiovascular Magnetic Resonance (SCMR) and CMR Working Group of the European Society of Cardiology consensus statement. J Cardiovasc Magn Reson 2013;15(1):92–103. [DOI] [PMC free article] [PubMed] [Google Scholar]
- 5.Salerno M, Kramer CM. Advances in parametric mapping with CMR imaging. JACC Cardiovasc Imaging 2013;6(7):806–822. [DOI] [PMC free article] [PubMed] [Google Scholar]
- 6.Kramer CM, Chandrashekhar Y, Narula J. T1 mapping by CMR in cardiomyopathy: a noninvasive myocardial biopsy? JACC Cardiovasc Imaging 2013;6(4):532–534. [DOI] [PubMed] [Google Scholar]
- 7.Kramer CM, Chandrashekhar Y, Narula J. The tissue issue: T1 mapping and the myocardium. JACC Cardiovasc Imaging 2016;9(1):88–90. [DOI] [PubMed] [Google Scholar]
- 8.Haaf P, Garg P, Messroghli DR, Broadbent DA, Greenwood JP, Plein S. Cardiac T1 mapping and extracellular volume (ECV) in clinical practice: a comprehensive review. J Cardiovasc Magn Reson 2016;18(1):89–100. [DOI] [PMC free article] [PubMed] [Google Scholar]
- 9.Yilmaz A, Kindermann I, Kindermann M, et al. Comparative evaluation of left and right ventricular endomyocardial biopsy: differences in complication rate and diagnostic performance. Circulation 2010;122(9):900–909. [DOI] [PubMed] [Google Scholar]
- 10.Dass S, Suttie JJ, Piechnik SK, et al. Myocardial tissue characterization using magnetic resonance noncontrast t1 mapping in hypertrophic and dilated cardiomyopathy. Circ Cardiovasc Imaging 2012;5(6):726–733. [DOI] [PubMed] [Google Scholar]
- 11.Duca F, Kammerlander AA, Zotter-Tufaro C, et al. Interstitial fibrosis, functional status, and outcomes in heart failure with preserved ejection fraction: insights from a prospective cardiac magnetic resonance imaging study. Circ Cardiovasc Imaging 2016;9(12):e005277. [DOI] [PubMed] [Google Scholar]
- 12.Görmeli CA, Özdemir ZM, Kahraman AS, Yağmur J, Özdemir R, Çolak C. The evaluation of non-ischemic dilated cardiomyopathy with T1 mapping and ECV methods using 3T cardiac MRI. Radiol Med (Torino) 2017;122(2):106–112. [DOI] [PubMed] [Google Scholar]
- 13.Ho CY, Abbasi SA, Neilan TG, et al. T1 measurements identify extracellular volume expansion in hypertrophic cardiomyopathy sarcomere mutation carriers with and without left ventricular hypertrophy. Circ Cardiovasc Imaging 2013;6(3):415–422. [DOI] [PMC free article] [PubMed] [Google Scholar]
- 14.Karamitsos TD, Piechnik SK, Banypersad SM, et al. Noncontrast T1 mapping for the diagnosis of cardiac amyloidosis. JACC Cardiovasc Imaging 2013;6(4):488–497. [DOI] [PubMed] [Google Scholar]
- 15.Kidambi A, Motwani M, Uddin A, et al. Myocardial extracellular volume estimation by CMR predicts functional recovery following acute MI. JACC Cardiovasc Imaging 2017;10(9):989–999. [DOI] [PMC free article] [PubMed] [Google Scholar]
- 16.Kuruvilla S, Janardhanan R, Antkowiak P, et al. Increased extracellular volume and altered mechanics are associated with LVH in hypertensive heart disease, not hypertension alone. JACC Cardiovasc Imaging 2015;8(2):172–180. [DOI] [PMC free article] [PubMed] [Google Scholar]
- 17.Lehrke S, Lossnitzer D, Schöb M, et al. Use of cardiovascular magnetic resonance for risk stratification in chronic heart failure: prognostic value of late gadolinium enhancement in patients with non-ischaemic dilated cardiomyopathy. Heart 2011;97(9):727–732. [DOI] [PubMed] [Google Scholar]
- 18.Leong DP, Chakrabarty A, Shipp N, et al. Effects of myocardial fibrosis and ventricular dyssynchrony on response to therapy in new-presentation idiopathic dilated cardiomyopathy: insights from cardiovascular magnetic resonance and echocardiography. Eur Heart J 2012;33(5):640–648. [DOI] [PubMed] [Google Scholar]
- 19.Rommel KP, Lücke C, Lurz P. Diagnostic and prognostic value of CMR T1-mapping in patients with heart failure and preserved ejection fraction. Rev Esp Cardiol (Engl Ed) 2017;70(10):848–855. [DOI] [PubMed] [Google Scholar]
- 20.Su MY, Lin LY, Tseng YH, et al. CMR-verified diffuse myocardial fibrosis is associated with diastolic dysfunction in HFpEF. JACC Cardiovasc Imaging 2014;7(10):991–997. [DOI] [PubMed] [Google Scholar]
- 21.Wong TC, Piehler K, Meier CG, et al. Association between extracellular matrix expansion quantified by cardiovascular magnetic resonance and short-term mortality. Circulation 2012;126(10):1206–1216. [DOI] [PMC free article] [PubMed] [Google Scholar]
- 22.Youn JC, Hong YJ, Lee HJ, et al. Contrast-enhanced T1 mapping-based extracellular volume fraction independently predicts clinical outcome in patients with non-ischemic dilated cardiomyopathy: a prospective cohort study. Eur Radiol 2017;27(9):3924–3933. [DOI] [PubMed] [Google Scholar]
- 23.Messroghli DR, Moon JC, Ferreira VM, et al. Clinical recommendations for cardiovascular magnetic resonance mapping of T1, T2, T2* and extracellular volume: A consensus statement by the Society for Cardiovascular Magnetic Resonance (SCMR) endorsed by the European Association for Cardiovascular Imaging (EACVI). J Cardiovasc Magn Reson 2017;19(1):75–98. [DOI] [PMC free article] [PubMed] [Google Scholar]
- 24.Liu CY, Liu YC, Wu C, et al. Evaluation of age-related interstitial myocardial fibrosis with cardiac magnetic resonance contrast-enhanced T1 mapping: MESA (Multi-Ethnic Study of Atherosclerosis). J Am Coll Cardiol 2013;62(14):1280–1287. [DOI] [PMC free article] [PubMed] [Google Scholar]
- 25.Cha MJ, Kim SM, Kim HS, Kim Y, Choe YH. Association of cardiovascular risk factors on myocardial perfusion and fibrosis in asymptomatic individuals: cardiac magnetic resonance study. Acta Radiol 2018 Jan 1 [Epub ahead of print]. [DOI] [PubMed] [Google Scholar]
- 26.Liu JM, Liu A, Leal J, et al. Measurement of myocardial native T1 in cardiovascular diseases and norm in 1291 subjects. J Cardiovasc Magn Reson 2017;19(1):74–83. [DOI] [PMC free article] [PubMed] [Google Scholar]
- 27.Moher D, Liberati A, Tetzlaff J, Altman DG; PRISMA Group . Preferred reporting items for systematic reviews and meta-analyses: the PRISMA Statement. Open Med 2009;3(3):e123–e130. [PMC free article] [PubMed] [Google Scholar]
- 28.Kellman P, Hansen MS. T1-mapping in the heart: accuracy and precision. J Cardiovasc Magn Reson 2014;16(1):2–21. [DOI] [PMC free article] [PubMed] [Google Scholar]
- 29.Gai ND, Stehning C, Nacif M, Bluemke DA. Modified Look-Locker T1 evaluation using Bloch simulations: human and phantom validation. Magn Reson Med 2013;69(2):329–336. [DOI] [PMC free article] [PubMed] [Google Scholar]
- 30.Piechnik SK, Ferreira VM, Lewandowski AJ, et al. Normal variation of magnetic resonance T1 relaxation times in the human population at 1.5 T using ShMOLLI. J Cardiovasc Magn Reson 2013;15(1):13–23. [DOI] [PMC free article] [PubMed] [Google Scholar]
- 31.Vo HQ, Marwick TH, Negishi K. MRI-derived myocardial strain measures in normal subjects. JACC Cardiovasc Imaging 2018;11(2 Pt 1):196–205. [DOI] [PubMed] [Google Scholar]
- 32.Weingärtner S, Meßner NM, Budjan J, et al. Myocardial T1-mapping at 3T using saturation-recovery: reference values, precision and comparison with MOLLI. J Cardiovasc Magn Reson 2016;18(1):84–92. [DOI] [PMC free article] [PubMed] [Google Scholar]
- 33.Chow K, Flewitt JA, Green JD, Pagano JJ, Friedrich MG, Thompson RB. Saturation recovery single-shot acquisition (SASHA) for myocardial T(1) mapping. Magn Reson Med 2014;71(6):2082–2095. [DOI] [PubMed] [Google Scholar]
- 34.Chow K, Yang Y, Shaw P, Kramer CM, Salerno M. Robust free-breathing SASHA T1 mapping with high-contrast image registration. J Cardiovasc Magn Reson 2016;18(1):47–60. [DOI] [PMC free article] [PubMed] [Google Scholar]
- 35.Salerno M. Feature tracking by CMR: A “double feature”? JACC Cardiovasc Imaging 2018;11(2 Pt 1):206–208. [DOI] [PubMed] [Google Scholar]
Associated Data
This section collects any data citations, data availability statements, or supplementary materials included in this article.