Defective viral genomes (DVGs) generated during Sendai virus infections accumulate in the cytoplasm of some infected cells and stimulate antiviral immunity and cell survival. DVGs are packaged and released as defective particles and have a significant impact on infection outcome. We show that the subpopulation of DVG-high cells poorly engages the virus packaging and budding machinery and do not effectively produce viral particles. In contrast, cells enriched in full-length genomes are the primary producers of both standard and defective viral particles during infection. This study demonstrates heterogeneity in the molecular interactions occurring within infected cells and highlights distinct functional roles for cells as either initiators of immunity or producers and perpetuators of viral particles depending on their content of viral genomes and their intracellular localization.
KEYWORDS: defective interfering particles, defective viral genomes, infection heterogeneity, paramyxovirus, particle production
ABSTRACT
Defective viral genomes (DVGs) generated during RNA virus replication determine infection outcome by triggering innate immunity, diminishing virulence, and, in many cases, facilitating the establishment of persistent infections. Despite their critical role during virus-host interactions, the mechanisms regulating the production and propagation of DVGs are poorly understood. Visualization of viral genomes using RNA fluorescent in situ hybridization revealed a striking difference in the intracellular localization of DVGs and full-length viral genomes during infections with the paramyxovirus Sendai virus. In cells enriched in full-length virus, viral genomes clustered in a perinuclear region and associated with cellular trafficking machinery, including microtubules and the GTPase Rab11a. However, in cells enriched in DVGs, defective genomes distributed diffusely throughout the cytoplasm and failed to interact with this cellular machinery. Consequently, cells enriched in full-length genomes produced both DVG- and full-length-genome-containing viral particles, while DVG-high cells poorly produced viral particles yet strongly stimulated antiviral immunity. These findings reveal the selective production of both standard and DVG-containing particles by a subpopulation of infected cells that can be differentiated by the intracellular localization of DVGs. This study highlights the importance of considering this functional heterogeneity in analyses of virus-host interactions during infection.
IMPORTANCE Defective viral genomes (DVGs) generated during Sendai virus infections accumulate in the cytoplasm of some infected cells and stimulate antiviral immunity and cell survival. DVGs are packaged and released as defective particles and have a significant impact on infection outcome. We show that the subpopulation of DVG-high cells poorly engages the virus packaging and budding machinery and do not effectively produce viral particles. In contrast, cells enriched in full-length genomes are the primary producers of both standard and defective viral particles during infection. This study demonstrates heterogeneity in the molecular interactions occurring within infected cells and highlights distinct functional roles for cells as either initiators of immunity or producers and perpetuators of viral particles depending on their content of viral genomes and their intracellular localization.
INTRODUCTION
Defective viral genomes (DVGs) are replication-defective viral products generated during viral infections. DVGs have been identified across all viral families in the Mononegavirales, as well as in orthomyxoviruses and positive-sense RNA viruses (1–6). Defective genomes, specifically copyback DVGs (cbDVGs) formed during the replication of Mononegavirales, are critical modulators of virus-host interactions (7–9). cbDVGs are the primary immunostimulatory molecules during infection, both in vitro and in vivo, and stimulate a cellular prosurvival program that facilitates the establishment of persistent infections (8, 10–12). Additionally, DVGs occur in natural infections in humans, likely impacting the infection outcome (1, 13). However, despite their critical role during virus-host interactions, the mechanisms regulating DVG production and propagation are poorly understood.
cbDVGs are thought to be generated when the viral polymerase detaches from the antigenomic RNA template and rejoins to copy the nascent strand (14). As cbDVGs are flanked by the strongly favored antigenomic promoter, they are amplified to high levels during infection (15). In addition to being endogenously generated from full-length (FL) virus within infected cells, DVGs can be transmitted from cell to cell by the packaging of DVGs into DVG-containing particles (DPs). The presence of DPs within viral stocks amplified in the laboratory is nearly ubiquitous, and for decades, it has been assumed that all infected cells produce DPs upon reaching a high titer of virus replication (16–23). However, we have reported remarkable heterogeneity in the accumulation of DVGs within a subset of cells during infection with the model paramyxovirus Sendai virus (SeV). This heterogeneity is associated with distinct functions of the DVG-high cell population, including the induction of antiviral immunity (8, 11, 24) and the facilitation of viral persistence via the induction of a prosurvival cellular program (12). In contrast, cells containing low levels of or no DVGs had a negligible contribution to these processes. This evidence, together with recent evidence of heterogeneity in both viral replication and particle production of other RNA viruses (25–29), led us to investigate how DVGs impacted the production of both DPs and standard viral particles.
RNA viruses rely on host cell machinery during their life cycle, including during particle assembly and egress. For paramyxoviruses, transport of viral ribonucleoprotein complexes (vRNPs) from within the host cell cytoplasm to the cell membrane occurs via the recycling endosome pathway. In this process, vRNPs bind to Rab11a-marked recycling endosomes associated with microtubules (30–35). This pathway provides a controlled mechanism for virus assembly at the host cell membrane and is followed by virus egress.
Using RNA fluorescent in situ hybridization (RNA-FISH), which allows us to distinguish defective and FL viral genomes within infected cells, we discovered that in addition to heterogeneity in the amount of DVGs among infected cells, viral genomes localized to different intracellular spaces in DVG-high and FL-high cells. Importantly, this differential localization critically impacted the ability of vRNPs to interact with the cellular machinery used to produce viral particles. As a result, DVG-high cells had a drastically reduced production of both standard and defective viral particles compared to FL-high cells. This study reveals two functionally distinct populations during SeV infection that can be distinguished by the amount and intracellular localization of DVGs. In addition, together with reported evidence of a critical role for DVGs in driving innate immunity, this study highlights the critical importance of considering the remarkable division of labor among infected cells in the study of virus-host interactions.
RESULTS
DVGs alter the intracellular distribution of vRNPs during infection.
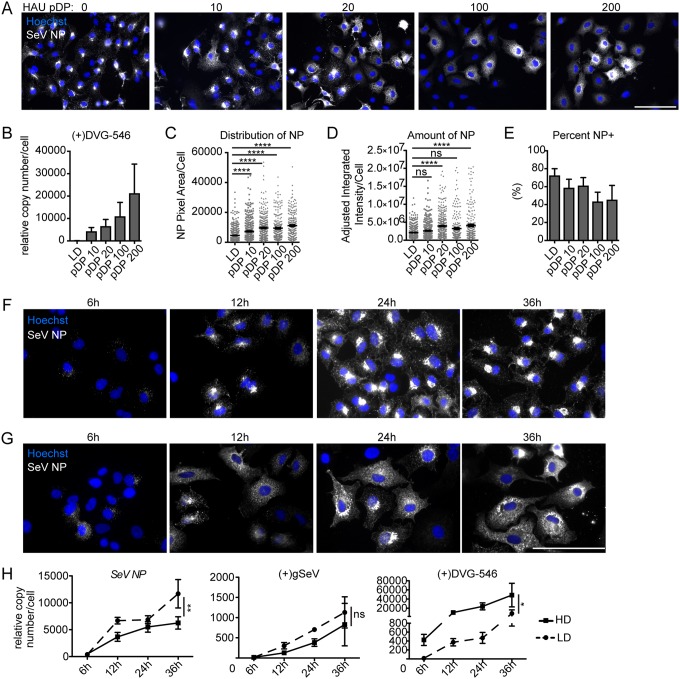
To investigate if the presence of DVGs altered the interactions of vRNPs with cellular components, we first assessed whether DVGs changed the localization of vRNPs in infected cells. To do this, we infected cells with stocks of SeV strain Cantell depleted of DVGs or with SeV low-DVG (SeV-LD) at a multiplicity of infection (MOI) of 1.5 TCID50 (50% tissue culture infective doses)/cell (3 hemagglutinating units [HAU] per 5 × 10⁵ cells) and supplemented the infections with increasing HAU doses of purified DPs containing SeV Cantell DVGs (Fig. 1A to E). The Sendai virus Cantell strain naturally produces one specific DVG that is 546 nucleotides (nt) long, making this an ideal system for identifying DVGs by PCR (7, 8). We measured the levels of DVG-546 in infected cells by reverse transcription-quantitative PCR (RT-qPCR) and found that the amount of DVG-546 increased corresponding to higher doses of DPs, as expected (Fig. 1B). Since viral RNA is associated with nucleoprotein (NP) to form vRNPs (36), visualization of NP was used as an initial proxy for vRNPs. Using a stock of virus with low contents of DVGs (SeV-LD) in the absence of additional purified DPs (pDP HAU 0), we noted that NP accumulates in a perinuclear region of the infected cell. However, upon the addition of increasing doses of DPs during infection, there was a dose-dependent increase in the number of cells that displayed cytoplasmic and diffuse NP staining with a corresponding loss of cells that had predominantly perinuclear NP (Fig. 1A). To quantify these differences, we assessed the size of the area occupied by NP per infected cell and determined that NP became more spread out throughout the cell cytoplasm with increasing amounts of DVGs (Fig. 1C). Importantly, we also used immunofluorescence to quantify the amount of NP within infected cells and determined that the presence of DVGs did not decrease the amount of NP within infected cells when imaged on a per-cell basis (Fig. 1D). However, the number of cells that were productively infected decreased significantly with the addition of increasing amounts of DPs (Fig. 1E), likely explaining the reported reduction in NP production in cell populations infected in the presence of DVGs (8).
FIG 1.
Defective viral genomes alter viral nucleoprotein distribution within infected cells. (A) A549 cells infected with SeV-LD at an MOI of 1.5 TCID50/cell supplemented with purified DPs (pDP) at the indicated HAU for 24 h and stained for SeV NP (gray). Wide-field images were captured with a 40× objective. Images are representative of results from 3 independent experiments. Bar = 100 μm. (B) RT-qPCR of SeV (+)DVG-546 relative to GAPDH. (C) Distribution of NP by pixel area within individual cells at 24 h postinfection. (D and E) Quantification of SeV NP amounts by fluorescence intensity (D) and percentage of cells per field that are NP positive (NP+) as determined by the level of fluorescence above the background (E). Results show the sum of data from 3 independent experiments with >250 individual cells analyzed under each condition. Individual cells are plotted with a line at the mean, and error bars represent standard errors of the means (SEM). ****, P < 0.0001 by a Kruskal-Wallis test with Dunn’s multiple-comparison test. ns, not significant. (F and G) A549 cells infected with SeV-LD (F) and SeV-HD (G) for the indicated times and stained for SeV NP (gray). Wide-field images were captured with a 63× objective. Images are representative of data from four independent experiments. Bar = 100 μm. (H) RT-qPCR for SeV NP, (+)gSeV, and (+)DVG-546 relative to GAPDH. Data are represented as means ± SEM from three independent experiments, **, P < 0.005; *, P < 0.05 by two-way analysis of variance (ANOVA), with significance indicated between viral infections.
Next, we examined the localization of SeV NP in the presence of DVGs over time. To do this, we infected cells with SeV-LD (Fig. 1F) or with SeV containing DVGs at levels similar to those of SeV-LD + pDP HAU 20 SeV high-DVG (SeV-HD) and compared NP distributions. Distinct intracellular distributions were seen starting at 12 h, when NP accumulated to detectable levels. At this time point, in cells infected with SeV-LD, NP began to uniformly accumulate in a perinuclear region. This distribution was maintained until at least 36 h postinfection (Fig. 1F). In contrast, SeV-HD infections demonstrated heterogeneity in the distribution of NP throughout the time points analyzed (Fig. 1G). As expected for bulk population analysis, HD infections showed lower levels of FL genomes and SeV NP mRNA and higher levels of DVGs than LD infections (Fig. 1H), although, as mentioned above, bulk population analysis may confound the interpretation of these data, artificially lowering the values of SeV NP levels on a per-cell basis. These data demonstrate that the presence of DVGs during infection alters the intracellular distribution of NP independent of changes in its transcription.
DVGs and full-length genomes localize disparately in infected cells.
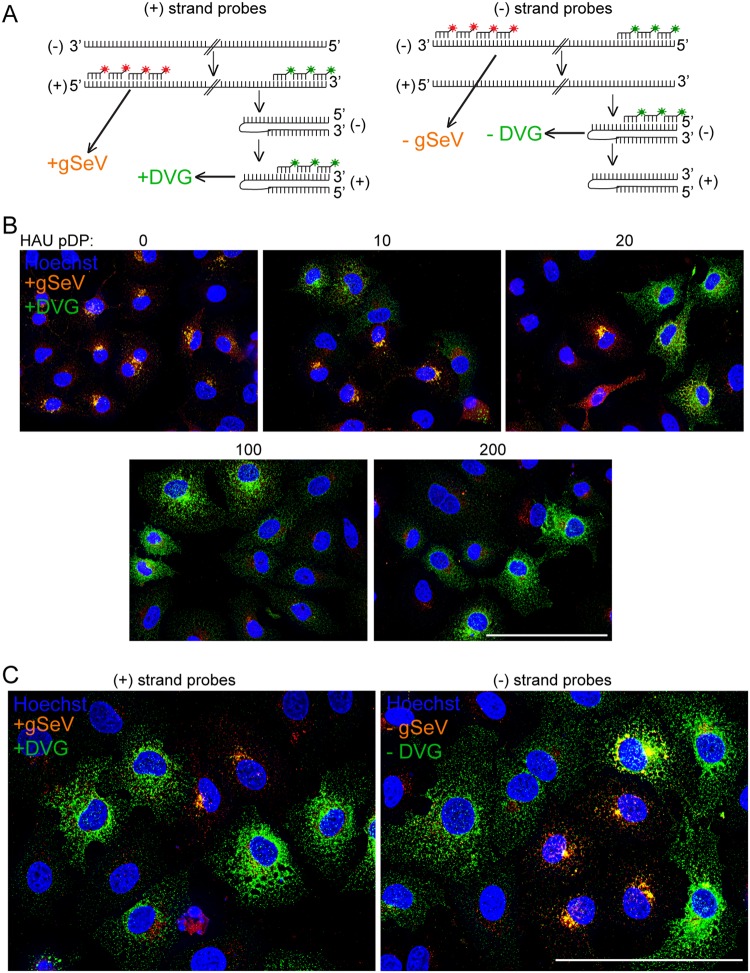
Because the addition of DPs to viral infections altered the intracellular localization of viral NP, we next investigated and differentiated the intracellular distributions of DVG-containing vRNPs and FL genome-containing vRNPs using RNA fluorescent in situ hybridization (RNA-FISH). Probes targeting the 5′ end of the positive-sense genome, colored red, and probes targeting the 3′ end of the positive-sense genome, pseudocolored green, were used to distinguish DVGs in green and FL viral genomes, annotated as genomic SeV or gSeV, in orange (hybridizing both red and green probes), as we described previously (12) (Fig. 2A). RNA-FISH of cells infected with SeV-LD or SeV-LD plus increasing amounts of purified DPs confirmed that FL genomes and DVGs accumulate in different cells and that their intracellular distributions are distinct (Fig. 2B). In SeV-LD infections, FL genomes were clustered in a perinuclear region, and the addition of DPs resulted in the appearance of DVG-high cells with DVGs present throughout the cytoplasm. As the amount of DPs added to an infection increased, the number of FL-high cells decreased, while the number of DVG-high cells with cytoplasmically distributed DVGs increased.
FIG 2.
FL genomes accumulate in a perinuclear region, while DVGs are distributed throughout the cytoplasm. (A) Schematic of positive- and negative-sense probe sets binding to SeV genomes and antigenomes. For positive-sense FISH, probes targeting the 5′ end of the positive-sense genome are shown in red, and probes targeting the 3′ end of the positive-sense genome are shown in green, interpreted as +gSeV (orange) and +DVG (green). For negative-sense FISH, probes targeting the 3′ end of the negative-sense genome are shown in red, and probes targeting the 5′ end of the negative-sense genome are shown in green, interpreted as −gSeV (orange) and −DVG (green). (B) A549 cells infected with SeV-LD at an MOI of 1.5 TCID50/cell supplemented with purified DPs at the indicated HAU for 24 h followed by positive-sense viral RNA-FISH. Wide-field images were captured with a 40×, objective. Images are representative of results from 3 independent experiments. Deconvolved, extended focus images are shown. Bar = 100 μm. (C) A549 cells infected with SeV-HD for 24 h and then subjected to positive-sense viral RNA-FISH or negative-sense viral RNA-FISH. A 63× wide-field, deconvolved, extended focus is shown. Images are representative of results from three independent experiments. Bar = 100 μm.
Because probes targeting positive-sense viral RNA may also hybridize to mRNA, a set of probes targeting the negative-sense genome was used to confirm the distinct distribution of DVGs and FL genomes in the absence of mRNA labeling. Probes targeting the 3′ end of the negative-sense genome, colored red, and probes targeting the 5′ end of the negative-sense genome, pseudocolored green, were used to distinguish DVGs in green and FL viral genomes in orange (hybridizing both red and green probes) (Fig. 2A). During infection with SeV-HD, positive-strand probes identified a heterogeneous population of cells, those that accumulate viral genomes in a perinuclear region and those that accumulate DVGs diffusely in the cytoplasm, similar to what was observed in infections with SeV-LD plus DPs (Fig. 2B and C). Infections with SeV-HD generate distinct subpopulations comprising ∼30% DVG-high cells and 30% FL-high cells in A549 cells at 24 h postinfection. Similarly, negative-strand probes identified perinuclear viral genomes and cytoplasmic DVGs (Fig. 2C), indicating that the observed disparate distributions apply to viral genomes regardless of their sense.
Cytoplasmic distribution of DVGs is independent of their size or sequence.
In order to address whether the cytoplasmic distribution of DVGs was due to properties of the viral genomes, we asked whether this distribution was unique to SeV Cantell DVGs. This virus strain produces a single 546-nt-long cbDVG that is strongly immunostimulatory (7, 11, 24). Other strains of SeV produce cbDVGs of different lengths and sequences, and their immunostimulatory activities vary (7, 8). SeV-52 produces larger and less-immunostimulatory DVGs than SeV Cantell. We generated a stock of SeV-52 enriched with DVGs (SeV-52-HD) by passaging the parental strain undiluted in eggs. This stock had two major DVGs, both longer than DVG-546, and are visible as two larger amplicons when amplified with a common set of primers (Fig. 3A). Infections with SeV-52-HD revealed a cytoplasmic distribution of DVGs similar to that of SeV Cantell infections (Fig. 3B), indicating that the differential distribution of FL genomes and DVGs is common to multiple cbDVG types and is independent of size or sequence.
FIG 3.
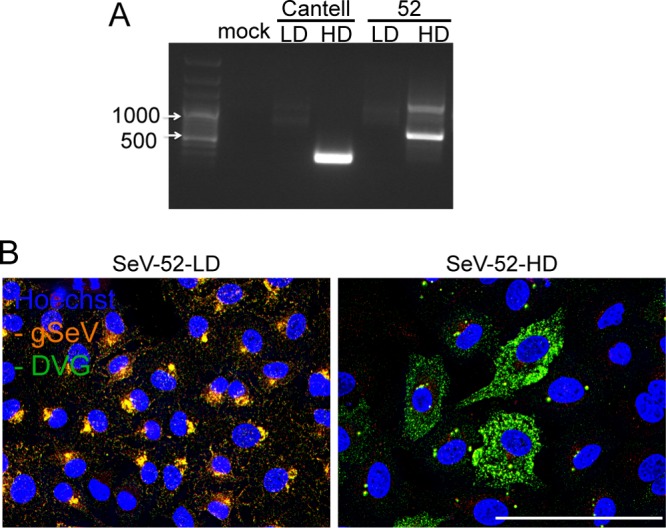
Different species of SeV DVGs are cytoplasmically distributed. A549 cells were infected with the indicated virus for 24 h. (A) Agarose gel electrophoresis of PCR amplification of DVGs using common primers targeting all copyback DVGs. (B) A549 cells infected with SeV-52-LD or -HD and then subjected to negative-sense viral RNA-FISH. Wide-field images were captured with a 63× objective. Deconvolved, extended focus is shown. Images are representative of results from three independent experiments. Bar = 50 μm.
Cytoplasmic diffusively distributed DVG RNPs do not interact with the Rab11a/microtubule intracellular trafficking machinery.
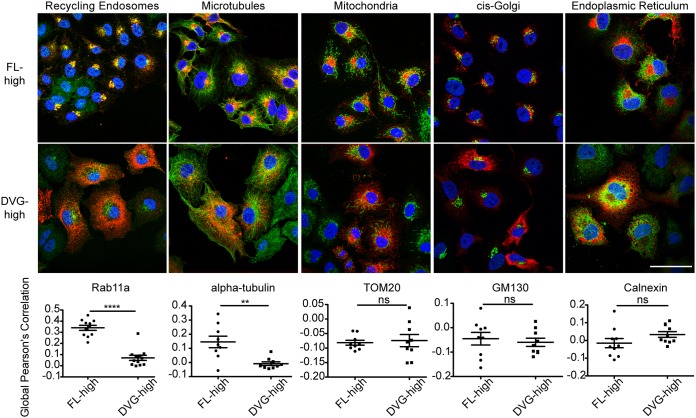
vRNPs from paramyxoviruses and orthomyxoviruses interact with Rab11a and utilize microtubules to facilitate particle production (37). To test whether SeV DVGs and FL genomes interacted similarly with this intracellular trafficking machinery, we performed immunofluorescence analysis for SeV NP as a proxy for vRNPs in conjunction with antibodies (Abs) targeting a variety of cellular organelles and cytoskeletal components in FL-high cells or DVG-high cells. FL-high cells (shown as cells with perinuclearly distributed NP) showed strong colocalization of vRNPs with Rab11a and microtubules. However, DVG-high cells (cells with cytoplasmically distributed NP) showed almost no colocalization between SeV NP and Rab11a or microtubules (Fig. 4). These data suggest that vRNPs in DVG-high cells do not interact with the host intracellular trafficking machinery in the same manner as in FL-high cells. Furthermore, cytoplasmically distributed NP did not colocalize with mitochondria, the cis-Golgi network, or the endoplasmic reticulum (Fig. 4), indicating that DVG RNPs are likely not tethered to organelles within the cytoplasm. To further confirm that DVG RNPs do not interact with Rab11a in DVG-high cells, we used combined immunofluorescence and RNA-FISH on cells infected with SeV-HD to identify vRNPs and Rab11a in FL-high and DVG-high cells (Fig. 5A). For analysis, cells were binned as DVG-high or FL-high depending on their ratio of the negative-sense 5′ probe to the 3′ probe signal intensity, and global Pearson’s correlation of colocalization was assessed between Rab11a and the 5′ end of the negative-sense genome [5′ (-)SeV] for individual cells (Fig. 5B). Similarly to what was observed when tracking NP (Fig. 4), data indicate that within an infection in the presence of DVGs, viral genomes in the subpopulation of FL-high cells containing perinuclearly localized vRNPs interact with Rab11a, but in DVG-high cells with DVG RNPs distributed throughout the cytoplasm, there is no significant colocalization of RNPs with Rab11a.
FIG 4.
SeV NP colocalizes with Rab11a and microtubules in FL-high cells but not in DVG-high cells. A549 cells were infected with SeV-LD or SeV-HD for 24 h. Cells were fixed and subjected to immunofluorescence analysis for the viral protein SeV NP (red) and Rab11a (recycling endosomes), α-tubulin (microtubules), TOM20 (mitochondria), GM130 (cis-Golgi network), or calnexin (endoplasmic reticulum) (all in green). Confocal images were captured with a 100× objective. A single plane is shown. SeV-LD infection was used to capture FL-high cells, and DVG-high cells were captured from SeV-HD infection focusing on fields with cells containing a majority cytoplasmically distributed SeV NP. Bar = 50 μm. Global Pearson’s correlation was quantified by field for 3 independent experiments, with >5 fields per experiment. **, P < 0.005; ****, P < 0.0001 by Student’s t test.
FIG 5.
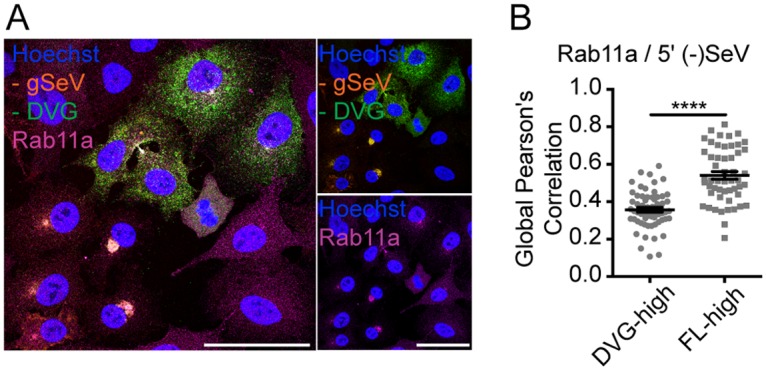
DVG-high cells show less colocalization with Rab11a than FL-high cells. (A) Immunofluorescence for Rab11a (magenta) with negative-sense viral RNA-FISH of A549 cells infected with SeV-HD for 24 h. Confocal images were captured with a 63× objective. Deconvolved, extended-focus images are shown. Bar = 50 μm. Single-channel images of Rab11a (bottom) and RNA-FISH (top) are shown to the right. (B) Global Pearson’s colocalization between Rab11a and the 5′ end of the genome quantified per cell for 3 independent experiments, with 5 fields per experiment. Cells were binned as DVG+ or FL+ based on the ratio of the 5′/3′ probe intensity. Individual cells are plotted with a line at the mean, and error bars represent SEM. ****, P < 0.0001 by a Mann-Whitney nonparametric U test.
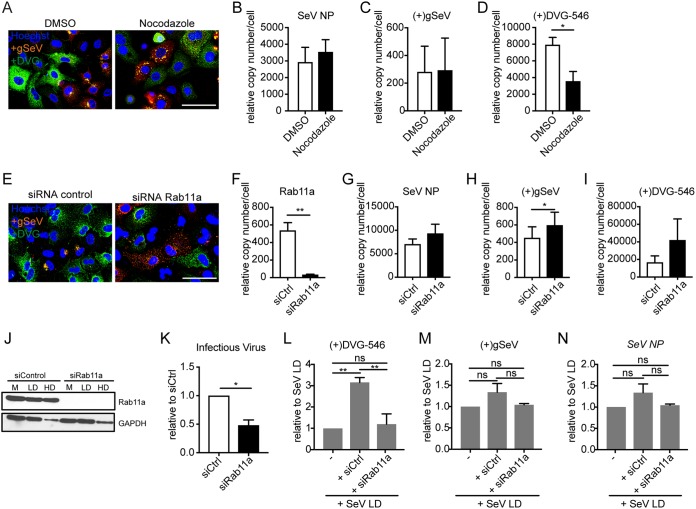
To next investigate whether the colocalization of vRNPs with the microtubule/Rab11a machinery indicated functional interactions, we first disrupted microtubule polymerization and tested if the localization of viral genomes changed. To disrupt microtubules, cells were infected with SeV-HD for 4 h to allow for virus entry and then treated with the microtubule-disrupting drug nocodazole. RNA-FISH was performed at 24 h postinfection to assess viral genome distribution (Fig. 6A). Nocodazole disrupted the localization of FL genomes in FL-high cells, in agreement with their colocalization with microtubules, but did not alter the localization of DVGs in DVG-high cells. FL genomes redistributed to discrete cytoplasmic clusters, while DVGs remained diffused throughout the cytoplasm, indicating that they were not tethered to microtubules. Levels of SeV NP transcripts (Fig. 6B) and genomic SeV RNA (Fig. 6C) did not change upon nocodazole treatment, confirming that intracellular viral replication was not affected by the drug; however, DVG replication levels were reduced upon nocodazole treatment (Fig. 6C), potentially due to the effects of nocodazole on tubulin, which has been shown to influence SeV genomic and DVG RNA replication (38). Furthermore, when cells depleted of Rab11a by small interfering RNA (siRNA) knockdown were infected with SeV-HD for 24 h, FL genomes failed to localize to the perinuclear region and instead distributed throughout the cytoplasm, while the distribution of DVGs remained the same (Fig. 6E). Rab11a knockdown was confirmed by testing for mRNA levels (Fig. 6F) and protein expression using Western blotting (Fig. 6J). Viral replication was equivalent or increased in knockdown cells, likely due to impaired particle production and the consequent accumulation of viral genomes and DVGs in the cell (Fig. 6G to I). As expected, Rab11a knockdown decreased levels of infectious virus production compared to controls (Fig. 6K). In order to investigate whether there was a similar impact on the production of DPs, supernatants from control or Rab11a knockdown infected cells were added to LLCMK2 cells, and levels of intracellular DVGs were measured by RT-qPCR. Because Rab11a knockdown reduced infectious virus production, LLCMK2 infections were adjusted to an MOI of 1 TCID50/cell using supplemented SeV-LD. Interestingly, DVG RNA levels in LLCMK2 cells treated with supernatants from infected Rab11a knockdown cells were reduced compared to those in cells treated with supernatants from infected control cells (Fig. 6L). These data demonstrate that the production of DPs is reduced in the absence of Rab11a, while levels of SeV transcription and genomic SeV RNA remain the same across infections (Fig. 6M and N). Taken together, these results indicate that within an infection, vRNPs in FL-high cells interact with cellular trafficking machinery involved in virus packaging and budding, while RNPs in DVG-high cells are localized differently than in FL-high cells and fail to interact with the cellular machinery used for paramyxovirus budding and particle production.
FIG 6.
Cytoplasmic distribution of DVGs in DVG-high cells is independent of microtubule integrity and Rab11a expression. (A) A549 cells infected with SeV-HD and treated with nocodazole at 4 h postinfection. Positive-sense viral RNA-FISH was performed at 24 h postinfection. Wide-field images were captured with a 63× objective. Deconvolved, extended focus is shown. Bar = 100 μm. Images are representative of results from four independent experiments. DMSO, dimethyl sulfoxide. (B to D) RT-qPCR for SeV NP (B), (+)gSeV (C), and (+)DVG-546 (D) transcripts relative to GAPDH at 24 h postinfection. Data are represented as means ± SEM of results from three independent experiments. *, P < 0.05 by a paired t test. (C) A549 cells transfected with siRNA targeting Rab11a or scrambled control siRNA (siCtrl) prior to infection, infected with SeV-HD for 24 h, and then subjected to positive-sense viral RNA-FISH. Wide-field images were captured with a 63× objective. Deconvolved, extended focus is shown. Bar = 100 μm. Images are representative of results from four independent experiments. (F to I) RT-qPCR for Rab11a (F), SeV NP (G), (+)gSeV (H), and (+)DVG-546 (I) transcripts relative to GAPDH at 24 h postinfection. Data are represented as means ± SEM of results from seven independent experiments. *, P < 0.05; **, P < 0.005 by a paired t test. (J) Western blotting for Rab11a protein with a GAPDH loading control in mock (M), SeV-LD (LD), and SeV-HD (HD) infections. (K) Relative levels of infectious virus by TCID50 normalized to an siRNA control. Data are represented as means ± SEM of results from three independent experiments. *, P < 0.05 by a paired t test. The supernatant from control siRNA and Rab11a siRNA KD (knockdown) cells was adjusted to an MOI of 1 TCID50/cell with SeV-LD, and LLCMK2 cells were infected for 24 h. (L to N) RT-qPCR for SeV Cantell-specific DVG-546 (L), (+)gSeV (M), and SeV NP (N) mRNAs relative to GAPDH. Data are represented as means ± SEM of results from three independent experiments normalized to values for SeV-LD alone. **, P <0.005 by one-way ANOVA followed by a Bonferroni post hoc test.
Virions containing FL genomes or DVGs are produced by FL-high cells and not by DVG-high cells.
Because of the documented importance of Rab11a/microtubule trafficking pathways for paramyxovirus particle production (37), we next asked if DVG-high cells produced defective viral genome-containing particles (DPs). Taking into consideration the heterogeneity in viral genomic content among cells infected with SeV-HD (12) (Fig. 2), we live sorted DVG-high and FL-high cells to obtain enriched populations. To do this, we took advantage of previous data from our laboratory that identified a subset of tumor necrosis factor (TNF)-associated genes that are upregulated in DVG-high cells, including the cell surface molecule 4-1BB (12). In addition, the SeV HN protein is a surface protein whose content is lower in DVG-high cells than in FL-high cells (39). Notably, however, even cells with lower levels of HN (HN-low gate) are sufficient to produce viral particles, as sorted SeV-LD-infected cells produce similar amounts of infectious particles from both gates (Fig. 7A and B). To study viral particle production, experiments were performed in LLCMK2 cells, which robustly produce virus compared to A549 cells. LLCMK2 cells were infected with SeV-HD, stained, and gated based on their expression of 4-1BB and SeV HN for sorting (Fig. 7C). Sorted populations were characterized by RNA-FISH (Fig. 7D) and compared to unsorted population controls (Fig. 7E), and the relative genomic content was confirmed by RT-qPCR (Fig. 7F). Sorted cell populations were cultured for 24 h before analyzing their supernatant for the presence of infectious virus and DPs. As expected, infectious virus was predominantly found in the supernatant of FL-high cells (Fig. 7G). Because low levels of DPs are not detectable by titration or by hemagglutination, the content of DPs was assessed after amplification in LLCMK2 cells. To do this, LLCMK2 cells were infected with a combination of SeV-52-LD and supernatants from the cultured sorted populations. To confirm that SeV-52-LD was able to support the replication of SeV Cantell DVG-546, purified DPs (20 HAU) were added to infections with SeV-52-LD at an MOI of 1.5 TCID50/cell, and levels of DVG-546 (Fig. 8A) and genomic SeV (Fig. 8B) were analyzed and showed an increase over time. Upon infection of LLCMK2 cells with sorted cell supernatants, intracellular levels of SeV Cantell-specific DVG-546 were analyzed at 24 h postinfection by RT-qPCR. Interestingly, despite the abundance of intracellular DVGs, the supernatant from purified DVG-high cells did not contain DVG-546 DPs, as there was no difference in the levels of DVGs in SeV-52-LD plus DVG supernatant compared to SeV-52-LD alone. Rather, DVG-546 DPs were present in the supernatant from purified FL-high infected cells (Fig. 8C). There was no difference in levels of genomic SeV RNA (Fig. 8D). Because we chose to amplify the supernatants in LLCMK2 cells to see robust virus replication, levels of IFNB and IFIT1 are lower than in A549 cells, as LLCMK2 cells are rather poor inducers of interferon (IFN). However, as expected, the presence of DPs correlated with increased expression of IFNB and IFIT1 mRNAs (Fig. 8E and F) compared to mock levels. Together with reported evidence of a critical role for DVG-high cells in engaging the antiviral response, these data demonstrate the distinct functional properties of different cells during viral infections and identify viral particle production as a distinctive function of FL-high cells.
FIG 7.
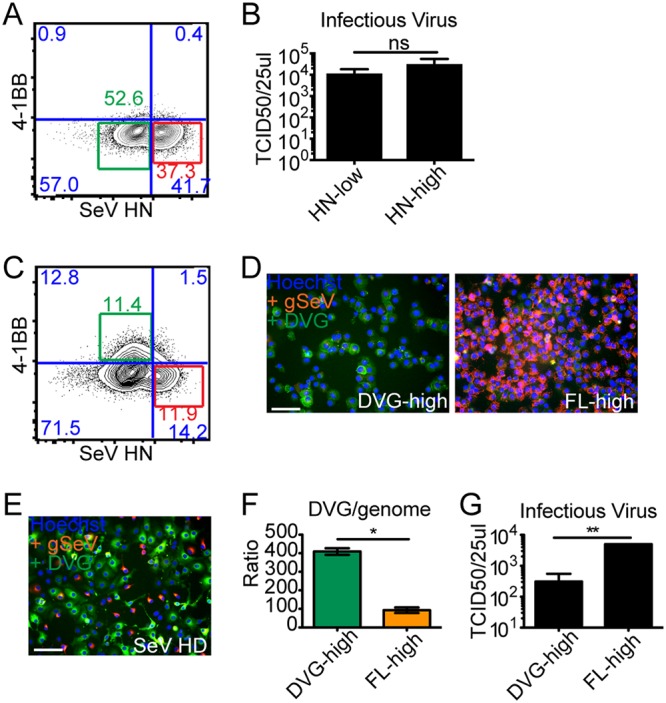
Infectious virus is produced by FL-high cells and not by DVG-high cells. (A) Representative flow cytometry plot of SeV-LD-infected LLCMK2 cells at 24 h postinfection. The HN-low gate is shown in green, and the HN-high gate is shown in red. (B) TCID50/25 μl of the supernatant from the indicated cell populations. (C) Representative flow cytometry plot of SeV-HD-infected LLCMK2 cells at 24 h postinfection. The DVG-high gate is shown in green, and the FL-high gate is shown in red. (D and E) Cytospin of the indicated populations after sorting (D) and unsorted SeV-HD-infected LLCMK2 cells as a control (E) subjected to positive-sense RNA-FISH, (wide field, 20× objective). (F) Relative ratio of DVGs to genomes calculated by RT-qPCR for DVG-546 and positive-sense genomes in each population, relative to GAPDH (n = 4). *, P < 0.05 by a Mann-Whitney nonparametric U test. (G) TCID50/25 μl of the supernatant from the indicated cell populations (n = 3). **, P < 0.005 by Student’s t test.
FIG 8.
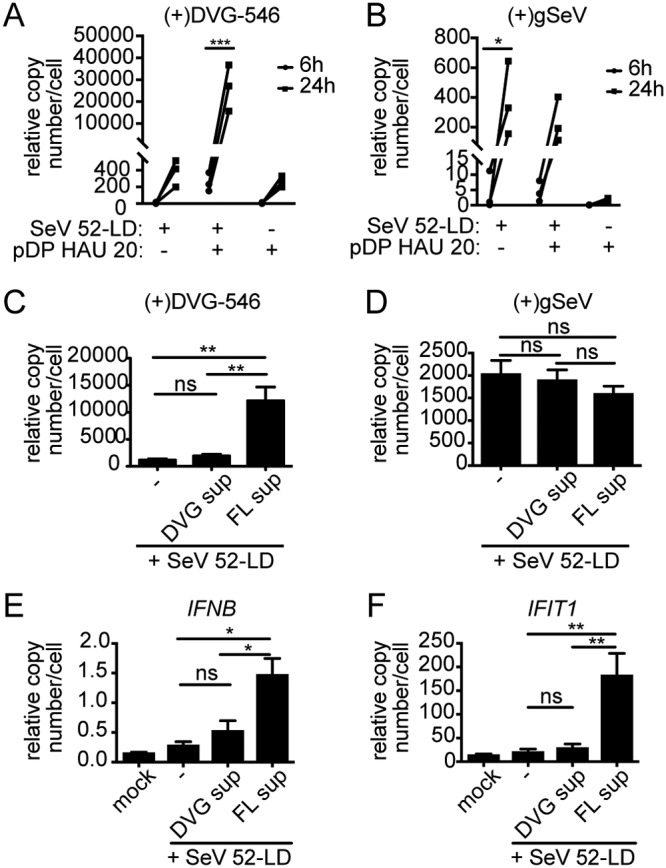
Defective particles are produced by FL virus-high cells and not by DVG-high cells. (A and B) Purified defective particles added to SeV-52, and levels of (+)DVG-546 (A) and (+)gSeV (B) were measured at 6 and 24 h postinfection. Data from three independent experiments are shown. *, P < 0.05; ***, P < 0.001 by two-way ANOVA with Sidak’s multiple-comparisons test. (C to F) The supernatant (sup) from sorted cells was mixed with SeV-52 at an MOI of 1 TCID50/cell, and LLCMK2 cells were infected for 24 h. Shown are RT-qPCR data for Cantell-specific DVG-546 (C), (+)gSeV (D), IFNB (E), and IFIT1 (F) mRNAs relative to GAPDH (n = 3). **, P <0.005 by one-way ANOVA followed by a Bonferroni post hoc test.
DVG cytoplasmic distribution is independent of antiviral signaling and cell type.
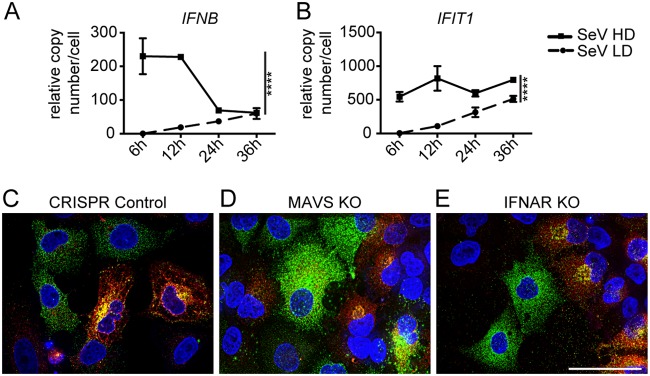
DVGs from SeV Cantell strongly stimulate the RIG-I-like receptor (RLR) pathway and induce the expression of type I and III IFNs and hundreds of interferon-stimulated genes (7, 11, 24, 40). In agreement with the well-known immunostimulatory activity of DVGs (9), SeV-HD infections showed robust induction of antiviral responses compared to SeV-LD infections, including high levels of expression of IFNB and the interferon-stimulated gene IFIT1 (Fig. 9A and B). To assess if these host responses impacted the differential distribution of FL genomes and DVGs and the consequent different DP production levels (Fig. 8), we used CRISPR knockout (KO) cell lines lacking the RLR signaling adaptor mitochondrial antiviral signaling protein (MAVS KO) or lacking the type I IFN receptor (IFNAR KO). The intracellular distribution of FL genomes and DVGs in knockout cell lines was similar to their distribution in control cells 24 h after SeV infection (Fig. 9C to E), indicating that the cytoplasmic distribution of DVGs in DVG-high cells is independent of both RLR and IFN signaling. To investigate whether the DVG distribution was dependent on other host factors, we tested a variety of cell lines from various host species. Infection by SeV in various adherent epithelial nonhuman cell lines, including monkey LLCMK2 cells, which support robust replication of virus and are traditionally used for virus growth and titration; Madin-Darby canine kidney (MDCK) cells; and Vero cell lines, recapitulated the phenotype seen in A549 cells (Fig. 7E and data not shown). The independence on antiviral signaling and host cell type indicates that the intracellular distribution of vRNPs in FL-high and DVG-high cells is likely a virally driven process; the specifics of it are the subject of current investigations.
FIG 9.
Differential distribution of viral genomes is independent of antiviral signaling. (A and B) RT-qPCR for IFNB (A) and IFIT1 (B) mRNAs relative to GAPDH (n = 3). **, P < 0.005 by one-way ANOVA followed by a Bonferroni post hoc test. (C to E) CRISPR control A549 (C), MAVS KO (D), and IFNAR KO (E) cell lines were infected with SeV-HD for 24 h and then subjected to positive-sense viral RNA-FISH. Wide-field images were captured with a 63× objective. Deconvolved, extended focus is shown. Images are representative of results from three independent experiments. Bar = 50 μm.
DISCUSSION
Our data indicate that cells that accumulate high levels of DVGs during an infection have a distinct cytoplasmic distribution of vRNPs compared to infected cells that do not accumulate high levels of DVGs. DVG RNPs do not engage with the host cell to produce virions or DVG-containing defective particles (DPs). In contrast, FL genome and DVG vRNPs in infected cells with low levels of or no DVGs are efficiently packaged and released as standard virus or DPs. The differential interaction of virus and host proteins among infected cells in a population highlights the complexity and heterogeneity of viral infections. Most studies of the interactions of host proteins with viral components have relied on the purification or tagging of viral proteins or viral RNPs. However, we show that not all vRNPs across different cells within an infected population behave similarly, as DVG-high cells show differential distributions of viral components with distinct functional outcomes. The presence of DVGs within prepared viral stocks or the accumulation of DVGs during an infection is nearly ubiquitous for viruses of the order Mononegavirales, orthomyxoviruses, and others (9, 41). Our results indicate that DVGs may shape not only the outcome of infection but also the interaction of viral genomes with the intracellular trafficking machinery.
DVGs are important modulators of pathogenesis in many infections, as they ameliorate disease courses through the induction of antiviral immunity, particularly in paramyxovirus infections (1, 8). Additionally, DVG-high cells induce prosurvival pathways that extend their life span and facilitate the establishment of viral persistence (12). The differential distribution of DVGs within cells and their failure to form large perinuclear clusters may be clues to some of the functions that DVGs carry out in driving immunity and stimulating prosurvival pathways. Clustering of viral RNA into specialized structures in order to evade viral RNA sensing by RLRs has been described for a number of viruses, including those of the paramyxovirus family (42). Although this specific proviral function has not been described for Sendai virus, the differential localization of DVGs and their correlation with immune stimulation may offer additional explanations for why these viral products so actively engage with RLRs.
A widely described impact of DVGs on virus production is their ability to strongly interfere with viral protein expression and consequently broadly lower levels of standard virus replication and virion production (39, 43). However, our data indicate that the presence of DPs during an infection leads to a reduction in the proportion of cells able to produce virus rather than a global lowering of virus production in all cells, and indicate the importance of moving away from bulk population analysis when studying the impact of DVGs on an infection. We show that the presence of high levels of DVGs within infected cells drastically limits the production of virions by such cells, and the mechanisms leading to this reduction in virion production are of interest. Our data indicate that the immunostimulatory nature of DVGs does not impact these differences (Fig. 9), and we presume that interference leading to reductions in certain viral proteins may play a role. Interestingly, when analyzed on a per-cell basis, levels of NP are not decreased significantly with the accumulation of DVGs within cells, suggesting that not all viral proteins are subject to stark interference. However, as NP is the first and most abundantly produced mRNA and protein, there may be additional interfering effects on subsequent proteins, which may influence viral particle assembly and production. While DVG-high cells have decreased levels of HN on the surface, we confirmed that this level of HN is also found in a subpopulation of DVG-low cells that produces virions at normal rates. These data suggest that the defect of DVG-high cells in producing DPs cannot be explained by a reduction in the amount of HN. However, it is possible that reductions in the amounts of other proteins implicated in particle production may play a role. For example, matrix protein bridges the interactions between viral glycoproteins, including HN, and vRNPs, yet the details of how it functions in particle assembly are unknown. Evidence indicates that matrix traffics to the cell surface together with viral glycoproteins but independently of vRNPs (44), while other evidence suggests that matrix interacts with cytoplasmic vRNPs and is critical for vRNP transport to the cell membrane (45, 46). Regardless of how matrix works, high levels of DVGs during infection can destabilize matrix, leading to a failure of virus assembly (47). Whether matrix interacts with recycling endosomes or facilitates recycling endosome interactions with vRNPs is unknown. Our data suggest that defects in particle assembly in DVG-high cells may originate prior to their assembly at the cell membrane, as we fail to see an interaction of DVGs with Rab11a and microtubules required for the trafficking of vRNPs to the plasma membrane. It is possible that matrix plays an important role in these interactions. Analysis of RNA from sorted cells shows that DVG-high cells contain lower levels of SeV M mRNA transcripts than do FL-high cells, as expected. However, they express SeV M mRNA, and it is unclear how these lower levels impact protein amounts and whether this is a meaningfully lower level of viral protein. Unfortunately, due to limitations in tools available to study SeV M protein, we are currently unable to address these questions. Additionally, the nonstructural viral protein C has been implicated in the formation of viral particles through mechanisms that remain controversial, and C protein is subject to additional regulations at a transcriptional level, which may be altered in DVG-high cells (48–50). Further investigation into why DVG-high cells fail to engage with these pathways should provide important insight into mechanisms mediating viral genome trafficking and egress and possibly reveal additional roles of matrix or C proteins in regulating virion formation.
The production of DPs and the transmission of DVGs during an infection can have large impacts on the infection outcome in cells (12), in animals (1, 8), and in humans (13). Here we show that cells accumulating the majority of DVGs during an infection are not the main producers of DPs. Rather, DPs and virus are produced from FL-high cells. Notably, FL-high cells die more promptly during infection (12), raising intriguing questions about the dynamics of virus spread and pathogenesis. The presence of DVG-high cells during infection occurs in the presence of high levels of DPs; however, during natural infections, there may be low levels of transmission of DPs. Therefore, a natural infection would presumably originally begin as a low-DVG infection. Once DVGs accumulate in an LD infection (Fig. 1H), the production of DPs as well as standard virus could lead to a local area of high-DVG infection and produce DVG-high cells, which would then be capable of triggering antiviral immunity. The production of DVGs in vivo has been established (8), and modeling of DVGs during transmission has been attempted (28, 51), but we believe that our updated model could yield more insights into these infection dynamics. Additionally, the ability to separate and distinguish defective genomes from FL genomes has allowed us to further characterize properties of the viral genomes during an infection and reveal that cells enriched in DVGs do not engage with microtubule/Rab11a-driven viral production pathways. This dichotomy within a single population not only is a useful tool to understand the immunostimulatory functions of DVGs in infections but also allows us to further investigate additional fundamental aspects of paramyxovirus biology.
MATERIALS AND METHODS
Cells and viruses.
A549 cells (human type II pneumocytes; ATCC CCL-185) and LLCMK2 cells (monkey kidney epithelial cells; ATTC CCL-7) were cultured in tissue culture medium (Dulbecco’s modified Eagle’s medium [DMEM; Invitrogen] supplemented with 10% fetal bovine serum [FBS; Serum Source International], gentamicin [ThermoFisher], sodium pyruvate [Invitrogen], and l-glutamine [Invitrogen]) at 7% CO2 at 37°C. The generation of A549 CRISPR cell lines was described previously (8). Cells were treated with mycoplasma removal agent (MP Biomedical) upon thawing and tested monthly for mycoplasma contamination using a MycoAlert Plus mycoplasma testing kit (Lonza). Sendai virus was grown in 10-day-old, embryonated, specific-pathogen-free chicken eggs (Charles River) for 40 h before allantoic fluid was harvested. LD and HD stocks were produced as described previously (11). Viruses were characterized by the ratio of the TCID50 to direct hemagglutinating (HA) titers. In brief, the TCID50 was determined by 1:10 serial dilutions of virus in infection medium (DMEM [Invitrogen] supplemented with 35% bovine serum albumin [BSA; Sigma-Aldrich], penicillin-streptomycin [Invitrogen], and 5% NaHCO3 [Sigma-Aldrich]) prior to infection of LLCMK2 cells for 72 h in the presence of 2 μg/ml l-1-tosylamido-2-phenylethyl chloromethyl ketone (TPCK)-treated trypsin (Worthington Biochemicals), followed by hemagglutination of 0.5% chicken red blood cells (RBCs; Lampire) to determine the presence of virus in the supernatant. Titers were calculated using the method of Reed and Muench (52). Total HA titers were obtained by testing 1:2 serial dilutions of the virus in phosphate-buffered saline (PBS) for hemagglutination of 0.5% chicken RBCs. Ratios of TCID50/HA titers were as follows: 195,776 for SeV Cantell LD, 48,944 for SeV Cantell HD, 235,151 for SeV-52-LD, and 784 for SeV-52-HD. Infections were performed at an MOI of 1.5 TCID50/cell with virus diluted in infection medium. Cells were washed twice with PBS and then incubated with infection medium with virus at a low volume at 37°C for 1 h. Cells were then supplemented with 2% FBS tissue culture medium for the indicated time periods. Defective particles (DPs) were purified from the allantoic fluid of SeV Cantell-infected embryonated eggs by density ultracentrifugation on a 5 to 45% sucrose gradient, as previously described (8).
Immunofluorescence.
Cells were seeded on no. 1.5 glass coverslips (Corning) prior to infection. At the indicated time points, coverslips were briefly washed in PBS and then fixed in 4% paraformaldehyde (Electron Microscopy Sciences) for 10 min. Cells were permeabilized with 0.2% Triton X-100 (Sigma-Aldrich) for 10 min. Primary and secondary antibodies were diluted in 3% FBS–PBS and incubated at room temperature (RT) for 1.5 h and 1 h, respectively. Nuclei were stained with Hoechst dye for 10 min prior to mounting coverslips on slides using Fluoromount-G (ThermoFisher). Antibodies used were as follows: SeV NP (clone M73/2, a kind gift from Alan Portner, directly conjugated with DyLight 594 N-hydroxysuccinimide (NHS) ester [ThermoFisher]); Rab11a (catalog number ab65200; Abcam); alpha-tubulin (catalog number ab52866; Abcam); GM130 (catalog number ab52649; Abcam); calnexin (catalog number ab133615; Abcam); TOM20 (catalog number sc-11414; Santa Cruz); Alexa Fluor 647-phalloidin (catalog number A22287; Invitrogen); and goat anti-rabbit IgG(H+L) secondary antibody conjugated to Alexa Fluor 488 (catalog number R37116; Invitrogen).
RNA FISH.
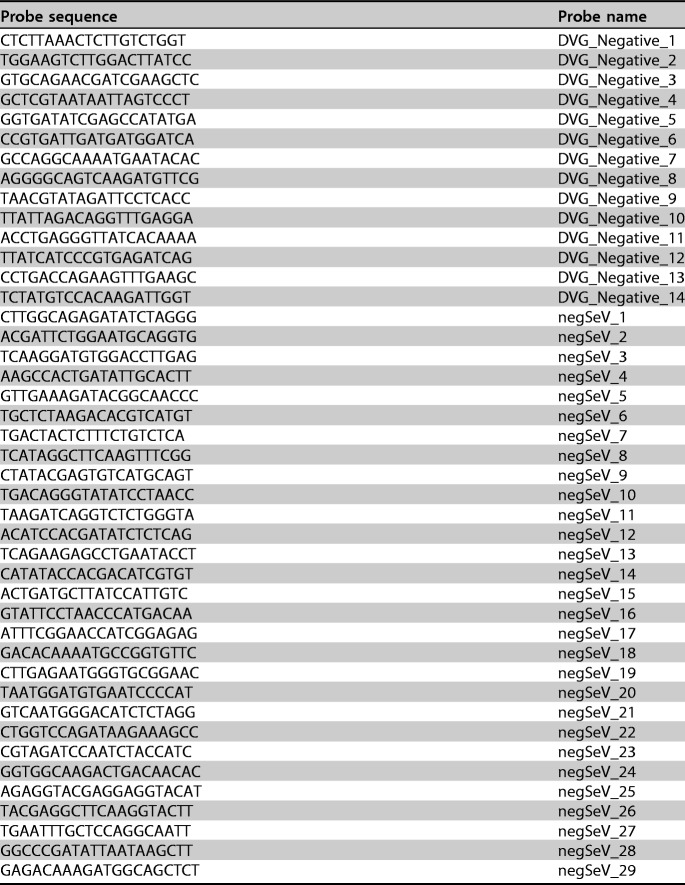
Custom probe sets (described in reference 12) (Table 1) conjugated to Quasar 570 and Quasar 670 dyes were purchased from LGC Biosearch. Cells were seeded on no. 1.5 glass coverslips (Corning) prior to infection. At the indicated time points, coverslips were briefly washed in PBS and then fixed in 3.7% formaldehyde (ThermoFisher) for 10 min. Cells were permeabilized in 70% ethanol (EtOH) for 1 h, washed in wash buffer (2× SSC [1× is 0.15 M NaCl plus 0.015 M sodium citrate] [ThermoFisher] and 10% formamide [ThermoFisher] in nuclease-free water), and then subjected to hybridization with FISH probes. In brief, probes were diluted to 2.5 nM in hybridization buffer (wash buffer plus dextran sulfate) and applied to slides. Slides were incubated with the probe overnight at 37°C in a humidified chamber. Prior to imaging, slides were washed in wash buffer twice (once with Hoechst dye to stain nuclei) and then in 2× SSC. Cells were mounted in antifade buffer (2× SSC, 0.4% glucose [Sigma], and Tris-HCl [pH 8.0] [USB Corporation] with catalase [Sigma] and glucose oxidase [Sigma]) and sealed with rubber cement. RNA-FISH combined with immunofluorescence includes the following modifications: after fixation with EtOH, cells are stained with antibody in 1% BSA (ThermoFisher)–PBS with RNaseOUT (Invitrogen) for 45 min for the primary Ab and 40 min for the secondary Ab. Cells were then postfixed for 10 min in 3.7% formaldehyde prior to hybridization.
TABLE 1.
Probe sequences for SeV negative-sense genome probes
Microscopy and image analysis.
Wide-field images were acquired on a Leica DM1000 microscope with 40× (1.25- to 0.75-numerical-aperture [NA]) and 63× (1.40- to 0.60-NA) oil immersion objectives. Confocal images were acquired on a Leica SP5-II laser scanning confocal microscope with 63× (1.40- to 0.60-NA) and 100× (1.46-NA) oil immersion objectives with pixel sizes of 50.4 nm by 50.4 nm for immunofluorescence images and 120.2 nm by 120.2 nm for FISH immunofluorescence. Images were deconvolved using Huygens Essentials Deconvolution Wizard using theoretical point spread function, and images were processed in Volocity (Perkins-Elmer). Global Pearson’s correlation was calculated in Volocity using automatic thresholding based on methods described previously (53). For Rab11a/ negative-sense-SeV colocalization, nonspecific nuclear staining was excluded using Fiji software by subtracting the signal from the nuclear area defined by Hoechst staining. For individual cell measurements, regions of interest (ROIs) were defined manually for global Pearson’s correlation. Measurements of nucleoprotein distribution and amount were done using the MetaMorph (Molecular Devices) multiwavelength cell scoring application using phalloidin staining to define cellular boundaries. Single-plane images were used for quantification, and the plane was determined by phalloidin staining in order to avoid bias.
RNA extraction and PCR/RT-qPCR.
RNA was extracted with TRIzol (Invitrogen). Cellular and viral mRNAs were reverse transcribed using an RNA-to-cDNA kit (Invitrogen). Viral RNA was reverse transcribed using a SuperScript III first-strand synthesis system (Invitrogen) with primer 5′-GGTGAGGAATCTATACGTTATAC-3′. PCR was performed using Platinum Taq DNA polymerase (Invitrogen), the reverse transcription primer, and 5′-ACCAGACAAGAGTTTAAGAGATATGTATT-3′. qPCR was performed with a 1:40 dilution of cDNA, SYBR green (Life Technologies), and 5 μM forward/reverse primers (Invitrogen) on an Applied Biosystems ViiA 7 real-time system. Relative copy numbers per cell were calculated by the ΔΔCT method and normalized to average cellular glyceraldehyde-3-phosphate dehydrogenase (GAPDH) expression levels. Primers are forward (F) primer 5′-TGCCCTGGAAGATGAGTTAG-3′ and reverse (R) primer 5′-GCCTGTTGGTTTGTGGTAAG-3′ for SeV NP, F primer 5′-GACCAGGAAATAAAGAGTGCA-3′ and R primer 5′-CGATGTATTGGCATATAGCGT-3′ for gSeV, F primer 5′-TCCAAGACTATCTTTATCTATGTCC-3′ and R primer 5′-GGTGAGGAATCTATACGTTATAC-3′ for DVG-546, F primer 5′-GTCAGAGTGGAAATCCTAAG-3′ and R primer 5′-ACAGCATCTGCTGGTTGAAG-3′ for IFNB, F primer 5′-GGATTCTGTACAATACACTAGAAACCA-3′ and R primer 5′-CTTTTGGTTACTTTTCCCCTATCC-3′ for IFIT1, and F primer 5′-AGAGCTTTTGCAGAAAAGAATGGT-3′ and R primer 5′-GCTTCTGAGAAACAATGCGGT-3′ for Rab11a.
siRNA.
Cells (3 × 10⁴) were transfected with 75 μM On-Target Plus SMARTpool Rab11a (Dharmacon GE), a mixture of four siRNAs targeting Rab11a diluted in Opti-MEM, using Lipofectamine RNAiMAX (Invitrogen). Transfection was performed 72 h prior to infection to allow sufficient knockdown. Knockdown was assessed using immunofluorescence, RT-qPCR, and Western blotting to confirm protein and mRNA levels. Control cells were transfected with 75 μM the On-Target Plus nontargeting pool (Dharmacon GE) by following identical procedures.
Western blotting.
Cells were lysed in NP-40 lysis buffer (Amresco) with proteinase inhibitors (Roche Boehringer Mannheim), RNaseOUT (Invitrogen), and EDTA (ThermoFisher). The protein concentration was measured using a bicinchoninic acid (BCA) protein assay (ThermoFisher). Protein (10 μg) was denatured by boiling for 10 min, loaded in a 10% Bis-Tris gel (Bio-Rad), and then transferred to a polyvinylidene difluoride (PVDF) membrane (Millipore). Membranes were incubated overnight with primary antibody in 5% milk (rabbit anti-Rab11a [Abcam] and mouse anti-GAPDH [Sigma]). The membrane was incubated with anti-rabbit horseradish peroxidase (HRP)-conjugated antibody (Cell Signaling) or anti-mouse HRP-conjugated antibody (Jackson Immunologicals) in 5% milk and developed using the Lumi-light Western blot substrate (Roche) to detect HRP.
Drug treatment.
At 4 h postinfection, medium was removed and replaced with 2% FBS tissue culture medium containing 2 μg/ml nocodazole (Sigma-Aldrich) for the duration of infection.
Flow cytometry.
Cells were stained with anti-4-1BB (clone 4B4-1, catalog number 309819; BioLegend) and anti-SeV HN (clone 6F11; kindly provided by T. Moran) followed by anti-IgG2a phycoerythrin (PE)-Cy7 (clone RMG2a-62, catalog number 407113; BioLegend) at 24 h postinfection. Cells were sorted on a BD FACS Aria II Special Order Research Products (SORP) instrument. Mock-infected and SeV-LD-infected cells were used to inform gating. Analysis was done using FlowJo_v9.9.4 (BD Biosciences).
Viral production analysis.
Sorted cells (1.5 × 10⁵ cells per population) were incubated for 30 min in 1% anti-SeV mouse serum twice to remove virus bound to the surface. Cells were then seeded in a 24-well plate in infection medium (described above) and cultured for 24 h. Twenty-four hours after culture, medium was collected and analyzed for virus particles. Detection of DPs was performed by infecting LLCMK2 cells with an inoculum containing 100 μl of culture supernatants with 100 μl of infection medium containing SeV-52-LD to reach an MOI of 1 TCID50/cell and 2 μg/ml TPCK trypsin (Worthington) for 24 h.
Statistics.
Statistics were calculated using GraphPad Prism 5 for Mac.
ACKNOWLEDGMENTS
We thank Gordon Ruthel for invaluable help with imaging and the Penn Vet Imaging Core Facility. We also thank members of the López laboratory for helpful comments and advice.
This work was supported by the U.S. National Institutes of Health National Institute of Allergy and Infectious Diseases (NIH grants R01AI083284, R01AI137062, and R21AI127832 to C.B.L.) and the National Science Foundation Graduate Research Fellowship Program (grant 2016222276 to E.G.). The Penn Vet Imaging Core Facility is supported by NIH grant S10 RR027128.
REFERENCES
- 1.Sun Y, Jain D, Koziol-White CJ, Genoyer E, Gilbert M, Tapia K, Panettieri RA, Hodinka RL, López CB. 2015. Immunostimulatory defective viral genomes from respiratory syncytial virus promote a strong innate antiviral response during infection in mice and humans. PLoS Pathog 11:e1005122. doi: 10.1371/journal.ppat.1005122. [DOI] [PMC free article] [PubMed] [Google Scholar]
- 2.Davis AR, Hiti AL, Nayak DP. 1980. Influenza defective interfering viral RNA is formed by internal deletion of genomic RNA. Proc Natl Acad Sci U S A 77:215–219. doi: 10.1073/pnas.77.1.215. [DOI] [PMC free article] [PubMed] [Google Scholar]
- 3.Li D, Aaskov J. 2014. Sub-genomic RNA of defective interfering (D.I.) dengue viral particles is replicated in the same manner as full length genomes. Virology 468–470:248–255. doi: 10.1016/j.virol.2014.08.013. [DOI] [PubMed] [Google Scholar]
- 4.Pathak KB, Nagy PD. 2009. Defective interfering RNAs: foes of viruses and friends of virologists. Viruses 1:895–919. doi: 10.3390/v1030895. [DOI] [PMC free article] [PubMed] [Google Scholar]
- 5.Lazzarini RA, Keene JD, Schubert M. 1981. The origins of defective interfering particles of the negative-strand RNA viruses. Cell 26:145–154. doi: 10.1016/0092-8674(81)90298-1. [DOI] [PubMed] [Google Scholar]
- 6.Poirier EZ, Goic B, Tome-Poderti L, Frangeul L, Boussier J, Gausson V, Blanc H, Vallet T, Loyd H, Levi LI, Lanciano S, Baron C, Merkling SH, Lambrechts L, Mirouze M, Carpenter S, Vignuzzi M, Saleh MC. 2018. Dicer-2-dependent generation of viral DNA from defective genomes of RNA viruses modulates antiviral immunity in insects. Cell Host Microbe 23:353.e8–365.e8. doi: 10.1016/j.chom.2018.02.001. [DOI] [PMC free article] [PubMed] [Google Scholar]
- 7.Strahle L, Garcin D, Kolakofsky D. 2006. Sendai virus defective-interfering genomes and the activation of interferon-beta. Virology 351:101–111. doi: 10.1016/j.virol.2006.03.022. [DOI] [PubMed] [Google Scholar]
- 8.Tapia K, Kim W-K, Sun Y, Mercado-López X, Dunay E, Wise M, Adu M, López CB. 2013. Defective viral genomes arising in vivo provide critical danger signals for the triggering of lung antiviral immunity. PLoS Pathog 9:e1003703. doi: 10.1371/journal.ppat.1003703. [DOI] [PMC free article] [PubMed] [Google Scholar]
- 9.Lopez CB. 2014. Defective viral genomes: critical danger signals of viral infections. J Virol 88:8720–8723. doi: 10.1128/JVI.00707-14. [DOI] [PMC free article] [PubMed] [Google Scholar]
- 10.Calain P, Monroe MC, Nichol ST. 1999. Ebola virus defective interfering particles and persistent infection. Virology 262:114–128. doi: 10.1006/viro.1999.9915. [DOI] [PubMed] [Google Scholar]
- 11.Yount JS, Kraus TA, Horvath CM, Moran TM, Lopez CB. 2006. A novel role for viral-defective interfering particles in enhancing dendritic cell maturation. J Immunol 177:4503–4513. doi: 10.4049/jimmunol.177.7.4503. [DOI] [PubMed] [Google Scholar]
- 12.Xu J, Sun Y, Li Y, Ruthel G, Weiss SR, Raj A, Beiting D, Lopez CB. 2017. Replication defective viral genomes exploit a cellular pro-survival mechanism to establish paramyxovirus persistence. Nat Commun 8:799. doi: 10.1038/s41467-017-00909-6. [DOI] [PMC free article] [PubMed] [Google Scholar]
- 13.Vasilijevic J, Zamarreño N, Oliveros JC, Rodriguez-Frandsen A, Gómez G, Rodriguez G, Pérez-Ruiz M, Rey S, Barba I, Pozo F, Casas I, Nieto A, Falcón A. 2017. Reduced accumulation of defective viral genomes contributes to severe outcome in influenza virus infected patients. PLoS Pathog 13:e1006650. doi: 10.1371/journal.ppat.1006650. [DOI] [PMC free article] [PubMed] [Google Scholar]
- 14.Kolakofsky D. 1976. Isolation and characterization of Sendai virus DI-RNAs. Cell 8:547–555. doi: 10.1016/0092-8674(76)90223-3. [DOI] [PubMed] [Google Scholar]
- 15.Calain P, Roux L. 1995. Functional characterisation of the genomic and antigenomic promoters of Sendai virus. Virology 212:163–173. doi: 10.1006/viro.1995.1464. [DOI] [PubMed] [Google Scholar]
- 16.Li D, Lott WB, Lowry K, Jones A, Thu HM, Aaskov J. 2011. Defective interfering viral particles in acute dengue infections. PLoS One 6:e19447. doi: 10.1371/journal.pone.0019447. [DOI] [PMC free article] [PubMed] [Google Scholar]
- 17.Whistler T, Bellini WJ, Rota PA. 1996. Generation of defective interfering particles by two vaccine strains of measles virus. Virology 220:480–484. doi: 10.1006/viro.1996.0335. [DOI] [PubMed] [Google Scholar]
- 18.Santak M, Markusic M, Balija ML, Kopac SK, Jug R, Orvell C, Tomac J, Forcic D. 2015. Accumulation of defective interfering viral particles in only a few passages in Vero cells attenuates mumps virus neurovirulence. Microbes Infect 17:228–236. doi: 10.1016/j.micinf.2014.11.006. [DOI] [PubMed] [Google Scholar]
- 19.Murphy DG, Dimock K, Kang CY. 1987. Defective interfering particles of human parainfluenza virus 3. Virology 158:439–443. doi: 10.1016/0042-6822(87)90217-0. [DOI] [PubMed] [Google Scholar]
- 20.Frey TK, Hemphill ML. 1988. Generation of defective-interfering particles by rubella virus in Vero cells. Virology 164:22–29. doi: 10.1016/0042-6822(88)90615-0. [DOI] [PubMed] [Google Scholar]
- 21.Treuhaft MW, Beem MO. 1982. Defective interfering particles of respiratory syncytial virus. Infect Immun 37:439–444. [DOI] [PMC free article] [PubMed] [Google Scholar]
- 22.Hall WW, Martin SJ, Gould E. 1974. Defective interfering particles produced during the replication of measles virus. Med Microbiol Immunol 160:155–164. doi: 10.1007/BF02121722. [DOI] [PubMed] [Google Scholar]
- 23.Perrault J. 1981. Origin and replication of defective interfering particles. Curr Top Microbiol Immunol 93:151–207. [DOI] [PubMed] [Google Scholar]
- 24.Xu J, Mercado-Lopez X, Grier JT, Kim WK, Chun LF, Irvine EB, Del Toro Duany Y, Kell A, Hur S, Gale M Jr, Raj A, Lopez CB. 2015. Identification of a natural viral RNA motif that optimizes sensing of viral RNA by RIG-I. mBio 6:e01265-15. doi: 10.1128/mBio.01265-15. [DOI] [PMC free article] [PubMed] [Google Scholar]
- 25.Russell AB, Trapnell C, Bloom JD. 2018. Extreme heterogeneity of influenza virus infection in single cells. Elife 7:e32303. doi: 10.7554/eLife.32303. [DOI] [PMC free article] [PubMed] [Google Scholar]
- 26.Zanini F, Pu SY, Bekerman E, Einav S, Quake SR. 2018. Single-cell transcriptional dynamics of flavivirus infection. Elife 7:e32942. doi: 10.7554/eLife.32942. [DOI] [PMC free article] [PubMed] [Google Scholar]
- 27.Guo F, Li S, Caglar MU, Mao Z, Liu W, Woodman A, Arnold JJ, Wilke CO, Huang TJ, Cameron CE. 2017. Single-cell virology: on-chip investigation of viral infection dynamics. Cell Rep 21:1692–1704. doi: 10.1016/j.celrep.2017.10.051. [DOI] [PMC free article] [PubMed] [Google Scholar]
- 28.Akpinar F, Inankur B, Yin J. 2016. Spatial-temporal patterns of viral amplification and interference initiated by a single infected cell. J Virol 90:7552–7566. doi: 10.1128/JVI.00807-16. [DOI] [PMC free article] [PubMed] [Google Scholar]
- 29.Akpinar F, Timm A, Yin J. 2016. High-throughput single-cell kinetics of virus infections in the presence of defective interfering particles. J Virol 90:1599–1612. doi: 10.1128/JVI.02190-15. [DOI] [PMC free article] [PubMed] [Google Scholar]
- 30.Brock SC, Goldenring JR, Crowe JE Jr.. 2003. Apical recycling systems regulate directional budding of respiratory syncytial virus from polarized epithelial cells. Proc Natl Acad Sci U S A 100:15143–15148. doi: 10.1073/pnas.2434327100. [DOI] [PMC free article] [PubMed] [Google Scholar]
- 31.Chambers R, Takimoto T. 2010. Trafficking of Sendai virus nucleocapsids is mediated by intracellular vesicles. PLoS One 5:e10994. doi: 10.1371/journal.pone.0010994. [DOI] [PMC free article] [PubMed] [Google Scholar]
- 32.Eisfeld AJ, Kawakami E, Watanabe T, Neumann G, Kawaoka Y. 2011. RAB11A is essential for transport of the influenza virus genome to the plasma membrane. J Virol 85:6117–6126. doi: 10.1128/JVI.00378-11. [DOI] [PMC free article] [PubMed] [Google Scholar]
- 33.Nakatsu Y, Ma X, Seki F, Suzuki T, Iwasaki M, Yanagi Y, Komase K, Takeda M. 2013. Intracellular transport of the measles virus ribonucleoprotein complex is mediated by Rab11A-positive recycling endosomes and drives virus release from the apical membrane of polarized epithelial cells. J Virol 87:4683–4693. doi: 10.1128/JVI.02189-12. [DOI] [PMC free article] [PubMed] [Google Scholar]
- 34.Nturibi E, Bhagwat AR, Coburn S, Myerburg MM, Lakdawala SS. 2017. Intracellular colocalization of influenza viral RNA and Rab11A is dependent upon microtubule filaments. J Virol 91:e01179-17. doi: 10.1128/JVI.01179-17. [DOI] [PMC free article] [PubMed] [Google Scholar]
- 35.Stone R, Hayashi T, Bajimaya S, Hodges E, Takimoto T. 2016. Critical role of Rab11a-mediated recycling endosomes in the assembly of type I parainfluenza viruses. Virology 487:11–18. doi: 10.1016/j.virol.2015.10.008. [DOI] [PMC free article] [PubMed] [Google Scholar]
- 36.Ruigrok RW, Crepin T, Kolakofsky D. 2011. Nucleoproteins and nucleocapsids of negative-strand RNA viruses. Curr Opin Microbiol 14:504–510. doi: 10.1016/j.mib.2011.07.011. [DOI] [PubMed] [Google Scholar]
- 37.Bruce EA, Stuart A, McCaffrey MW, Digard P. 2012. Role of the Rab11 pathway in negative-strand virus assembly. Biochem Soc Trans 40:1409–1415. doi: 10.1042/BST20120166. [DOI] [PubMed] [Google Scholar]
- 38.Moyer SA, Baker SC, Lessard JL. 1986. Tubulin: a factor necessary for the synthesis of both Sendai virus and vesicular stomatitis virus RNAs. Proc Natl Acad Sci U S A 83:5405–5409. doi: 10.1073/pnas.83.15.5405. [DOI] [PMC free article] [PubMed] [Google Scholar]
- 39.Roux L, Waldvogel FA. 1983. Defective interfering particles of Sendai virus modulate HN expression at the surface of infected BHK cells. Virology 130:91–104. doi: 10.1016/0042-6822(83)90120-4. [DOI] [PubMed] [Google Scholar]
- 40.Baum A, Sachidanandam R, Garcia-Sastre A. 2010. Preference of RIG-I for short viral RNA molecules in infected cells revealed by next-generation sequencing. Proc Natl Acad Sci U S A 107:16303–16308. doi: 10.1073/pnas.1005077107. [DOI] [PMC free article] [PubMed] [Google Scholar]
- 41.Rezelj VV, Levi LI, Vignuzzi M. 2018. The defective component of viral populations. Curr Opin Virol 33:74–80. doi: 10.1016/j.coviro.2018.07.014. [DOI] [PubMed] [Google Scholar]
- 42.Lifland AW, Jung J, Alonas E, Zurla C, Crowe JE Jr, Santangelo PJ. 2012. Human respiratory syncytial virus nucleoprotein and inclusion bodies antagonize the innate immune response mediated by MDA5 and MAVS. J Virol 86:8245–8258. doi: 10.1128/JVI.00215-12. [DOI] [PMC free article] [PubMed] [Google Scholar]
- 43.Roux L, Beffy P, Portner A. 1984. Restriction of cell surface expression of Sendai virus hemagglutinin-neuraminidase glycoprotein correlates with its higher instability in persistently and standard plus defective interfering virus infected BHK-21 cells. Virology 138:118–128. doi: 10.1016/0042-6822(84)90152-1. [DOI] [PubMed] [Google Scholar]
- 44.Sanderson CM, McQueen NL, Nayak DP. 1993. Sendai virus assembly: M protein binds to viral glycoproteins in transit through the secretory pathway. J Virol 67:651–663. [DOI] [PMC free article] [PubMed] [Google Scholar]
- 45.Stricker R, Mottet G, Roux L. 1994. The Sendai virus matrix protein appears to be recruited in the cytoplasm by the viral nucleocapsid to function in viral assembly and budding. J Gen Virol 75:1031–1042. doi: 10.1099/0022-1317-75-5-1031. [DOI] [PubMed] [Google Scholar]
- 46.Iwasaki M, Takeda M, Shirogane Y, Nakatsu Y, Nakamura T, Yanagi Y. 2009. The matrix protein of measles virus regulates viral RNA synthesis and assembly by interacting with the nucleocapsid protein. J Virol 83:10374–10383. doi: 10.1128/JVI.01056-09. [DOI] [PMC free article] [PubMed] [Google Scholar]
- 47.Tuffereau C, Roux L. 1988. Direct adverse effects of Sendai virus DI particles on virus budding and on M protein fate and stability. Virology 162:417–426. doi: 10.1016/0042-6822(88)90482-5. [DOI] [PubMed] [Google Scholar]
- 48.Hasan MK, Kato A, Muranaka M, Yamaguchi R, Sakai Y, Hatano I, Tashiro M, Nagai Y. 2000. Versatility of the accessory C proteins of Sendai virus: contribution to virus assembly as an additional role. J Virol 74:5619–5628. doi: 10.1128/JVI.74.12.5619-5628.2000. [DOI] [PMC free article] [PubMed] [Google Scholar]
- 49.Gosselin-Grenet AS, Marq JB, Abrami L, Garcin D, Roux L. 2007. Sendai virus budding in the course of an infection does not require Alix and VPS4A host factors. Virology 365:101–112. doi: 10.1016/j.virol.2007.03.039. [DOI] [PubMed] [Google Scholar]
- 50.Sugahara F, Uchiyama T, Watanabe H, Shimazu Y, Kuwayama M, Fujii Y, Kiyotani K, Adachi A, Kohno N, Yoshida T, Sakaguchi T. 2004. Paramyxovirus Sendai virus-like particle formation by expression of multiple viral proteins and acceleration of its release by C protein. Virology 325:1–10. doi: 10.1016/j.virol.2004.04.019. [DOI] [PubMed] [Google Scholar]
- 51.Neil RC, Tapia KA, Dandapani A, MacArthur BD, López C, Ma’ayan A. 2011. Stochastic model of virus and defective interfering particle spread across mammalian cells with immune response. arXiv:1108.4901 [q-bio.PE].
- 52.Reed LJ, Muench H. 1938. A simple method of estimating fifty per cent endpoints. Am J Hyg 27:493–497. doi: 10.1093/oxfordjournals.aje.a118408. [DOI] [Google Scholar]
- 53.Costes SV, Daelemans D, Cho EH, Dobbin Z, Pavlakis G, Lockett S. 2004. Automatic and quantitative measurement of protein-protein colocalization in live cells. Biophys J 86:3993–4003. doi: 10.1529/biophysj.103.038422. [DOI] [PMC free article] [PubMed] [Google Scholar]


