

Dynamic patterns of brain activity at rest distinguish conscious and unconscious states in humans.
Abstract
Adopting the framework of brain dynamics as a cornerstone of human consciousness, we determined whether dynamic signal coordination provides specific and generalizable patterns pertaining to conscious and unconscious states after brain damage. A dynamic pattern of coordinated and anticoordinated functional magnetic resonance imaging signals characterized healthy individuals and minimally conscious patients. The brains of unresponsive patients showed primarily a pattern of low interareal phase coherence mainly mediated by structural connectivity, and had smaller chances to transition between patterns. The complex pattern was further corroborated in patients with covert cognition, who could perform neuroimaging mental imagery tasks, validating this pattern’s implication in consciousness. Anesthesia increased the probability of the less complex pattern to equal levels, validating its implication in unconsciousness. Our results establish that consciousness rests on the brain’s ability to sustain rich brain dynamics and pave the way for determining specific and generalizable fingerprints of conscious and unconscious states.
INTRODUCTION
Consciousness is seemingly lost and recovered every day, from the moment we fall asleep until we wake up. Consciousness can also be transiently abolished by pharmacological agents or, more permanently, by brain injury. Each of these departures from conscious wakefulness brings about different changes in brain function, behavior, and neurochemistry. Yet, they all share a common feature: lack of reported subjective experience (1).
Finding reliable markers indicating the presence or absence of consciousness represents an outstanding open problem for science (2). We postulate that consciousness has specific characteristics that are based on the temporal dynamics of ongoing brain activity and its coordination over distant cortical regions. Our hypothesis stems from the common stance of various contemporary theories which propose that consciousness relates to a dynamic process of self-sustained, coordinated brain-scale activity assisting the tuning to a constantly evolving environment, rather than in static descriptions of brain function (3–5). In that respect, neural signals combine, dissolve, reconfigure, and recombine over time, allowing perception, emotion, and cognition to happen (6).
The first biological evidence for a constantly active brain came from electroencephalographic recordings showing electrical oscillations even when the participant was not performing any particular task. More recently, brain dynamics have been characterized by the presence of complex activity patterns, which cannot be completely attributed to background noise (7). Experiments with functional magnetic resonance imaging (fMRI) during normal wakefulness have shown that the brain spontaneously generates a dynamic series of constantly changing activity and connectivity between brain regions (8–10). This activity presents long-range temporal correlations in the sense that signal changes exert long-term influence on future dynamics (11). This translates to a complex temporal organization of the long-range coupling between brain regions, with temporally correlated series of transitions between discrete functional connectivity patterns (6). The spatiotemporal complexity of brain dynamics contributes toward efficient exchanges between neuronal populations (8), suggesting that the neural correlates of consciousness could be found in temporally evolving dynamic processes, as postulated by influential theoretical accounts (3–5).
In terms of states of consciousness, spontaneous fMRI dynamic connectivity has been investigated in different sleep stages (11, 12) and pharmacologically induced anesthesia in humans (13, 14) and animals (15, 16). These studies indicate that, during physiologically reversible unconscious states, cortical long-range correlations are disrupted in both space and time, anticorrelated cortical states disappear, and the dynamic explorations are limited to specific patterns that are dominated by rigid functional configurations tied to the anatomical connectivity. Conversely, conscious wakefulness is characterized not only by global integration, evidenced by strong long-distance interactions between brain regions, but also by a dynamic exploration of a rich and flexible repertoire of functional brain configurations departing from the anatomical constraints (15). Another important characteristic observed predominantly during conscious wakefulness is the appearance of anticorrelations between the activity of different brain regions. This observation is in line with the prediction of the Global Neuronal Workspace theory stating that different streams of information in the brain compete for the global percolation (“ignition”) of a widespread network of regions, a phenomenon associated with conscious access. In terms of the fMRI blood oxygen level–dependent (BOLD) signal, this could manifest in the mutual inhibition of activity at different cortical regions, leading to anticorrelated dynamics (5).
Although dynamic connectivity has been investigated in physiological and pharmacological unresponsiveness, currently, the alterations in brain connectivity dynamics associated with pathological unconsciousness after severe brain injury remain unknown. The study of unresponsive brain-lesioned patients with preserved levels of vigilance offers unique insights into the necessary and potentially sufficient conditions for the capacity of sustaining conscious content. So far, the inference of consciousness in patients has rested on the use of active mental imagery neuroimaging paradigms (17) and by assessing the complexity of evoked (18) and spontaneous brain activity (19). Patients who successfully perform these active paradigms can no longer be considered unconscious and are thought to suffer from cognitive-motor dissociation (20). Given that nonresponsiveness can be associated with a variety of brain lesions, varying levels of vigilance, and covert cognition, we highlight the need to determine a common set of features capable of accounting for the capacity to sustain conscious experience. Given the above theoretical considerations, which agree in the characterization of consciousness as a global, temporally evolving process, we aimed at determining whether the dynamics of brain-wide coordination could provide such a set of common features in the form of transient patterns of connectivity that successfully generalize between different forms of nonresponsiveness in patients with brain injury.
RESULTS
We recorded fMRI data in a cohort of 159 participants scanned at four independent research sites (Liège: 21 healthy individuals and 63 patients; Paris: 15 healthy individuals and 22 patients; New York: 11 healthy individuals and 16 patients; London, Ontario: 11 patients). Patients were diagnosed in a vegetative state/unresponsive wakefulness syndrome (UWS) or in a minimally conscious state (MCS) with repetitive standardized behavioral assessments and were scanned under a resting condition, sedation free, or under anesthesia with propofol. The cohort was divided into three datasets: dataset 1 (Liège, Paris, and New York; n = 125) was used for the main analysis, dataset 2 (London, Ontario; n = 11) included patients with cognitive-motor dissociation, and dataset 3 (Liège, n = 23) included patients scanned under propofol anesthesia (clinical details are summarized in table S1).
Dynamic fMRI BOLD signal coordination was estimated between 42 nonoverlapping regions of interest (ROIs) representing six brain networks implicated in functional/cognitive processes (table S2) (21). The coordination between the continuous fMRI time series was estimated on dataset 1 by means of phase synchronization, which determines the relative timing of the phases of two signals during each waveform cycle. We partitioned the phase-based coherence observations in a data-driven way (k-means clustering), leading to a discrete set of brain-wide coordination patterns and their corresponding rates of occurrence in each group. The analysis consistently revealed four distinguishable patterns (Fig. 1A), recurrently emerging even when varying the number of clusters in the algorithm (fig. S1). A pattern of high complexity (pattern 1), including positive and negative values of long-distance coordination, was more prevalent in healthy participants and in patients in MCS as compared to patients in UWS (Fig. 1B). The rate of this pattern also increased when moving from patients in UWS, to patients in MCS, and to healthy control individuals (UWS < MCS < HC, Spearman rank correlation between rate and group, rho = 0.7, P < 10−16). In sharp contrast, a pattern of low interareal coordination (pattern 4) was more likely to occur in unresponsive patients compared to patients in MCS (Fig. 1B). This pattern also presented a decreasing probability rate from patients in UWS, to patients in MCS, and to healthy control individuals (UWS > MCS > HC, Spearman rank correlation between rate and group, rho = −0.6, P < 10−11).
Fig. 1. The interareal coordination of ongoing brain dynamics is differentially orchestrated as a function of the state of consciousness.
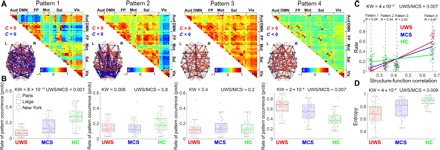
(A) Four patterns recurrently emerged from the data-driven analysis of phase-based coherence matrices. The patterns revealed diverse interareal coordination, from positive/negative long-range coherence (pattern 1), to predominantly occipital coherence (pattern 2), to overall high coherence (pattern 3), and overall low coherence (pattern 4). (B) Patient groups differed with respect to the likelihood of each coordination pattern occurrence. The complex interareal coordination pattern 1 presented a higher probability rate in healthy control participants (HC) and patients in MCS compared to patients in UWS, who predominantly resided in the overall low coordination pattern 4. Patterns 2 and 3 were equally probable across groups, potentially serving a transitional role. For the sake of visualization clarity, the scale in the last panel is different than in the other three. (C) Probability of each pattern’s occurrence as a function of their similarity to the anatomical connectivity matrix. Complex pattern 1 showed low similarity to the anatomical connectivity, while pattern 4 was the most similar to the anatomical connectivity, suggesting that spontaneous neuronal activity during pattern 4 traces fixed structural connections. The slope of occurrence probability versus similarity relationship decreases with the state of consciousness. (D) Patients in UWS presented lower entropy values associated with the patterns’ occurrence probability distribution, suggestive of a less uniform distribution compared to patients in MCS and healthy controls. Notes: (A) The patterns are ordered on the basis of their similarity to the anatomical connectivity, from the least (left) to the most (right) similar. The networks are rendered on the anatomical space (transverse view) and show the top 10% links between ROIs, within the absolute value of phase coherence > 0.2; red/blue edges indicate positive/negative coherence. Aud, auditory; DMN, default mode network; FP, frontoparietal; Mot, motor; Sal, salience; Vis, visual; KW, Kruskal-Wallis test P value; UWS/MCS, Wilcoxon test P value for the comparisons between patients in UWS and patients in MCS. (B) Boxplots represent the medians of the occurrence probabilities with interquartile range and maximum-minimum values (whiskers). (C) Lines are based on the best linear fit for each group; R, Spearman correlation.
In comparison to pattern 4, pattern 1 was characterized by higher spatial complexity, long-distance edges, community structure, and high efficiency (fig. S2), suggestive of a more complex organization of brain-wide coordination. In addition, participant-level modularity, efficiency, integration, and distance showed systematic increases with respect to the participants’ state of consciousness (fig. S3). The robustness of the extracted patterns was tested by repeating the analysis separately for each scanning site and by demonstrating the emergence of similar patterns and dynamic configurations in each individual site (fig. S4). None of the patterns’ occurrence probabilities were mediated by scanning site (Supplementary Methods 1). Similarly, none of the patterns’ occurrence probabilities were mediated by etiology, chronicity, age, or gender (fig. S5). Patterns 2 and 3 were equally probable across all groups and conditions (Spearman rank correlation between rate and group, pattern 2: rho = 0.2, P < 0.01; pattern 3: rho = 0.02, P = 0.8). In addition, conscious participants showed a more uniform probabilistic distribution of the coordination patterns (Fig. 1D); in other words, the entropy of the temporal sequence of patterns increased with the level of consciousness.
To investigate the relationship between brain coordination dynamics and a representative network of the anatomical connections, we measured the observed dynamic patterns of brain coordination and an estimate of human anatomical connectivity independently acquired using diffusion spectrum imaging (DSI) data (fig. S6). The complex pattern 1 presented a low similarity to the anatomical connectivity, whereas pattern 4 was the most similar to the anatomy (Fig. 1C). We then quantified the relationship between the probability of each pattern’s occurrence (y axis) and the similarity to the anatomical connectivity (x axis) by means of the slope of the best least-squares linear fit. We found a weak relationship for healthy participants, suggesting the presence of diverse transient coordination patterns during conscious wakefulness (slope HC = 0.34 ± 0.31, median ± median absolute deviation). The increased slope seen in patients suggests that, despite persistent spontaneous neuronal activity, such activity is most likely to trace the fixed connectivity network (slope MCS = 0.94 ± 0.44, UWS = 1.5 ± 0.31, median ± median absolute deviation).
Further characterization of coordination dynamics was obtained by computing the probabilities of transitioning between different brain coordination patterns (transition probabilities) and the duration of contiguous segments of pattern prevalence. Individuals with higher levels of consciousness were more likely to not only reside in pattern 1 but also to depart to and from this pattern toward patterns 2 and 3. The brains of patients in UWS were more likely to avoid this exploration of the complex coordination pattern and to preferentially reside in the less complex pattern 4. Last, patients in MCS were more likely not only to remain in pattern 1 but also to switch toward patterns 2 and 3 (Fig. 2) than patients in UWS. Controlling the transition probability for the patterns’ absolute (static) frequency of occurrence also revealed an increase of autotransitioning in pattern 1 as a function of the level of consciousness (fig. S7). In addition, we also observed that the overall sequence predictability decreased alongside the state of consciousness, as shown by the systematic increases in entropy rates (estimated from the transitional probability matrices) from patients in UWS to patients in MCS and healthy controls (fig. S8).
Fig. 2. The exploration of the identified coordination patterns differs with respect to the state of consciousness.
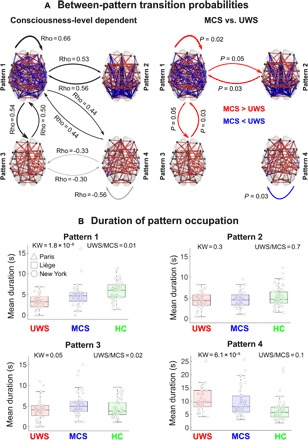
(A) Left: The transition probabilities show an ordinal relationship with the level of consciousness. Black arrows indicate a higher probability to transit between the coordination patterns in healthy controls (HC) as opposed to patients in MCS and patients in UWS (HC > MCS > UWS). Gray arrows indicate the opposite trend (HC < MCS < UWS). Right: Patients in MCS were more likely to stay in the complex pattern 1 and to transition from this pattern to patterns 2 and 3. On the other hand, unresponsive patients were more likely to stay in the pattern most similar to anatomical constraints (pattern 4). Red arrows indicate higher transitional probabilities for patients in MCS, and blue arrows indicate higher transitional probabilities for unresponsive patients. (B) The clinical groups differ with respect to the contiguous amount of time spent in each pattern (after normalizing using randomly shuffled surrogate time series). The complex pattern 1 was explored during longer consecutive periods by healthy controls and patients in MCS, while patients in UWS spent higher periods of time in the overall low positive coordination pattern 4. Patterns 2 and 3 were explored similarly by all groups, further suggesting a transitional role. Notes: (A) Left: Groups are ranked ordinally from UWS, MCS, and HC (Rho: Spearman rank correlation). Right: P, Wilcoxon rank-sum test, false discovery rate corrected. (B) Boxplots represent the medians of mean pattern duration (in seconds) with interquartile range and maximum-minimum values (whiskers); Rho, Spearman rank correlation; UWS/MCS, Wilcoxon test P value for the comparisons between patients in UWS and patients in MCS.
To validate the implication of the identified brain patterns in consciousness, we quantified the generalization of the clustering model trained in dataset 1 into two independent datasets (fig. S9). First, we tested the rates of occurrence of the dataset 1 patterns in an independent group of patients, all of whom were behaviorally in UWS but some of whom presented a cognitive-motor dissociation (dataset 2), to determine their relevance in the capacity for conscious experience, regardless of behavioral output. The latter clinical group presented higher rates of residence in the complex coordination pattern 1, with slopes similar to those observed in healthy controls (fig. S10). On the other hand, patients in UWS lacking evidence of command-following during neuroimaging tasks were more likely to reside in the low-complexity configuration (Fig. 3, left), with slopes comparable to those measured in anesthetized patients (fig. S10). Second, we tested again the rates of occurrence of the dataset 1 patterns in a third dataset of fMRI acquired in anesthetized patients with disorders of consciousness (dataset 3). Our hypothesis was that complex configurations would uniformly disappear across all patients, regardless of clinical diagnosis, as a result of the pharmacologically depressed arousal, cognitive function, and autonomic control typically induced by propofol (22). The pattern identification in anaesthetized patients with disorders of consciousness confirmed this hypothesis, revealing an equalization of occurrence probabilities regardless of clinical diagnosis, congruent with a uniform loss of awareness in this condition (Fig. 3, right).
Fig. 3. The coordination patterns generalize to other states of preserved and diminished consciousness.
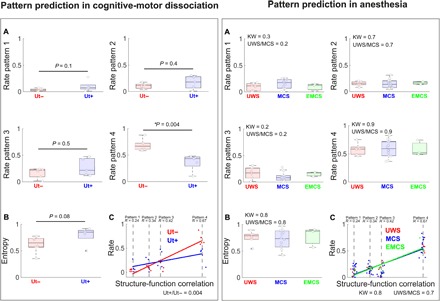
(A) Left: Typical unresponsive patients who did not show command following in mental imagery tasks (Ut−) presented a higher probability of residing in the overall low coordination pattern 4. Conversely, behaviorally unresponsive patients who nevertheless successfully followed commands in mental imagery tasks (Ut+) showed significantly lower probabilities for the same pattern. (B) The sequence of pattern occurrences was more uniformly distributed in the Ut+ group as determined by higher entropy values. (C) The probability of each pattern’s occurrence in Ut+ patients was less dependent on the similarity with the anatomical connectivity, supporting the idea that the dynamic coordination could not be entirely accounted for in terms of structural connections, but rather represented emergent functional processes. (A) Right: Under anesthesia, the complex coordination pattern 1 uniformly became less prevalent across unresponsive patients (UWS), patients in MCS, and conscious patients who have emerged from the MCS (EMCS); in other words, it was reduced independently of the clinical diagnosis. Conversely, the overall low-coordination pattern 4 became uniformly the most prevalent in all anesthetized patients, irrespective of clinical diagnosis, supporting the specificity of this dynamic configuration to unconsciousness. (B) Similar entropy values across all patients validated the hypothesis that propofol homogeneously abolished conscious awareness. (C) Under anesthesia, all clinical groups presented a stronger relationship (i.e., higher slope) between the patterns’ probabilities and the structure-function correlation in comparison to conscious individuals (fig. S10), indicating that brain dynamics largely reflected activity constrained by fixed anatomical pathways. Notes: (C) The patterns are ordered on the basis of their similarity to anatomical connectivity, from the least (left) to the most (right) similar. Boxplots represent medians with interquartile range and maximum-minimum values (whiskers); Rho: Spearman rank correlation between rate and group; UWS/MCS, Wilcoxon test P value for the comparisons between patients in UWS and patients in MCS. Ut+, nonbehavioral MCS/cognitive-motor dissociation; Ut−, unresponsive patients who do not show command following on mental imagery tasks.
DISCUSSION
We studied the brain’s dynamic organization during conscious wakefulness and after severe brain injury leading to disorders of consciousness, with the aim of determining patterns of signal coordination specifically associated with conscious and unconscious states. We identified a pattern of positive and negative long-distance coordination, high modularity, with low similarity to the anatomical connectivity, potentially relevant for the support of conscious cognition (pattern 1). We also identified a pattern of low interregional dynamic coordination, low efficiency, with high similarity to anatomical connectivity, potentially specific to reduced or absent conscious processing (pattern 4). With respect to pattern 1, momentary neural coalitions have been previously shown to constitute a basis for complex cognitive function, with signals fluctuating between states of high and low connectivity and with more integrated states enabling faster and more accurate performance during cognitive tasks (23). With respect to pattern 4, studies in physiological and pharmacological unconsciousness showed a breakdown of long-range interareal positive and negative connections. For example, during sleep, the presence of negative dynamic connections disappear (11). Our results are in line with previous findings in animals. As in the present study, the brain activity of anesthetized nonhuman primates resided most frequently in a pattern of low connectivity resembling the anatomy, which was sustained for longer periods of time in comparison to more complex patterns (15). In addition, we demonstrated that network properties, such as modularity, integration, distance relationship, and efficiency, increased with the participants’ conscious state. The latter result is in line with the hypothesis that high-efficiency patterns carry higher metabolic costs (24), which are restricted under pathological unconscious conditions (25).
Our findings also align with theoretical considerations on dynamic connectivity, suggesting that alternating patterns of correlations and anticorrelations may constitute a fundamental property of information processing in the brain (26). Different models of consciousness propose that intermittent epochs of global synchronization grant segregated and parallel network elements access to a global workspace, integrating them serially and allowing effortful conscious cognition (27). Therefore, the transient exploration of this global workspace could permit the brain to efficiently balance both segregated and integrated neural dynamics and to encode globally broadcasted and therefore reportable conscious contents (3). In the absence of transient epochs of global synchronization, the transmission of information is expected to be relatively ineffective (6).
With respect to patterns 2 and 3, these were not predominantly preferred by any group in terms of occurrence probabilities and duration and hence could represent transitional states (28). Pattern 3 showed the overall positive interareal coherence. For pattern 2, the significance of the overall negative coherence with regions of the visual network can only be speculated. For the moment, we suggest that it indicates the presence of a local coordination pattern reflecting the anatomical organization of the visual cortex (29).
Whether the identified dynamic coordination patterns entail the presence/absence of mental contents or cognitive function is difficult to assume without probing moment-to-moment changes in the contents of conscious experience. Although a link has been shown between intrinsic connectivity networks and various behavioral tasks (30), it has been suggested that BOLD correlations need not necessarily reflect moment-to-moment changes in cognitive content. Instead, they may predominantly reflect processes necessary for maintaining the stability of the brain’s functional organization (31). Also, the BOLD signal is nonstationary (32), and some of its spontaneous fluctuations may not be a faithful reflection of functionally relevant brain dynamics or the underlying nonstationarities of neural activity and coordination (10). We also acknowledge that the identification of these dynamic configurations required time-resolved analyses of fMRI time series in the scale of few seconds. It can be argued that conscious cognition and the relevant features of our environment develop on a faster time scale of hundreds of milliseconds (3). However, the BOLD signal has been shown to correlate with infraslow neurophysiological oscillations, i.e., the slow cortical potential (33). The slow cortical potential is important for large-scale information integration, hence suggesting that the flow of the conscious experience could be supported by processes at slower time scales (34). Future experiments should address a potential relationship between conscious experience, the slow cortical potential, and functional network reconfigurations measured as with fMRI.
Regardless of the implicated time scales, our analyses did not aim at tracking the moment-to-moment contents of conscious experience, but at identifying brain-wide dynamic networks supporting different global states of consciousness. We consider that the four-pattern model can account for modes of conscious and unconscious information processing. Our interpretation is sustained by the additional tests for the validity and replicability of the main results. We found that the complex dynamic pattern 1 presented low probabilities of appearing in patients under propofol anesthesia (whether they were communicating or not at baseline) and that it was most likely to appear in patients with covert cognition (i.e., patients in UWS who successfully performed mental imagery neuroimaging tasks). Both findings suggest its implication in conscious states. We also found that the pattern of low interareal coordination (pattern 4) uniformly presented higher probabilities of appearing in all anesthetized patients, regardless of clinical diagnosis, and it was most likely to manifest in unresponsive patients who did not perform the mental imagery neuroimaging task, supporting its relationship to absent or reduced conscious cognition.
Pattern 4 remained visited by healthy controls even under typical wakeful conditions. In the absence of experience sampling during data acquisition, the interpretation of this finding can only be speculative. On the one hand, it could be that healthy controls entered transient microsleep states as a result of fluctuating levels of vigilance, a frequently observed phenomenon during resting-state experiments (35). Our experimental setup did not include simultaneous polysomnography recordings to directly test this hypothesis. However, we derived different fMRI-based proxies to assess the presence of microsleeps. First, we examined head movements time locked to the occurrence of all coordination patterns and found no substantial associations between the two variables, as could be expected if pattern 4 was related to lapses in vigilance. Second, we performed a whole-brain general linear model (GLM) analysis, with the coordination pattern time series as regressors. We did not observe significant positive/negative BOLD signal changes associated with the onset of the different coordination patterns; in particular, the presence of coordination pattern 4 did not result in BOLD signal changes typical of microsleeps. Last, the likelihood of pattern 4 occurring over time did not positively correlate with the elapsed scan time, as has been shown to occur for patterns associated with lapses in vigilance (35, 36). Once we rule out transient loss of vigilance as the cause of the intrusion of pattern 4 in conscious wakefulness, we can speculate that the flow of conscious cognition may be separated by periods of absent or reduced effortful information processing, as recently it was hypothesized that between two successive self-reports, a subject may present states of reduced awareness (37). Behaviorally, this could take the form of “mind blanks” during which participants are not engaged in cognitive demanding processes, although they remain vigilant (38). This interpretation is parsimonious with the observation that participants were instructed to rest inside the scanner, without engaging in any effortful cognitive task. The potential role of transient lapses of awareness in the stream of conscious contents during healthy wakefulness should be addressed by future experiments.
Together, our results suggest that, following loss of consciousness, coordinated brain activity is largely restricted to a positive pattern of interareal coherence dominated by the anatomical connections between brain regions. In contrast, conscious states are characterized by a higher prevalence of a complex configuration of interareal coordination that, while still constrained by brain anatomy, also deviates from it and presents both positive and negative long-distance interactions. It did not escape us that such a complex interareal coordination pattern sporadically appeared in the group of unresponsive patients. The real-time detection of this pattern and its reinforcement though externally induced manipulations could represent a promising avenue for the noninvasive restoration of consciousness. We conclude that these patterns of transient brain signal coordination are characteristic of conscious and unconscious brain states, warranting future research concerning their relationship to ongoing conscious content, and the possibility of modifying their prevalence by external perturbations, both in healthy and pathological individuals, as well as across species.
MATERIALS AND METHODS
Experimental design
Cross-sectional observational study. Measurement technique: fMRI, standardized behavioral assessments. Type of observations: BOLD time series, behavioral observations.
Participants
Data were collected from a cohort of 169 individuals scanned in four clinical expert centers in Belgium [Department of Radiology, Centre Hospitalier Universitaire (CHU), Liège; n = 87], France (Department of Neuroradiology, Pitié-Salpêtrière Hospital, Paris; n = 43), United States (Citigroup Biomedical Imaging Center, Weill Cornell Medical College, New York; n = 28), and Canada (Centre for Functional and Metabolic Mapping, Western’s Robarts Research Institute, London, Ontario; n = 11). The cohort included 47 healthy controls and 122 patients suffering from disorders of consciousness leading to a vegetative state/UWS or in a MCS. Patients in UWS open their eyes but never exhibit nonreflex voluntary movements, indicating preserved awareness (39). Patients in MCS show more complex behaviors potentially declarative of awareness, such as visual pursuit, orientation to pain, or nonsystematic command following but who, nevertheless, remain unable to communicate their thoughts and feelings (40).
Inclusion criteria for patients were brain damage at least 7 days after the acute brain insult and behavioral diagnosis of the MCS or UWS performed with the Coma Recovery Scale–Revised (CRS-R) (41). The CRS-R evaluates 23 arranged items organized on subscales for auditory, visual, motor, oromotor, communication, and arousal function. Each item assesses the presence or absence of specific physical signs, which represent the integrity of brain function as generalized, localized, or cognitively mediated responsiveness. Patients were excluded when there was contraindication for MRI (e.g., the presence of ferromagnetic aneurysm clips and pacemakers). In addition, 10 patients (6 from Paris, 3 from Liège, and 1 from New York; 8 in MCS and 2 in UWS) were discarded because the signal extracted from the selected ROIs was partially missing during the recordings, resulting in the final cohort of 112 patients (table S1). Inclusion criteria for healthy controls were >18 years old and free of psychiatric and neurological history. The study was approved by the Ethics Committee of the Medical School of the University of Liège, the Ethics Committee of the Pitié-Salpêtrière Hospital, the Institutional Review Board at Weill Cornell Medical College, and the Western University Research Ethics Board. Informed consent to participate in the study was obtained directly from healthy control participants and the legal surrogates of the patients.
The cohort was divided into three datasets. Dataset 1 (n = 125) was used for the main analysis, with the aim of identifying the dynamic coordination patterns. It included 47 healthy controls and 78 patients, all scanned under an anesthesia-free resting-state condition [Liège: 21 healthy controls (8 females; mean age, 45 ± 17 years), 40 patients (23 in MCS, 17 in UWS, 11 females; mean age, 47 ± 18 years; 12 traumatic, 28 nontraumatic of which 17 anoxic, 10 patients assessed under acute condition, i.e., <30 days after insult); Paris: 15 healthy controls (9 females; mean age, 41 ± 13 years), 22 patients (9 in MCS, 13 in UWS, 9 females; mean age, 45 ± 17 years; 5 traumatic, 19 nontraumatic of which 12 anoxic, 3 patients assessed in acute setting, i.e., <30 days after insult); New York: 11 healthy controls (3 females; mean age, 32 ± 11 years), 16 patients (10 in MCS, 6 in UWS, 8 females; mean age, 44 ± 14 years; 8 traumatic, 8 nontraumatic of which 4 anoxic, all patients assessed chronic setting, i.e., >30 days after insult)]. Dataset 2 (n = 11) included patients with cognitive-motor dissociation (20), i.e., lacking overt conscious behavior yet evidenced using functional neuroimaging (Ut+), and patients who did not perform the imagery task and hence were considered in UWS (Ut−). This dataset was used to test the hypothesis that the complex coordination pattern would be more frequent in the Ut+ patients, whereas the low coordination pattern would be more frequent in patients in UWS who could not perform the task (Ut−) [London, Ontario: 5 Ut+, 6 Ut−; seven females; mean age, 36 ± 15 years; two traumatic, nine nontraumatic of which eight anoxic, all patients assessed in chronic setting, i.e., >30 days after insult)]. Dataset 3 (n = 23) included patients scanned under propofol anesthesia and was used to test the hypothesis that complex coordination would disappear as an effect of overall cerebral depression due to the administered anesthetic [Liège: 3 emergence from MCS, 14 in MCS, 6 in UWS; 6 females; mean age, 37 ± 14 years; 16 traumatic, 7 nontraumatic of which 3 anoxic, 21 patients assessed in chronic setting, i.e., >30 days after insult)]. Details on patients’ demographics and clinical characteristics are summarized in table S1.
Anesthesia protocol
Patients were scanned in anesthesia after medical decision, with the aim of minimizing motion in the scanner, and it was performed by a certified anesthesiologist. Before scanning, all patients fasted for at least 6 hours for solids and 2 hours for liquids. Propofol was administered through intravenous infusion using a target-controlled infusion system, and the concentration was kept to the minimum (1 to 2 μg/ml). To ensure adequate airing, some patients received assisted mechanical ventilation through a tracheostomy, a laryngeal mask, or an endotracheal tube when already in place. Additional oxygen was delivered in some cases, either through a face mask or through the airway instrumentation device. Patients’ physiologic parameters (arterial blood pressure, electrocardiogram, breathing frequency, and pulse oximetry) were closely and continuously monitored. Propofol was titrated to achieve immobility in the scanner. Once obtained, the necessary plasma concentration of propofol was kept constant throughout the procedure. A complete resuscitation equipment was present during the procedure.
Imaging acquisition parameters
In Liège, data were acquired on a 3T Siemens TIM Trio MRI scanner (Siemens Medical Solutions, Erlangen, Germany): 300 T2*-weighted images were acquired with a gradient-echo echo-planar imaging (EPI) sequence using axial slice orientation and covering the whole brain (32 slices; slice thickness, 3 mm; repetition time, 2000 ms; echo time, 30 ms; voxel size, 3 × 3 × 3 mm; flip angle, 78°; field of view, 192 mm by 192 mm). A structural T1 magnetization-prepared rapid gradient-echo (MPRAGE) sequence (120 slices; repetition time, 2300 ms; echo time, 2.47 ms; voxel size, 1.0 × 1.0 × 1.2 mm; flip angle, 9°).
In Paris, data were acquired on a 3T General Electric Signa System (Milwaukee, WI): 200 T2*-weighted images were acquired with a gradient-echo EPI sequence using axial slice orientation and covering the whole brain (48 slices; slice thickness, 3 mm; repetition time, 2400 ms; echo time, 30 ms; voxel size, 3.4375 × 3.4375 × 3.4375 mm; flip angle, 90°; field of view, 192 mm by 192 mm). A T1 MPRAGE sequence was further acquired in the same session (236 slices; repetition time, 7156 ms; echo time, 3.672 ms; voxel size, 0.4883 × 0.4883 × 0.4883 mm; flip angle, 15°).
In New York, data were acquired on a 3T General Electric Signa System (Milwaukee, WI): 180 T2*-weighted images were acquired with a gradient-echo EPI sequence using axial slice orientation and covering the whole brain (28 slices; repetition time, 2000 ms; echo time, 40 ms; voxel size, 3.75 × 3.75 × 5 mm; flip angle, 70°). A T1-weighted three-dimensional (3D) inversion recovery-prepared spoiled gradient echo sequence was further acquired in the same session (120 slices; repetition time, 8.864 ms; echo time, 3.524 ms; inversion time, 400 ms; voxel size, 0.9375 × 0.9375 × 1.2 mm; flip angle, 13°).
In London, Ontario, data were acquired on 3T Siemens TIM Trio and 3T Siemens Prisma MRI scanners: 256 T2*-weighted images were acquired with a gradient-echo EPI sequence using axial slice orientation and covering the whole brain (33 slices; slice thickness, 3 mm; repetition time, 2000 ms; echo time, 30 ms; voxel size, 3 × 3 × 3 mm; flip angle, 75°); a T1-weighted 3D inversion recovery-prepared spoiled gradient echo sequence was further acquired in the same session (176 slices; slice thickness, 1 mm; repetition time, 2530 ms; echo time, 3.34 ms; voxel size, 1 × 1 × 1 mm; flip angle, 7°).
Data preprocessing and time series extraction
Preprocessing was performed as previously reported (21) using Statistical Parametric Mapping 12 (SPM12; www.fil.ion.ucl.ac.uk/spm). Preprocessing steps included slice-time correction, realignment, segmentation of structural data, normalization of functional and structural data into the standard stereotactic Montreal Neurological Institute space, and spatial smoothing using a Gaussian kernel of 6-mm full width at half-maximum. For functional data, the three initial volumes were discarded to avoid T1 saturation effects. Motion artifact detection and rejection were performed with the artifact detection toolbox (ART toolbox): An image was defined as an outlier or artifact image if the head displacement in the x, y, or z direction was greater than 2 mm from the previous frame, if the rotational displacement was greater than 0.02 rad from the previous frame, or if the global mean intensity in the image was greater than 3 SDs from the mean image intensity for the entire resting scan. Outliers in the global mean signal intensity and motion were subsequently included as nuisance regressors within the first-level GLM so that the temporal structure of the data would not be disrupted. As a data quality measure, we calculated the number of motion outliers that were detected during preprocessing. The number of motion outlier images was similar across the groups of healthy controls (mean rank, 61), patients in MCS (mean rank, 72), and patients in UWS [mean rank, 74; Kruskal-Wallis test, H(2) = 2.5, P = 0.3], suggesting comparable datasets.
For noise reduction, we modeled the influence of noise as a voxel-specific linear combination of multiple empirically estimated noise sources by deriving principal components from noise ROIs and by including them as nuisance parameters within the GLMs (as implemented in the CONN functional connectivity toolbox, v.16.b). Specifically, the anatomical image for each participant was segmented into white matter (WM), gray matter (GM), and cerebrospinal fluid (CSF) masks (old normalize function, SPM12). To minimize partial voluming with GM, the WM and CSF masks were eroded by one voxel, which resulted in smaller masks than the original segmentations. The eroded WM and CSF masks were then used as noise ROIs. Used time series were from the unsmoothed functional volumes to avoid additional risk of contaminating WM and CSF signals with GM signals. Five principal components of the signals from WM and CSF noise ROIs were removed with regression. A temporal band-pass filter of 0.008 to 0.09 Hz was applied on the time series to restrict the analysis to low-frequency fluctuations. Residual head motion parameters (three rotation and three translation parameters and six parameters representing their first-order temporal derivatives) were further regressed out. For each sphere ROI, time series were extracted by averaging all voxels’ signal within the ROI at a given brain volume. A total of 42 network-based ROIs were selected (table S2). Concerning the positive coupling between ROIs belonging to the default mode network (DMN) and the frontoparietal (FP) network observed in some of our dynamic coordination patterns, we noted that previous articles (42, 43) using the same set of ROIs (as well as similar data preprocessing) also reported positive connectivity between them. Therefore, it is possible that the precise choice of FP ROIs introduced in these articles does not robustly represent the FP/DMN anticorrelations present in the data. Most likely, this is due to the fact that some FP ROIs are located in the proximity of the FP/DMN boundary, and the spatial extent of RSN is known to present important interperson variability, especially in higher-order heteromodal association cortices (44). However, we noted that the DMN ROIs were anticorrelated to other task-positive ROIs, as expected.
Statistical analysis: Dynamic functional coordination analysis
Phase-based dynamic functional coordination was preferred to a sliding-window approach because it avoids the inclusion of overlapping signals in the estimation of temporal oscillations (6). To obtain a phase signal corresponding to the BOLD time series of each ROI, the analytic representation of the signals was used. The analytic signal was expressed in the imaginary space and was composed by the original signal (real part) and the corresponding Hilbert transform of this signal (imaginary part). This representation allows for the computation of the instantaneous phase. Using Euler’s formula, the analytic signal can be represented as the combination of two instantaneous real signals: amplitude and phase. The phase was calculated as the inverse tangent of the ratio of the imaginary and real components. Afterward, the phase was “wrapped” to values between −π and π, and the instantaneous phase θ(t) was related to zero crossings and BOLD peaks. Inter-ROI phase difference was computed using the difference of each pair of ROI instantaneous phase signals.
To assess the presence of recurrent coordination patterns across individuals and patients of dataset 1 (n = 125), we adopted the following steps. First, we restructured each scanning session as a matrix with phase-difference values in one dimension ([42 × (42 − 1)]/2 = 861 features) and time in the other dimension (279 images). Second, we concatenated all the matrices by the time dimension, yielding a matrix of 861 × 34875 elements. Last, the k-means clustering algorithm was applied to the concatenated matrix using the L1 distance (a.k.a. “Manhattan distance”) as implemented in MATLAB (MathWorks Inc.). The clustering algorithm was applied 500 times to avoid local minima using a random initialization of centroid positions in each iteration. As a result of this procedure, we obtained (i) k cluster centroids (42 × 42 matrices), which are representative of the recurrent coordination patterns, and (ii) a label indicating the pattern corresponding to each image of the scanning session. The number of clusters k was determined as previously reported (k = 4) (36), although additional exploratory analyses varying k from 3 to 7 demonstrated consistent and robust results (fig. S1A). In addition, our results showed stable first and last coordination patterns (ordered in terms of their similarity to the anatomical connectivity) for all the choices of the clustering k (fig. S1B) and a maximal interpattern variance when setting this o obtain four clusters (fig. S1C).
For dataset 2 and dataset 3, we characterized the sequence of phase coherence matrices based on the coordination patterns obtained from dataset 1. More precisely, we computed the L1 distance between each phase coherence matrix and the cluster centroids determined in dataset 1. Each scanning volume was then assigned the label of the centroid that minimized its distance with the phase coherence matrix associated with that volume.
In all cases, we computed the occurrence rate of each pattern for each individual as the total number of volumes for which that given pattern was present divided by the total number of volumes of the acquisition. To rule out potential effects related to the scanning site on the identified brain patterns, we computed four independent analyses of variance (ANOVAs) (one for each pattern) with the pattern rate of occurrences as the dependent variable and the patient’s clinical condition and scanning site as independent factors (see Supplementary Methods 1). Last, entropy was computed using the classical definition, which considers the sum of the probabilities of the patterns weighted by their corresponding logarithms (, where N is the total number of patterns and pi is the probability of observing the ith pattern). In this definition, we used a base-2 logarithm, which results in the equivalent definition of the amount of information contained in the symbolic sequence of patterns (measured in bits).
To further describe the dynamic nature of the pattern exploration, we obtained, for each participant, a matrix containing information about the probabilities that any given pattern to transition into another. This matrix contains, in its ith row, the normalized (i.e., sum equal to one) frequency distribution of observing a volume labeled as the ith pattern transitioning into the pattern corresponding to the jth column. The average contiguous amount of time spent in each pattern for each clinical group was corrected for random durations by subtracting the average duration of surrogate shuffled pattern series.
The sequence predictability for each individual was quantified using the entropy rate (Markov entropy) for the corresponding pattern probabilities and the transition probability matrices. The entropy rate for the sequence of brain patterns of each participant was computed as follows
where μi corresponds to the probability of observing pattern i and Pij corresponds to the transition probability from pattern i to pattern j.
To investigate the dependence of brain dynamics on the state of consciousness, we defined a measure of similarity between functional and structural connectivity. We resorted to a widely used group estimate of human anatomical connectivity, measured with the noninvasive technique of DSI (fig. S6). The procedure followed to acquire DSI data and construct the anatomical connectivity network was extensively explained elsewhere (45). Briefly, high-resolution T1 and diffusion spectrum images were acquired for five healthy participants (mean age, 29.4 years; all male) and 998 ROIs (1.5-cm2 area) placed throughout the cortex (excluding subcortical regions) of individual participants, being later mapped into a common space. WM tractography was applied to compute fiber trajectories and construct a network by linking every two nodes for which a fiber existed that started in one and ended in the other. A group consensus network was created by linking nodes connected in at least one of the participants, resulting in a binary network of density 0.0359. Since the choice of regions of the 998 ROIs used in (45) did not match our 42 ROIs (selected from literature performing independent component analysis), we resampled the network by considering 30-mm spheres centered at each of the 42 ROIs and computed the mean structural connectivity between all the original 998 regions within each pair of spheres. This resulted in a symmetric 42 × 42 matrix containing in each entry the mean anatomical connectivity value observed between the corresponding pair of ROIs. We obtained similar results when reducing the original DSI matrix using different sphere diameters (10 and 20 mm; fig. S11). Last, to compare the phase-based coherence and anatomical connectivity matrices, we computed the linear correlation coefficient between the entries of both matrices (coherence/anatomical correlation). This was performed for each phase-based coordination pattern obtained using the k-means algorithm. Last, for each participant, we computed the linear slope coefficient of the relationship between the occurrence rate of each brain pattern and the corresponding coherence/anatomical correlation.To better understand the identified patterns, a quantitative description by means of graph theory metrics was performed to reveal the level of underlying complexity that may not be evident upon direct observation (Supplementary Methods 2).
Supplementary Material
Acknowledgments
We would like to express our gratitude to V. Bonhomme and M. Kirsch (GIGA-Consciousness, Anesthesia and Intensive Care laboratories, CHU Liège) for assistance in performing anesthesia in patients. We thank L. Tshibanda (Liège CHU Neuroradiology Department) and D. Gallanaud (Hôpital Pitié-Salpêtrière Neuroradiology Department) for assistance in participant scanning. We thank L. E. Gonzalez-Lara (Brain and Mind Institute, University of Western Ontario) for assistance in data acquisition. We acknowledge the assistance of M. M. Conte (Brain and Mind Research Institute, Weill Cornell Medical College) for sharing neuroimaging data. We thank C. Aubinet and M. Carriere, PhD candidates (Coma Science Group, GIGA Consciousness, University of Liège), for assistance in neuroimaging data acquisition. We are grateful to V. Perlbarg (Bioinformatics and Biostatistics Platform, IHU-A-ICM, Institut du Cerveau et de la Moelle épinière, Paris) for assistance during data preprocessing. We are highly grateful to the members of the Liège Coma Science Group and the Paris PICNIC Lab DOC Team for assistance in clinical evaluations. Last, we would like to express our gratitude to A. Schurger (Neurospin, Unicog, CEA-Saclay) for manuscript proofreading. Funding: The reported data have been collected and shared among partners participating in the James S. McDonnell Foundation Collaborative Activity Award “Recovery of Consciousness After Severe Brain Injury” (phases I and II; 2008–2017). This work has been further financially supported by the INSERM, the Belgian National Funds for Scientific Research (FNRS), the Institut du Cerveau et de la Moelle épinière (ICM), the Canada Excellence Research Chairs (CERC) program, the CIFAR Canadian Institute for Advanced Research, the Canadian Institutes of Health Research (CIHR), the European Commission, the Human Brain Project (EU-H2020-FETFLAGSHIP-HBP-SGA1-GA720270), the Luminous project (EU-H2020-fetopen-ga686764), the Center-TBI project (FP7-HEALTH- 602150), the Belgian American Education Foundation, the Wallonie-Bruxelles International, the Fonds Léon Fredericq, “Fondazione Europea di Ricerca Biomedica,” European Space Agency, Belspo, BIAL Foundation, the Mind Science Foundation, the French Speaking Community Concerted Research Action (ARC-06/11-340), and the University and University Hospital of Liège. Author contributions: A.D., E.T., and J.D.S. designed the research. A.D., E.T., G.D., P.B., F.R., D.F.-E., and J.D.S. analyzed the data. A.D., E.T., S.D., N.D.S., A.M.O., S.L., L.N., and J.D.S. interpreted the data. N.D.S., A.M.O., S.L., L.N., B.R., C.M., and H.U.V. curated and provided the data. A.D., E.T., and J.D.S. wrote the manuscript. All authors contributed to the editing of the manuscript. Competing interests: The authors declare that they have no competing interests. Data and materials availability: Data have been stored locally, following national and EU laws on the protection of individuals with regard to the processing of personal data. The clinical data used in this paper may be available upon reasonable request. All data needed to evaluate the conclusions in the paper are present in the paper and/or the Supplementary Materials.
SUPPLEMENTARY MATERIALS
Supplementary material for this article is available at http://advances.sciencemag.org/cgi/content/full/5/2/eaat7603/DC1
Supplementary Methods 1
Supplementary Methods 2
Fig. S1. The four recurrent dynamic coordination patterns emerge at different dimensionalities.
Fig. S2. Network analysis of the identified patterns shows that consciousness-related patterns are characterized by higher spatial complexity, long-distance negative edges, community structure, and high efficiency.
Fig. S3. Network properties reflect the state of consciousness.
Fig. S4. Robustness of the extracted coordination patterns.
Fig. S5. Etiology, chronicity age, and gender do not mediate patients’ temporal dynamics.
Fig. S6. The structural connectivity network is defined from DSI and contains systems-based ROIs.
Fig. S7. Transition probabilities normalized by the patterns’ probabilities of occurrence.
Fig. S8. Entropy rate increases with respect to the state of consciousness.
Fig. S9. Pattern validation in dataset 2 (“Canada”) and dataset 3 (“Anesthesia”).
Fig. S10. Dataset slope comparisons.
Fig. S11. Replication of the structural-functional analysis with different granularity of the structural matrix reduction.
Table S1. Patients’ demographic and clinical characteristics per scanning site (n = 112).
Table S2. Network-level ROIs used as seed areas.
REFERENCES AND NOTES
- 1.Storm J. F., Boly M., Casali A. G., Massimini M., Olcese U., Pennartz C. M. A., Wilke M., Consciousness regained: Disentangling mechanisms, brain systems, and behavioral responses. J. Neurosci. 37, 10882–10893 (2017). [DOI] [PMC free article] [PubMed] [Google Scholar]
- 2.Stern P., Neuroscience: In search of new concepts. Science 358, 464–465 (2017). [DOI] [PubMed] [Google Scholar]
- 3.Tononi G., Consciousness as integrated information: A provisional manifesto. Biol. Bull. 215, 216–242 (2008). [DOI] [PubMed] [Google Scholar]
- 4.Northoff G., Huang Z., How do the brain’s time and space mediate consciousness and its different dimensions? Temporo-spatial theory of consciousness (TTC). Neurosci. Biobehav. Rev. 80, 630–645 (2017). [DOI] [PubMed] [Google Scholar]
- 5.Dehaene S., Changeux J.-P., Experimental and theoretical approaches to conscious processing. Neuron 70, 200–227 (2011). [DOI] [PubMed] [Google Scholar]
- 6.Deco G., Kringelbach M. L., Metastability and coherence: Extending the communication through coherence hypothesis using a whole-brain computational perspective. Trends Neurosci. 39, 125–135 (2016). [DOI] [PubMed] [Google Scholar]
- 7.Breakspear M., Dynamic models of large-scale brain activity. Nat. Neurosci. 20, 340–352 (2017). [DOI] [PubMed] [Google Scholar]
- 8.Zalesky A., Fornito A., Cocchi L., Gollo L. L., Breakspear M., Time-resolved resting-state brain networks. Proc. Natl. Acad. Sci. U.S.A. 111, 10341–10346 (2014). [DOI] [PMC free article] [PubMed] [Google Scholar]
- 9.Betzel R. F., Fukushima M., He Y., Zuo X.-N., Sporns O., Dynamic fluctuations coincide with periods of high and low modularity in resting-state functional brain networks. Neuroimage 127, 287–297 (2016). [DOI] [PMC free article] [PubMed] [Google Scholar]
- 10.Hutchison R. M., Womelsdorf T., Allen E. A., Bandettini P. A., Calhoun V. D., Corbetta M., Della Penna S., Duyn J. H., Glover G. H., Gonzalez-Castillo J., Handwerker D. A., Keilholz S., Kiviniemi V., Leopold D. A., de Pasquale F., Sporns O., Walter M., Chang C., Dynamic functional connectivity: Promise, issues, and interpretations. Neuroimage 80, 360–378 (2013). [DOI] [PMC free article] [PubMed] [Google Scholar]
- 11.Tagliazucchi E., von Wegner F., Morzelewski A., Brodbeck V., Jahnke K., Laufs H., Breakdown of long-range temporal dependence in default mode and attention networks during deep sleep. Proc. Natl. Acad. Sci. U.S.A. 110, 15419–15424 (2013). [DOI] [PMC free article] [PubMed] [Google Scholar]
- 12.Chow H. M., Horovitz S. G., Carr W. S., Picchioni D., Coddington N., Fukunaga M., Xu Y., Balkin T. J., Duyn J. H., Braun A. R., Rhythmic alternating patterns of brain activity distinguish rapid eye movement sleep from other states of consciousness. Proc. Natl. Acad. Sci. U.S.A. 110, 10300–10305 (2013). [DOI] [PMC free article] [PubMed] [Google Scholar]
- 13.Tagliazucchi E., Chialvo D. R., Siniatchkin M., Amico E., Brichant J.-F., Bonhomme V., Noirhomme Q., Laufs H., Laureys S., Large-scale signatures of unconsciousness are consistent with a departure from critical dynamics. J. R. Soc. Interface 13, 20151027 (2016). [DOI] [PMC free article] [PubMed] [Google Scholar]
- 14.Amico E., Gomez F., Di Perri C., Vanhaudenhuyse A., Lesenfants D., Boveroux P., Bonhomme V., Brichant J.-F., Marinazzo D., Laureys S., Posterior cingulate cortex-related co-activation patterns: A resting state fMRI study in propofol-induced loss of consciousness. PLOS ONE 9, e100012 (2014). [DOI] [PMC free article] [PubMed] [Google Scholar]
- 15.Barttfeld P., Uhrig L., Sitt J. D., Sigman M., Jarraya B., Dehaene S., Signature of consciousness in the dynamics of resting-state brain activity. Proc. Natl. Acad. Sci. U.S.A. 112, 887–892 (2015). [DOI] [PMC free article] [PubMed] [Google Scholar]
- 16.Hudetz A. G., Liu X., Pillay S., Dynamic repertoire of intrinsic brain states is reduced in propofol-induced unconsciousness. Brain Connect. 5, 10–22 (2015). [DOI] [PMC free article] [PubMed] [Google Scholar]
- 17.Monti M. M., Vanhaudenhuyse A., Coleman M. R., Boly M., Pickard J. D., Tshibanda L., Owen A. M., Laureys S., Willful modulation of brain activity in disorders of consciousness. N. Engl. J. Med. 362, 579–589 (2010). [DOI] [PubMed] [Google Scholar]
- 18.Casarotto S., Comanducci A., Rosanova M., Sarasso S., Fecchio M., Napolitani M., Pigorini A., Casali A. G., Trimarchi P. D., Boly M., Gosseries O., Bodart O., Curto F., Landi C., Mariotti M., Devalle G., Laureys S., Tononi G., Massimini M., Stratification of unresponsive patients by an independently validated index of brain complexity. Ann. Neurol. 80, 718–729 (2016). [DOI] [PMC free article] [PubMed] [Google Scholar]
- 19.Engemann D. A., Raimondo F., King J.-R., Rohaut B., Louppe G., Faugeras F., Annen J., Cassol H., Gosseries O., Fernandez-Slezak D., Laureys S., Naccache L., Dehaene S., Sitt J. D., Robust EEG-based cross-site and cross-protocol classification of states of consciousness. Brain 141, 3179–3192 (2018). [DOI] [PubMed] [Google Scholar]
- 20.Schiff N. D., Cognitive motor dissociation following severe brain injuries. JAMA Neurol. 72, 1413–1415 (2015). [DOI] [PubMed] [Google Scholar]
- 21.Demertzi A., Antonopoulos G., Heine L., Voss H. U., Crone J. S., de Los Angeles C., Bahri M. A., Di Perri C., Vanhaudenhuyse A., Charland-Verville V., Kronbichler M., Trinka E., Phillips C., Gomez F., Tshibanda L., Soddu A., Schiff N. D., Whitfield-Gabrieli S., Laureys S., Intrinsic functional connectivity differentiates minimally conscious from unresponsive patients. Brain 138, 2619–2631 (2015). [DOI] [PubMed] [Google Scholar]
- 22.Fiset P., Paus T., Daloze T., Plourde G., Meuret P., Bonhomme V., Hajj-Ali N., Backman S. B., Evans A. C., Brain mechanisms of propofol-induced loss of consciousness in humans: A positron emission tomographic study. J. Neurosci. 19, 5506–5513 (1999). [DOI] [PMC free article] [PubMed] [Google Scholar]
- 23.Shine J. M., Bissett P. G., Bell P. T., Koyejo O., Balsters J. H., Gorgolewski K. J., Moodie C. A., Poldrack R. A., The dynamics of functional brain networks: Integrated network states during cognitive task performance. Neuron 92, 544–554 (2016). [DOI] [PMC free article] [PubMed] [Google Scholar]
- 24.Bullmore E., Sporns O., The economy of brain network organization. Nat. Rev. Neurosci. 13, 336–349 (2012). [DOI] [PubMed] [Google Scholar]
- 25.Stender J., Mortensen K. N., Thibaut A., Darkner S., Laureys S., Gjedde A., Kupers R., The minimal energetic requirement of sustained awareness after brain injury. Curr. Biol. 26, 1494–1499 (2016). [DOI] [PubMed] [Google Scholar]
- 26.Demertzi A., Soddu A., Laureys S., Consciousness supporting networks. Curr. Opin. Neurobiol. 23, 239–244 (2013). [DOI] [PubMed] [Google Scholar]
- 27.Dehaene S., Kerszberg M., Changeux J.-P., A neuronal model of a global workspace in effortful cognitive tasks. Proc. Natl. Acad. Sci. U.S.A. 95, 14529–14534 (1998). [DOI] [PMC free article] [PubMed] [Google Scholar]
- 28.Fornito A., Harrison B. J., Zalesky A., Simons J. S., Competitive and cooperative dynamics of large-scale brain functional networks supporting recollection. Proc. Natl. Acad. Sci. U.S.A. 109, 12788–12793 (2012). [DOI] [PMC free article] [PubMed] [Google Scholar]
- 29.Genç E., Schölvinck M. L., Bergmann J., Singer W., Kohler A., Functional connectivity patterns of visual cortex reflect its anatomical organization. Cereb. Cortex 26, 3719–3731 (2016). [DOI] [PubMed] [Google Scholar]
- 30.Laird A. R., Fox P. M., Eickhoff S. B., Turner J. A., Ray K. L., McKay D. R., Glahn D. C., Beckmann C. F., Smith S. M., Fox P. T., Behavioral interpretations of intrinsic connectivity networks. J. Cogn. Neurosci. 23, 4022–4037 (2011). [DOI] [PMC free article] [PubMed] [Google Scholar]
- 31.Laumann T. O., Snyder A. Z., Mitra A., Gordon E. M., Gratton C., Adeyemo B., Gilmore A. W., Nelson S. M., Berg J. J., Greene D. J., McCarthy J. E., Tagliazucchi E., Laufs H., Schlaggar B. L., Dosenbach N. U. F., Petersen S. E., On the stability of BOLD fMRI correlations. Cereb. Cortex 27, 4719–4732 (2017). [DOI] [PMC free article] [PubMed] [Google Scholar]
- 32.Fukunaga M., Horovitz S. G., van Gelderen P., de Zwart J. A., Jansma J. M., Ikonomidou V. N., Chu R., Deckers R. H. R., Leopold D. A., Duyn J. H., Large-amplitude, spatially correlated fluctuations in BOLD fMRI signals during extended rest and early sleep stages. Magn. Reson. Imaging 24, 979–992 (2006). [DOI] [PubMed] [Google Scholar]
- 33.He B. J., Snyder A. Z., Zempel J. M., Smyth M. D., Raichle M. E., Electrophysiological correlates of the brain’s intrinsic large-scale functional architecture. Proc. Natl. Acad. Sci. U.S.A. 105, 16039–16044 (2008). [DOI] [PMC free article] [PubMed] [Google Scholar]
- 34.He B. J., Raichle M. E., The fMRI signal, slow cortical potential and consciousness. Trends Cogn. Sci. 13, 302–309 (2009). [DOI] [PMC free article] [PubMed] [Google Scholar]
- 35.Tagliazucchi E., Laufs H., Decoding wakefulness levels from typical fMRI resting-state data reveals reliable drifts between wakefulness and sleep. Neuron 82, 695–708 (2014). [DOI] [PubMed] [Google Scholar]
- 36.Allen E. A., Damaraju E., Plis S. M., Erhardt E. B., Eichele T., Calhoun V. D., Tracking whole-brain connectivity dynamics in the resting state. Cereb. Cortex 24, 663–676 (2014). [DOI] [PMC free article] [PubMed] [Google Scholar]
- 37.Naccache L., Why and how access consciousness can account for phenomenal consciousness. Philos. Trans. R. Soc. B Biol. Sci. 373, 20170357 (2018). [DOI] [PMC free article] [PubMed] [Google Scholar]
- 38.Ward A. F., Wegner D. M., Mind-blanking: When the mind goes away. Front. Psychol. 4, 650 (2013). [DOI] [PMC free article] [PubMed] [Google Scholar]
- 39.Laureys S., Celesia G. G., Cohadon F., Lavrijsen J., León-Carrión J., Sannita W. G., Sazbon L., Schmutzhard E., von Wild K. R., Zeman A., Dolce G.; European Task Force on Disorders of Consciousness , Unresponsive wakefulness syndrome: A new name for the vegetative state or apallic syndrome. BMC Med. 8, 68 (2010). [DOI] [PMC free article] [PubMed] [Google Scholar]
- 40.Giacino J. T., The minimally conscious state: Defining the borders of consciousness. Prog. Brain Res. 150, 381–395 (2005). [DOI] [PubMed] [Google Scholar]
- 41.Giacino J. T., Kalmar K., Whyte J., The JFK Coma Recovery Scale-Revised: Measurement characteristics and diagnostic utility. Arch. Phys. Med. Rehabil. 85, 2020–2029 (2004). [DOI] [PubMed] [Google Scholar]
- 42.Fair D. A., Dosenbach N. U. F., Church J. A., Cohen A. L., Brahmbhatt S., Miezin F. M., Barch D. M., Raichle M. E., Petersen S. E., Schlaggar B. L., Development of distinct control networks through segregation and integration. Proc. Natl. Acad. Sci. U.S.A. 104, 13507–13512 (2007). [DOI] [PMC free article] [PubMed] [Google Scholar]
- 43.Dosenbach N. U. F., Fair D. A., Miezin F. M., Cohen A. L., Wenger K. K., Dosenbach R. A. T., Fox M. D., Snyder A. Z., Vincent J. L., Raichle M. E., Schlaggar B. L., Petersen S. E., Distinct brain networks for adaptive and stable task control in humans. Proc. Natl. Acad. Sci. U.S.A. 104, 11073–11078 (2007). [DOI] [PMC free article] [PubMed] [Google Scholar]
- 44.Mueller S., Wang D., Fox M. D., Yeo B. T. T., Sepulcre J., Sabuncu M. R., Shafee R., Lu J., Liu H., Individual variability in functional connectivity architecture of the human brain. Neuron 77, 586–595 (2013). [DOI] [PMC free article] [PubMed] [Google Scholar]
- 45.Hagmann P., Cammoun L., Gigandet X., Meuli R., Honey C. J., Wedeen V. J., Sporns O., Mapping the structural core of human cerebral cortex. PLOS Biol. 6, e159 (2008). [DOI] [PMC free article] [PubMed] [Google Scholar]
- 46.Rubinov M., Sporns O., Complex network measures of brain connectivity: Uses and interpretations. Neuroimage 52, 1059–1069 (2010). [DOI] [PubMed] [Google Scholar]
- 47.Deco G., Tononi G., Boly M., Kringelbach M. L., Rethinking segregation and integration: Contributions of whole-brain modelling. Nat. Rev. Neurosci. 16, 430–439 (2015). [DOI] [PubMed] [Google Scholar]
- 48.Annen J., Frasso G., Crone J. S., Heine L., Di Perri C., Martial C., Cassol H., Demertzi A., Naccache L., Laureys S.; Coma Science Group Collaborators , Regional brain volumetry and brain function in severely brain-injured patients. Ann. Neurol. 83, 842–853 (2018). [DOI] [PubMed] [Google Scholar]
Associated Data
This section collects any data citations, data availability statements, or supplementary materials included in this article.
Supplementary Materials
Supplementary material for this article is available at http://advances.sciencemag.org/cgi/content/full/5/2/eaat7603/DC1
Supplementary Methods 1
Supplementary Methods 2
Fig. S1. The four recurrent dynamic coordination patterns emerge at different dimensionalities.
Fig. S2. Network analysis of the identified patterns shows that consciousness-related patterns are characterized by higher spatial complexity, long-distance negative edges, community structure, and high efficiency.
Fig. S3. Network properties reflect the state of consciousness.
Fig. S4. Robustness of the extracted coordination patterns.
Fig. S5. Etiology, chronicity age, and gender do not mediate patients’ temporal dynamics.
Fig. S6. The structural connectivity network is defined from DSI and contains systems-based ROIs.
Fig. S7. Transition probabilities normalized by the patterns’ probabilities of occurrence.
Fig. S8. Entropy rate increases with respect to the state of consciousness.
Fig. S9. Pattern validation in dataset 2 (“Canada”) and dataset 3 (“Anesthesia”).
Fig. S10. Dataset slope comparisons.
Fig. S11. Replication of the structural-functional analysis with different granularity of the structural matrix reduction.
Table S1. Patients’ demographic and clinical characteristics per scanning site (n = 112).
Table S2. Network-level ROIs used as seed areas.