Abstract
ABCG2 is a multidrug ATP-binding cassette transporter expressed in the plasma membranes of various tissues and tissue barrier [1–4]. It translocates endogenous substrates, affects the pharmacokinetics of many drugs, and has a protective role against a wide array of xenobiotics, including anti-cancer drugs [5–12]. Previous studies have revealed the architecture of ABCG2 and the structural basis of small-molecule and antibody inhibition [13, 14], but the mechanism of substrate recognition and ATP-driven transport are currently unknown. Here we present high-resolution cryo-EM structures of human ABCG2 in two key states, a substrate-bound pre-translocation state and an ATP-bound post-translocation state. For both structures, a mutant containing a glutamine replacing the catalytic glutamate (ABCG2EQ) was used, which resulted in reduced ATPase and transport rates and facilitated conformational trapping for structural studies. In the substrate-bound state, a single molecule of estrone-3-sulphate (E1S) is bound in a central, hydrophobic, and cytoplasm-facing cavity about halfway across the membrane. Only one molecule of E1S can bind in the observed binding mode. In the ATP-boundstate, the substrate-binding cavity has completely collapsed while an external cavity has opened to the extracellular side of the membrane. The ATP-induced conformational changes include rigid-body shifts of the transmembrane domains (TMDs), pivoting of the nucleotide-binding domains (NBDs), and a change in the relative orientation of the NBD subdomains. Mutagenesis of residues contacting bound E1S or in the translocation pathway, followed by in vitro characterization of transport and ATPase activities, demonstrated their roles in substrate recognition and revealed the importance of a leucine residue forming a ‘plug’ between the two cavities. Our results reveal how ABCG2 harnesses the energy of ATP binding to extrude E1S and other substrates and suggest that the size and binding affinity of compounds are important parameters in distinguishing substrates from inhibitors.
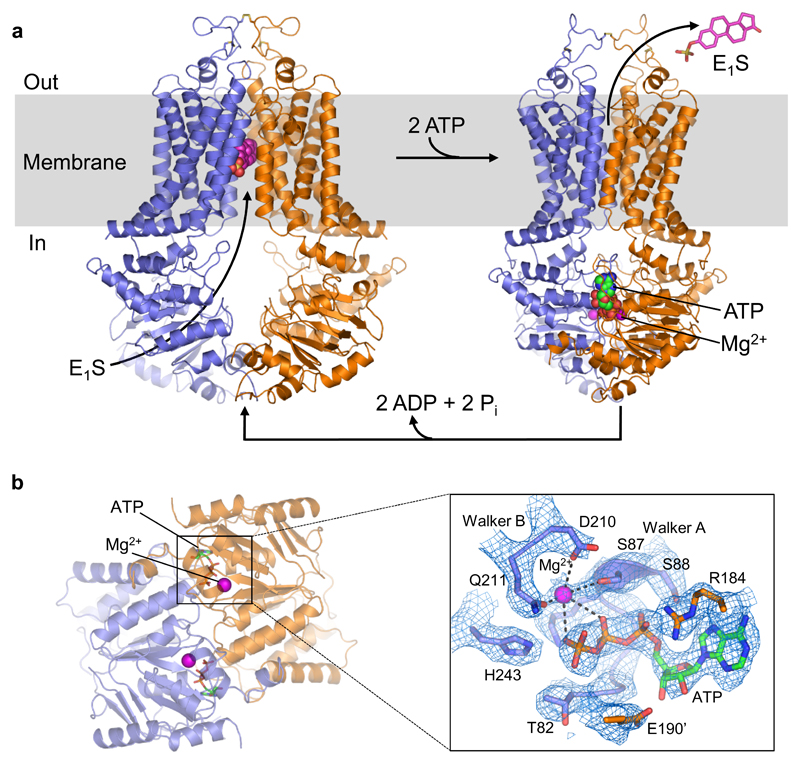
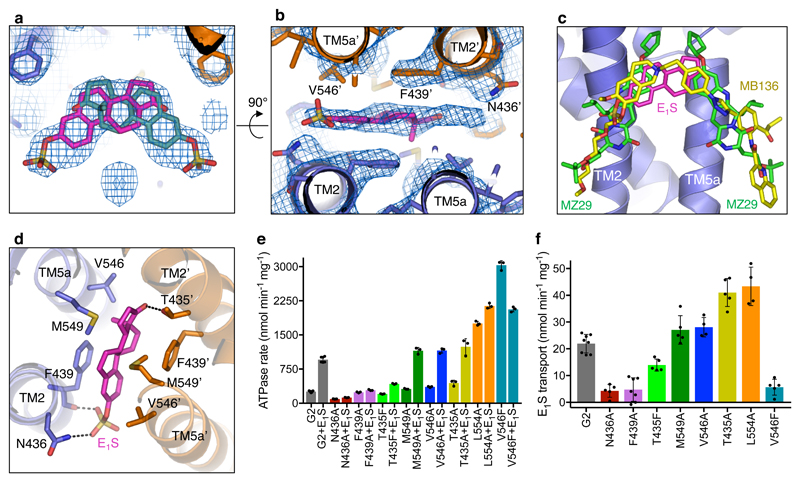
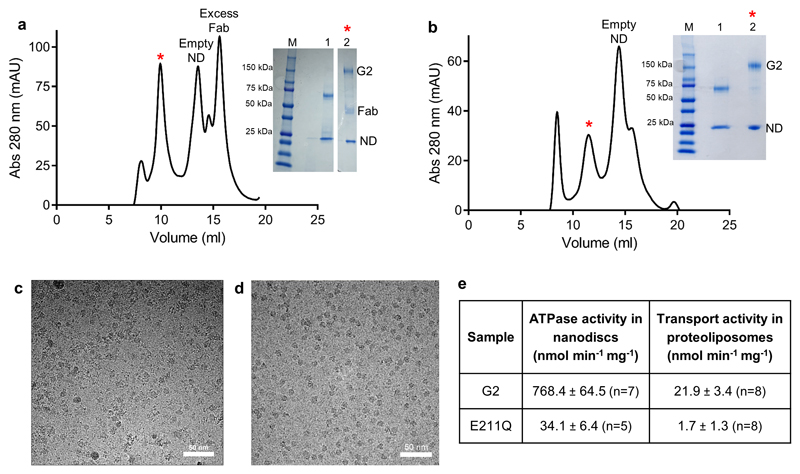
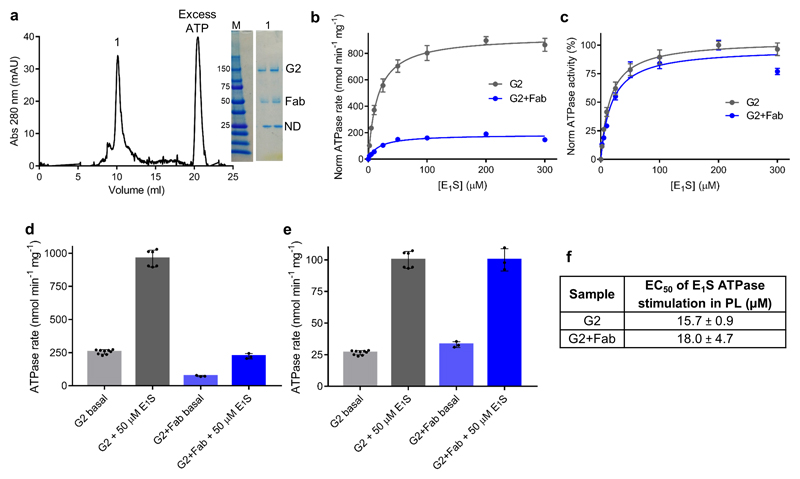
Replacing the catalytic glutamate E211in the Walker B motif by a glutamine resulted in significantly reduced, but not abolished, ATP hydrolysis and E1S transport activity (Fig. 1, Extended Data Fig. 1) [13]. For the E1S-bound structure (ABCG2EQ-E1S), we added 5D3-Fab to the sample, which bound to the external side of ABCG2 and facilitated high-resolution structure determination [15]. 5D3-Fab inhibits the transport activity of liposome-reconstituted ABCG2 and slows down its ATP hydrolysis, but has no impact on the EC50 of E1S-induced ATPase stimulation, suggesting that it does not alter the interaction between ABCG2 and E1S (Extended Data Fig. 2) [13, 16]. The predominant 3D class of nanodisc-reconstituted ABCG2EQ-E1S revealed an inward-open conformation and was refined to an overall resolution of 3.6 Å, where the TMDs, including the substrate-binding cavity, were clearly resolved (Extended Data Fig. 3 and 4a, Extended Data Table 1). We observed a density feature in the substrate-binding cavity, which is formed by transmembrane (TM) helices TM2 and TM5a of opposing ABCG2 monomers. The density could only fit one E1S molecule, but given that ABCG2 has 2-fold symmetry, E1S can be bound in two orientations, related by a 180° rotation (Fig. 2a,b and Extended Data Fig. 4b). Two E1S molecules cannot bind simultaneously because their polycyclic ring systems would clash sterically. The strongest density was at the 2-fold symmetry axis, where the core of the flat polycyclic ring binds and reprocessing the data with C1 symmetry resulted in a very similar, albeit lower resolution EM map (Extended Data Fig. 4b,c). The substrate-binding cavity was previously shown to accommodate potent inhibitors, demonstrating its dual role in substrate and multidrug binding (Fig. 2c) [14].
Figure 1. Structures and transport cycle of ABCG2.
a, Cartoon representation of E1S-bound ABCG2EQ (left) and ATP-bound ABCG2EQ (right). ABCG2 monomers are coloured blue and orange. Bound E1S, ATP, and Mg2+ are shown as spheres. In the ABCG2EQ-E1S structure, bound 5D3-Fab was omitted for clarity. b, Structure of NBD dimer of the ATP-bound state, viewed from the cytoplasm, with bound ATP and Mg2+ ions shown as sticks and spheres, respectively. Insert (~150° rotation to the right and viewed from the membrane): EM density around bound ATP, with Walker-A, Walker-B, E190 of the signature motif and “switch” histidine shown as sticks and labeled, and Mg2+ shown as purple sphere.
Figure 2. Substrate-binding cavity and mutant analysis.
a, C2 symmetrized EM density of ABCG2EQ-E1S structure with the bound E1S molecule (pink or turquoise sticks) shown in two possible orientations, rotated by 180° along the y-axis. b, Same as a but rotated 90° and showing one E1S and the surrounding residues as viewed from the cytoplasm. TM helices and contacting residues are labeled. c, Overlay of E1S (pink sticks, this study) and the inhibitors MZ29 (green sticks, PDB 6ETI), and MB136 (yellow sticks, PDB 6FEQ), bound in the substrate-binding cavity, after superposition of the three structures. d, Substrate-binding cavity viewed from within the membrane showing side chains (sticks) of residues interacting with E1S (pink sticks). e, ATPase activities of liposome-reconstituted wild-type and mutant ABCG2 in the presence and absence of 50 µM E1S. f, Initial E1S transport activities. The bars show the means, error bars show standard deviation and dots show the rates derived from each technical replicate (same batch of liposomes).
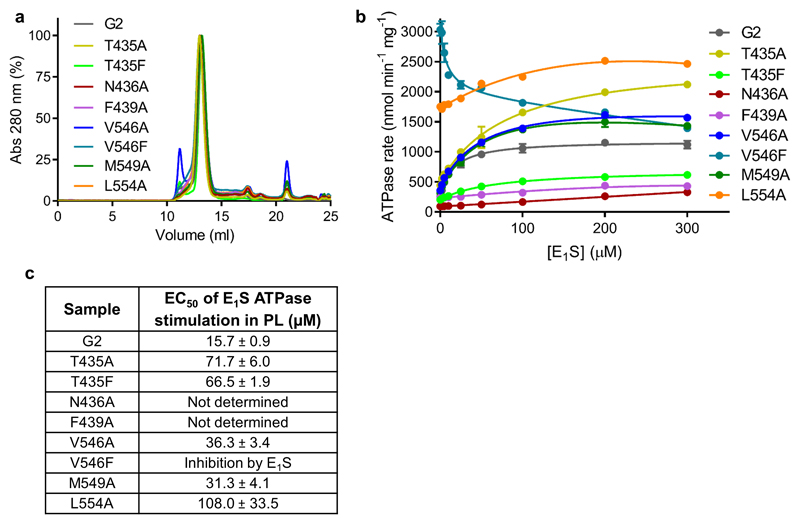
The ABCG2EQ-E1S structure revealed which residues interacted with bound substrate (Fig. 2d). We generated single point mutations of all residues in contact with E1S and determined the in vitro ATPase and E1S transport activities of the resulting ABCG2 variants upon reconstitution of the purified proteins in proteoliposomes (Figs. 2e,f). The stability of all mutants tested was similar to that of the wild-type protein (Extended Data Fig. 5a), allowing direct comparison. We also determined the EC50 values of E1S-induced ATPase stimulation for all mutants (Extended Data Fig. 5b,c). Consistent with their role in binding E1S, the transport activities of the mutants N436A and F439A were strongly reduced, as were their ATPase activities. Importantly, neither the N436A or F439A mutant showed stimulation of their ATPase activity by E1S, indicating that the interactions suggested by the structure (a hydrogen bond between N436 and the sulfate group of E1S and the stacking interaction of the phenyl ring of F439 to the ring system of E1S) are important for substrate binding (Fig. 2 and Extended Data Fig. 5b,c). Intriguingly, the V546F mutant had impaired transport activity but displayed a 12-fold increase in basal ATPase activity that was inhibited by E1S in a concentration-dependent manner. This could suggest that the introduction of two phenyl rings at this position of the substrate-binding cavity mimics the binding of a substrate and thus stimulates ATPase activity, whereas further addition of E1S ‘clogs’ the transporter. The V546A mutant, in contrast, had similar functional characteristics as the wild-type protein, with a slight increase in the EC50 of E1S stimulation. It was previously reported that in ABCG5/G8, the mutations Y432A and A540F (equivalent to F439A and V546F in ABCG2) disrupted cholesterol transport [17], suggesting a common location for the substrate-binding site among G-subfamily ABC transporters. We further found that the mutation T435A caused a ~4.5-fold increase in the apparent EC50 of ATPase stimulation, in line with the interpretation from the structure that a hydrogen bond exists between the β-OH group of T435 and the ester group of E1S. There was a 2-fold increase in transport in the T435A mutant, suggesting an inverse relationship between binding affinity and the maximal transport rate. The introduction of two phenylalanines (T435F mutant) impaired both E1S transport and ATP hydrolysis, which is distinct from the observations with V546F. This emphasizes the sensitivity of the binding cavity to modifications. Finally, the M549A mutant had similar ATPase and transport activities to the wild-type protein, suggesting a minor contribution of this residue to E1S binding.
To visualize ATP-driven conformational changes in ABCG2, we added ATP and magnesium to nanodisc-reconstituted ABCG2EQin the absence of 5D3-Fab (ABCG2EQ-ATP). Cryo-EM analysis revealed that most particles featured an ATP-bound conformation with the NBD dimer closed, and no inward-facing classes (Fig.1, Extended Data Fig. 6). The overall resolution was 3.1 Å, with excellent side chain density for the TMDs, NBDs and nucleotides (Extended Data Fig. 4d and Extended Data Table 1). The structure revealed a closed, ‘head-to-tail’ NBD dimer, featuring a much larger interface than in the nucleotide-free state, and forming two ATP-binding sites between the P-loop (Walker-A motif) of one NBD and the signature sequence (VSGGE sequence) of the other (Fig. 1b). Two ATP molecules are bound and there is clear EM density for a magnesium ion interacting with the β- and γ-phosphates of each ATP (Fig. 1b). Three conserved side chains coordinate the γ-phosphate of ATP: Q211 (corresponding to the catalytic glutamate in wild-type ABCG2), H243 (corresponding to the ‘switch’ histidine [18]), and Q126 (which is part of the Q-loop). Q211 also coordinates the magnesium ion. ABCG2 does not contain an A-loop with an aromatic side chain stacking against the adenine moiety, as observed in many other ABC transporters [19–22]. Rather, one face of the adenine ring is in Van der Waals distance to residues V46, I63, G185 from one NBD, whereas the other face stacks against R184 from the opposite NBD. R184 also forms a salt bridge with the α-phosphate, which was previously observed in the AMPPNP-bound structure of the bacterial B12 transporter BtuCDF [23]. The NBD interface of ATP-bound ABCG2EQalso contains a salt bridge formed by E127 (part of the Q-loop) and R191 adjacent to the signature motif. Unlike in B-family ABC transporters, there is a hole at the interface of the four domains of ABCG2, similar to what was observed in BtuCDF (Fig. 4d).
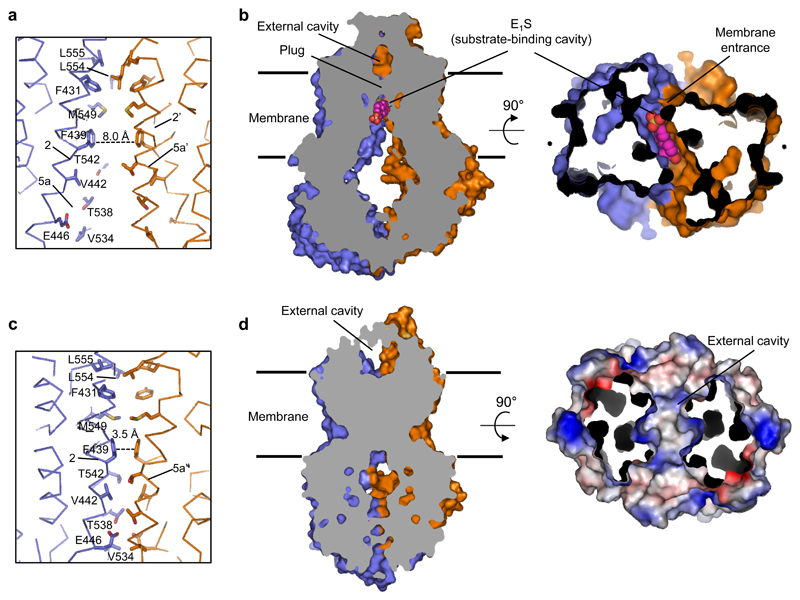
Figure 4. Substrate translocation pathway.
a, Cα-trace of the translocation pathway region of ABCG2EQ-E1S. Residues lining the substrate-binding cavity are shown as sticks, bound E1S has been omitted for clarity. The dashed line shows the distance between the two F439 residues that stack against bound E1S. b, Vertical slice through a surface representation of ABCG2EQ-E1S, with bound E1S shown as pink spheres and the two cavities and plug region labeled. On the right panel, 90° rotation of the structure revealing the fit of E1S in the substrate-binding cavity, as viewed from the cytoplasm. The NBDs have been removed for clarity. c,d Similar to a,b but of the ABCG2EQ-ATP structure. On the right panel of d, the molecular surface of the external cavity, viewed from the extracellular space and colour-coded by electrostatic potential ranging from blue (most positive) to red (most negative), is shown with EL3 removed for clarity.
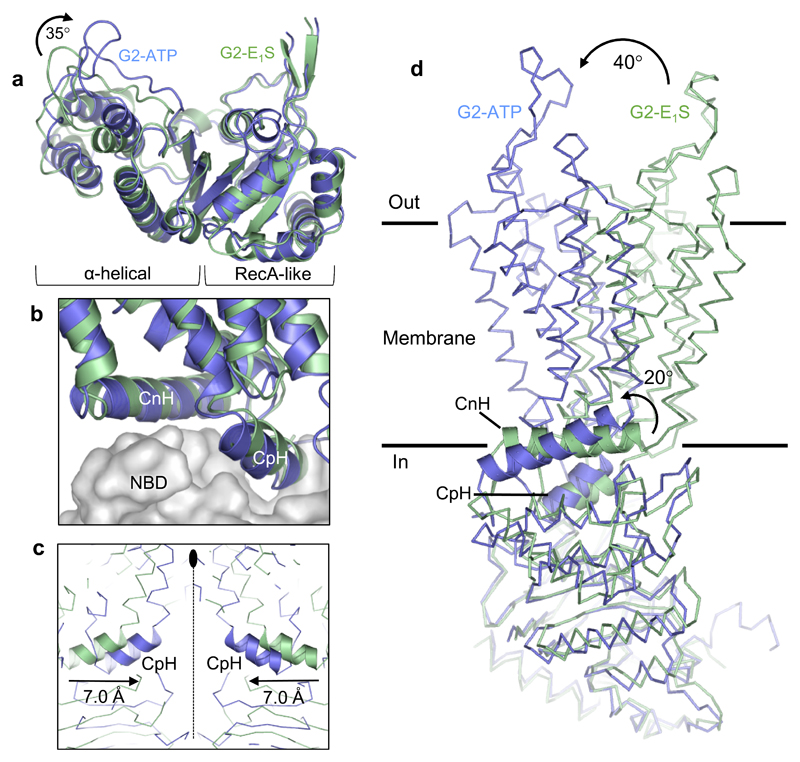
As a result of ATP binding, the α-helical domains of the NBDs have rotated ~35° relative to the RecA-like domains, approaching the opposite NBD and the 2-fold symmetry axis (Fig. 3a). This rotation is required for NBD dimerization and is part of the ‘power stroke’ in the transport cycle [24]. The individual TMD-NBD interfaces, formed largely by the “connecting helices” (CnH or TM1a) and “coupling helices” (CpH, corresponding to the C-terminal part of TM2) remain largely unchanged in each ABCG2 monomer between the nucleotide-free and ATP-bound states (Fig. 3b). However, because of the shift in the NBDs, the cytoplasmic parts of the TMDs are pushed towards each other, with each CpH approaching the 2-fold symmetry axis by ~7 Å (Fig. 3c). The altered conformations of the TMDs can be described as rigid-body movements, with CnH and CpH acting as the pivot points for the transition. These two α-helices undergo a ~20° rotation when superposing the NBDs in the structures of the two states, which translates to a ~40° rotation of the helical axes of the TMDs (Fig. 3d).
Figure 3. ATP-induced conformational changes.
a, Superposition of the RecA-like subdomains of the NBDs of the ABCG2EQ-E1S (green) and ABCG2EQ-ATP (blue) structures. A ~35° inward rotation of the helical subdomain is observed upon ATP binding. b, Superposition of one ABCG2 monomer of the ABCG2EQ-E1S and ABCG2EQ-ATP structures, with the NBDs shown as grey surface and the TMDs as ribbons. The interface helices, CpH and CnH, are labeled. c, Superposition of the ABCG2EQ-E1S and ABCG2EQ-ATP structures along the 2-fold symmetry axis (dotted line), showing a 7 Å inward movement of the CpH’s of each ABCG2 monomer. d, Comparison of a single ABCG2 monomer of the ABCG2EQ-E1S and ABCG2EQ-ATP structures. The NBDs have been superimposed, revealing a 20° rotation of the CnH and CpH (shown as ribbons), as well as a 40° rotation of the TMDs relative to one another.
The ATP-induced conformational changes have important consequences for the substrate translocation pathway. In the ABCG2EQ-E1S structure, the phenyl rings of the F439 residues of the two ABCG2 monomers are 8.0 Å apart, with bound E1S between them (Fig 2d). In contrast, these phenyl rings stack against each other in the ATP-bound state (Figs. 4a,c) and the substrate-binding cavity has completely collapsed, with no space for bound substrate. To be transported across the membrane, the substrate therefore has to move through the likely translocation pathway at the center of the transporter and reach the external cavity before the pathway is completely closed. This can only be accomplished if there are transient conformational changes such as TM helix bending, to generate space for the substrate. Such transient changes resemble a peristaltic motion.
The external cavity, occluded in the nucleotide-free state, is open to the outside in the ATP-bound state, while maintaining the intra- and inter-molecular disulfides (C592-C608 and C603-C603’) in extracellular loop 3 (EL3), promoting substrate release (Figs. 1a, 4d and Extended Data Figs. 1b and 6e). Two leucine residues (L554 and L555), in the loop between TM5a and TM5b, form a plug that separates the substrate-binding cavity and the external cavity (Fig. 4). We individually mutated these leucines to alanines and found that the L555A variant did not express any functional protein, suggesting a structural role of L555 in addition to a likely gating function. In contrast, the L554A mutant was stable and showed functional differences compared to wild-type ABCG2 (Figs. 2e,f and Extended Data Fig. 5): The basal ATPase rate of L554A was significantly increased and there was only a minor stimulation of the ATPase rate by E1S (~20% compared to ~3.5-fold in wild-type ABCG2). Furthermore, the apparent EC50 of E1S-induced ATPase stimulation was increased, suggesting weaker substrate binding. Finally, E1S transport activity of the L554A mutant was twice as high as with wild-type ABCG2. We interpret that the opening and closing of the ‘leucine plug’ may act as a checkpoint during the transport reaction, and although the removal of the leucine side chain accelerates the transport process, it may reduce substrate selectivity.
A comparison of the structures shown here provides insight into the transport cycle of ABCG2. Substrate may bind via the cytoplasm or from within the lipid bilayer via the ‘membrane entrance’ (Fig. 4b) [14]. Once substrate is bound, the NBD dimer can only close upon movement of the substrate out of the substrate-binding cavity, because this cavity does not provide any space when ATP is bound. In a productive transport cycle, substrate likely moves through a translocation pathway at the center of the transporter, via the ‘leucine plug’. The structure of ATP-bound ABCG2EQ suggests that once a substrate clears the plug area and enters the external cavity, the plug region closes and substrate is released to the outside (Fig. 4d). One caveat is that the E211Q mutation may have influenced the energetics of the conformational changes involved. Our findings suggest that ATP binding might be sufficient for the substrate extrusion step and that ATP hydrolysis might be required to reset the transporter to an inward-facing conformation [19, 20, 25, 26]. Unlike many other transporters [22, 27–30], ABCG2 does not appear to form a stable, occluded conformation providing space for bound substrate, but rather a transient conformation that is consistent with a peristalsis-like mechanism, reminiscent of the bacterial BtuCDF transporter.
Given their polyspecificity, a key unanswered question concerning multidrug transporters is why certain compounds act as substrates, while others are potent inhibitors. Our results allow us to compare the binding modes of a bona fide ABCG2 substrate with those of two potent inhibitors. All three molecules bind in the same cavity of the transporter (Fig. 2c). However, whereas a single E1S molecule binds on the 2-fold symmetry axis and deep in the cavity, two molecules of the Ko143-derived inhibitor MZ29 were found to fill the substrate-binding cavity completely, almost reaching the cytoplasmic membrane boundary and forming many additional contacts with the surface of ABCG2 [14]. A single copy of the tariquidar-derived inhibitor MB136 also fills the binding cavity completely, forming similar contacts to MZ29. The numerous additional contacts, which include residues of TM1b in addition to TM2 and TM5a, can explain the increased binding affinity compared to substrates. The difference appears to be that when E1S and ATP are bound to ABCG2, the NBDs and the cytoplasmic part of the TMDs can still approach, allowing for an opening of the plug and simultaneous pushing of the substrate into the external cavity. Inhibitors, in contrast, act as ‘wedges’ and immobilize the transporter by locking it in an inward-facing conformation. The reduced size, binding surface and affinity of substrates, and their binding deeper inside the substrate cavity, allows them to be translocated in a productive transport cycle.
Methods
No statistical methods were used to predetermine sample size. The experiments were not randomized. The investigators were not blinded to allocation during experiments and outcome assessment.
Expression and purification of wild-type and mutant human ABCG2
Human ABCG2, containing an amino (N)-terminal Flag tag, was expressed in HEK293-EBNA (Thermo Fisher Scientific) cells and purified as described previously [13, 14].
Expression and purification of 5D3-Fab
5D3 hybridoma cells, producing the 5D3 monoclonal antibody, were obtained from B. Sorrentino. The cells were cultured in WHEATON CELLine Bioreactors, according to the manufacturer’s protocol, and 5D3-Fab was then purified from the supernatant, as described in the Fab Preparation Kit protocol (Thermo Fisher Scientific).
Nanodisc preparation of ABCG2EQ
Membrane scaffold protein (MSP) 1D1 was expressed and purified [31] and ABCG2 was reconstituted into brain polar lipid (BPL):CHS nanodiscs as described previously [13, 14]. In order to generate the ABCG2EQ-E1S sample for cryo-EM studies, ABCG2 was first mixed with a 3-fold molar excess of 5D3-Fab before reconstitution. After size exclusion chromatography (SEC) using a Superdex 200 10/300 column (GE Healthcare), the complex was incubated with 200 μM E1S, 5 mM ATP and 5 mM MgCl2 for 15 min at room temperature before grid preparation. For the ABCG2EQ-ATP sample, following SEC, the complex was incubated with 5 mM ATP and 5 mM MgCl2 for 15 min at room temperature before grid preparation.
ABCG2 liposome preparation
A BPL:cholesterol (BPL:chol) (Avanti Polar Lipids) mixture was prepared at a 4:1 (w/w) ratio as described previously [32]. Detergent-purified ABCG2 was then mixed with BPL:chol, detergent was removed with Bio-Beads and the reconstitution efficiency determined [13, 14, 33].
Transport assays
In vitro transport assays using ABCG2 proteoliposomes, containing either wild-type or mutant protein, were carried out as described previously. Briefly, ABCG2 proteoliposomes were extruded and then incubated with 5 mM MgCl2 and 50 µM [3H] E1S for 5 min at 30°C. The transport reaction was initiated by the addition of 2 mM ATP and the sample was filtered using a Multiscreen vacuum manifold (MSFBN6B filter plate, Millipore). Radioactivity trapped on the filters was measured using a scintillation counter and the initial transport rates (30 s - 2 min) were determined using linear regression in GraphPad Prism 7.00. Rates were corrected for the orientation of ABCG2 in proteoliposomes [13, 14].
ATPase assays and determination of the EC50 of E1S stimulation
ATP hydrolysis activity was measured using a technique described previously [34]. All reactions were performed at 37?C in the presence of 2 mM ATP and 10 mM MgCl2 [13, 14]. For ATPase assays in proteoliposomes experiments were completed in the presence of 0-300 μM E1S. To assess the impact of 5D3-Fab, ABCG2 proteoliposomes were freeze-thawed five times in the presence of a 3-fold molar excess of 5D3-Fab, to get it on the inside, prior to extrusion. Assays in nanodiscs were performed in the absence of E1S. Data were recorded at four time intervals (0, 5, 15, 30 min) and subsequent ATPase rates were determined using linear regression in GraphPad Prism 7.00. Rates were corrected for the orientation of ABCG2 in proteoliposomes. For determination of the EC50 of E1S stimulation, the ATPase rates were plotted against the E1S concentration and curves were generated using the nonlinear regression Michaelis–Menten analysis tool in GraphPad Prism 7.00.
Sample preparation and cryo-EM data acquisition
All cryo grids of ABCG2EQ were prepared using a Vitrobot Mark IV (FEI) with the environmental chamber set at 100% humidity and 4°C. An aliquot of 4 μl purified ABCG2EQ-E1S or ABCG2EQ-ATP, at a protein concentration of approximately 0.4 mg ml-1, was applied to glow-discharged Quantifoil (1.2/1.3) 300 mesh Cu grids. After being blotted with filter paper for 2.0 s, the grids were flash frozen in a mixture of propane and ethane cooled with liquid nitrogen. The ABCG2EQ-E1S dataset was composed of 3,984 movies and the ABCG2EQ-ATP dataset was composed of 4,905 movies. Cryo-EM image data were recorded using SerialEM [35] on a Titan Krios microscope, operated at 300 kV and equipped with a Gatan Quantum-LS energy filter (20eV zero loss filtering), containing a K2 Summit direct electron detector. Images were recorded in super-resolution counting mode with a pixel size of 0.4058 Å/pixel. Exposures were 10 s, dose-fractionated into 50 frames (0.2 s per frame), resulting in a frame dose of 2.0 e-/Å2. Data collection quality was monitored using Focus [36]. The first frame of each movie was discarded. Stacks were gain-normalized, motion-corrected, dose-weighted and averaged and then Fourier-cropped 2-fold with MotionCor2 [37]. Defocus estimates were obtained on the non-dose-weighted micrographs with CTFFIND4 [38] for ABCG2EQ-E1S and Gctf [39] for ABCG2EQ-ATP.
Image processing
Particles were picked automatically using Gautomatch (http://www.mrc-lmb.cam.ac.uk/kzhang/), resulting in an ABCG2EQ-E1S dataset of 168,184 particles, processed with CryoSPARC [40], and an ABCG2EQ-ATP dataset of 1,128,170 particles, processed with RELION [41]. In both cases, 2D classification yielded at least 12 representative classes, containing 62,616 particles for ABCG2EQ-E1S and 543,142 particles for ABCG2EQ-ATP. These classes were used for ab initio reconstruction (applying either C1 or C2 symmetry).
For ABCG2EQ-E1S, the resulting 3D models were used as a starting point for heterogeneous 3D refinement with three classes. Subsequent homogeneous refinements of all three classes (applying C2 symmetry) separately yielded very alike maps, with the maps for the two largest classes (corresponding to 38.7% and 32.6% of particles) having very similar densities in the substrate-binding cavity of ABCG2, and the map of smaller class (corresponding to 28.5% of the particles) having some additional density underneath the substrate density (which was only visible at noise level in the other classes). Therefore, we combined particles of the two largest classes (42,790 particles in total) from the 3D heterogeneous refinement and refined (applying C2 symmetry) against the heterogeneous refinement map of the largest class. This resulted in map with a resolution of 3.58 Å, which was sharpened with an automatically calculated B-factor of -82.6 Å2. For validation, all refinements were also performed using C1 symmetry.
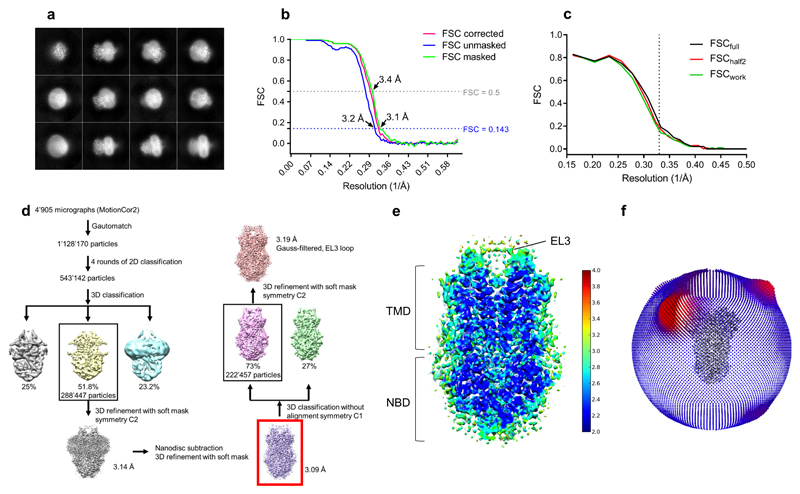
For ABCG2EQ-ATP, initial 3D classification into three classes resulted in one outstanding class, containing 51.8% of particles (corresponding to 288,447 particles) with clear secondary structure elements. This class was 3D refined, applying C2 symmetry and a soft mask, resulting in a 3D reconstruction with an overall resolution of 3.14 Å. For nanodisc subtraction, the ABCG2EQ-ATP map was segmented in Chimera (using Segger) and the resulting nanodisc-only map was used to calculate projections, which were subsequently subtracted from the experimental particles. A soft mask, where the subtracted density from the experimental particles was white (1) and the rest of the protein and the solvent were black (0), was generated by low-passing the nanodisc map to 15 Å and expanding the mask by 4 pixels with a soft edge of 6 pixels. The nanodisc-free experimental particles were used in further 3D refinements, which resulted in an EM map at a resolution of 3.09 Å (B-factor of -136 Å2), using the low-passed ABCG2EQ-ATP map without nanodisc density as a reference. This map was used for ABCG2EQ-ATP model building. Subsequent 3D classification in C1 symmetry, without applied alignments, was carried out in an effort to improve the EL3 density, however, despite extensive efforts, inherent EL3 flexibility of this conformation prohibited its accurate modeling.
All resolutions were estimated with the Fourier shell correlation (FSC) 0.143 cutoff criterion [42]. ResMap [43] was used to calculate the local resolution maps.
Model building and refinement
For the ABCG2EQ-E1S structure, we used the post-processed map at an overall resolution of 3.58 Å. For the generation of an initial model, the ABCG2-MZ29-Fab structure (PDB 6ETI) was docked into the EM density using Coot [44] and manual fitting/modifications were carried out where the resolution allowed. The E1S coordinates and restraints were generated using eLBOW [45] and fitted into the EM density using Coot. For the ABCG2EQ-ATP structure, we used the post-processed, nanodisc-subtracted map at an overall resolution of 3.09 Å. The EM density was of excellent quality and allowed for the accurate building of ABCG2, ATP and Magnesium from the ligand library in Coot, using the ABCG2-MZ29-Fab structure (PDB 6ETI) as a template. For both structures, the complete models were refined against the working maps in PHENIX [46] using the program phenix.real_space_refine. For the final round of model refinement, we performed global real-space refinement with standard geometry restraints as well as rotamer, Ramachandran plot, C-beta, non-crystallographic symmetry (NCS) and secondary structure restraints, coupled to reciprocal-space refinement of the B factors. The quality of the final models was analyzed by MolProbity [47] and the refinement statistics are given in Extended Data Table 1. For validation of the refinement, random shifts (mean value of 0.3 Å) were introduced into the coordinates of the final refined models using the program phenix.pdbtools [46], followed by refinement with phenix.real_space_refine (using the same parameters as described before) against the first unfiltered half-map (half-map 1). The overlay between the FSC curve of the model with random displacements refined against half-map1 versus half-map 1 and the FSC curve of the same model versus half-map 2 (against which it was not refined) indicated that no over-refinement took place.
Extended Data
Extended data figure 1. Purification, activity and cryo-EM micrographs of ABCG2.
a, Preparative SEC profile of the nanodisc-reconstituted ABCG2EQ-E1S complex. The fraction used for cryo-EM grid preparation is indicated by a red asterisk. Insert: reducing (lane 1) and non-reducing (lane 2) SDS-PAGE of the complex, showing bands for ABCG2 (G2), 5D3-Fab (Fab) and nanodisc (ND). b, Preparative SEC profile of the nanodisc-reconstituted ABCG2EQ-ATP complex. The fraction used for cryo-EM grid preparation is indicated by a red asterisk. Insert: reducing (lane 1) and non-reducing (lane 2) SDS-PAGE of the complex, showing bands for ABCG2 (G2) and nanodisc (ND). c, An example micrograph (drift-corrected, dose-weighted, and low-pass filtered to 20 Å) of the nanodisc-reconstituted ABCG2EQ-E1S sample. White scale bar, 50 nm. d, An example micrograph (drift-corrected, dose-weighted, and low-pass filtered to 20 Å) of the nanodisc-reconstituted ABCG2EQ-ATP sample. White scale bar, 50 nm. e, ATPase activities of nanodisc-reconstituted and E1S transport activities of liposomes-reconstituted wild-type and mutant (E211Q) ABCG2. The standard deviation from ‘n’ number of technical replicates (same batch of nanodiscs or liposomes) is shown.
Extended data figure 2. Effect of 5D3-Fab on ABCG2 function.
a, Analytical SEC profile of the nanodisc-reconstituted ABCG2EQ-E1S complex in the presence of 5 mM ATP and 5 mM MgCl2. ‘1’ denotes the peak collected. Insert: Non-reducing SDS-PAGE of the complex, showing bands for ABCG2 (G2), 5D3-Fab (Fab) and nanodisc (ND). b, ATPase activity of liposome-reconstituted ABCG2, in the presence or absence of 5D3-Fab and 0-300 µM E1S. The basal ATPase activity has been normalized (norm) to 0. c, Same as b but with the maximal ATPase activity set to 100%. Each point represents the mean rate derived from technical replicates. For ‘G2’ n=6 apart from 0 and 200 µM E1S where n=9. For ‘G2+Fab’ n=3. d, ATPase activities of ABCG2 in the presence and absence of 5D3-Fab and either 0 or 50 µM E1S. e, Same as d but with the activities in the presence of E1S set to 100%. The bars show the means and the dots show the rates derived from each technical replicate (same batch of liposomes). Error bars show the standard deviation. f, The EC50 of E1S ATPase stimulation determined using the curves in b and c with the error of the fit (standard deviation) shown.
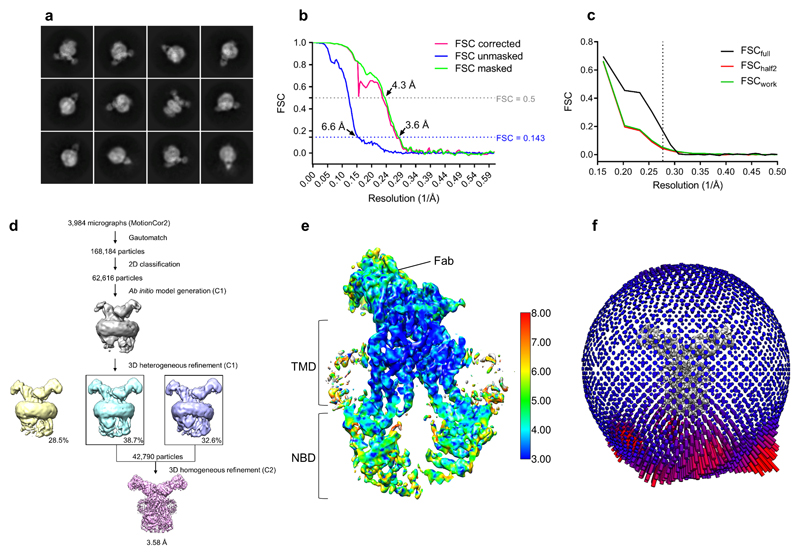
Extended data figure 3. Cryo-EM map generation, data processing and atomic model refinement of ABCG2EQ-E1S.
a, Twelve representative 2D class averages of the final round of 2D classification, sorted in decreasing order by the number of particles assigned to each class. b, FSC from the CryoSPARC auto-refine procedure of the unmasked half-maps (blue), the half-maps after masking (green), and the half-maps after masking and correction for the influence of the mask (pink). A horizontal dotted line (blue) is drawn for the FSC = 0.143 criterion. For both the unmasked and the corrected FSC curves, their intersection with the FSC?=?0.143 line is indicated by an arrow, and the resolution at this point is indicated. c, FSC curve of the final 3.58 Å refined model versus the map it was refined against (FSCfull, black line). FSC curve of the final model with introduced shifts (mean value of 0.3 Å) refined against the first of two independent half-maps (half-map 1) (to which it was refined against; FSCwork green line) or the same refined model versus the second independent half-map (to which is was not refined; FSChalf2, red line). d, The flow chart for the cryo-EM data processing and structure determination of the ABCG2EQ-E1S complex. e, Full view of the final CryoSPARC B-factor sharpened map of ABCG2EQ-E1S coloured by local resolution in Å as calculated by ResMap with the clipping plane in the middle of the molecule. f, Angular distribution plot for the final reconstruction.
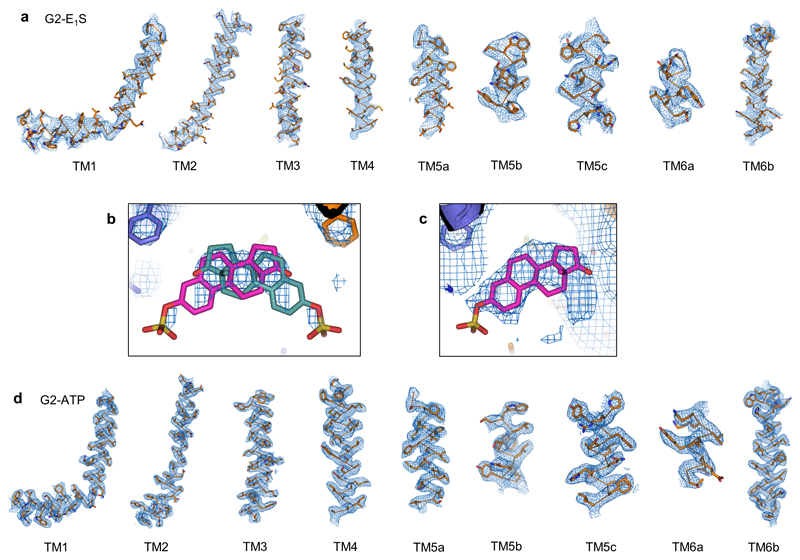
Extended data figure 4. Fit of the models to the densities.
a, Fit of the TM helices of the final model of the ABCG2EQ-E1S TMD to the post-processed and masked C2 map from CryoSPARC. A region of up to 2 Å around the atoms is shown. b, The fit of one E1S molecules (pink or turquoise sticks), in two possible orientations, flipped by 180°, docked into the C2 symmetrized substrate density of the final model of ABCG2EQ-E1S. The contour level has been reduced compared to Fig. 2a to show the strongest density at the core of the polycyclic rings. c, Same as b but showing the fit of one E1S into the EM density of the post-processed and masked C1 map from CryoSPARC. d, Fit of the TM helices of the final model of the ABCG2EQ-ATP TMD to the post-processed and masked C2 map from RELION. A region of up to 2 Å around the atoms is shown.
Extended data figure 5. Purification and functional analysis of mutants.
a, Analytical SEC profiles of the detergent-purified wild-type and substrate-binding cavity mutants used to make proteoliposomes for functional assays. b, ATPase rates of the liposome-reconstituted wild-type and mutant proteins in the presence of 0 – 300 µM E1S. Each point represents the mean rate derived from technical replicates (same batch of liposomes) and error bars show the standard deviation. For ‘G2’ n=6 apart from 0 and 200 µM E1S where n=9. For the mutants n=3. c, Table showing the EC50 of E1S ATPase stimulation determined after the data in b were normalized. The EC50 of E1S ATPase stimulation determined after normalizing the curves in b with the error of the fit (standard deviation) shown.
Extended data figure 6. Cryo-EM map generation, data processing and atomic model refinement of ABCG2EQ-ATP.
a, Twelve representative 2D class averages of the final round of 2D classification, sorted in decreasing order by the number of particles assigned to each class. b, FSC from the RELION auto-refine procedure of the unmasked half-maps (blue), the half-maps after masking (green), and the half-maps after masking and correction for the influence of the mask (pink). A horizontal dotted line (blue) is drawn for the FSC = 0.143 criterion. For both the unmasked and the corrected FSC curves, their intersection with the FSC = 0.143 line is indicated by an arrow, and the resolution at this point is indicated. c, FSC curve of the final 3.09 Å refined model versus the map it was refined against (FSCfull, black line). FSC curve of the final model with introduced shifts (mean value of 0.3 Å) refined against the first of two independent half-maps (half-map 1) (to which it was refined against; FSCwork green line) or the same refined model versus the second independent half-map (to which is was not refined; FSChalf2, red line). d, The flow chart for the cryo-EM data processing and structure determination of the ABCG2EQ-ATP complex. The map used for model building is indicated by a red square. e, Full view of the RELION local-resolution-filtered map of ABCG2EQ-ATP colored by local resolution in Å as calculated by ResMap with the clipping plane in the middle of the molecule. f, Angular distribution plot for the final reconstruction.
Extended Data Table 1. Cryo-EM data collection, refinement and validation statistics.
For the ABCG2EQ-E1S structure only the variable domain of 5D3-Fab was modelled.
| ABCG2EQ-E1S | ABCG2EQ-ATP | |
|---|---|---|
| (EMD-0196, PDB 6HCO) | (EMD-0190, PDB 6HBU) | |
| Data collection and processing | ||
| Magnification (nominal) | 61,610× (165k×) | 61,610× (165k×) |
| Voltage (kV) | 300 | 300 |
| Electron exposure (e–/Å2) | 2.0 | 2.0 |
| Defocus range (μm) | -0.7 to -2.8 | -0.5 to -3.3 |
| Pixel size (Å) | 0.812 | 0.812 |
| Symmetry imposed | C2 | C2 |
| Initial particle images (no.) | 168,184 | 1,128,170 |
| Final particle images (no.) | 42,790 | 288,447 |
| Map resolution (Å) | 3.58 | 3.09 |
| FSC threshold | 0.143 | 0.143 |
| Map resolution range (Å) | 308.6-3.58 | 308.6-3.09 |
| Refinement | ||
| Initial model used | PDB 6ETI | PDB 6ETI |
| Model resolution (Å) | 3.58 | 3.09 |
| FSC threshold | 0.143 | 0.143 |
| Model resolution range (Å) | 207.0-3.6 | 207.0-3.1 |
| Map sharpening B factor (Å2) | -82.6 | -136.0 |
| Model composition | ||
| Nonhydrogen atoms | 12,338 | 9,144 |
| Protein residues | 1576 | 1168 |
| Ligands | 24 | 64 |
| B factors (Å2) | ||
| Protein | 140.93 | 22.25 |
| Ligand | 118.32 (E1S) | 9.3 (ATP) 4.1 (Mg2+) |
| R.m.s. deviations | ||
| Bond lengths (Å) | 0.009 | 0.009 |
| Bond angles (°) | 1.010 | 1.087 |
| Validation | ||
| MolProbity score | 1.82 | 1.61 |
| Clashscore | 7.26 | 4.34 |
| Poor rotamers (%) | 0.45 | 0.00 |
| Ramachandran plot | ||
| Favored (%) | 92.20 | 94.62 |
| Allowed (%) | 7.80 | 5.03 |
| Disallowed (%) | 0.00 | 0.35 |
Supplementary Material
Acknowledgments
This research was supported by the Swiss National Science Foundation through the National Centre of Competence in Research (NCCR) TransCure and by a Swiss Federal Institute of Technology Zurich (ETH Zurich) research grant ETH-22-14-1. N.T. was also supported by the Research Fund Junior Researchers of the University of Basel. J.K. was also supported by the TransCure Young Investigator Award (2017). Cryo-EM data were collected at C-CINA, University of Basel; we thank K. Goldie, L. Kováčik and A. Fecteau-Lefebvre for technical support. We thank N. Tremp for help in cell culture and B. Sorrentino (St. Jude Children’s Research Hospital) for providing the 5D3-producing hybridoma cell line.
Footnotes
Figure preparation. Figures were prepared using the programs PyMOL (The PyMOL Molecular Graphics System, DeLano Scientific) and GraphPad Prism 7.00 (GraphPad Software, La Jolla, California, USA).
Data availability. Atomic coordinates for ABCG2EQ-E1S (5D3-Fab variable domain only), and ABCG2EQ-ATP were deposited in the Protein Data Bank under accession codes 6HCO and 6HBU respectively. EM data for the two structures were deposited in the Electron Microscopy Data Bank under accession codes EMD-0196 (ABCG2EQ-E1S) and EMD-0190 (ABCG2EQ-ATP). Source data for Figures 2e, f, Extended Data Figures 1e, 2b, d, f and 5 are available online. All other data are available from the corresponding author upon reasonable request. A Life Sciences Reporting Summary for this article is available.
Author Contributions. I.M expressed and purified wild-type ABCG2 and 5D3-Fab. I.M and S.M.J cloned, expressed and purified the ABCG2 mutants. S.M.J reconstituted ABCG2 into liposomes and lipidic nanodiscs for cryo-EM and functional studies and carried out all functional experiments. J.K prepared cryo-grids. N.M.I.T collected cryo-EM data with the assistance of H.S. I.M processed cryo-EM data of ATP-bound ABCG2 and determined the structure with the assistance of J.K. N.M.I.T processed EM data and determined the structure of E1S-bound ABCG2. I.M and K.P.L built, refined and validated the structures. K.P.L, I.M and S.M.J conceived the project, designed the experiments, and wrote the manuscript. All authors contributed to the revision of the manuscript.
Author Information. Reprints and permissions information is available at www.nature.com/reprints. The authors declare no competing financial interests. Readers are welcome to comment on the online version of the paper. Publisher’s note: Springer Nature remains neutral with regard to jurisdictional claims in published maps and institutional affiliations.
References
- 1.Diestra JE, et al. Frequent expression of the multi-drug resistance-associated protein BCRP/MXR/ABCP/ABCG2 in human tumours detected by the BXP-21 monoclonal antibody in paraffin-embedded material. J Pathol. 2002;198(2):213–9. doi: 10.1002/path.1203. [DOI] [PubMed] [Google Scholar]
- 2.Fetsch PA, et al. Localization of the ABCG2 mitoxantrone resistance-associated protein in normal tissues. Cancer Lett. 2006;235(1):84–92. doi: 10.1016/j.canlet.2005.04.024. [DOI] [PubMed] [Google Scholar]
- 3.Robey RW, et al. ABCG2: a perspective. Adv Drug Deliv Rev. 2009;61(1):3–13. doi: 10.1016/j.addr.2008.11.003. [DOI] [PMC free article] [PubMed] [Google Scholar]
- 4.Vlaming ML, Lagas JS, Schinkel AH. Physiological and pharmacological roles of ABCG2 (BCRP): recent findings in Abcg2 knockout mice. Adv Drug Deliv Rev. 2009;61(1):14–25. doi: 10.1016/j.addr.2008.08.007. [DOI] [PubMed] [Google Scholar]
- 5.Gillet JP, Gottesman MM. Advances in the molecular detection of ABC transporters involved in multidrug resistance in cancer. Curr Pharm Biotechnol. 2011;12(4):686–92. doi: 10.2174/138920111795163931. [DOI] [PMC free article] [PubMed] [Google Scholar]
- 6.Gottesman MM, Fojo T, Bates SE. Multidrug resistance in cancer: role of ATP-dependent transporters. Nat Rev Cancer. 2002;2(1):48–58. doi: 10.1038/nrc706. [DOI] [PubMed] [Google Scholar]
- 7.Imai Y, et al. Breast cancer resistance protein exports sulfated estrogens but not free estrogens. Mol Pharmacol. 2003;64(3):610–8. doi: 10.1124/mol.64.3.610. [DOI] [PubMed] [Google Scholar]
- 8.Ishikawa T, Aw W, Kaneko K. Metabolic Interactions of Purine Derivatives with Human ABC Transporter ABCG2: Genetic Testing to Assess Gout Risk. Pharmaceuticals (Basel) 2013;6(11):1347–60. doi: 10.3390/ph6111347. [DOI] [PMC free article] [PubMed] [Google Scholar]
- 9.Mao Q, Unadkat JD. Role of the breast cancer resistance protein (BCRP/ABCG2) in drug transport--an update. AAPS J. 2015;17(1):65–82. doi: 10.1208/s12248-014-9668-6. [DOI] [PMC free article] [PubMed] [Google Scholar]
- 10.Mo W, Zhang JT. Human ABCG2: structure, function, and its role in multidrug resistance. Int J Biochem Mol Biol. 2012;3(1):1–27. [PMC free article] [PubMed] [Google Scholar]
- 11.Sarkadi B, et al. Human multidrug resistance ABCB and ABCG transporters: participation in a chemoimmunity defense system. Physiol Rev. 2006;86(4):1179–236. doi: 10.1152/physrev.00037.2005. [DOI] [PubMed] [Google Scholar]
- 12.Sharom FJ. The P-glycoprotein multidrug transporter. Essays Biochem. 2011;50(1):161–78. doi: 10.1042/bse0500161. [DOI] [PubMed] [Google Scholar]
- 13.Taylor NMI, et al. Structure of the human multidrug transporter ABCG2. Nature. 2017;546(7659):504–509. doi: 10.1038/nature22345. [DOI] [PubMed] [Google Scholar]
- 14.Jackson SM, et al. Structural basis of small-molecule inhibition of human multidrug transporter ABCG2. Nat Struct Mol Biol. 2018;25(4):333–340. doi: 10.1038/s41594-018-0049-1. [DOI] [PubMed] [Google Scholar]
- 15.Zhou S, et al. The ABC transporter Bcrp1/ABCG2 is expressed in a wide variety of stem cells and is a molecular determinant of the side-population phenotype. Nat Med. 2001;7(9):1028–34. doi: 10.1038/nm0901-1028. [DOI] [PubMed] [Google Scholar]
- 16.Suzuki M, et al. ABCG2 transports sulfated conjugates of steroids and xenobiotics. J Biol Chem. 2003;278(25):22644–9. doi: 10.1074/jbc.M212399200. [DOI] [PubMed] [Google Scholar]
- 17.Lee JY, et al. Crystal structure of the human sterol transporter ABCG5/ABCG8. Nature. 2016;533(7604):561–4. doi: 10.1038/nature17666. [DOI] [PMC free article] [PubMed] [Google Scholar]
- 18.Hanekop N, et al. Molecular insights into the mechanism of ATP-hydrolysis by the NBD of the ABC-transporter HlyB. FEBS Lett. 2006;580(4):1036–41. doi: 10.1016/j.febslet.2005.11.012. [DOI] [PubMed] [Google Scholar]
- 19.Johnson ZL, Chen J. ATP Binding Enables Substrate Release from Multidrug Resistance Protein 1. Cell. 2018;172(1–2):81–89 e10. doi: 10.1016/j.cell.2017.12.005. [DOI] [PubMed] [Google Scholar]
- 20.Kim Y, Chen J. Molecular structure of human P-glycoprotein in the ATP-bound, outward-facing conformation. Science. 2018;359(6378):915–919. doi: 10.1126/science.aar7389. [DOI] [PubMed] [Google Scholar]
- 21.Shintre CA, et al. Structures of ABCB10, a human ATP-binding cassette transporter in apo- and nucleotide-bound states. Proc Natl Acad Sci U S A. 2013;110(24):9710–5. doi: 10.1073/pnas.1217042110. [DOI] [PMC free article] [PubMed] [Google Scholar]
- 22.Zhang Z, Liu F, Chen J. Conformational Changes of CFTR upon Phosphorylation and ATP Binding. Cell. 2017;170(3):483–491 e8. doi: 10.1016/j.cell.2017.06.041. [DOI] [PubMed] [Google Scholar]
- 23.Korkhov VM, Mireku SA, Locher KP. Structure of AMP-PNP-bound vitamin B12 transporter BtuCD-F. Nature. 2012;490(7420):367–72. doi: 10.1038/nature11442. [DOI] [PubMed] [Google Scholar]
- 24.Zaitseva J, et al. A structural analysis of asymmetry required for catalytic activity of an ABC-ATPase domain dimer. EMBO J. 2006;25(14):3432–43. doi: 10.1038/sj.emboj.7601208. [DOI] [PMC free article] [PubMed] [Google Scholar]
- 25.Aller SG, et al. Structure of P-glycoprotein reveals a molecular basis for poly-specific drug binding. Science. 2009;323(5922):1718–22. doi: 10.1126/science.1168750. [DOI] [PMC free article] [PubMed] [Google Scholar]
- 26.Johnson ZL, Chen J. Structural Basis of Substrate Recognition by the Multidrug Resistance Protein MRP1. Cell. 2017;168(6):1075–1085 e9. doi: 10.1016/j.cell.2017.01.041. [DOI] [PubMed] [Google Scholar]
- 27.Alam A, et al. Structure of a zosuquidar and UIC2-bound human-mouse chimeric ABCB1. Proc Natl Acad Sci U S A. 2018;115(9):E1973–E1982. doi: 10.1073/pnas.1717044115. [DOI] [PMC free article] [PubMed] [Google Scholar]
- 28.Choudhury HG, et al. Structure of an antibacterial peptide ATP-binding cassette transporter in a novel outward occluded state. Proc Natl Acad Sci U S A. 2014;111(25):9145–50. doi: 10.1073/pnas.1320506111. [DOI] [PMC free article] [PubMed] [Google Scholar]
- 29.Hohl M, et al. Crystal structure of a heterodimeric ABC transporter in its inward-facing conformation. Nat Struct Mol Biol. 2012;19(4):395–402. doi: 10.1038/nsmb.2267. [DOI] [PubMed] [Google Scholar]
- 30.Verhalen B, et al. Energy transduction and alternating access of the mammalian ABC transporter P-glycoprotein. Nature. 2017;543(7647):738–741. doi: 10.1038/nature21414. [DOI] [PMC free article] [PubMed] [Google Scholar]
- 31.Ritchie TK, et al. Chapter 11 - Reconstitution of membrane proteins in phospholipid bilayer nanodiscs. Methods Enzymol. 2009;464:211–31. doi: 10.1016/S0076-6879(09)64011-8. [DOI] [PMC free article] [PubMed] [Google Scholar]
- 32.Geertsma ER, et al. Membrane reconstitution of ABC transporters and assays of translocator function. Nat Protoc. 2008;3(2):256–66. doi: 10.1038/nprot.2007.519. [DOI] [PubMed] [Google Scholar]
- 33.Schaffner W, Weissmann C. A rapid, sensitive, and specific method for the determination of protein in dilute solution. Anal Biochem. 1973;56(2):502–14. doi: 10.1016/0003-2697(73)90217-0. [DOI] [PubMed] [Google Scholar]
- 34.Chifflet S, et al. A method for the determination of inorganic phosphate in the presence of labile organic phosphate and high concentrations of protein: application to lens ATPases. Anal Biochem. 1988;168(1):1–4. doi: 10.1016/0003-2697(88)90002-4. [DOI] [PubMed] [Google Scholar]
- 35.Mastronarde DN. Automated electron microscope tomography using robust prediction of specimen movements. J Struct Biol. 2005;152(1):36–51. doi: 10.1016/j.jsb.2005.07.007. [DOI] [PubMed] [Google Scholar]
- 36.Biyani N, et al. Focus: The interface between data collection and data processing in cryo-EM. J Struct Biol. 2017;198(2):124–133. doi: 10.1016/j.jsb.2017.03.007. [DOI] [PubMed] [Google Scholar]
- 37.Zheng SQ, et al. MotionCor2: anisotropic correction of beam-induced motion for improved cryo-electron microscopy. Nat Methods. 2017;14(4):331–332. doi: 10.1038/nmeth.4193. [DOI] [PMC free article] [PubMed] [Google Scholar]
- 38.Rohou A, Grigorieff N. CTFFIND4: Fast and accurate defocus estimation from electron micrographs. J Struct Biol. 2015;192(2):216–21. doi: 10.1016/j.jsb.2015.08.008. [DOI] [PMC free article] [PubMed] [Google Scholar]
- 39.Zhang K. Gctf: Real-time CTF determination and correction. J Struct Biol. 2016;193(1):1–12. doi: 10.1016/j.jsb.2015.11.003. [DOI] [PMC free article] [PubMed] [Google Scholar]
- 40.Punjani A, et al. cryoSPARC: algorithms for rapid unsupervised cryo-EM structure determination. Nat Methods. 2017;14(3):290–296. doi: 10.1038/nmeth.4169. [DOI] [PubMed] [Google Scholar]
- 41.Kimanius D, et al. Accelerated cryo-EM structure determination with parallelisation using GPUs in RELION-2. Elife. 2016;5 doi: 10.7554/eLife.18722. [DOI] [PMC free article] [PubMed] [Google Scholar]
- 42.Rosenthal PB, Henderson R. Optimal determination of particle orientation, absolute hand, and contrast loss in single-particle electron cryomicroscopy. J Mol Biol. 2003;333(4):721–45. doi: 10.1016/j.jmb.2003.07.013. [DOI] [PubMed] [Google Scholar]
- 43.Kucukelbir A, Sigworth FJ, Tagare HD. Quantifying the local resolution of cryo-EM density maps. Nat Methods. 2014;11(1):63–5. doi: 10.1038/nmeth.2727. [DOI] [PMC free article] [PubMed] [Google Scholar]
- 44.Emsley P, et al. Features and development of Coot. Acta Crystallogr D Biol Crystallogr. 2010;66(Pt 4):486–501. doi: 10.1107/S0907444910007493. [DOI] [PMC free article] [PubMed] [Google Scholar]
- 45.Moriarty NW, Grosse-Kunstleve RW, Adams PD. electronic Ligand Builder and Optimization Workbench (eLBOW): a tool for ligand coordinate and restraint generation. Acta Crystallogr D Biol Crystallogr. 2009;65(Pt 10):1074–80. doi: 10.1107/S0907444909029436. [DOI] [PMC free article] [PubMed] [Google Scholar]
- 46.Adams PD, et al. PHENIX: a comprehensive Python-based system for macromolecular structure solution. Acta Crystallogr D Biol Crystallogr. 2010;66(Pt 2):213–21. doi: 10.1107/S0907444909052925. [DOI] [PMC free article] [PubMed] [Google Scholar]
- 47.Chen VB, et al. MolProbity: all-atom structure validation for macromolecular crystallography. Acta Crystallogr D Biol Crystallogr. 2010;66(Pt 1):12–21. doi: 10.1107/S0907444909042073. [DOI] [PMC free article] [PubMed] [Google Scholar]
Associated Data
This section collects any data citations, data availability statements, or supplementary materials included in this article.


