

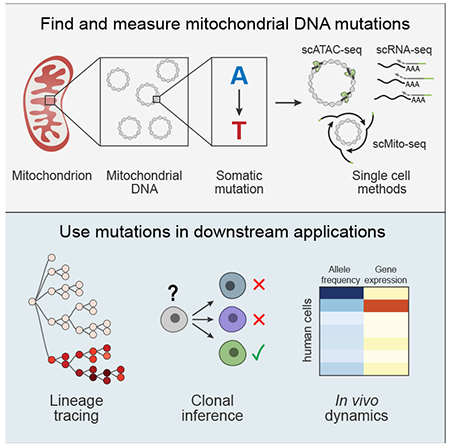
Summary
Lineage tracing provides key insights into the fate of individual cells in complex organisms. While effective genetic labeling approaches are available in model systems, in intact humans most approaches require detection of nuclear somatic mutations, which have high error rates, limited scale, and do not capture cell state information. Here, we show that somatic mutations in mitochondrial DNA (mtDNA) can be tracked by single cell RNA or ATAC sequencing. We leverage somatic mtDNA mutations as natural genetic barcodes and demonstrate their utility as highly accurate clonal markers to infer cellular relationships. We track native human cells both in vitro and in vivo, and relate clonal dynamics to gene expression and chromatin accessibility. Our approach should allow clonal tracking at a 1,000-fold greater scale than with nuclear genome sequencing, with simultaneous information on cell state, opening the way to chart cellular dynamics in human health and disease.
Graphical Abstract
Introduction
Recent innovations in single cell genomics have enabled insights into the heterogeneity of human cell populations and have redefined concepts about lineage commitment and development (Giladi and Amit, 2018). While all cells in the human body are derived from the zygote, we lack a detailed map integrating cell division (lineage) and differentiation (fate). As a result, we have a limited understanding of how cellular dynamics play a role in physiologic and pathologic conditions for any given tissue.
Two classes of methods have been developed to study cellular relationships and clonal dynamics in complex tissues of vertebrates. In model organisms, most approaches to date rely on an engineered genetic label to tag individual cells with heritable marks (Kester and van Oudenaarden, 2018; Woodworth et al., 2017), such as fluorescent reporter genes, high diversity DNA barcode libraries, mobile transposable elements, Cre-mediated recombination, or CRISPR-based genetic scars (McKenna et al., 2016; Pei et al., 2017; Sun et al., 2014; Yu et al., 2016). Recent studies have combined several of these tracing methods with single cell RNA-seq (scRNA-seq) to interrogate both lineage relationships and cell states (Alemany et al., 2018; Montoro et al., 2018; Raj et al., 2018; Spanjaard et al., 2018).
However, the genetic manipulations required for such approaches cannot be applied in intact humans (Biasco et al., 2016). Limited lineage tracing studies in humans have relied on the detection of naturally occurring somatic mutations, including single nucleotide variants (SNVs), copy number variants (CNVs), and variation in short tandem repeat sequences (microsatellites or STRs), which are stably propagated to daughter cells, but are absent in distantly related cells (Ju et al., 2017; Lodato et al., 2015). Detection of nuclear somatic mutations by whole genome sequencing in individual cells remains costly, is difficult to apply at scale, and has substantial error rates (Biezuner et al., 2016; Chu et al., 2017; Tao et al., 2017; Zafar et al., 2017). Moreover, most methods have not been combined with approaches that provide information about cell type and state based on gene expression or epigenomic profiles. As a result, we have had a limited ability to study cellular dynamics in humans in health and disease.
We hypothesized that mitochondrial DNA (mtDNA) sequence variation could provide an innate and natural barcode from which to infer clonal relationships. This sequence variation has several promising attributes for its utility in clonal and lineage tracing. The 16.6 kb long genome provides a substantial target for genetic diversity, but is sufficiently small for cost-effective sequencing. Although there is some variation in the measurements, mtDNA mutation rates are estimated to be 10- to 100-fold higher than for nuclear DNA (Biezuner et al., 2016; Kang et al., 2016; Li et al., 2014; Stewart and Chinnery, 2015). Mitochondrial genomes have high copy number (100s-1,000s), and mutations in mtDNA often reach high levels of heteroplasmy (proportion of mitochondrial genomes containing a specific mutation) due to a combination of vegetative segregation, random genetic drift, and relaxed replication (Figure 1A) (Elson et al., 2001; Stewart and Chinnery, 2015; Wallace and Chalkia, 2013). Indeed, the utility of mtDNA mutations for clone tracking has already been indirectly demonstrated in various tissues (Taylor et al., 2003; Teixeira et al., 2013).
Figure 1. Mitochondrial mutations are stably propagated in human cells in vitro.
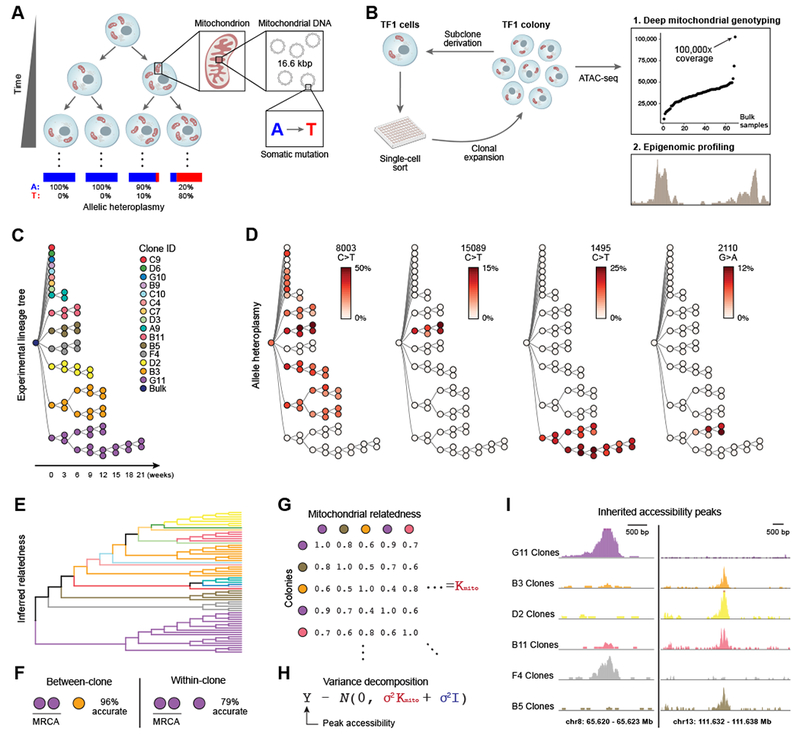
(A) Dynamics of mtDNA heteroplasmy in single cells. Each cell has multiple mitochondria, which in turn contain many copies of mtDNA that may acquire somatic mutations over time. (B) Proof-of-principle design. Each TF1 cell clone and sub-clone is assayed with ATAC-seq. (C) Supervised (true) experimental TF1 lineage tree. Colors indicate each primary clone from initial split. (D) Allelic heteroplasmy of four selected variants reveals stable propagation and clone-specificity. Color bar: allelic heteroplasmy (%). (E) Unsupervised hierarchical clustering of TF1 clones. Color: primary clones as in (C). (F) Between-clone and within-clone accuracy of identifying the most-recent common ancestor (MRCA) per trio of clones based on mtDNA mutational profile. (G) Schematic of mitochondrial relatedness matrix Kmito where each pair of clones is scored based on mitochondrial genotype similarity. (H) Random effects model for variance decomposition of epigenomic peaks. (I) Two examples of peaks inherited in clonal lineages. Peaks represent the sum of open chromatin for the clones with the most samples.
Critically, mtDNA sequences and genetic variation are detected by existing methods, including the single cell assay for transposase accessible chromatin-sequencing (scATAC-seq) and single cell RNA-seq (scRNA-seq). While sequencing reads mapping to the mitochondrial genome are often treated as an experimental nuisance, we reasoned that they can open an opportunity to trace cellular hierarchies at scale. To demonstrate the utility of mtDNA variation for clonal tracing, we must show that heteroplasmic mtDNA mutations (1) can be reliably detected in single cells; (2) are propagated in daughter cells; (3) can be used to accurately determine clonal relationships; (4) can be combined with cell state measurements to learn meaningful biology; and (5) can be applied to study human samples.
Here, we investigate these properties, provide evidence that scRNA- and scATAC-seq provide reliable measurements of mtDNA genetic variation, and demonstrate how these mutations can be used as endogenous genetic barcodes to retrospectively infer cellular relationships in clonal mixtures of native hematopoietic cells, T lymphocytes, leukemia, and solid tumors.
Results
mtDNA genotyping with ATAC-seq allows accurate clone tracking and association with chromatin state
To test if mtDNA genotypes can correctly identify clonal relationships we performed a proof-of-principle experiment, where we derived and propagated sub-clones of the hematopoietic TF1 cell line (Figure 1B). We generated a “ground truth” experimental lineage tree of 65 individual sub-clonal populations over 8 generations (generation time ~3 weeks between two consecutive bottlenecks) (Figure 1C). For each generation, we isolated single cells from the parental colony and expanded each clone to derive sub-clones in an iterative process. The original population and each expanded sub-clone were profiled by ATAC-seq, which captures the full mitochondrial genome as an unwanted by-product (Corces et al., 2017) (Figure S1A; Table S1). On average, the 16.6 kb mitochondrial genome was covered at 3,380-fold per million mapped reads. We determined high-confidence heteroplasmic mitochondrial genotypes with a computational variant-calling pipeline that utilizes individual per-base, per-allele base quality (BQ) scores and verified that our calls were reproducible across sequencing runs (Figures S1B,C; STAR Methods).
The large range of detected mutations included clone- and sub-clone-specific mutations that were propagated over generations (Figures 1D and S1D). Most mutations were C>T transitions, consistent with previous reports (Ju et al., 2014; Ni et al., 2015; Yuan et al., 2017). Although some somatic mutations were shared among multiple first-generation clones and their progeny (e.g., Figure 1D 8003 C>T), nearly all progeny of an individual clone shared mutations that were unique and stably propagated over the course of the experiment (e.g., Figure 1D 15089 C>T, 1495 C>T, Figure S1D). Furthermore, we detected new somatic mutations that arose within subclones and were stably propagated (Figure 1D, 2110 G>A, Figure S1D).
We used these high-confidence mtDNA mutations to reconstruct clonal relations with high accuracy (Figures 1E,F). Ordinal hierarchical clustering on individual samples grouped nearly all (sub-)clones belonging to a single clonal family correctly (Figures 1C,E). Specifically, we accurately identified the most recent common ancestor (MRCA) at 96% between first-generation clones and 79% within sub-clones derived from first-generation clones (Figures 1F and S1E; STAR Methods). Moreover, we correctly inferred clonal contributions to heterogeneous bulk populations comprised of three clones at various concentrations (Figure S1F; STAR Methods).
We next paired mitochondrial genotypes with chromatin state information for each clone and identified differences in chromatin state that follow inferred clonal relationships. We approximated the pairwise clone-clone mitochondrial relatedness (Figure 1G; STAR-Methods) and performed a random effects variance decomposition of each chromatin accessibility peak in our TF1 clones (Figure 1H), asking how “heritable” a chromatin feature is in a population. Of 91,607 peaks tested, 8,570 peaks were highly heritable (> 90% variance explained; Figures 1I and S1G). Overall, this demonstrates the utility of ATAC-seq for mtDNA genotyping to enable accurate clone tracing, while simultaneously providing information on cell state.
Successful detection of mtDNA heteroplasmy using single cell genomics
Because the mitochondrial genome is almost completely transcribed (Figure 2E), we hypothesized that heteroplasmic mitochondrial mutations might be detected by scRNA-seq. Across six scRNA-seq protocols (Ziegenhain et al., 2017), full length scRNA-seq methods showed more extensive coverage of the mtDNA genome than 3’ end directed scRNA-seq (Figures 2A and S2A,B). Importantly, there was a high concordance between heteroplasmic allele frequency estimates from scRNA-seq and whole genome sequencing from the same cell (Han et al., 2018) (Figure 2B). However, several highly heteroplasmic mutations were specific to mtRNA (Figure 2B): some likely reflect RNA-editing, including one that has been previously validated (2619 A>G) (Bar-Yaacov et al., 2013), but many others are observed at low frequencies (<20%) and reflect either RNA transcription errors or technical errors in scRNA-seq (Filbin et al., 2018; Venteicher et al., 2017).
Figure 2. Mitochondrial mutations are detected using single cell genomics.

(A) Coverage of mouse mitochondrial genome by six scRNA-seq methods. Shown is the fraction (%) of the mitochondrial genome (y axis) covered by reads from each of six methods (color code), at different levels of coverage (x axis). (B) Agreement in allelic heteroplasmy estimates from single cell whole genome sequencing (WGS) and scRNA-seq from the same single cells. Shown is the allele frequency for scRNA- (y axis) and scWGS-seq (x axis) based estimates for two cell lines (HCC827: orange; SKBR3: purple). Two examples of RNA-specific changes are highlighted. (C-F) Identification of mitochondrial mutations by scRNA-, scATAC- and scMito-seq in three TF1 clones. (C) Bulk and single cell data collected for three TF1 clones (boxed). Each clone (n = 3) was processed with variable numbers of single-cell libraries (k). (D) Agreement in allelic heteroplasmy estimates from bulk ATAC- (x axis) and bulk RNA-seq (y axis) from three indicated TF1 clones (as in (C)). Two examples of RNA-specific changes are highlighted. (E) Coverage of the mitochondrial genome of the TF clone G10 by each indicated assay. Inner circle: mitochondrial genome; middle blue outline: coverage; outer grey circle: genome coordinates. For single cell assays, coverage is the sum of single cells. (F) Four clone-specific mutations that are reliably detected by various single-cell assays with heteroplasmies as low as 3.8%. Each boxplot shows the % heteroplasmy (y axis) of one mutation across scATAC-, scMito- and scRNA-seq in the three TF1 clones (color code as in (C)). Dots: individual cells.
We systematically compared our ability to detect clones from mtDNA mutations at various levels of heteroplasmy in three TF1 cell clones (Figure 2C: clones C9, D6, G10) using bulk and scATAC-seq, bulk and scRNA-seq (SMART-seq2), and a newly developed single cell mtDNA sequencing protocol based on rolling circle amplification (scMito-seq) (Figures 2C and S2C, STAR Methods) (Ni et al., 2015). We observed high concordance in the frequencies of RNA and DNA-derived mitochondrial genotypes across all methods (in addition to RNA-specific mutations, as described above) (Figures 2D and S2E). As expected, scATAC- and scMito-seq had more uniform and deeper coverage of the mitochondrial genome than SMART-seq2 (Figures 2E and S2D). Data from every method allowed us to detect the previously identified unique clonal allele for 95.4% (210/220) of cells and to accurately infer clonal relationships by hierarchical clustering (Figure 2F and S2F).
Mitochondrial mutation clones match those from lentiviral barcoding
To compare mitochondrial mutations to an exogenous gold standard of clone detection, we used a lentiviral barcoding approach (Kester and van Oudenaarden, 2018; Woodworth et al., 2017). We infected TF1 cells with a modified Perturb-seq lentiviral construct (Dixit et al., 2016) expressing a mNeonGreen gene carrying a 30 bp random nucleotide sequence in its untranslated region (Figure S3A). We sorted 25 mNeonGreen+ cells and expanded them, followed by bulk ATAC-seq and scRNA-seq of 158 quality-controlled cells (Figure 3A). Notably, there was no correlation between the number or types of barcodes discovered and mitochondrial coverage (Figure S3B). The 158 cells included 15 informative barcodes that mapped cells to one of 11 non-overlapping groups (Figure S3A). To filter any artefactual mitochondrial mutations from scRNA-seq (Figures 2B, 3C and S2E, S6F,G), we restricted our analysis to the 20 variants that were present in the bulk ATAC-seq at allele frequencies > 0.5% and which had high per-allele base quality scores in bulk and in the sum of single cells (Figures 3B,C, STAR-Methods).
Figure 3. Validation of mitochondrial mutations as clonal markers in single cells using lentiviral barcoding.
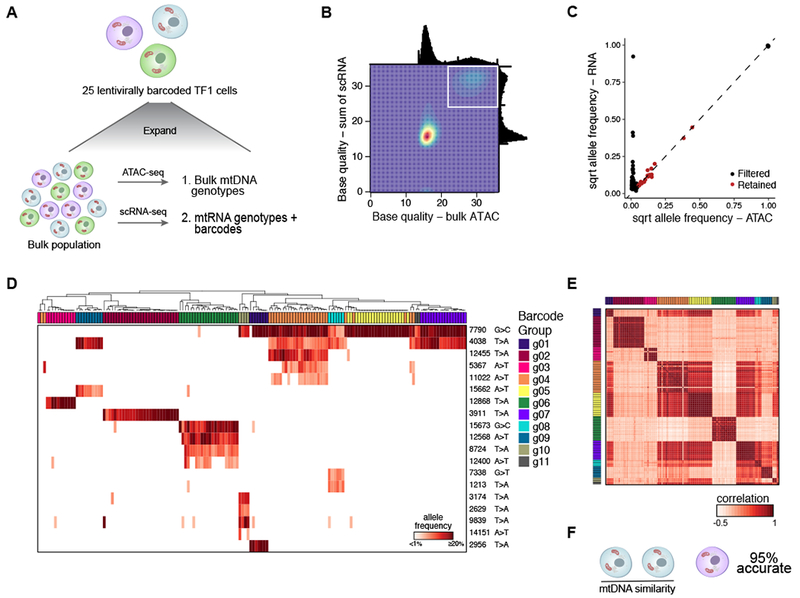
(A) Experimental overview. TF1 cells were infected with a lentiviral vector expressing the mNeonGreen gene and a 30bp random barcode in the untranslated region (Figure S3A). 25 cells were sorted and expanded, followed by bulk ATAC-seq and scRNA-seq. (B) Filtering of high confidence mutations. Base quality (BQ) scores from scRNA- (y axis) and from bulk ATAC-seq (x axis). White box: high-confidence variants detected by both technologies (BQ >20) (STAR Methods). (C) Allele frequencies determined by the sum of single cells from scRNA-seq (y axis) and bulk ATAC-seq (x axis). Black – filtered; red – retained. (D-F) mtDNA inferred clones agree with barcode-based clones. (D) Hierarchical clustering of TF1 mitochondrial genotyping profiles (rows) for cells assigned to annotated barcode groups (columns) (from Figure S3A). Color bar: Heteroplasmy (% allele frequency). (E) Cell-cell similarity from mitochondrial mutations called in (C). Column and rows are annotated by barcode group. (F) Between-group accuracy of identifying the most-similar pair per trio of clones based on mtDNA mutational profile using detected barcodes as a true positive.
Hierarchical clustering by these 20 mitochondrial mutations correctly inferred clonal structure in single cells in a comparable manner with gold-standard exogenous barcodes (Figure 3D). Of note, specific mutations were shared among a number of barcode groups (7790 G>C and 4038 T>A), suggesting these may reflect common sub-clonal structure in the original population. A cell-cell similarity matrix using a Pearson correlation distance metric of the 20 mutations (Figure 3E) effectively classified pairs of cells within the same barcode group (area under receiver operating characteristic curve (AUROC): 0.96; area under the precision recall curve (AUPRC): 0.84; Figures S3C,D). Cells that were most similar based upon mitochondrial genotypes correctly predicted shared barcode pairs in a trio analysis with 95% accuracy (Figure 3F). In this context, mitochondrial mutations provided a significantly more accurate measure of shared clonality than alterations in copy number variants (CNVs) inferred from scRNA-seq (Figures S3E,F).
mtDNA mutation diversity across human tissues
To assess the broader applicability of mitochondrial genotyping, we examined mtDNA mutations across diverse human tissues, similar to previous studies that have shown widespread inter- and intra-individual diversity of heteroplasmic mtDNA mutations (Li et al., 2015; Ye et al., 2014). We analyzed mitochondrial genotypes from bulk RNA-seq of 8,820 individual samples in the GTEx project, spanning 49 tissues with at least 25 donors, as well as 462 donors with at least 10 tissues (Consortium et al., 2017) (Figure 4A; Table S2, STAR-Methods). There was significant variation in the proportion of mitochondrial reads mapping to the mitochondrial transcriptome across tissues, consistent with known differences in the absolute numbers of mitochondria and levels of mitochondrial gene expression in each tissue (Figures 4B,C and S4A). After stringent filtering to remove artifacts related to RNA-seq (STAR Methods), we identified 2,762 mutations that were tissue-specific within an individual donor at a minimum of 3% heteroplasmy (Figures 4D-G and S4B; Table S4), revealing a diverse spectrum of mutations. The majority of mutations were C>T (G>A) or T>C (A>G) transitions (Figure 4E), consistent with previous reports (Ju et al., 2014; Ni et al., 2015; Yuan et al., 2017).
Figure 4. Tissue-specific mitochondrial heteroplasmic mutations.
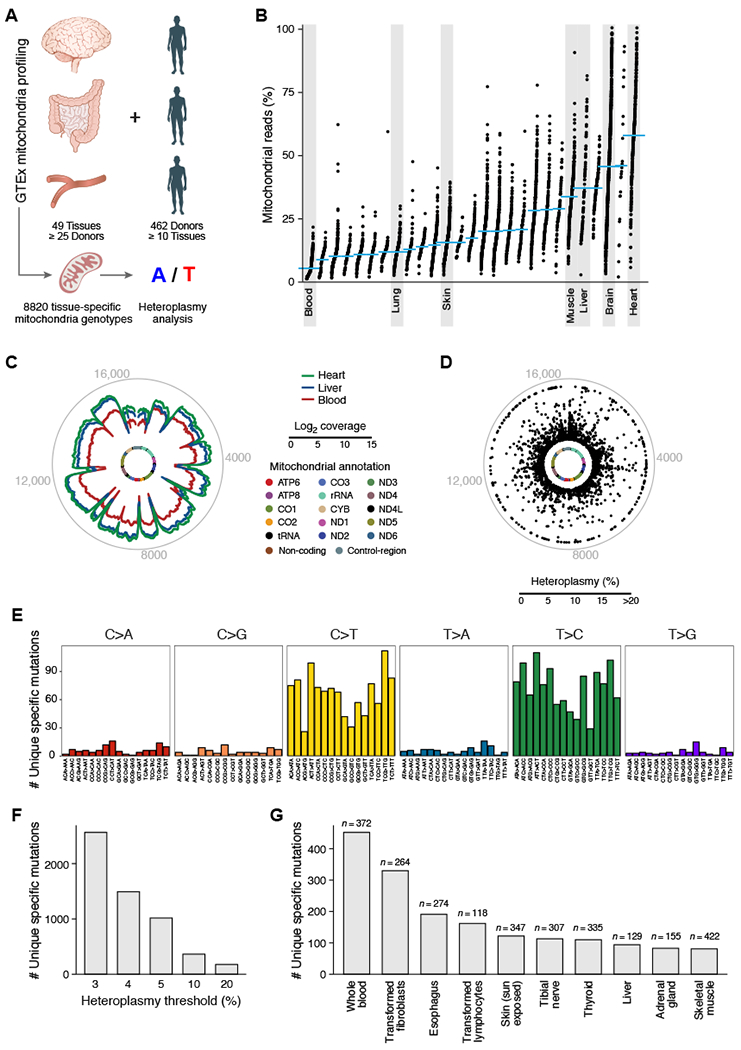
(A) Analysis overview. (B) Proportion of aligned reads that map to the mitochondrial genome for each tissue. (C) Mitochondrial genome coverage for different tissues. Inner circle: mitochondrial genome; middle circular tracks: mean coverage for heart (green), liver (blue), and blood (red); outer grey circle: genome coordinates. (D-G) Tissue-specific heteroplasmic mutations (> 3% heteroplasmy) in GTEx RNA-seq data. (D) Distribution along the mitochondrial genome. Inner circle: mitochondrial genome. Dots: % heteroplasmy of each tissue specific mutation; outer grey circle: genome coordinates. (E) Number of observed tissue-specific heteroplasmic mutations (y axis) in each class of mononucleotide and trinucleotide change. (F) Number of tissue-specific heteroplasmic mutations (y axis) at different allele frequency thresholds (x axis). (G) Number of tissue-specific heteroplasmic mutations (y axis) across the 10 tissues (x axis) with the largest number of tissue specific mutations in GTEx.
Each of the 49 tissues examined had at least one tissue specific mutation across all donors, only 28 non-polymorphic mutations were shared between any two tissues from any one donor (minimum heteroplasmy of 5%), and no non-polymorphic mutations were shared between three such tissues, indicating that these mutations arose somatically and in a tissue-specific manner. However, this is likely an underestimate of the true extent of heteroplasmy at the level of individual cells, due to measurement of bulk populations (Kang et al., 2016). Most of the predicted deleterious mutations (STAR-Methods) did not show an appreciable difference in median heteroplasmy compared to the benign ones (Figures S4C,D), although high heteroplasmic (>20%) mutations were present at ~3.6- to 4.4-fold fewer than expected (Figures S4E,F). Of note, these levels are substantially below the estimated biochemical threshold of 60-90% heteroplasmy, where deleterious mtDNA mutations are generally thought to have an effect (Stewart and Chinnery, 2015). Thus, even predicted damaging mutations appear to be tolerated at heteroplasmy levels suitable for lineage tracing, although high-throughput functional studies of mtDNA mutation and large population genetic studies are needed to refine these definitions. Overall, this diversity of mitochondrial mutations within individual humans indicates that these can be leveraged to probe questions related to cellular relationships across a range of healthy tissues and cell types.
Stable propagation of diverse heteroplasmic mtDNA mutations in primary hematopoietic cells
We next tested if mtDNA mutations are clonally propagated in primary human cells. We plated CD34+ hematopoietic stem and progenitor cells (HSPCs) from two independent donors in semi-solid media, derived 65 erythroid and myeloid colonies, and profiled 8-16 cells per colony by scRNA-seq for a total of 935 cells that passed quality metrics (Figure 5A). Cells composing any individual colony are derived from a single, distinct hematopoietic progenitor cell. As expected, based on expression profiles, the cells partitioned into two major clusters, corresponding to erythroid and myeloid cells, consistent with colony morphology and irrespective of donor (Figures 5A-D and S5A,B). Conversely, the mtDNA mutation profile separates single cells according to their donor of origin, as well as their single cell-derived colony of origin based on highly heteroplasmic mutations (Figures 5E-G and S5A,B).
Figure 5. Mitochondrial mutations are stably propagated in primary hematopoietic cells.
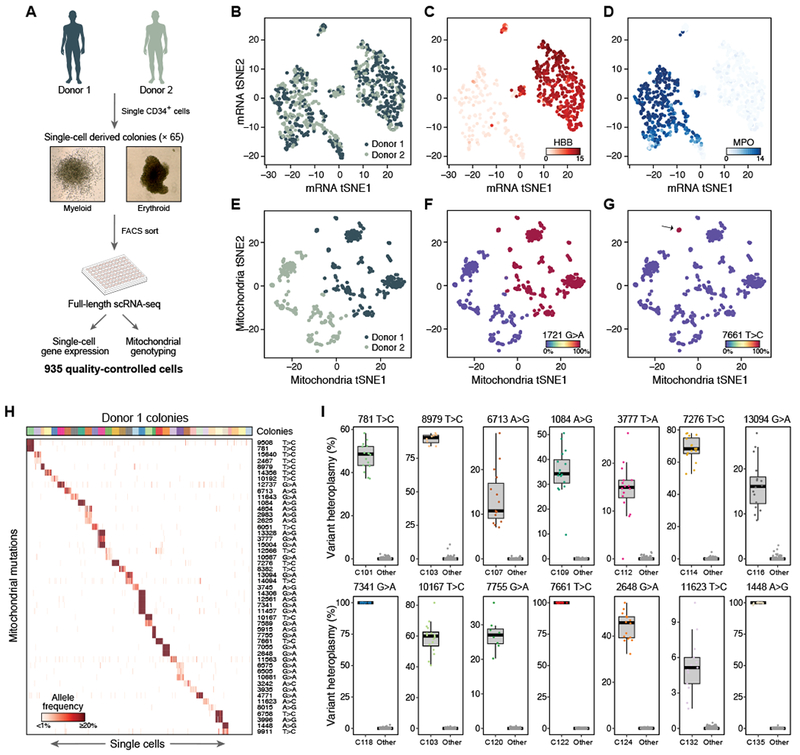
(A) Overview of experiment. Hematopoietic colonies are derived from single primary CD34+ HSPCs in semi-solid media, which were then picked and sorted before performing scRNA-seq. (B-D) Expression profiles separate cells by types and not by donor. t-Stochastic Neighborhood Embedding (tSNE) plots of cells’ expression profiles, labeled by donor (B) or by expression of HBB (C, marking erythroid cells) or MPO (D, marking myeloid cells). (E-G) Mitochondrial mutation profiles separate cells by donor. tSNE plots of mitochondrial mutation profiles, with cells labeled by donor (E), a polymorphic mutation unique to donor 1 (F), or a heteroplasmic mutation present only in a specific colony (G). (H) Colony-specific mutations for Donor 1. Shown are the allele frequencies and base pair change of mutations (rows) that are found by supervised analysis as specific to the cells (columns) in each colony (sorted by colony membership; colored bar on top), color bar: allelic heteroplasmy (%). (I) 14 selected colony-specific mutations in Donor 1 colonies. Box plots show the distribution of heteroplasmy (%, y axis) in cells of a specific colony for the indicated mutation, and in the cells in all other colonies. Dots: individual cells.
Supervised analysis shows that colony-specific mutations within each donor are faithfully propagated (Mann-Whitney U Test p-value < 10−10), a significant subset of which distinguishes most cells in each colony from all other cells from the same donor (Figures 5H and S5C; Table S4). Specifically, we identified unique clonal mutations in 71% of colonies for donor 1 and 47% for donor 2, each detected at similar frequencies in at least 80% of cells of the same colony (Figure S5F; STAR-Methods), although certain experimental challenges, such as mixing between adjacent colonies (Figures S5D,E) likely result in an underestimate. The extent of heteroplasmy varied considerably, including multiple mutations that nearly achieved homoplasmy (Figure 5I). We observed similar mutational diversity with bulk ATAC-seq of colonies similarly derived from two other donors (Figure S5H), and in 268 sorted phenotypic hematopoietic stem cells (HSC) from three additional donors from a published scATAC-seq study (Figure S5I) (Buenrostro et al., 2018). Importantly, the colony-specific mitochondrial mutations do not overlap between donors in the scRNA-seq analysis (Figure S5G) and show very limited overlap between donors in the scATAC-seq analysis (Figure S5J). Thus, adult human HSPCs show a large spectrum of mtDNA mutational diversity and these mutations are stably propagated in daughter cells at a level that allows for lineage or clonal tracing studies of in vivo human hematopoiesis.
mtDNA mutations from scRNA-seq and scATAC-seq allow inference of clonal structure in primary human cells
To assess our ability to accurately infer clonal structures in complex primary human cell populations, we obtained 30 primary CD34+ HSPCs from donor 2, expanded them into a single large population over 10 days, and processed cells by bulk ATAC-seq and either scATAC- or scRNA-seq (Figures 6A and S6A). We used probabilistic k-medoids clustering of these mtDNA mutation profiles to cluster individual cells (STAR Methods). Our clustering assigned cells with high-confidence to 10 clusters consisting of 3-36 cells per cluster, with cells in each cluster sharing one or two heteroplasmic mutations at comparable frequencies (Figures 6B and S6E), consistent with expectations under a simulated setting (Figure S6C, STAR-Methods). Notably, when all RNA-based mtDNA mutations (including the artefactual variants) were included, we could not readily discern clusters (Figures S6F,G). Applying this approach to cells with mtDNA mutations called from scATAC-seq, we were similarly able to assign 95 of 148 cells (64%) to 9 different clusters (Figures 6C and S6B,D,H) and identify clone-specific regions of open chromatin (Figure 6D, STAR-Methods).
Figure 6. Mitochondrial mutations identify clonal contributions in polyclonal mixtures of human cells.
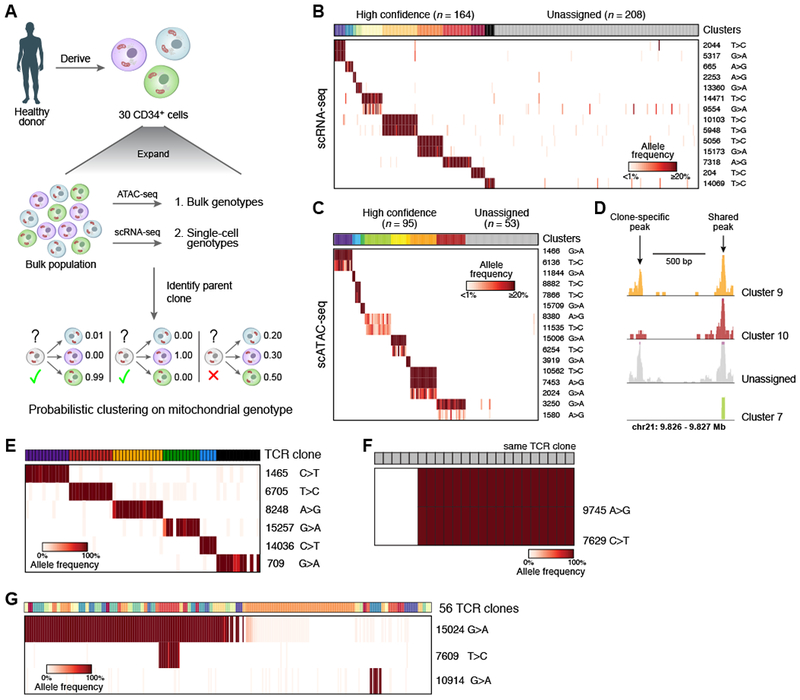
(A-D) Determination of clones in primary hematopoietic cells. (A) Overview of experiment. CD34+ HSPCs are expanded, genotyped in bulk and single cells, and clonal origin is inferred. (B, C) Identification of confident cell subsets based on retained heteroplasmic mutations by unsupervised clustering of scRNA- or scATAC-seq using probabilistic k-medoids. Cells (columns) are sorted by unsupervised clustering on the variants (rows). Clusters: colored bar on top; grey: unassigned cells; color bar: allelic heteroplasmy (%). (D) Example locus with one clone-specific (left) and one shared (right) open chromatin peak recovered by mitochondrial clustering. (E-G) Relationship between mitochondrial mutations and TCR clones in human T lymphocytes. Each panel shows data from independent patients. (E) Shown are the allele frequencies of heteroplasmic mutations (rows) that are concordant with individual TCR clones (columns, color code). (F) Sub-clonal relations within a single TCR clone. Heteroplasmic mutations (rows) that differ between cells within a single TCR clone (columns). (G) Heteroplasmic mutations (rows) shared among a variety of TCR clones (columns, color code). Color bar: allelic heteroplasmy (%).
Somatic mtDNA mutations are consistent with and further refine human T lymphocyte clones defined by TCR rearrangements
As a test of the ability of mtDNA mutations to correctly resolve human cell clones in vivo, we turned to T lymphocytes, where T cell receptor (TCR) rearrangements are frequently used as natural markers of clonality. We applied our method to tumor-infiltrating T lymphocytes from human lung and liver cancers (Guo et al., 2018; Zheng et al., 2017a). Supervised analysis of T lymphocytes sharing a unique TCR sequence revealed shared specific mtDNA mutations that were absent from other T lymphocytes (Figure 6E). In some instances, mtDNA mutations in T lymphocytes with the same TCR rearrangement further classified cells into subpopulations (Figure 6F). These mutations may have arisen after TCR rearrangement as subpopulations underwent stimulation and proliferation, or the TCR may have developed independently from clonally distinct T lymphocyte progenitor cells. Moreover, some mtDNA mutations were shared across T lymphocytes with unique TCR sequences, suggesting they shared a common ancestor prior to V(D)J recombination (Figure 6G). These findings further demonstrate that mtDNA mutations are reliable clonal markers in vivo.
Somatic mtDNA mutations reveal subclonal structure in primary human colorectal cancer
To test our approach in solid tissues and tumors, we analyzed EPCAM+ cells from a colorectal adenocarcinoma primary tumor resection by bulk ATAC-seq and scRNA-seq (Figure 7A). To derive the non-cancer mtDNA genotype, we processed EPCAM+ cells from two adjacent, presumed healthy sites by bulk ATAC-seq. We identified 11 mtDNA mutations specific to the tumor and absent in adjacent healthy tissue (Figure 7B). Across 238 cells from the tumor sample, we were able to partition 107 cells (45%) into 12 distinct clusters by mtDNA mutations (Figures 7B,C and S7A), suggesting the presence of clonal heterogeneity. We annotated the clusters by known markers of colonic epithelial cells (Figures 7D,E and S7A-C) (Dalerba et al., 2011). Of note, 28/30 (93%) of the tumor cells expressing the stem cell marker LGR5 shared the 9000 T>C mutation (Figures 7D,F). Expression of the proliferation marker MKI67 was particularly high in these cells, potentially explaining the large contribution of this population to the tumor tissue (Figures 7E,F).
Figure 7. Application of mitochondrial mutation tracking in human cancer in vivo.
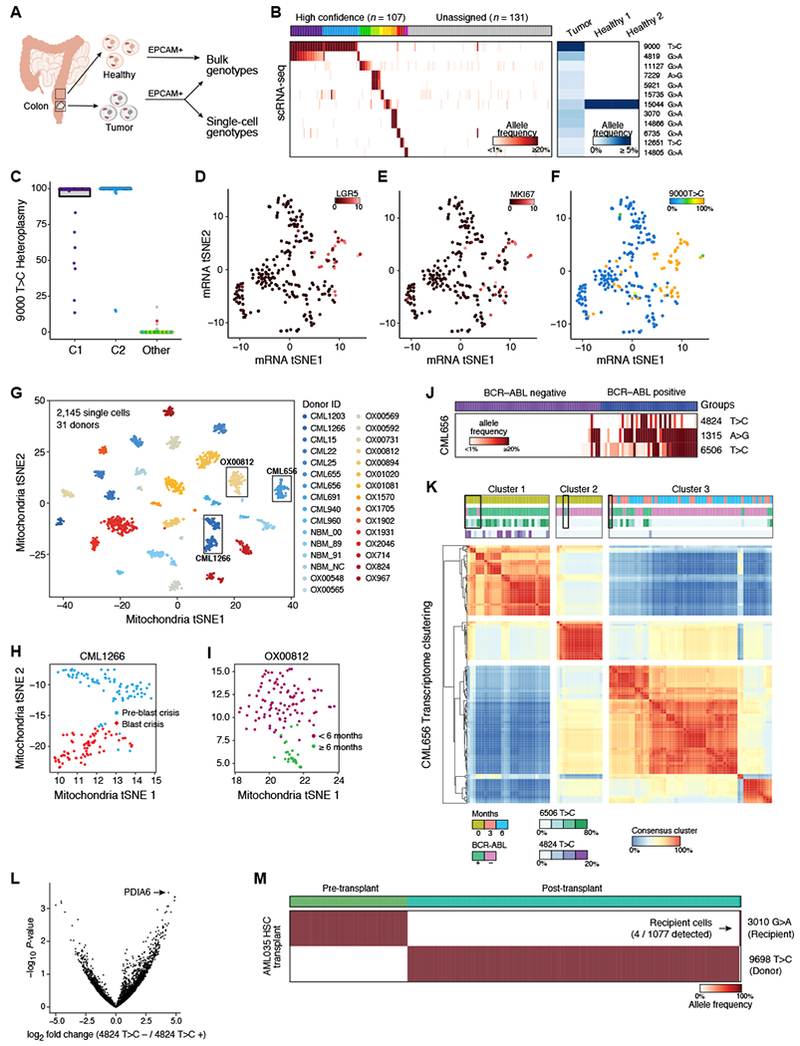
(A-F) Identification of clones in human colorectal cancer. (A) Cells from tumor and adjacent normal tissue are sorted based on EPCAM+ surface marker expression and genotyped using bulk ATAC-seq and scRNA-seq. (B) Identification of clonal subsets based on heteroplasmic mutations (rows) across cells (columns), sorted by unsupervised clustering (clusters: colored bar on top; grey: unassigned cells). Right: allele frequencies in the bulk healthy and tumor populations. (C) Heteroplasmy levels per single-cell. Colors and clusters are from panel B. (D-F) Clone of predominantly LGR5+ cells. tSNE of scRNA-seq profiles from the tumor, colored by expression for (D) LGR5 (E) MKI67 (Color bar: log2 counts per million) and (F) heteroplasmy of the 9000 T>C allele (color bar: % allelic heteroplasmy). (G) Near-perfect separation of donors based on mitochondrial genotypes. tSNE of mitochondrial mutation profiles of 2,145 single cells from 31 donors with CML, colored by donor ID. Boxes: Donors analyzed for sub-clones in (H-L). (H,I) Identification of putative sub-clonal structure within donors. tSNE of mitochondrial mutation profiles of cells from donor CML1266 (H), sampled at pre- (blue) and during (red) blast crisis, and for donor OX00812 (I), sampled at diagnosis and <6 months of treatment (magenta) or >6 months treatment (green). (J) Shown are the allele frequencies of three highly heteroplasmic mutations (rows) across BCR-ABL positive vs. negative cells (columns). Color bar: allelic heteroplasmy (%). (K) Consensus clustering of CML656 transcripts suggests variable annotation in BCR-ABL positive cells at diagnosis. Heatmap showing proportion of times (red/blue) that two cells (columns, rows) belong to the same cluster (STAR Methods). Color bars denote from top to bottom: time of collection, BCR-ABL status, and allele frequencies (6506 T>C, 4824 T>C). Boxes indicate cells where mitochondrial mutations suggest that the BCR-ABL status was incorrectly determined by the BCR-ABL genotyping assay alone. (L) Differentially expressed genes (x-axis) between cells in Cluster 1 comparing cells with and without the 4824 T>C mutation. P-value (y-axis) is from an empirical Bayes moderated t-test. (M) mtDNA mutations distinguish recipient- and donor-specific cells after HSCT in AML. Shown are the allele frequencies of one recipient-specific and one donor-specific mutation (rows) across single cells (columns) collected before and after transplant. Arrow: four recipient cells detected after transplant. Color bar: allelic heteroplasmy (%).
Somatic mtDNA mutations as stable clonal markers in CML in humans in vivo
To further validate the utility of our approach in vivo, we focused on chronic myelogenous leukemia (CML). Using our mitochondrial genotyping pipeline we analyzed scRNA-seq data from 2,145 cells profiled across 49 samples from 31 CML patients, collected at the time of diagnosis, when CML clones predominate, and at 3 and 6 months of therapy, when malignant clones are expected to decrease in frequency relative to benign HSPCs (Giustacchini et al., 2017). Since neither bulk ATAC-seq, nor DNA-seq were available, we applied particularly conservative quality thresholds (STAR Methods).
The mitochondrial genotypes robustly separated donors by unsupervised analysis (Figures 7G and S7D,J), consistent with our observations of mtDNA variation across humans (Figure 4), and, in some patients, further partitioned cells in a manner consistent with disease stage (Figures 7H,I and S7E,F). In one striking example, three heteroplasmic mtDNA mutations were nearly exclusive to BCR-ABL positive cells, but absent in non-leukemic cells from the same donor (Figure 7J). Importantly, integration of these mtDNA mutations appears to improve stratification of malignant cells vs. benign cells compared to the BCR-ABL genotyping assay alone, resulting in 100% concordance with transcriptional signatures (Figure 7K, boxed cells). Interestingly, although the frequency of BCR-ABL positive cells decreased with treatment (compare cells in cluster 1 and 2 to cells in cluster 3), one mitochondrial mutation (6506 T>C) present in the majority of BCR-ABL positive cells at diagnosis continued to mark BCR-ABL positive cells post-treatment, thereby validating the stable propagation of mtDNA mutations over extended periods of time in vivo (Figure 7K). On the other hand, BCR-ABL positive cells with the 4824 T>C mutation (that also harbor the 6506 T>C mutation) were depleted, implying that this subclone was likely more susceptible to therapy.
Unsupervised clustering by expression profiles partitioned this patient’s cells into three clusters. Clusters 1 and 2 were comprised of cells from the initial sample at diagnosis, but separated by BCR-ABL status as well as by mitochondrial genotype. Cluster 3 was comprised of cells obtained 3 and 6 months after the start of treatment (Figure 7K). Differential expression analysis of Cluster 1 cells stratified by the 4824 T>C mutation status (Figure 7L) identified the induction of PDIA6, a gene implicated in cancer cell proliferation (Gao et al., 2016), in cells lacking the mutation, suggesting that it may be associated with the observed variation in sub-clone frequencies. Thus, mitochondrial genetic analysis can improve stratification of malignant cells and enhance understanding of clonal evolution and therapy resistance.
In vivo chimerism inferred from mtDNA mutations
Mitochondrial genotyping has the potential to allow efficient tracking of donor and recipient chimerism during HSC transplantation (HSCT). We analyzed scRNA-seq profiles of peripheral blood mononuclear cells (PBMCs) from an AML patient before and after HSCT, which were profiled with 3’ directed massively parallel scRNA-seq (Zheng et al., 2017b). Although such approaches have substantially reduced coverage of mtDNA (Figures S2A and S7G,H), we reasoned that a small number of homoplasmic mutations should be detectable. Indeed, our analysis revealed two homoplasmic mitochondrial alleles distinguishing the donor and recipient cells (Figure 7M), and inferred that ~99.6% of cells sampled post-transplant were donor-derived, but four recipient cells were still present. These results demonstrate the potential of using mitochondrial mutations to measure the dynamics of donor chimerism in transplantation settings. Such approaches may demonstrate even greater sensitivity in conjunction with currently employed approaches (Kang et al., 2018; Zheng et al., 2017b).
Discussion
Here, we describe an approach for high-throughput and unsupervised tracing of cellular clones and their states at single cell resolution in native human cells by mtDNA mutation detection. This approach is likely to be broadly useful and immediately applicable, since mtDNA mutations can be readily detected by commonly employed single cell genomic methods, including scRNA-seq and scATAC-seq, which concomitantly provide readouts of cell state. We show that somatic mtDNA mutations with levels as low as 5% heteroplasmy can be stably propagated and serve as clonal markers in primary human cells. We additionally provide an improved mutation detection framework, where mutations are first identified based on a DNA-based bulk sample (lower threshold 0.5%), and then called in scRNA-seq data, allowing for accurate mutation detection in RNA-based measurements. Overall, in our validation experiments, mitochondrial genotypes correctly inferred clonal lineage with ~95% accuracy (Figures 1–3), achieving similar accuracy as widely applied genetic labeling methods.
Our approach has three key advantages: (1) it is highly scalable; (2) it is directly applicable to human tissues; and (3) it is combined with assays to profile a cell’s state at the chromatin or transcriptome level. Conversely, single cell whole genome sequencing can be applied in human tissues, but is neither scalable nor combined with a functional state profile, whereas exogenous genetic barcoding cannot be applied to native human samples. For example, ~18,000 individual cells’ mitochondrial genomes can be sequenced at 100-fold coverage for the sequencing cost of a single nuclear genome at 10-fold coverage, a depth not sufficient for confident mutation calling (Lodato et al., 2015).
Our approach can be further enhanced in several ways. First, additional assays devised to focus on directly measuring mitochondrial genomes can reduce cost and increase coverage (Figure S2D). For example, we developed a scMito-seq protocol (Figure S2C), potentially providing a higher fidelity of mitochondrial mutation detection based on rolling-circle amplification (Ni et al., 2015) that could be also used in combination with scRNA-seq (Macaulay et al., 2015). Currently, massively parallel scRNA-seq data from droplet based approaches have limited coverage of the mitochondrial genome (Figures S2A and S7G,H), restricting their immediate utility and application, though a combined enrichment and capture of mitochondrial transcripts could improve this approach (Dixit et al., 2016; Zemmour et al., 2018). Finally, mtDNA sequencing could be combined with nuclear DNA sequencing strategies to detect SNVs, CNVs, and microsatellites to further increase the fidelity and reach of current single cell clonal tracing applications.
One potential limitation with using mtDNA mutations for clone detection or lineage inference may arise from the horizontal transfer of mitochondria between cells, which has been described in specific contexts, but the extent and physiologic relevance of such a process remains unclear. The transfer of organelles appears to be primarily triggered by various stress responses, is restricted to specific cell types, and can be a feature of malignant cells, but the extent of organelle transfer appears to be limited (Caicedo et al., 2015; Griessinger et al., 2017; Marlein et al., 2017; Moschoi et al., 2016; Torralba et al., 2016). Moreover, such transfer would have to be extensive to significantly confound the analysis (Figure S7I) and we have been unable to detect evidence of such transfer in our data (Figures 3, 6, 7J,K and 7M). Another limitation is that we are currently unable to account for phenotypic effects of the mtDNA mutations used for clonal tracing. Although most mutations likely have at most small effects at the heteroplasmy levels investigated here, accurate maps of allele heteroplasmy and cellular function will be an important area for further investigation.
Overall, we show that measuring somatic mitochondrial mutations provides a powerful and scalable approach to assess cellular dynamics of native human cells. Mitochondrial mutations readouts are readily compatible with single cell measurements of cell state to provide a potent means to relate stem and progenitor cells with their differentiated progeny that should facilitate probing the molecular circuits that underlie cell fate decisions in health and disease. Clonal tracking using mitochondrial mutations opens up a novel avenue to infer critically needed relationships in large-scale efforts, such as the Human Cell Atlas or in tumor cell atlases, to better understand the mechanics of homeostasis and development across a reference map of human tissues (Regev et al., 2017).
STAR METHODS
CONTACT FOR REAGENT AND RESOURCE SHARING
Requests for further information or reagents should be directed to Lead Contact, Vijay G. Sankaran (sankaran@broadinstitute.org).
EXPERIMENTAL MODEL AND SUBJECT DETAILS
TF1 Cell Culture
TF1 cells (ATCC) were maintained in Roswell Park Memorial Institute Medium (RPMI) 1640, 10% fetal bovine serum (FBS), 2mM L-Glutamine and 2ng/ml recombinant human Granulocyte-Macrophage Colony-Stimulating Factor (GM-CSF) (Peprotech) and incubated at 37°C and 5% CO2. 293T cells (ATCC) were maintained in Dulbecco’s Modified Eagle Medium-High Glucose (DMEM), 10% fetal bovine serum (FBS), and 2mM L-Glutamine and incubated at 37°C and 5% CO2.
Primary Cell Culture and methylcellulose colony assays
CD34+ hematopoietic stem and progenitor cells were obtained from the Fred Hutchinson Hematopoietic Cell Processing and Repository (Seattle, USA) and were cultured in StemSpan II with 1× CC100 (Stemcell Technologies) at 37°C and 5% CO2. For methylcellulose colony assays, 500 cells per ml were plated in MethoCult H4034 Optimum (Stemcell Technologies) according to the manufacturer’s instructions. Individual colonies were picked at day 10 or 12 after plating for single cell sorting.
Human colorectal cancer specimen
Primary untreated colorectal tumor and adjacent non-neoplastic tissue were surgically resected from a 75-year-old male patient with pathologically diagnosed colorectal adenocarcinoma at Massachusetts General Hospital. Written informed consent for tissue collection was provided in compliance with IRB regulations (IRB compliance protocol number 02-240. Broad Institute ORSP project number ORSP-1702).
METHOD DETAILS
Lentiviral barcoding of TF1 cells
TF1 cells were infected with a modified Perturb-seq lentiviral construct (Dixit et al., 2016) expressing a mNeonGreen gene carrying a 30bp random nucleotide sequence in its untranslated region (Figure S3A). For production of lentiviruses, 293T cells were transfected with the appropriate viral packaging and genomic vectors (pVSV-G and pDelta8.9) using FuGene 6 reagent (Promega) according to the manufacturer’s protocol. The medium was changed the day after transfection to RPMI 1640 supplemented with 10% FBS, L-Glutamine and Penicillin/Streptomycin. After 24h, this medium was collected and filtered using an 0.22-μm filter immediately before infection of TF1 cells. The cells were mixed with viral supernatant in the presence of 8 μg/ml polybrene (Millipore) in a 6-well plate at a density of ~300,000 cells per well. The cells were spun at 2,000 r.p.m. for 90 min at 22 °C and left in viral supernatant overnight. The medium was replaced the morning after infection. Twenty-five barcoded mNeonGreen+ cells were sorted at day 3 post infection and expanded for 11 days before processing using a combination of bulk ATAC-seq and scRNA-seq.
Single cell sorting
Single cells were sorted into 96 well plates using the Sony SH800 sorter with a 100μm chip at the Broad Institute Flow Cytometry Facility. Sytox Blue (ThermoFisher) was used for live/ dead cell discrimination. For scRNA-seq, plates were spun immediately after sorting and frozen on dry ice and stored at −80°C until further processing.
Bulk ATAC-seq
For ATAC-seq library preparations 5,000-10,000 cells were washed in PBS, pelleted by centrifugation and lysed and tagmented in 1× TD buffer, 2.5μl Tn5 (Illumina), 0.1 % NP40, 0.3× PBS in a 50μl reaction volume as described (Corces et al., 2017). Samples were incubated at 37°C for 30min at 300rpm. Tagmented DNA was purified using the MinElute PCR kit (Qiagen). The complete eluate underwent PCR, as follows. After initial extension, 5 cycles of pre-amplification using indexed primers and NEBNext® High-Fidelity 2× PCR Master Mix (NEB) were conducted, before the number of additional cycles was assessed by quantitative PCR using SYBR Green. Typically, 5-8 additional cycles were run. The final library was purified using a MinElute PCR kit (Qiagen) and quantified using a Qubit dsDNA HS Assay kit (Invitrogen) and a High Sensitivity DNA chip run on a Bioanalyzer 2100 system (Agilent).
Single cell ATAC-seq
The C1 Fluidigm platform using C1 single cell Auto Prep IFC for Open App and Open App Reagent Kit were used for the preparation of single cell ATAC-seq libraries as previously described (Buenrostro et al., 2015). Briefly, cells were washed and loaded at 350 cells/μl. Successful cell capture was monitored using a bright-field Nikon microscope and was typically >85%. Lysis and tagmentation reaction and 8 cycles of PCR were run on chip, followed by 13 cycles off chip using custom index primers and NEBNext® High-Fidelity 2× PCR Master Mix (NEB). Individual libraries were pooled and purified using the MinElute PCR kit (Qiagen) and quantified using a Qubit dsDNA HS Assay kit (Invitrogen) and a High Sensitivity DNA chip run on a Bioanalyzer 2100 system (Agilent).
Bulk RNA-seq
Cells were lysed in RLT or TCL lysis buffer (Qiagen) supplemented with beta-mercaptoethanol and RNA was isolated using a RNeasy Micro kit (Qiagen) according to the manufacturer’s instructions. An on-column DNase digestion was performed before RNA was quantified using a Qubit RNA HS Assay kit (Invitrogen). 1-10ng of RNA were used as input to a modified SMART-seq2 (Picelli et al., 2014) protocol and after reverse transcription, 8 cycles of PCR were used to amplify transcriptome library. Quality of whole transcriptome libraries was validated using a High Sensitivity DNA Chip run on a Bioanalyzer 2100 system (Agilent), followed by library preparation using the Nextera XT kit (Illumina) and custom index primers according to the manufacturer’s instructions. Final libraries were quantified using a Qubit dsDNA HS Assay kit (Invitrogen) and a High Sensitivity DNA chip run on a Bioanalyzer 2100 system (Agilent).
Single cell RNA-seq
Single cells were sorted into 5μl TCL lysis buffer (Qiagen) supplemented with 1% beta-Mercaptoethanol. RNA isolation, reverse transcription and PCR were conducted as described using a modified SMART-seq2 protocol (Picelli et al., 2014; Villani et al., 2017). Quality control and library preparation were conducted as described above.
Single cell Mito-seq
Single cells were sorted in to 5 μl TCL lysis buffer (Qiagen) supplemented with 1% beta-mercaptoethanol. DNA was isolated with AMPure XP beads (Beckman Coulter) and the REPLI-g Mitochondrial DNA kit (Qiagen) was used for amplification at 33°C for 8h in a 16.5μl reaction volume. Amplified DNA was cleaned up with AMPure XP beads (Beckman Coulter), quantified using a Qubit dsDNA HS Assay kit (Invitrogen) and library preparation was performed using the Nextera XT kit (Illumina) using custom index primers according to the manufacturer’s instructions.
Processing of human colorectal cancer and adjacent healthy tissues
Fresh tissue was collected into RPMI 1640 medium supplemented with 2% human serum (Sigma), cut into 1 mm2 pieces, and enzymatically digested for 20min at 37°C using the Human Tumor Dissociation Kit (Miltenyi Biotec) in the presence of 10μM ROCK inhibitor Y-2763 (Sigma). Cell suspension was passed through 70μm cell strainers and centrifuged for 7min at 450g at 4°C. Supernatant was removed and cells were subject to ACK Lysing Buffer (Life Technologies) for 2min on ice, centrifuged for 7min at 450 g at 4°C, and resuspended in RPMI 1640 supplemented with 2% human serum (Sigma). The single cell suspension was stained with Zombie Violet in PBS (Invitrogen) for 10min on ice and subsequently with antibodies against human CD326, CD45, and CD235a (Biolegend) in RPMI 1640 medium supplemented with 1% human serum in the presence of 10μM Y-2763 for 15 min on ice. Zombie Violet− CD235a− CD45− CD326+ cells were bulk sorted into 1.5ml Eppendorf tube containing 1× TD buffer, 2.5μl Tn5 (Illumina), 0.1 % NP40, 0.3× PBS in a 50μl reaction volume for ATAC-seq as described above. Using the identical gating scheme, single cells were sorted into Eppendorf twin-tec PCR plates containing 10μl TCL lysis buffer (Qiagen) supplemented with 1% beta-Mercaptoethanol and processed for scRNAseq as described above.
Sequencing
All libraries were sequenced using Nextseq High Output Cartridge kits and a Nextseq 500 sequencer (Illumina). Libraries were sequenced paired-end (2× 38 or 2× 75 cycles).
QUANTIFICATION AND STATISTICAL ANALYSIS
Data processing and read alignment
For each sequencing library generated in this study (Figures 1, 2D-F, 3, 5, 6A-D, and 7A-F), libraries were sequenced on an Illumina NextSeq 500 and demultiplexed using the bcl2fastq program. For each library, raw .fastq reads were aligned using either Bowtie2 version 2.3.3 (ATAC-seq and Mito-seq) (Langmead and Salzberg, 2012) or STAR version 2.5.1b (RNA-seq) (Dobin et al., 2013) to the hg19 reference genome. For the mESC scRNA-seq coverage comparison (Figure 2A), reads from the published dataset (Ziegenhain et al., 2017) were aligned to the mm10 reference genome.
RNA-seq and scRNA-seq transcript counts were computed using STAR’s “--quantModes GeneCounts” flag using the Gencode 19 release .gtf file.
For the published droplet based scRNA-Seq (10× Genomics) AML dataset (Zheng et al., 2017b), processed .bam files (aligned to GRCh37) were downloaded from the public downloads page on the 10× website [https://support.10xgenomics.com/single-cell-gene-expression/datasets].
Raw .fastq files for public RNA-seq and scRNA-seq data were downloaded from the Gene Expression Omnibus (GEO), European Nucleotide Archieve (ENA), the database of Genotypes and Phenotypes (dbGaP) resources or European Genome-Phenome Archive (EGA), as follows:
Table S5.
Description of public datasets analyzed in this manuscript.
| Dataset | Resource | Accession | Figure (s) |
|---|---|---|---|
| mESC scRNA-seq | GEO | GSE75790 | Fig. 2A |
| SIDR scDNA/RNA-seq | ENA | PRJEB20143 | Fig. 2B |
| GTEx | dbGAP | phs000424.v7.p2 | Fig. 4 |
| T lymphocytes scRNA-seq | EGA | EGAS00001002072, EGAS00001002430 | Fig. 6E-G |
| CML scRNA-seq | GEO | GSE76312 | Fig. 7G-L |
| AML scRNA-seq | 10× Genomics | 10× Website (Public) | Fig. 7M |
Only previously aligned and processed data for the AML 10× data was downloaded in the .bam format.
Mitochondrial genotyping
For each sequencing sample, per-base, per-allele counts were determined using a custom Python script that imported aligned .bam files using the pysam module (https://github.com/pysam-developers/pysam). Raw reads were filtered such that they had an alignment quality of 30 and were uniquely mapping to only the mitochondrial genome. The mean base-quality score was computed per-base, per-allele for each sample for quality control. At a given mitochondrial genome position x, the allele frequency (AF) of a base b was computed using the number of reads R supporting that particular base at position x:
where Σb∊{A,C,G,T} Rb is the coverage of a given position x.
Variant quality control and filtering
To remove variants whose inferred heteroplasmy may reflect sequencing errors, we examined the distribution of per-base, per-allele base-quality scores, noting a clear pattern of high quality and low-quality variants (Figure S1C). To determine high quality variants, we fit a mixture of three Gaussian distributions (Figure S1C, labeled by different colors), and filtered such that only alleles that had >99% probability of belonging to the blue (largest mean BQ) Gaussian were retained. This conservative empirical threshold for a BQ cutoff was determined to be 23.8 based on this mixture model approach (Figure S1C, vertical dotted line).
As one poorly quantified position allele would affect the estimates for all other alleles at the specific position, we filtered positions that contained one or more alleles with a BQ less than the empirical threshold unless the allele had a non-significant (i.e., less than 1 in 500) effect on heteroplasmy. In total, we called 44 high-quality variants across our TF1 (sub-)clones (Figure S1D) that were present at a minimum of 2.5% heteroplasmy in at least one sample. Throughout the study, we observed a preponderance of C>T, T>C, G>A, and A>G mutations (transitions), consistent with previous reports (Ju et al., 2014; Ni et al., 2015; Yuan et al., 2017). Of note, we used bulk ATAC-seq to nominate high-quality variants across three other hematopoietic cell lines (GM12878, K562, and Jurkat) and observed 29-64 heteroplasmic mutations per line, suggesting our inferences in Figures 1–3 would generalize to other cell lines.
Mitochondrial distance matrix
As input to the variance components models (Figure 1G), we computed a mitochondrial relatedness matrix Kmito = 1 − D, where D is a symmetric, pairwise distance matrix whose elements encode the distance between pairs of cells or clones based on the differences in their respective allele frequencies. We define D for pairs of observations i,j over high-quality variants x ∊ X using the matrix of allele frequencies (AF) and coverage frequencies (C), such that only variants sufficiently well-covered (minimum # of reads at the position > 100) are included. Explicitly, we define the mitochondrial distance between observations i,j using the distance di,j as follows:
where 1 is the indicator function. Intuitively, this representation of mitochondrial distance simultaneously accounts for variation in rare heteroplasmy (through the square root transformation) and only compares pairs of cells by their high-confidence variants. We note that the square root transformation yields a one-to-one mapping of allele frequencies and provides relative weight to variants whose allele frequencies are very close to zero.
For the bulk ATAC-seq of TF1 (sub-)clones analyzed in Figure 1, all quality-controlled variants passed the coverage requirement; however, the additional indicator functions for coverage were necessary for subsequent single cells experiments.
For the hierarchical clustering of the TF1 lineage cells, we used a modified mitochondrial distance metric computed from the Pearson correlation distance. Intuitively, this metric is less dependent on the absolute values of the variant heteroplasmy. We note that while an ideal tree reconstruction algorithm would facilitate the inclusion of internal nodes, we found no such algorithms readily available, as most tree reconstruction approaches do not allow for internal observations. Further, we did not pursue the development of such approaches here.
Variance components model
To determine the proportion of the variance of chromatin accessibility that could be explained by the mitochondrial lineage in each peak, we performed a variance decomposition using a random effects model (Figure 1H). Briefly, the chromatin accessibility counts measured from ATAC-seq for 91,607 accessibility peaks were summed, centered, and scaled for each sample. We then estimated for each peak the proportion of variance explained due to the random variance component () and due to the variance component from the sample-sample structure inferred by the mitochondrial genotype (), using average information restricted maximum likelihood (AIREML). Explicitly, our model for the variance of chromatin accessibility account for an individual peak is:
and the proportion of the variance explained by the mitochondrial structure then is the ratio of over the total variation:
The proportion of the variance explained by the mtDNA mutation substructure is shown for each peak in Figure S1G alongside an analogous calculation, where the substructure is only defined by a binary indicator of clonal membership for pairs of samples.
Most Common Recent Ancestor (MRCA) analysis
To determine our ability to accurately reconstruct the experimental lineage in Figure 1 by mitochondrial mutations, we determined the proportion of correctly identified Most-Recent Common Ancestors (MRCA) for trios of (sub-)clones, similar to an approach recently reported by Biezuner et al. (Biezuner et al., 2016). For any given set of three samples in the predicted tree (e.g. A, C, and D; in Figure S1E), three possible arrangements are possible: (1) A and C share an MRCA compared to D; (2) C and D share an MRCA compared to A; or (3) A and D share an MRCA compared to C. Given the true experimental lineage tree (in this example, arrangement 2), we determined whether or not our reconstructed lineage correctly identified the MRCA. Thus, by chance, a random tree reconstruction would be 33% accurate. Here, we distinguish comparisons within-clone (e.g., B,C,D in Figure S1E) or between clones (e.g. A,C,D) and demonstrate that our tree reconstruction significantly outperforms what is expected by chance in both settings.
Clonal mixture deconvolution (TF1 clones)
To demonstrate that clonal mixtures can be deconvoluted, we mixed our second-generation clones in known proportions and inferred these proportions from the mitochondrial genotype of the mixture. For two known mixture fractions (Figure S1F), we genotyped each mixed sample with bulk ATAC-seq and then used the second-generation allele frequencies to infer each mixture, by fitting a support vector regression model to estimate the mixing proportions, in a manner analogous to CIBERSORT (Newman et al., 2015). As shown in Figure S1F, the average deviation of the inferred and true mixing proportions are 1.7% and 3.0%, demonstrating that a priori defined genotypes can be used to approximate the contributions of complex mixtures.
Comparison of scRNA-seq methods
To compare mitochondrial coverage with different scRNA-seq methods, we downloaded a dataset of 583 scRNA-seq profiles from mouse embryonic stem cell (mESC) (Ziegenhain et al., 2017). Reads were aligned to the mm10 reference genome using STAR. Per-base pair coverage estimates were computed for each single cell using reads uniquely mapping to the mitochondrial genome.
To verify that heteroplasmic variants were expressed at a comparable frequency as these heteroplasmies in DNA, we downloaded 38 high-quality profiles, where both mitochondrial genome and transcriptome were available (Han et al., 2018). Reads from mtDNA and RNA were aligned as described above to the hg19 reference genome, using Bowtie2 and STAR, respectively, and heteroplasmic allele frequencies were plotted for variants with at least 50 reads covering the locus in both RNA and DNA both with a minimum BQ score of 20 in the same cell.
Comparison of scRNA-Seq, scATAC-Seq and scMito-Seq (TF1 clones)
To compare given single cell profiling methods to the corresponding bulk method or to other single cell and bulk methods, we summed all raw allele counts for high-quality cells (minimum of 100× mitochondrial genome coverage). We performed such comparisons for nine characterized, clone-specific heteroplamsic variants (Figure S2F) and for variants identified as RNA-specific (Figure 2D). We further plotted the allele frequency comparing the two technologies for heteroplasmic variants, revealing concordance across all the technologies (Figure S2E).
Validation of clonal mutations in single cells using lentiviral barcoding
To detect barcodes in TF1 scRNA-seq libraries, we appended a 221 base pair “chromosome” to the standard STAR hg19 reference genome where the 30bp random sequence was soft-masked. Custom Python scripts determined reads uniquely aligning to the lentiviral construct that overlapped the random 30bp barcode. From the 20 mutations nominated in Figure 3C, a cell-cell distance metric was computed from the Pearson correlation of the square root of the heteroplasmy matrix. This metric was similarly used for the MRCA analysis as described for Figure 1. For each pair of cells, we used the group designation from the lentiviral barcode assignment as a binary classifier and the mitochondrial distance metric as a diagnostic metric of cell-cell similarly to compute receiver operating characteristics.
CNV calling for lentivirally barcoded TF1 cells
Copy number variation (CNV) was determined using the InferCNV tool run using the default settings (Patel et al., 2014). We modified the main script to return the cell-cell distance matrix computed before performing the default hierarchical clustering. This cell-cell distance matrix (computed over the CNV bins) was used as input to our MRCA computation.
GTEx analyses
Raw .fastq files were downloaded from dbGAP as noted above for nearly 10,000 samples sequenced on Illumina Hi-Seq with 75bp paired-end reads. We retained 8,820 samples belonging to one of 49 tissues that had at least 25 total samples, from individuals with at least 10 tissues, and with mean mitochondrial genome coverage of 1000×. We define a “tissue specific mutation” (Figures 4D,F,G) for a given mitochondrial variant if the variant is present at least at 3% heteroplasmy (or more where indicated) in an individual tissue but no more than 0.5% (within our margin of error for bulk RNA-seq) in any of the other tissues for a specific donor. We removed mutations that occurred within a given tissue in more than 10 individuals to exclude the possibility of tissue-specific mitochondrial RNA-editing events. While the noise in the RNA-seq assay inherently leads to more false positives and less certainty in the heteroplasmy estimation, our procedure of comparing heteroplamsic values against other tissues within a donor provides a conservative means toward identifying putative somatic mutations that arose during development or homeostasis.
To compute the expected number of pathogenic and damaging mutations (Figures S4E,F), we multiplied the number of loci that were observed above a defined heteroplasmy threshold (e.g., 20%) by the rate at which damaging or pathogenic mutations occur in the mitochondrial genome.
Dimensionality reduction using mRNA expression profiles or mitochondrial genotypes
We performed a t-stochastic neighbor embedding (t-SNE) of the cells by either their expression or mitochondrial genotype profiles (Figures 5 and S5). First, we identified a set of 935 high quality scRNA-seq profiles that (1) have at least 500 genes detected, (2) had a total count of at least 2,000 across expressed genes, and (3) had a mean mitochondrial genome coverage of at least 100×. For dimensionality reduction by expression profiles, we first batch-corrected a log counts-per-million matrix of gene expression values using sva (Leek et al., 2012) and used the top 10 principal components for our t-SNE. For the dimensionality reduction by mitochondrial genotype profiles, we used all variants with a mean BQ score of 25 present at a heteroplasmy of at least 0.5% in our population of cells and similarly computed t-SNE coordinates using the top 10 principal components of the heteroplasmy matrix. We observed no significant batch effect in the mitochondrial allele frequencies.
Supervised identification of colony and cell-specific mutations in hematopoietic cells
To identify mutations that effectively separate individual colonies in donors 1 and 2 (Figures 5 and S5), we searched for mutations present at a minimum of 80% of cells within a colony, at a minimum heteroplasmy of 5%, but are not present at greater than 5% heteroplasmy in more than two cells from all the other colonies together.
To identify mutations that separate individual bulk ATAC colonies (donor 3 and 4), we searched for mutations that were present at a heteroplasmy > 5% in a particular colony but absent (< 0.5% heteroplasmy) in all other colonies.
To identify cell-specific mutations in FACS-sorted HSCs (donors 5, 6, and 7), we searched for mutations that were present at > 5% heteroplasmy for a particular cell, but otherwise absent (< 0.5%) in all other cells for a specific donor.
Separation of clonal mixtures of CD34+ HSPCs
For the analysis of CD34+ HSPCs, we identified variants that had a mean BQ score of at least 20 for both the sum of single cells and the bulk ATAC-seq and were detected in bulk at a heteroplasmy of at least 0.5%. This identified 14 for scRNA- (Figure S6A) and 16 high quality variants for scATAC-seq (Figure S6B).
Using these variants and cells passing filter (minimum average mitochondrial genome coverage of 100×), we performed a fuzzy k-medoids clustering and assigned a cell to a cluster if it had an assignment probability greater than 95% and left it unassigned otherwise. We identified 9 clusters for scATAC-seq and 10 for scRNA-seq that corresponded directly to one or more mutations (Figures 6B,C). While other cells showed evidence of mutations, these occurred at lower heteroplasmy values than the frequencies for cells assigned to the group (Figures S6E,H).
Simulated density of assignment
To verify that our probabilistic cluster was within the range of expectation, we performed a simulation study by parameterizing attributions of our mixing experiment (Figures S6C,D). Specifically, for each of the 30 input CD34+ cells, we simulated a proportion of the specific cell in the final population pi, i ∊ {1,…,30}, using a Beta distribution:
In expectation, the proportion in the terminal cell populations would be 1/30, consistent with the expectation of the draw from the Beta distribution. From this vector of population proportions p, we simulate the number of cells N sampled from our single-cell sampling using a multinomial distribution:
where N = 372 and 148 for the scRNA-Seq and scATAC-Seq, respectively. Thus, ni represents the number of cells that were derived from a single original cell i. Next, we simulated whether cell i contained a mutation that could be detected and clustered in a group of cells (r = 1). This was achieved using a Bernoulli draw for each cell:
where q was estimated to be 0.5 based on our analyses in Figure 5 for scRNA-seq. Finally, the total number of cells clustered (c, the unit shown on Figures S6C,D) is computed from the following:
For both scATAC- and scRNA-seq, we computed c over 10,000 simulations each. Our observed number of cells clustered in Figures 6B,C fell comfortably within the 95% coverage interval for both scATAC- and scRNA-Seq (Figures S6C,D).
Analysis of colorectal cancer data
Bulk ATAC-seq and scRNA-seq libraries were aligned using bowtie2 and STAR as described above. We identified variants that had a mean BQ score of at least 20 for both the sum of single cells and the bulk ATAC-seq and were detected in bulk at a heteroplasmy of at least 0.5%, yielding 12 high-quality variants. Clusters were defined using a similar procedure as described in the previous section. With the exception of 15044 G>A, the highest heteroplasmy in the bulk healthy samples was 0.0009. In total, 12 high-confidence clusters were identified with at least 2 cells. A t-SNE mapping of cells was rendered for the mRNA profiles as described above (Figures 7D-F and S7A-C).
Dimensionality reduction of CML scRNA-seq data
To address spurious variants in scRNA-seq in the absence of a bulk DNA guide (Figure S6G), we hypothesized that using a more stringent measure of quality, base alignment quality (BAQ) (Li, 2011), could facilitate the identification of fewer higher quality variants. Indeed, we identified 242 high-quality variants that had a minimum BAQ score greater than 20 with a mean heteroplasmy of 0.5% in the population of high quality cells (minimum mean mitochondrial genome coverage of 100×).
We performed a tSNE on the first 25 principal components from the z-score normalized heteroplasmy matrix using default parameters (perplexity = 30). We used a Mann-Whitney U-Test to identify variants that co-varied with annotated patient sub-phenotypes at a significance of p < 10−3 within a given donor.
Analysis of CML scRNA-seq data
Clustering of the scRNA-seq data for donor CML656 was performed using SC3 (Kiselev et al., 2017) on processed expression values available through GEO accession GSE76312, with default parameters for clusters of size 2, 3, and 4. The data form the 29 cells in cluster 1 were re-processed using STAR (Dobin et al., 2013) using parameters noted above, followed by differential expression testing using limma-voom (Law et al., 2014). The lowest non-zero allele frequency of 4824 T>C for a cell in cluster 1 was 4%, providing a clear basis for determining cells that were 4824 T>C + (that is, any cell with a non-zero allele frequency for 4824 T>C were considered 4824 T>C +). In total, 14 cells in cluster 1 were negative for the mutation whereas 15 were positive, which served to define categories for differential gene expression within cluster 1 cells.
Analysis of T lymphocyte scRNA-seq data
Raw .fastq files were downloaded from the European Genome-phenome Archive at the accession numbers noted in Table S5. Meta data associated with each cell was further downloaded with the raw sequencing data, and included a definition of clones based on TCR sequences inferred by TRACER (Stubbington et al., 2016). In instances where we observed heterogeneity in mitochondrial mutations within a clonal marker (e.g., Figure 6F), we verified that TCR annotations were supported by > 100 reads as reported in the meta data.
Preprocessing the AML scRNA-Seq dataset
For the AML datasets previously generated by 10× Genomics (Zheng et al., 2017b), cells from two patients (AML027 and AML035) were analyzed for mitochondrial genotypes. Aligned and processed .bam files were downloaded from the 10× website (https://support.10xgenomics.com/single-cell-gene-expression/datasets/) and further processed using custom Python scripts. Cell barcodes associated with at least 200 reads uniquely aligning to the mitochondrial genome were considered for downstream analysis. Barcodes were further filtered by requiring coverage by at least one read at two specific variants at mtDNA positions 3010 and 9698. We note that we did not observe a barcode that contained a read to support both alternate alleles (3010G>A and 9698T>C). We determined that 4 out of 1,077 cells were derived from the recipient (Figure 7M), a higher estimate than in the previously reported analysis performed with nuclear genome variants (reported exactly 0%) (Zheng et al., 2017b), though these four cells were not included in the published analysis as they did not pass the author’s barcode/ transcriptome filters. We did not observe a well-covered set of variants separating the donor/ recipient pair in the AML027 dataset, and did not further analyze it for mutations but only for determining well-covered barcodes (Figures S7G,H).
DATA AND SOFTWARE AVAILABILITY
Accession codes
All sequencing data generated in this work is available on the gene expression omnibus (GEO) accession GSE115218, along with tables that contain variant calls and heteroplasmy estimates for all primary data generated in this study.
Supplementary Material
Figure S1, related to Figure 1. Detection of mitochondrial mutations with ATAC-Seq. (A) Coverage of mitochondrial genome by bulk ATAC-Seq. The mitochondrial genome coverage per million reads (y axis) of each TF1 bulk ATAC-seq sample (x axis), sorted by coverage and colored by parent clone as in Figure 1C. (B) mtDNA mutations are consistently detected across replicate sequencing runs. Heteroplasmy (square root of allele frequency) for each high-confidence mutation (x, y axis) in two technical replicates of the bulk TF1 sample. Pearson correlation coefficient between the replicates is indicated. (C) Gaussian mixture model fit over per-base pair, per-allele base qualities. Shown is the distribution of per-base pair, per-allele base qualities scores (x axis), fit with three Gaussian curves (colors) representing three mixture components: blue: high-confidence variants. Vertical dashed line: threshold for 99% probability of belonging to the distribution of high confidence variants. (D) Left: known lineage of TF1 clones annotated with sample IDs. Right: Hierarchical clustering of bulk TF1 clones by high confidence mtDNA variants. Shown are the samples (columns) labeled by clone (color code as in Figure 1C, sample IDs are annotated at the bottom of the heatmap) and ordered by hierarchical clustering (dendrogram, top) based on the square root of the allele frequency (color bar) of high-confidence variants (rows) identified in (C). Box indicates a subclone-specific mutation as highlighted in Figure 1D (right). The square root transformation shows lower-frequency variants with more intensity. The color bar is shown with a square root transformation that maps to an allele frequency range of 0.0025-0.2. Position of each mutation and the base pair change is shown. (E) Most recent common ancestor (MRCA) analysis to quantify lineage reconstruction accuracy. Schematic showing hypothetical clones where colors represent arbitrary clonal populations. Trios are analyzed to determine the pair that has the MCRA, including between-clone (e.g., A, C, D) and a within-clone (e.g., B, C, D) example. (F) Deconvolution of synthetic samples. For each of two mixture experiments shown are the true proportions (“Experiment”) and inferred proportions (“Inferred”) for each clone in the mixture, as well as the average deviation. (G) Variance component model. Variance explained by the sample structure (y axis, %) for each chromatin accessibility peak (points, rank ordered by variance explained), by the mitochondrial genotypes (red) and the clone ID (black).
Table S1. Associated quality control statistics of TF1 bulk ATAC libraries. Related to Figure 1.
Table S2. Sample-specific attributes of samples analyzed in GTEx data, including proportion of mitochondrial reads. Related to Figure 4.
Table S3. Tissue-specific mutations identified through GTEx analysis. Related to Figure 4.
Table S4. Specification of hematopoietic colony-specific mutations identified by single-cell RNA-seq analysis. Related to Figure 5.
Figure S2, related to Figure 2. Assessment of mitochondrial mutations by single cell genomics. (A,B) Coverage of the mitochondrial genome by six different scRNA-seq methods applied to mESCs. (A) Log2(coverage) along the mm10 mitochondrial genome for each method. Arrows: a gene uniformly covered by full-length scRNA-seq (SMART-seq methods) but showing, as expected, increased coverage of the 3’ end of the transcribed gene in all other methods. (B) Cumulative density plot of the mean base pair coverage for each method. Grey dashed line: median coverage. Bottom arrow: SMART-seq approaches cover 50% of bases at 30x or greater. Top arrow: CEL-seq2 and SCRB-seq cover 3’ transcript ends more deeply. (C) scMito-seq. Mitochondrial sequence specific primers are used for replication of circular mtDNA using the Phi29 polymerase. (D, E) Performance of scATAC-, scRNA-, and scMito-seq. (D) Coverage of the mitochondrial genome per million sequence reads (y axis) for cells (bars) from three primary clones (color as in Figure 1C) in each of the three methods. The median cell coverage per million reads is noted. (E) Allele frequencies as ascertained by the sum of reads from single cells from each method (y axis) compared to bulk ATAC-seq (x axis) for the same three clones as (D). (F) Clones identified by genotype-based clustering across methods. Hierarchical clustering of all TF1 mitochondrial genotyping profiles (columns), including bulk (black) and single cells (grey) from independent single cell assays (purple, yellow, maroon), across the three TF1 clones assayed (red, green, blue as in Figure 1C). Color bar: Heteroplasmy frequency (%).
Figure S3, related to Figure 3. mtDNA based clone assignment of single cells agrees with lentiviral barcode assignment. (A) Lentiviral barcodes. 15 informative lentiviral barcodes (columns) were used to classify 158 cells to 11 barcode clusters (rows) of at least two cells per cluster. Two 30-mer barcodes are highlighted at the bottom with a scheme of the lentiviral construct. Groups g01-04 are cells that contain two distinct barcodes (multiplicity of infection > 1). (B) Low correlation (Spearman ρ = 0.089) between barcode and mitochondrial coverage. Per-cell (dots) mitochondrial coverage (y axis) and lentiviral barcode coverage (x axis). Colors: barcode clones as in in (A). (C, D) Concordance between barcode and mtDNA clones. Receiver operating characteristic (ROC) and precision-recall (PR) curves using the Pearson correlation distance as a metric for pairs of cells sharing barcodes. Area under the ROC (AUROC) and PR (AUPRC) are denoted. (E) The same metrics (MRCA, AUROC, AUPRC) for mitochondrial and CNV-based distance predicting the same barcode identity in this experiment. (F) Visualization of the scRNA-seq data, colored by barcode as in (A), using the UPGMA algorithm.
Figure S4, related to Figure 4. Detection of heteroplasmic mitochondrial mutations across human tissues. (A) Mitochondrial genome coverage for three tissues (additional to those in Figure 4C). Inner circle: mitochondrial genome annotation; middle circular tracks: mean coverage for testis (orange), skeletal muscle (black), and esophagus (purple); outer grey circle: coordinates of the mitochondrial genome. (B) Tissue specific mutations. Beeswarm plot shows the allele frequency (y axis, %) of 372 tissue-specific mutations with a heteroplasmy >10%. Dots: mutation in a tissue from a specific donor. Red: eight mutations with above 75% heteroplasmy. (C-F) Reduced number of protein damaging mutations than expected. (C, D) Empirical distributions of tissue-specific allele frequencies (x axis, %) for variants annotated as (C) proteindamaging (red) or benign (grey) by PolyPhen2, or (D) pathogenic (red) or neutral (grey) from APOGEE. Median heteroplasmy is noted and similar across all annotations (between 4-5%). (E, F) The number of damaging (E) and pathogenic (F) mutations (y axis) expected and observed at the tails of the distributions (>20% heteroplasmy). The number of expected mutations are calculated as the product of the number of mutations and the marginal proportions in each category (STAR Methods). Many of the pathogenic mutations with higher heteroplasmy were found in transformed fibroblasts/ lymphocytes.
Figure S5, related to Figure 5. Mitochondrial mutations in primary hematopoietic cells. (A, B) Cell relations based on expression profiles or mitochondrial genotype. tSNE plots computed on expression profiles (top) and mitochondrial genotypes (bottom) colored by (A) the number of genes detected (min. 5 counts) per cell, related to Figure 5A, or (B) the fold coverage of the mitochondrial genome per cell, related to Figure 5A. (C) Colony-specific mitochondrial mutations for donor 2. Shown are the allele frequencies of mutations (rows) that are found by supervised analysis as specific to the cells (columns) in each colony (sorted by colony membership; colored bar on top). Position of each mutation and the base pair change is shown. Color bar: Heteroplasmy frequency (%). (D) Mixed colonies. Left: Image of colony 105, a mixture of two hematopoietic colonies as confirmed by imaging, gene expression data, and mtDNA genotypes. Right: Scatter plots of the expression levels for a myeloid (MPO, x axis) and erythroid (HBB, y axis) for each cell (dot) in the colony, colored by the allele frequency (color bar) of a heteroplasmic mutation identified only in the myeloid cells. (E) Identification of potential contaminant cell in colony 112 based on expression and mtDNA genotype. Scatter plots as in (D) for the cells in colony 112. Arrow: cell lacking the mitochondrial mutation identified in all other cells of this colony, also lacks HBB expression. (F) Percentage of individual colonies separated based on mitochondrial mutations (y axis) for donor 1 and donor 2 for the scRNA-seq colony experiment in Figures 5H and S5C. (G) Colony-specific mutations for donor 1 and donor 2 identified in Figures 5H and S5C are non-overlapping. (H) Mitochondrial mutations identified through bulk ATAC-seq in primary hematopoietic colonies derived from individual CD34+ HSPCs separate 85% and 100% of those colonies in each of two donors. (I) Sorted phenotypic HSCs (CD34+CD38−CD45RA−CD90+) assayed with scATAC-seq for three additional donors show unique mutations in >75% of cells. (J) Mutations that distinguish individual HSCs are mostly non-overlapping between donors.
Figure S6, related to Figure 6. Mitochondrial mutations identify clonal contributions in polyclonal mixtures of human cells. (A) Allele frequencies for retained mutations agree between scRNA-seq and bulk ATAC-seq. Allele frequencies determined by the sum of single cells from scRNA-seq (y axis) and bulk ATAC-seq (x axis). Black - filtered; red - retained. (B) Concordance of allele frequencies between single cell and bulk ATAC-seq. Variant allele frequencies determined by the sum of single cells from scATAC-seq (y axis) and bulk ATAC-seq (y axis), which were retained for (red) or filtered from (black) further analysis. (C, D) Number of cells classified by clustering by mitochondrial genotypes. Distribution of the number of cells clustered successfully by mitochondrial genotypes across simulations (STAR Methods) using cell input from (C) scRNA-seq (compare to Figure 6B) or (D) scATAC-seq (compare to Figure 6C). Dotted line: observed number of classified cells. (E) Selected cluster-specific mutations (compare to Figure 6B). Box plots show the distribution of heteroplasmy (%, y axis) of 8 selected cluster-specific mutations in individual cells for each of 8 clusters, in the specific cluster for the mutation, and in the cells in all other clusters. Dots: individual cells. Dark bar indicates the median single-cell heteroplasmy. (F, G) Inclusion of scRNA-seq-specific mutations hampers successful clustering of cells. (F) Variant allele frequencies determined by the sum of single cells from scRNA-seq (y axis) and bulk ATAC-seq (x axis). Red: RNA-seq specific mutations retained in the analysis in (G) but not in Figure 6B. (G) Hierarchical clustering of cells from Figure 6B but when also including the RNA-only mutations from (F). Shown are the allele frequencies of retained heteroplasmic mutations (rows) from scRNA-seq across cells (columns), where cells are sorted by unsupervised clustering. The color bar shown above the cells is the classification inferred from Figure 6B, demonstrating the utility of the addition of the bulk sample for high confidence-variant filtering and exclusion of artefactual variants. (H) Cluster specific mutations (compare to Figure 6C). Boxplots for eight selected cluster-specific mutations from each of eight clusters derived from the scATAC-seq experiment. Individual cells are denoted by dots and colored by their cluster membership in the unsupervised analysis. Dots are individual single cells; dark bar represents median heteroplasmy.
Figure S7, related to Figure 7. Application of mitochondrial mutation tracking in human cancer in vivo. (A) tSNE of clones identified from mitochondrial mutations in Figure 7B. The same coordinates are used to show (B) MUC2 expression and (C) SLC26A2 expression. Color bar: log2 counts per million. (D) Separation of donors by mitochondrial genotype does not reflect coverage. tSNE plots of 2,145 single cells from 31 donors computed on mitochondrial genotypes (as in Figure 7G), with each cell colored by total coverage (left) or the proportion of mitochondrial reads mapping to the mitochondrial transcriptome (right). (E, F) Changes in observed allele frequencies at different stage of disease. Box plots show the distribution of allelic frequencies of a specific mutation at different timepoints of disease/sampling as indicated in Figures 7H,I. Dots are individual single cells; dark bar represents median heteroplasmy. (G, H) Reduced mitochondrial coverage by 3’ droplet based scRNA-seq. (G) The mitochondrial transcriptome coverage (y axis) for the top 500 barcodes and cells (dots) from the 10× Chromium Single Cell 3’ scRNA-Seq (left) and SMART-seq2 (right) datasets, respectively. (H) Aggregate mitochondrial transcriptome across cells in the 10X Chromium Single Cell 3’ scRNA-seq dataset. Rounded edges: 3’ ends of transcripts, which are relatively well-covered (compare to Figure 2E). (I) mtDNA transfer. Heteroplasmy in donor cell (x axis) vs. recipient cell (y axis) from simulations assuming different rates (1, 5 and 10%; colored lines) of horizontal mtDNA transfer from donor to recipient cell and fixed mtDNA content per cell. Dashed line: 5% heteroplasmy in the recipient cell. (J) Near homoplasmy mutations. Heatmap of the allele frequency (color bar, %) of each of 164 mitochondrial mutations (rows) with near-homoplasmy in one or more of the 2,145 single cells (columns) from 31 donors, sorted by donor annotations (color code on top, as in Figure 7G).
Somatic mtDNA mutations can track cellular relationships and hierarchies in vitro
Single cell genomic assays faithfully detect mtDNA mutations
Lineage inference can be combined with gene expression or chromatin state profiles
mtDNA mutations enable studies of clonal architecture in human health and disease
Using single cell sequencing technologies, somatic mutations in mitochondrial DNA can be used as natural genetic barcodes to study cellular states and clonal dynamics
Acknowledgements
We thank members of the Regev and Sankaran laboratories for valuable comments and the Broad Institute Flow Cytometry Facility for assistance with cell sorting. We are grateful to Leslie Gaffney for assistance with illustrations. Funding: CAL is supported by F31 CA232670 from the National Institutes of Health (NIH). JCU is supported by 5T32 GM007226-43 from the NIH. JDB received support from the Broad Institute Fellows program and the Allen Institute Distinguished Investigator Award. JHC is supported by 5T32CA207021-03 from the NIH. KP is supported by a research fellowship of the German Research Foundation (DFG). This research was supported by a Broad Institute SPARC grant (AR and VGS), the New York Stem Cell Foundation (NYSCF, VGS), the Howard Hughes Medical Institute (AR), the Klarman Cell Observatory (AR), a gift from Arthur, Sandra, and Sarah Irving (NH), and NIH grants R33 CA202820 (AR), R01 DK103794 (VGS), R33 HL120791 (VGS), and R01 CA208756 (NH). VGS is a NYSCF-Robertson Investigator.
Footnotes
Publisher's Disclaimer: This is a PDF file of an unedited manuscript that has been accepted for publication. As a service to our customers we are providing this early version of the manuscript. The manuscript will undergo copyediting, typesetting, and review of the resulting proof before it is published in its final citable form. Please note that during the production process errors may be discovered which could affect the content, and all legal disclaimers that apply to the journal pertain.
Declaration of Interests
The Broad Institute and Boston Children’s Hospital have filed a patent application for the approach described in this manuscript. L.S.L., C.A.L., J.C.U., J.D.B., A.R., and V.G.S. are listed as inventors for this patent application.
References
- Alemany A, Florescu M, Baron CS, Peterson-Maduro J, and van Oudenaarden A (2018). Whole-organism clone tracing using single-cell sequencing. Nature 556, 108–112. [DOI] [PubMed] [Google Scholar]
- Bar-Yaacov D, Avital G, Levin L, Richards AL, Hachen N, Rebolledo Jaramillo B, Nekrutenko A, Zarivach R, and Mishmar D (2013). RNA-DNA differences in human mitochondria restore ancestral form of 16S ribosomal RNA. Genome Res 23, 1789–1796. [DOI] [PMC free article] [PubMed] [Google Scholar]
- Biasco L, Pellin D, Scala S, Dionisio F, Basso-Ricci L, Leonardelli L, Scaramuzza S, Baricordi C, Ferrua F, Cicalese MP, et al. (2016). In Vivo Tracking of Human Hematopoiesis Reveals Patterns of Clonal Dynamics during Early and Steady-State Reconstitution Phases. Cell Stem Cell 19, 107–119. [DOI] [PMC free article] [PubMed] [Google Scholar]
- Biezuner T, Spiro A, Raz O, Amir S, Milo L, Adar R, Chapal-Ilani N, Berman V, Fried Y, Ainbinder E, et al. (2016). A generic, cost-effective, and scalable cell lineage analysis platform. Genome Res 26, 1588–1599. [DOI] [PMC free article] [PubMed] [Google Scholar]
- Buenrostro JD, Corces MR, Lareau CA, Wu B, Schep AN, Aryee MJ, Majeti R, Chang HY, and Greenleaf WJ (2018). Integrated Single-Cell Analysis Maps the Continuous Regulatory Landscape of Human Hematopoietic Differentiation. Cell 173, 1535–1548 e1516. [DOI] [PMC free article] [PubMed] [Google Scholar]
- Buenrostro JD, Wu B, Litzenburger UM, Ruff D, Gonzales ML, Snyder MP, Chang HY, and Greenleaf WJ (2015). Single-cell chromatin accessibility reveals principles of regulatory variation. Nature 523, 486–490. [DOI] [PMC free article] [PubMed] [Google Scholar]
- Caicedo A, Fritz V, Brondello JM, Ayala M, Dennemont I, Abdellaoui N, de Fraipont F, Moisan A, Prouteau CA, Boukhaddaoui H, et al. (2015). MitoCeption as a new tool to assess the effects of mesenchymal stem/stromal cell mitochondria on cancer cell metabolism and function. Sci Rep 5, 9073. [DOI] [PMC free article] [PubMed] [Google Scholar]
- Chu WK, Edge P, Lee HS, Bansal V, Bafna V, Huang X, and Zhang K (2017). Ultraaccurate genome sequencing and haplotyping of single human cells. Proc Natl Acad Sci U S A. [DOI] [PMC free article] [PubMed] [Google Scholar]
- GTEx Consortium, Aguet F, Brown A, Castel SE, Davis JR, He Y, Jo B, Mohammadi P, Park Y, Parsana P, et al. (2017). Genetic effects on gene expression across human tissues. Nature 550, 204–213. [DOI] [PMC free article] [PubMed] [Google Scholar]
- Corces MR, Trevino AE, Hamilton EG, Greenside PG, Sinnott-Armstrong NA, Vesuna S, Satpathy AT, Rubin AJ, Montine KS, Wu B, et al. (2017). An improved ATAC-seq protocol reduces background and enables interrogation of frozen tissues. Nat Methods 14, 959–962. [DOI] [PMC free article] [PubMed] [Google Scholar]
- Dalerba P, Kalisky T, Sahoo D, Rajendran PS, Rothenberg ME, Leyrat AA, Sim S, Okamoto J, Johnston DM, Qian D, et al. (2011). Single-cell dissection of transcriptional heterogeneity in human colon tumors. Nat Biotechnol 29, 1120–1127. [DOI] [PMC free article] [PubMed] [Google Scholar]
- Dixit A, Parnas O, Li B, Chen J, Fulco CP, Jerby-Arnon L, Marjanovic ND, Dionne D, Burks T, Raychowdhury R, et al. (2016). Perturb-Seq: Dissecting Molecular Circuits with Scalable Single-Cell RNA Profiling of Pooled Genetic Screens. Cell 167, 1853–1866 e1817. [DOI] [PMC free article] [PubMed] [Google Scholar]
- Dobin A, Davis CA, Schlesinger F, Drenkow J, Zaleski C, Jha S, Batut P, Chaisson M, and Gingeras TR (2013). STAR: ultrafast universal RNA-seq aligner. Bioinformatics 29, 15–21. [DOI] [PMC free article] [PubMed] [Google Scholar]
- Elson JL, Samuels DC, Turnbull DM, and Chinnery PF (2001). Random intracellular drift explains the clonal expansion of mitochondrial DNA mutations with age. Am J Hum Genet 68, 802–806. [DOI] [PMC free article] [PubMed] [Google Scholar]
- Filbin MG, Tirosh I, Hovestadt V, Shaw ML, Escalante LE, Mathewson ND, Neftel C, Frank N, Pelton K, Hebert CM, et al. (2018). Developmental and oncogenic programs in H3K27M gliomas dissected by single-cell RNA-seq. Science 360, 331–335. [DOI] [PMC free article] [PubMed] [Google Scholar]
- Gao H, Sun B, Fu H, Chi X, Wang F, Qi X, Hu J, and Shao S (2016). PDIA6 promotes the proliferation of HeLa cells through activating the Wnt/beta-catenin signaling pathway. Oncotarget 7, 53289–53298. [DOI] [PMC free article] [PubMed] [Google Scholar] [Retracted]
- Giladi A, and Amit I (2018). Single-Cell Genomics: A Stepping Stone for Future Immunology Discoveries. Cell 172, 14–21. [DOI] [PubMed] [Google Scholar]
- Giustacchini A, Thongjuea S, Barkas N, Woll PS, Povinelli BJ, Booth CAG, Sopp P, Norfo R, Rodriguez-Meira A, Ashley N, et al. (2017). Single-cell transcriptomics uncovers distinct molecular signatures of stem cells in chronic myeloid leukemia. Nat Med 23, 692–702. [DOI] [PubMed] [Google Scholar]
- Griessinger E, Moschoi R, Biondani G, and Peyron JF (2017). Mitochondrial Transfer in the Leukemia Microenvironment. Trends Cancer 3, 828–839. [DOI] [PubMed] [Google Scholar]
- Guo X, Zhang Y, Zheng L, Zheng C, Song J, Zhang Q, Kang B, Liu Z, Jin L, Xing R, et al. (2018). Global characterization of T cells in non-small-cell lung cancer by single-cell sequencing. Nat Med 24, 978–985. [DOI] [PubMed] [Google Scholar]
- Han KY, Kim KT, Joung JG, Son DS, Kim YJ, Jo A, Jeon HJ, Moon HS, Yoo CE, Chung W, et al. (2018). SIDR: simultaneous isolation and parallel sequencing of genomic DNA and total RNA from single cells. Genome Res 28, 75–87. [DOI] [PMC free article] [PubMed] [Google Scholar]
- Ju YS, Alexandrov LB, Gerstung M, Martincorena I, Nik-Zainal S, Ramakrishna M, Davies HR, Papaemmanuil E, Gundem G, Shlien A, et al. (2014). Origins and functional consequences of somatic mitochondrial DNA mutations in human cancer. Elife 3. [DOI] [PMC free article] [PubMed] [Google Scholar]
- Ju YS, Martincorena I, Gerstung M, Petljak M, Alexandrov LB, Rahbari R, Wedge DC, Davies HR, Ramakrishna M, Fullam A, et al. (2017). Somatic mutations reveal asymmetric cellular dynamics in the early human embryo. Nature 543, 714–718. [DOI] [PMC free article] [PubMed] [Google Scholar]
- Kang E, Wang X, Tippner-Hedges R, Ma H, Folmes CD, Gutierrez NM, Lee Y, Van Dyken C, Ahmed R, Li Y, et al. (2016). Age-Related Accumulation of Somatic Mitochondrial DNA Mutations in Adult-Derived Human iPSCs. Cell Stem Cell 18, 625–636. [DOI] [PubMed] [Google Scholar]
- Kang HM, Subramaniam M, Targ S, Nguyen M, Maliskova L, McCarthy E, Wan E, Wong S, Byrnes L, Lanata CM, et al. (2018). Multiplexed droplet single-cell RNA-sequencing using natural genetic variation. Nat Biotechnol 36, 89–94. [DOI] [PMC free article] [PubMed] [Google Scholar]
- Kester L, and van Oudenaarden A (2018). Single-Cell Transcriptomics Meets Lineage Tracing. Cell Stem Cell. [DOI] [PubMed] [Google Scholar]
- Kiselev VY, Kirschner K, Schaub MT, Andrews T, Yiu A, Chandra T, Natarajan KN, Reik W, Barahona M, Green AR, et al. (2017). SC3: consensus clustering of single-cell RNA-seq data. Nat Methods 14, 483–486. [DOI] [PMC free article] [PubMed] [Google Scholar]
- Langmead B, and Salzberg SL (2012). Fast gapped-read alignment with Bowtie 2. Nat Methods 9, 357–359. [DOI] [PMC free article] [PubMed] [Google Scholar]
- Law CW, Chen Y, Shi W, and Smyth GK (2014). voom: Precision weights unlock linear model analysis tools for RNA-seq read counts. Genome Biol 15, R29. [DOI] [PMC free article] [PubMed] [Google Scholar]
- Leek JT, Johnson WE, Parker HS, Jaffe AE, and Storey JD (2012). The sva package for removing batch effects and other unwanted variation in high-throughput experiments. Bioinformatics 28, 882–883. [DOI] [PMC free article] [PubMed] [Google Scholar]
- Li H (2011). Improving SNP discovery by base alignment quality. Bioinformatics 27, 1157–1158. [DOI] [PMC free article] [PubMed] [Google Scholar]
- Li M, Schroder R, Ni S, Madea B, and Stoneking M (2015). Extensive tissue-related and allele-related mtDNA heteroplasmy suggests positive selection for somatic mutations. Proc Natl Acad Sci U S A 112, 2491–2496. [DOI] [PMC free article] [PubMed] [Google Scholar]
- Li R, Montpetit A, Rousseau M, Wu SY, Greenwood CM, Spector TD, Pollak M, Polychronakos C, and Richards JB (2014). Somatic point mutations occurring early in development: a monozygotic twin study. J Med Genet 51, 28–34. [DOI] [PubMed] [Google Scholar]
- Lodato MA, Woodworth MB, Lee S, Evrony GD, Mehta BK, Karger A, Lee S, Chittenden TW, D’Gama AM, Cai X, et al. (2015). Somatic mutation in single human neurons tracks developmental and transcriptional history. Science 350, 94–98. [DOI] [PMC free article] [PubMed] [Google Scholar]
- Macaulay IC, Haerty W, Kumar P, Li YI, Hu TX, Teng MJ, Goolam M, Saurat N, Coupland P, Shirley LM, et al. (2015). G&T-seq: parallel sequencing of single-cell genomes and transcriptomes. Nat Methods 12, 519–522. [DOI] [PubMed] [Google Scholar]
- Marlein CR, Zaitseva L, Piddock RE, Robinson SD, Edwards DR, Shafat MS, Zhou Z, Lawes M, Bowles KM, and Rushworth SA (2017). NADPH oxidase-2 derived superoxide drives mitochondrial transfer from bone marrow stromal cells to leukemic blasts. Blood 130, 1649–1660. [DOI] [PubMed] [Google Scholar]
- McKenna A, Findlay GM, Gagnon JA, Horwitz MS, Schier AF, and Shendure J (2016). Whole-organism lineage tracing by combinatorial and cumulative genome editing. Science 353, aaf7907. [DOI] [PMC free article] [PubMed] [Google Scholar]
- Montoro DT, Haber AL, Biton M, Vinarsky V, Lin B, Birket SE, Yuan F, Chen S, Leung HM, Villoria J, et al. (2018). A revised airway epithelial hierarchy includes CFTR-expressing ionocytes. Nature 560, 319–324. [DOI] [PMC free article] [PubMed] [Google Scholar]
- Moschoi R, Imbert V, Nebout M, Chiche J, Mary D, Prebet T, Saland E, Castellano R, Pouyet L, Collette Y, et al. (2016). Protective mitochondrial transfer from bone marrow stromal cells to acute myeloid leukemic cells during chemotherapy. Blood 128, 253–264. [DOI] [PubMed] [Google Scholar]
- Newman AM, Liu CL, Green MR, Gentles AJ, Feng W, Xu Y, Hoang CD, Diehn M, and Alizadeh AA (2015). Robust enumeration of cell subsets from tissue expression profiles. Nat Methods 12, 453–457. [DOI] [PMC free article] [PubMed] [Google Scholar]
- Ni T, Wei G, Shen T, Han M, Lian Y, Fu H, Luo Y, Yang Y, Liu J, Wakabayashi Y, et al. (2015). MitoRCA-seq reveals unbalanced cytocine to thymine transition in Polg mutant mice. Sci Rep 5, 12049. [DOI] [PMC free article] [PubMed] [Google Scholar]
- Patel AP, Tirosh I, Trombetta JJ, Shalek AK, Gillespie SM, Wakimoto H, Cahill DP, Nahed BV, Curry WT, Martuza RL, et al. (2014). Single-cell RNA-seq highlights intratumoral heterogeneity in primary glioblastoma. Science 344, 1396–1401. [DOI] [PMC free article] [PubMed] [Google Scholar]
- Pei W, Feyerabend TB, Rossler J, Wang X, Postrach D, Busch K, Rode I, Klapproth K, Dietlein N, Quedenau C, et al. (2017). Polylox barcoding reveals haematopoietic stem cell fates realized in vivo. Nature 548, 456–460. [DOI] [PMC free article] [PubMed] [Google Scholar]
- Picelli S, Faridani OR, Bjorklund AK, Winberg G, Sagasser S, and Sandberg R (2014). Full-length RNA-seq from single cells using Smart-seq2. Nat Protoc 9, 171–181. [DOI] [PubMed] [Google Scholar]
- Raj B, Wagner DE, McKenna A, Pandey S, Klein AM, Shendure J, Gagnon JA, and Schier AF (2018). Simultaneous single-cell profiling of lineages and cell types in the vertebrate brain. Nat Biotechnol 36, 442–450. [DOI] [PMC free article] [PubMed] [Google Scholar]
- Regev A, Teichmann SA, Lander ES, Amit I, Benoist C, Birney E, Bodenmiller B, Campbell P, Carninci P, Clatworthy M, et al. (2017). The Human Cell Atlas. Elife 6. [DOI] [PMC free article] [PubMed] [Google Scholar]
- Spanjaard B, Hu B, Mitic N, Olivares-Chauvet P, Janjuha S, Ninov N, and Junker JP (2018). Simultaneous lineage tracing and cell-type identification using CRISPR-Cas9-induced genetic scars. Nat Biotechnol 36, 469–473. [DOI] [PMC free article] [PubMed] [Google Scholar]
- Stewart JB, and Chinnery PF (2015). The dynamics of mitochondrial DNA heteroplasmy: implications for human health and disease. Nat Rev Genet 16, 530–542. [DOI] [PubMed] [Google Scholar]
- Stubbington MJT, Lonnberg T, Proserpio V, Clare S, Speak AO, Dougan G, and Teichmann SA (2016). T cell fate and clonality inference from single-cell transcriptomes. Nat Methods 13, 329–332. [DOI] [PMC free article] [PubMed] [Google Scholar]
- Sun J, Ramos A, Chapman B, Johnnidis JB, Le L, Ho YJ, Klein A, Hofmann O, and Camargo FD (2014). Clonal dynamics of native haematopoiesis. Nature 514, 322–327. [DOI] [PMC free article] [PubMed] [Google Scholar]
- Tao L, Raz O, Marx Z, Biezuner T, Amir S, and Milo L (2017). A duplex MIPs-based biological-computational cell lineage discovery platform. BioRxiv. [Google Scholar]
- Taylor RW, Barron MJ, Borthwick GM, Gospel A, Chinnery PF, Samuels DC, Taylor GA, Plusa SM, Needham SJ, Greaves LC, et al. (2003). Mitochondrial DNA mutations in human colonic crypt stem cells. J Clin Invest 112, 1351–1360. [DOI] [PMC free article] [PubMed] [Google Scholar]
- Teixeira VH, Nadarajan P, Graham TA, Pipinikas CP, Brown JM, Falzon M, Nye E, Poulsom R, Lawrence D, Wright NA, et al. (2013). Stochastic homeostasis in human airway epithelium is achieved by neutral competition of basal cell progenitors. Elife 2, e00966. [DOI] [PMC free article] [PubMed] [Google Scholar]
- Torralba D, Baixauli F, and Sanchez-Madrid F (2016). Mitochondria Know No Boundaries: Mechanisms and Functions of Intercellular Mitochondrial Transfer. Front Cell Dev Biol 4, 107. [DOI] [PMC free article] [PubMed] [Google Scholar]
- Venteicher AS, Tirosh I, Hebert C, Yizhak K, Neftel C, Filbin MG, Hovestadt V, Escalante LE, Shaw ML, Rodman C, et al. (2017). Decoupling genetics, lineages, and microenvironment in IDH-mutant gliomas by single-cell RNA-seq. Science 355. [DOI] [PMC free article] [PubMed] [Google Scholar]
- Villani AC, Satija R, Reynolds G, Sarkizova S, Shekhar K, Fletcher J, Griesbeck M, Butler A, Zheng S, Lazo S, et al. (2017). Single-cell RNA-seq reveals new types of human blood dendritic cells, monocytes, and progenitors. Science 356. [DOI] [PMC free article] [PubMed] [Google Scholar]
- Wallace DC, and Chalkia D (2013). Mitochondrial DNA genetics and the heteroplasmy conundrum in evolution and disease. Cold Spring Harb Perspect Biol 5, a021220. [DOI] [PMC free article] [PubMed] [Google Scholar]
- Woodworth MB, Girskis KM, and Walsh CA (2017). Building a lineage from single cells: genetic techniques for cell lineage tracking. Nat Rev Genet 18, 230–244. [DOI] [PMC free article] [PubMed] [Google Scholar]
- Ye K, Lu J, Ma F, Keinan A, and Gu Z (2014). Extensive pathogenicity of mitochondrial heteroplasmy in healthy human individuals. Proc Natl Acad Sci U S A 111, 10654–10659. [DOI] [PMC free article] [PubMed] [Google Scholar]
- Yu VW, Yusuf RZ, Oki T, Wu J, Saez B, Wang X, Cook C, Baryawno N, Ziller MJ, Lee E, et al. (2016). Epigenetic Memory Underlies Cell-Autonomous Heterogeneous Behavior of Hematopoietic Stem Cells. Cell 167, 1310–1322 e1317. [DOI] [PubMed] [Google Scholar]
- Yuan Y, Ju SJ, Kim Y, Li J, Wang Y, Yang Y, Martincorena I, Creighton CJ, Weinstein JN, Xu Y, et al. (2017). Comprehensive Molecular Characterization of Mitochondrial Genomes in Human Cancers. BioRxiv. [Google Scholar]
- Zafar H, Tzen A, Navin N, Chen K, and Nakhleh L (2017). SiFit: inferring tumor trees from single-cell sequencing data under finite-sites models. Genome Biol 18, 178. [DOI] [PMC free article] [PubMed] [Google Scholar]
- Zemmour D, Zilionis R, Kiner E, Klein AM, Mathis D, and Benoist C (2018). Single-cell gene expression reveals a landscape of regulatory T cell phenotypes shaped by the TCR. Nat Immunol 19, 291–301. [DOI] [PMC free article] [PubMed] [Google Scholar]
- Zheng C, Zheng L, Yoo JK, Guo H, Zhang Y, Guo X, Kang B, Hu R, Huang JY, Zhang Q, et al. (2017a). Landscape of Infiltrating T Cells in Liver Cancer Revealed by Single-Cell Sequencing. Cell 169, 1342–1356 e1316. [DOI] [PubMed] [Google Scholar]
- Zheng GX, Terry JM, Belgrader P, Ryvkin P, Bent ZW, Wilson R, Ziraldo SB, Wheeler TD, McDermott GP, Zhu J, et al. (2017b). Massively parallel digital transcriptional profiling of single cells. Nat Commun 8, 14049. [DOI] [PMC free article] [PubMed] [Google Scholar]
- Ziegenhain C, Vieth B, Parekh S, Reinius B, Guillaumet-Adkins A, Smets M, Leonhardt H, Heyn H, Hellmann I, and Enard W (2017). Comparative Analysis of Single-Cell RNA Sequencing Methods. Mol Cell 65, 631–643 e634. [DOI] [PubMed] [Google Scholar]
Associated Data
This section collects any data citations, data availability statements, or supplementary materials included in this article.
Supplementary Materials
Figure S1, related to Figure 1. Detection of mitochondrial mutations with ATAC-Seq. (A) Coverage of mitochondrial genome by bulk ATAC-Seq. The mitochondrial genome coverage per million reads (y axis) of each TF1 bulk ATAC-seq sample (x axis), sorted by coverage and colored by parent clone as in Figure 1C. (B) mtDNA mutations are consistently detected across replicate sequencing runs. Heteroplasmy (square root of allele frequency) for each high-confidence mutation (x, y axis) in two technical replicates of the bulk TF1 sample. Pearson correlation coefficient between the replicates is indicated. (C) Gaussian mixture model fit over per-base pair, per-allele base qualities. Shown is the distribution of per-base pair, per-allele base qualities scores (x axis), fit with three Gaussian curves (colors) representing three mixture components: blue: high-confidence variants. Vertical dashed line: threshold for 99% probability of belonging to the distribution of high confidence variants. (D) Left: known lineage of TF1 clones annotated with sample IDs. Right: Hierarchical clustering of bulk TF1 clones by high confidence mtDNA variants. Shown are the samples (columns) labeled by clone (color code as in Figure 1C, sample IDs are annotated at the bottom of the heatmap) and ordered by hierarchical clustering (dendrogram, top) based on the square root of the allele frequency (color bar) of high-confidence variants (rows) identified in (C). Box indicates a subclone-specific mutation as highlighted in Figure 1D (right). The square root transformation shows lower-frequency variants with more intensity. The color bar is shown with a square root transformation that maps to an allele frequency range of 0.0025-0.2. Position of each mutation and the base pair change is shown. (E) Most recent common ancestor (MRCA) analysis to quantify lineage reconstruction accuracy. Schematic showing hypothetical clones where colors represent arbitrary clonal populations. Trios are analyzed to determine the pair that has the MCRA, including between-clone (e.g., A, C, D) and a within-clone (e.g., B, C, D) example. (F) Deconvolution of synthetic samples. For each of two mixture experiments shown are the true proportions (“Experiment”) and inferred proportions (“Inferred”) for each clone in the mixture, as well as the average deviation. (G) Variance component model. Variance explained by the sample structure (y axis, %) for each chromatin accessibility peak (points, rank ordered by variance explained), by the mitochondrial genotypes (red) and the clone ID (black).
Table S1. Associated quality control statistics of TF1 bulk ATAC libraries. Related to Figure 1.
Table S2. Sample-specific attributes of samples analyzed in GTEx data, including proportion of mitochondrial reads. Related to Figure 4.
Table S3. Tissue-specific mutations identified through GTEx analysis. Related to Figure 4.
Table S4. Specification of hematopoietic colony-specific mutations identified by single-cell RNA-seq analysis. Related to Figure 5.
Figure S2, related to Figure 2. Assessment of mitochondrial mutations by single cell genomics. (A,B) Coverage of the mitochondrial genome by six different scRNA-seq methods applied to mESCs. (A) Log2(coverage) along the mm10 mitochondrial genome for each method. Arrows: a gene uniformly covered by full-length scRNA-seq (SMART-seq methods) but showing, as expected, increased coverage of the 3’ end of the transcribed gene in all other methods. (B) Cumulative density plot of the mean base pair coverage for each method. Grey dashed line: median coverage. Bottom arrow: SMART-seq approaches cover 50% of bases at 30x or greater. Top arrow: CEL-seq2 and SCRB-seq cover 3’ transcript ends more deeply. (C) scMito-seq. Mitochondrial sequence specific primers are used for replication of circular mtDNA using the Phi29 polymerase. (D, E) Performance of scATAC-, scRNA-, and scMito-seq. (D) Coverage of the mitochondrial genome per million sequence reads (y axis) for cells (bars) from three primary clones (color as in Figure 1C) in each of the three methods. The median cell coverage per million reads is noted. (E) Allele frequencies as ascertained by the sum of reads from single cells from each method (y axis) compared to bulk ATAC-seq (x axis) for the same three clones as (D). (F) Clones identified by genotype-based clustering across methods. Hierarchical clustering of all TF1 mitochondrial genotyping profiles (columns), including bulk (black) and single cells (grey) from independent single cell assays (purple, yellow, maroon), across the three TF1 clones assayed (red, green, blue as in Figure 1C). Color bar: Heteroplasmy frequency (%).
Figure S3, related to Figure 3. mtDNA based clone assignment of single cells agrees with lentiviral barcode assignment. (A) Lentiviral barcodes. 15 informative lentiviral barcodes (columns) were used to classify 158 cells to 11 barcode clusters (rows) of at least two cells per cluster. Two 30-mer barcodes are highlighted at the bottom with a scheme of the lentiviral construct. Groups g01-04 are cells that contain two distinct barcodes (multiplicity of infection > 1). (B) Low correlation (Spearman ρ = 0.089) between barcode and mitochondrial coverage. Per-cell (dots) mitochondrial coverage (y axis) and lentiviral barcode coverage (x axis). Colors: barcode clones as in in (A). (C, D) Concordance between barcode and mtDNA clones. Receiver operating characteristic (ROC) and precision-recall (PR) curves using the Pearson correlation distance as a metric for pairs of cells sharing barcodes. Area under the ROC (AUROC) and PR (AUPRC) are denoted. (E) The same metrics (MRCA, AUROC, AUPRC) for mitochondrial and CNV-based distance predicting the same barcode identity in this experiment. (F) Visualization of the scRNA-seq data, colored by barcode as in (A), using the UPGMA algorithm.
Figure S4, related to Figure 4. Detection of heteroplasmic mitochondrial mutations across human tissues. (A) Mitochondrial genome coverage for three tissues (additional to those in Figure 4C). Inner circle: mitochondrial genome annotation; middle circular tracks: mean coverage for testis (orange), skeletal muscle (black), and esophagus (purple); outer grey circle: coordinates of the mitochondrial genome. (B) Tissue specific mutations. Beeswarm plot shows the allele frequency (y axis, %) of 372 tissue-specific mutations with a heteroplasmy >10%. Dots: mutation in a tissue from a specific donor. Red: eight mutations with above 75% heteroplasmy. (C-F) Reduced number of protein damaging mutations than expected. (C, D) Empirical distributions of tissue-specific allele frequencies (x axis, %) for variants annotated as (C) proteindamaging (red) or benign (grey) by PolyPhen2, or (D) pathogenic (red) or neutral (grey) from APOGEE. Median heteroplasmy is noted and similar across all annotations (between 4-5%). (E, F) The number of damaging (E) and pathogenic (F) mutations (y axis) expected and observed at the tails of the distributions (>20% heteroplasmy). The number of expected mutations are calculated as the product of the number of mutations and the marginal proportions in each category (STAR Methods). Many of the pathogenic mutations with higher heteroplasmy were found in transformed fibroblasts/ lymphocytes.
Figure S5, related to Figure 5. Mitochondrial mutations in primary hematopoietic cells. (A, B) Cell relations based on expression profiles or mitochondrial genotype. tSNE plots computed on expression profiles (top) and mitochondrial genotypes (bottom) colored by (A) the number of genes detected (min. 5 counts) per cell, related to Figure 5A, or (B) the fold coverage of the mitochondrial genome per cell, related to Figure 5A. (C) Colony-specific mitochondrial mutations for donor 2. Shown are the allele frequencies of mutations (rows) that are found by supervised analysis as specific to the cells (columns) in each colony (sorted by colony membership; colored bar on top). Position of each mutation and the base pair change is shown. Color bar: Heteroplasmy frequency (%). (D) Mixed colonies. Left: Image of colony 105, a mixture of two hematopoietic colonies as confirmed by imaging, gene expression data, and mtDNA genotypes. Right: Scatter plots of the expression levels for a myeloid (MPO, x axis) and erythroid (HBB, y axis) for each cell (dot) in the colony, colored by the allele frequency (color bar) of a heteroplasmic mutation identified only in the myeloid cells. (E) Identification of potential contaminant cell in colony 112 based on expression and mtDNA genotype. Scatter plots as in (D) for the cells in colony 112. Arrow: cell lacking the mitochondrial mutation identified in all other cells of this colony, also lacks HBB expression. (F) Percentage of individual colonies separated based on mitochondrial mutations (y axis) for donor 1 and donor 2 for the scRNA-seq colony experiment in Figures 5H and S5C. (G) Colony-specific mutations for donor 1 and donor 2 identified in Figures 5H and S5C are non-overlapping. (H) Mitochondrial mutations identified through bulk ATAC-seq in primary hematopoietic colonies derived from individual CD34+ HSPCs separate 85% and 100% of those colonies in each of two donors. (I) Sorted phenotypic HSCs (CD34+CD38−CD45RA−CD90+) assayed with scATAC-seq for three additional donors show unique mutations in >75% of cells. (J) Mutations that distinguish individual HSCs are mostly non-overlapping between donors.
Figure S6, related to Figure 6. Mitochondrial mutations identify clonal contributions in polyclonal mixtures of human cells. (A) Allele frequencies for retained mutations agree between scRNA-seq and bulk ATAC-seq. Allele frequencies determined by the sum of single cells from scRNA-seq (y axis) and bulk ATAC-seq (x axis). Black - filtered; red - retained. (B) Concordance of allele frequencies between single cell and bulk ATAC-seq. Variant allele frequencies determined by the sum of single cells from scATAC-seq (y axis) and bulk ATAC-seq (y axis), which were retained for (red) or filtered from (black) further analysis. (C, D) Number of cells classified by clustering by mitochondrial genotypes. Distribution of the number of cells clustered successfully by mitochondrial genotypes across simulations (STAR Methods) using cell input from (C) scRNA-seq (compare to Figure 6B) or (D) scATAC-seq (compare to Figure 6C). Dotted line: observed number of classified cells. (E) Selected cluster-specific mutations (compare to Figure 6B). Box plots show the distribution of heteroplasmy (%, y axis) of 8 selected cluster-specific mutations in individual cells for each of 8 clusters, in the specific cluster for the mutation, and in the cells in all other clusters. Dots: individual cells. Dark bar indicates the median single-cell heteroplasmy. (F, G) Inclusion of scRNA-seq-specific mutations hampers successful clustering of cells. (F) Variant allele frequencies determined by the sum of single cells from scRNA-seq (y axis) and bulk ATAC-seq (x axis). Red: RNA-seq specific mutations retained in the analysis in (G) but not in Figure 6B. (G) Hierarchical clustering of cells from Figure 6B but when also including the RNA-only mutations from (F). Shown are the allele frequencies of retained heteroplasmic mutations (rows) from scRNA-seq across cells (columns), where cells are sorted by unsupervised clustering. The color bar shown above the cells is the classification inferred from Figure 6B, demonstrating the utility of the addition of the bulk sample for high confidence-variant filtering and exclusion of artefactual variants. (H) Cluster specific mutations (compare to Figure 6C). Boxplots for eight selected cluster-specific mutations from each of eight clusters derived from the scATAC-seq experiment. Individual cells are denoted by dots and colored by their cluster membership in the unsupervised analysis. Dots are individual single cells; dark bar represents median heteroplasmy.
Figure S7, related to Figure 7. Application of mitochondrial mutation tracking in human cancer in vivo. (A) tSNE of clones identified from mitochondrial mutations in Figure 7B. The same coordinates are used to show (B) MUC2 expression and (C) SLC26A2 expression. Color bar: log2 counts per million. (D) Separation of donors by mitochondrial genotype does not reflect coverage. tSNE plots of 2,145 single cells from 31 donors computed on mitochondrial genotypes (as in Figure 7G), with each cell colored by total coverage (left) or the proportion of mitochondrial reads mapping to the mitochondrial transcriptome (right). (E, F) Changes in observed allele frequencies at different stage of disease. Box plots show the distribution of allelic frequencies of a specific mutation at different timepoints of disease/sampling as indicated in Figures 7H,I. Dots are individual single cells; dark bar represents median heteroplasmy. (G, H) Reduced mitochondrial coverage by 3’ droplet based scRNA-seq. (G) The mitochondrial transcriptome coverage (y axis) for the top 500 barcodes and cells (dots) from the 10× Chromium Single Cell 3’ scRNA-Seq (left) and SMART-seq2 (right) datasets, respectively. (H) Aggregate mitochondrial transcriptome across cells in the 10X Chromium Single Cell 3’ scRNA-seq dataset. Rounded edges: 3’ ends of transcripts, which are relatively well-covered (compare to Figure 2E). (I) mtDNA transfer. Heteroplasmy in donor cell (x axis) vs. recipient cell (y axis) from simulations assuming different rates (1, 5 and 10%; colored lines) of horizontal mtDNA transfer from donor to recipient cell and fixed mtDNA content per cell. Dashed line: 5% heteroplasmy in the recipient cell. (J) Near homoplasmy mutations. Heatmap of the allele frequency (color bar, %) of each of 164 mitochondrial mutations (rows) with near-homoplasmy in one or more of the 2,145 single cells (columns) from 31 donors, sorted by donor annotations (color code on top, as in Figure 7G).
Data Availability Statement
Accession codes
All sequencing data generated in this work is available on the gene expression omnibus (GEO) accession GSE115218, along with tables that contain variant calls and heteroplasmy estimates for all primary data generated in this study.