Abstract
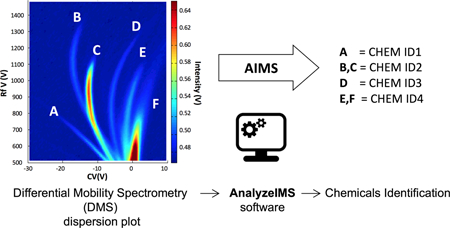
Differential mobility spectrometry (DMS) based detectors require rapid data analysis capabilities, embedded into the devices to achieve the optimum detection capabiites as portable trace chemical detectors. Automated algorithm-based DMS dispersion plot data analysis method was applied for the first time to pre-process and separate 3-dimentional (3-D) DMS dispersion data. We previously demonstrated our AnalyzeIMS (AIMS) software was capable of analyzing complex gas chromatography differential mobility spectrometry (GC-DMS) data sets. In our present work, the AIMS software was able to easliy separate DMS dispersion data sets of five chemicals that are important in detection of volatile organic compounds (VOCs): 2-butanone, 2-propanone, ethyl acetate, methanol and ethanol. Identification of chemicals from mixtures, separation of chemicals from a mixture and prediction capability of the software were all tested. These automated algorithms may have potential applications in separation of chemicals (or ion peaks) from other 3-D data obtained by hybrid analytical devices such as mass spectrometry (MS). New algorithm developments are included as future considerations to improve the current numerical approaches to fingerprint chemicals (ions) from a significantly complicated dispersion plot. Comprehensive peak identifcation by DMS-MS, variations of the DMS data due to chemical concentration, gas phase ion chemistry, temperature and pressure of the drift gas are considered in future algorithm improvements.
Graphical Abstract
1. Introduction
Early detection of trace levels of airborne chemicals from explosives and narcotics is vital to avoid security related threats and drug trafficking (1–4). In such situations, fast detection of gas phase chemicals at ambient pressure by an uncomplicated handheld device such as an ion mobility spectrometer is favoured over advanced analytical techniques such as gas chromatography (GC) and mass spectrometry (MS) (5). Ion mobility spectrometry (IMS) characterizes ions based on the mobility of ions in a collision gas environment under low electric fields. Plotting the ion current intensity against the drift times of the ions generates an ion mobility spectrum. The ion peaks in an ion mobility spectrum indicate the size, ion velocity (Vd, dependent on the ion size) and the quantity of the ions that have sufficient ion lifetimes in the applied electric field (E) to reach the detector. In the drift region of an ion mobility spectrometer, the ion mobilities are subject to variables such as temperature (T) and pressure (P) of the drift gas. The chemical identity of such ions can be obtained by the mobility coefficient (K) and the reduced mobility coefficient, as shown by the equations 1 and 2. In IMS, either positive or negative ions can be only characterized at a time as it depends on the pre-set polarity of the mobility spectrometer (3).
| (1) |
| (2) |
Differential mobility spectrometry (DMS) is a variation of IMS, where ions are characterized while drifting between two planer electrodes that establish an asymmetric waveform with electric fields reaching ~30 kV/cm at MHz frequency (6, 7). The ions are differentiated by the differences of the ion mobility coefficients (ΔK) in the low and high electric fields. DMS devices can be miniaturized easily due to the less complicated design structure without ion shutters, and notably ions of both polarities can be detected simultaneously (7, 8). DMS has additional advantages compared to IMS as DMS can scan both the compensation voltage (CV) and radio Frequency (RF) voltage simultaneously to filter ions that are being passed through the drift region (6–8). At high electric fields within the DMS, ion mobility coefficients depend on the ratio of the electric field (E) to the number density (N) of the gas: E/N. The ion mobility dependence in such electric fields is defined by equation 3, where K(0) is the mobility coefficient at low electric fields and α(E/N) is called as α function and that is denoted by α2(E/N)2 + α4(E/N)4…. αn(E/N)n. This α function is unique for each ion in a DMS spectrum and may be used to identify ions (7, 8).
| (3) |
Analytical techniques such as GC and MS have accepted data analysis methodologies that were developed based on the sample separation principles. For example, the retention time of a chemical in a column in GC and the mass (m) to charge (z) ratio of the ions (m/z) in MS are used in these automated data analysis procedures. These techniques have developed over time such that every commercial instrument version emerges to the market with their own advanced algorithm approach and specific software coded to analyse its data. However, ion mobility measurement-based data analysis approaches are not widely available to the users on such a scale. Even if such algorithms and automation exists, the public use is limited, either due to the limited capabilities of a vendor’s software or due to the restricted access of such software by the nature of the device usages, such as military and defence applications. IMS analyses are usually performed manually calculating the Ko values (or the drift times of the ions) to visualize ions, and usually it is not rigorous due to the less complicated mobility spectra.
However, data generated from DMS instruments are more complicated, specifically when complex sample matrixes are analysed (i.e. biological samples). In such situations, differential mobility spectrometers are often presented operating as hybrid systems by attaching to another analytical technique, i.e. GC-DMS to get the advantage of GC sample pre-separation. Even though sample pre-separation is beneficial, the rich and complex 3-dimensional data generated by GC-DMS challenge the users in manual data analysis and chemical identifications. These data analysis are mainly performed using different algorithms approaches (9–11) and more details of such approaches are discussed in a previous overview (12). When DMS is used as a GC-DMS or LC-DMS, its rapid detection capabilities are impeded due to the time consuming chromatographic separations at the front end of the device. Operating the DMS device alone with simultaneous scanning of CV and RF voltage will minimize the experimental time by allowing the DMS to do both chemical separation and detection concurrently. This dual RF voltage and CV scanning allows DMS to generate 3-dimensional data called “dispersion plots” that contain valuable analytical information about chemicals. Dispersion plots can be analysed as fingerprints for the ion(s) generated from a sample. However, visual identification of ions and mathematical approaches (calculation of α functions) to analyse these dispersion plots are inconvenient and time consuming when the number of samples are high or the sample matrixes are complicated such as biological samples.
Therefore, it is important to implement a method of real-time automated DMS dispersion plot data analysis capability to these detectors to get rapid results with high accuracy. Many variables have to be taken into account to develop this capability, such as: sample concentration, temperature, pressure, humidity of the drift gas, and proton and electron affinities of the sample-ions. Such algorithm and software development is not an easy task as the image of a dispersion plot may vary by complications of gas phase ion chemistry in air at ambient pressure. However, initial algorithm development can be achieved by keeping most of the above-mentioned variables constant.
This manuscript focuses on the initial application of a first software/algorithm-based approach to differentiate chemical responses from a DMS dispersion plot. This preliminary study suggests future directions to create fully capable software that can do both qualitative and quantitative analyses for instruments – regardless of vendor.
2. Experimental
2.1. Sample preparation
Desired volumes of 2-butanone, 2-propanone, ethanol, methanol and ethyl acetate (Sigma Aldrich, St Louis, MO) were individually sampled into 3 L sample bags (SKC Tedlar® Sample bag, SKC Inc., PA.) and each sample bag was maintained for 10 minutes at room temperature for the sample to equilibrate into gas phase to achieve the stock concentrations (1000 ppm). Ultra-pure nitrogen (Air gas, Radnor, PA) was used as the dilution gas with water content in ultra pure N2 around 1 ppm. Serial dilution was performed from the stock concentration and sampled into another sample bag to achieve 100 ppm. Each gas phase chemical was sampled into a gas tight 1 μL glass syringe (Hamilton Co., Reno, NV) from the stock concentration (100 ppm) and introduced separately into the inlet of the differential mobility spectrometer using a syringe pump with a dilution nitrogen gas flow to achieve the final concentration of 500 ppb.
2.2. Instrumentation
The differential mobility spectrometer used in this study is a MicroAnalyser (Sionex Corp., Bedford, MA) with a 5 mCi, Ni-63 ionization source. The drift cell was operated at 80 °C carrier gas temperature. Ultra-pure nitrogen with humidity around 1 ppm (Air gas, Radnor, PA) was used as the carrier gas (300 mL/min) and sample gas (20 mL/min). DMS dispersion plots were recorded at 500 ppb concentration of each sample by scanning the compensation voltage (CV) from −10 to +30 V range (step size = 100, step duration = 10 ms, step settle time = 3 ms) and scanning the RF voltage from 500 to 1490 V at 10 V increments (RF voltage steps = 100). Each sample type was repeatedly recorded 30 times to verify the reproducibility. Drift cell was heated at 100 °C overnight to avoid retention effects of chemicals between different sample injections. Sample lines were purged with ultra-pure nitrogen during this cleaning cycle and background reactant ion peak (RIP) dispersion data were recorded prior each sample injection to avoid memory effects. Only positive polarity DMS dispersion data were used in this particular study, although the approaches can easily be adapted to the negative spectra as well.
2.3. Data analysis
All DMS data visualization and data analysis were performed with AnalyzeIMS (AIMS) software, Version 1.28 (12). This software operates through MatLab R2014a (Mathworks, Torrence, CA) and PLS Toolbox 8.1.1 (Eigenvector Research Inc, Wenatchee, WA).
Exploratory analysis of the spectral data was first performed with principal component analysis (PCA). PCA reduces the variables information into a lower number of variables, called principal components (PCs), using a bilinear decomposition that describes the primary sources of variation. The PCs are linear combinations of the original variables, non-correlated to each other (orthogonal) and calculated sequentially in a hierarchical way, where the first PC retains the main information of the data, the main information not included in the first PC is then retained by the second PC, and successively (13, 14).
A supervised classification analysis was finally performed with partial least squares-discriminant analysis (PLS-DA). PLS-DA uses a PLS regression model by relating the spectral data to a vector of dummy variables codified with ones (1) or zeros (0) if the training samples belong to a given class. Then, classification of unknown samples is achieved from the valued predicted in the model by defining a cut-off value (threshold) between 0 and 1. In this case, the linear combinations of the original variables are called latent variables (LVs), which maximize the discrimination between the described classes (15).
3. Results and Discussion
DMS dispersion plots provide 3-dimensional data that are based on compensation voltage, radio Frequency (RF) voltage and ion intensity. Figure 1 shows the dispersion plot, obtained for ethyl acetate sample. The four main ion peaks appeared in this figure provide specific details about this sample. The peaks can be assigned as (i) hydronium ion [(H2O)nH+] or the reactant ion peak (RIP) in positive polarity of ion mobility measurement, (ii) proton bound monomer of ethyl acetate [MH+], and (iii) proton bound dimer of ethyl acetate [M2H+] (M is ethyl acetate molecule and n is an integer)(16, 17).
Fig 1.
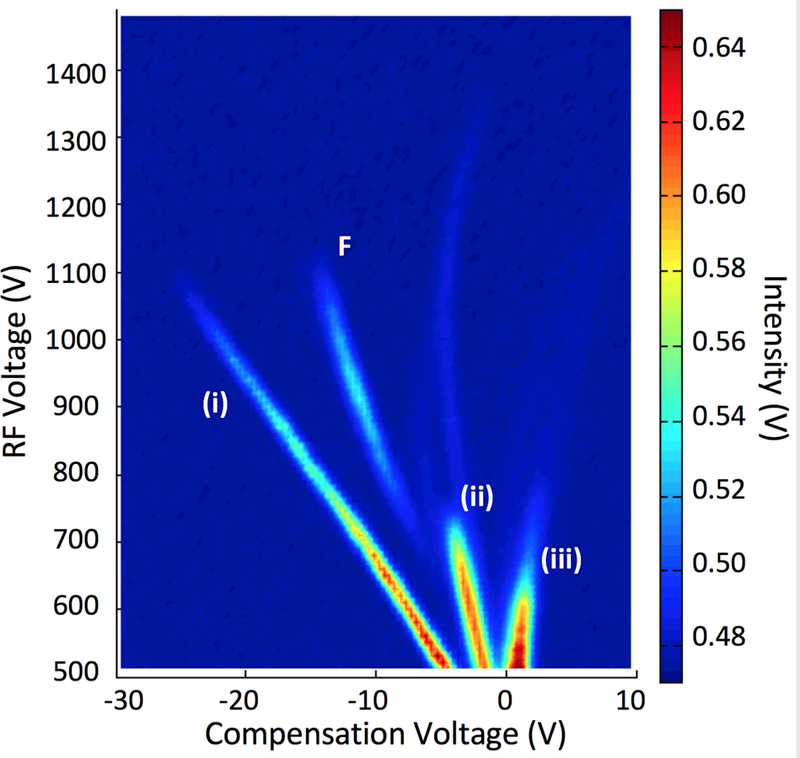
DMS dispersion plot of 500 ppb of ethyl acetate at 80 °C drift tube temperature.
Ion separation occurs with the increase of the RF voltage and the smaller ions such as [(H2O)nH+] moves towards more negative compensation voltages and larger ions, such as dimer of ethyl acetate, stays almost unaffected at about zero compensation voltage. Even though peak identity was not confirmed, the peak named as F, may be assigned as a fragment ion. Same fragmentation behaviour for propyl acetate (CH3COOCH2CH2CH3) at 100 °C DMS cell temperature was observed by An et al and the fragmention was identified as (CH3COOH)H+. Ethyl acetate (CH3COOCH2CH3) may produce the same fragment ion and the lower fragment ion intensity may have resulted due to the low thermal energy (drift cell at 80 °C) provided by this DMS drift cell compared to the propyl acetate results (drift cell at 100 °C) obtained by An et al (16). It is evident by the peak intensity variation that the fragmentation increases with increasing the RF voltage suggesting that field heating also contributes in this fragmentation (16, 18). The peak that appears between the fragment ion (F) and monomer ion (ii) was present in the dispersion plot, obtained for the RIP (background – Figure 2(a)) and is likely an ion peak due to some impurity in the drift region. A hybrid DMS-MS system would allow filtering of ions by DMS and thorough investigation of the peak identities by MS due to each chemical. However, due to the data analysis scope of this present work, further effort to identify peaks was not performed at this time.
Fig 2.
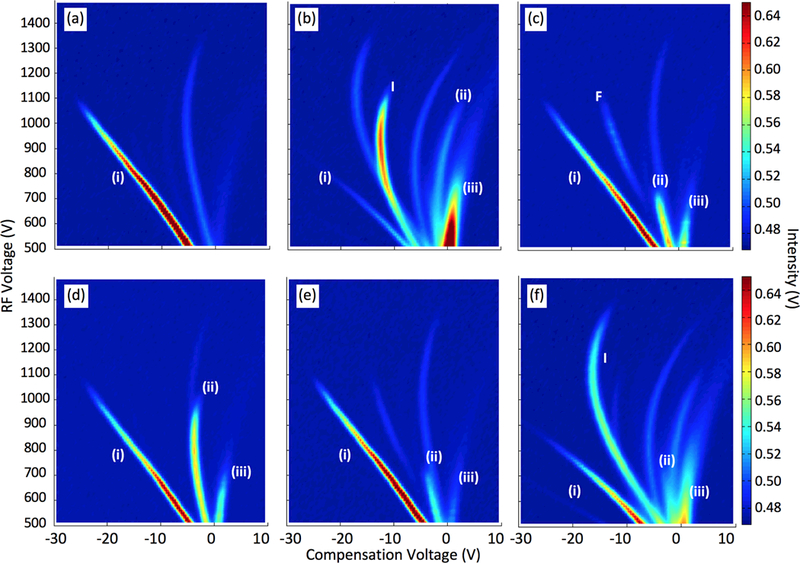
DMS dispersion plots of (a) reactant ion peak (RIP) and five different compounds at 500 ppb and 80 °C drift tube temperature: (b) 2-butanone, (c) ethyl acetate, (d) 2-propanone, (e) methanol, and (f) ethanol.
3.1. DMS dispersion plots for different chemicals
Five chemicals were initially considered in our data-modelling paradigm: methanol, ethanol, 2-butanone, 2-propanone and ethyl acetate. Their corresponding DMS dispersion plots together with the RIP background signal are represented in Figure 2. While these entire chemicals are considered volatile organic compounds (VOCs), methanol and ethanol (Figures 2e and 2f, respectively) are commonly used as solvents. Proton bound monomer [MH+] (ii) and dimer [M2H+] (iii) ions were observed for all the chemicals (16, 18). General reactions for the formation of monomer and dimer ions can be shown by equation 4 and 5, where n, m, x, y are integers and M represents each molecule (19).
| (4) |
| (5) |
High intensity peaks appearing next to the RIP in the ethanol and 2-butanone sample, other than the dimer and monomer ions is likely a fragment ion from each sample.
Each of the previously described compounds, together with a mixture of two compounds, were measured 30 times to obtain the corresponding DMS dispersion plots. Principal component analyses (PCA) were performed to explain the differences observed between analytes.
PCA transforms complex data into simpler orthogonal representations explaining possible correlations without losing information. While PCA scores plots describe existing sample correlations by transforming the variables into specific data point within the new principal component (PC) axes (lower dimension), variable/loading plots show the contribution of the measured variables to each PCs. For example, when a group of samples is differentiated by the PC1 axis from the scores plot, the loadings plot of the PC1 allows the identification of the variables responsible of that difference.
3.2. Differentiation of compounds
An initial PCA was performed on the dispersion plots of the measured individual compounds (30 replicates). Only positive polarity DMS spectra were used, and no single conditioning or pre-processed was performed (e.g. raw data was used). Figure 3 represents the (a) PCA scores plot and (b) variable/loadings plots of the first two principal components (PCs). The scores plot of PC1 versus PC2 shows a clear differentiation of the compounds, mainly for 2-butanone and ethanol. These compounds are basically separated by the first PC from the rest of the compounds, and the variables or the loadings that explain those differences are presented in Figure 3b (left). PC1 loadings show highest intensities at the monomer ion, dimer ion, RIP and predicted fragment ion intensities (see peaks I and F intensity in Figure 2), suggesting the separation at PC1 occurs due to positional and ion intensity variations of those ions in the dispersion plot. Further, it is clear that by both PC1 and PC2 loading intensities that 2-butanone and ethanol are separated from each other along PC2 and from rest of the chemicals along PC1 mainly due to the ion intensities at the predicted fragment ions (peak I) that stay between the RIP and monomer ion. Slight differences between injection replicates were only observed for the 2-butanone, reflected on the second PC. These are also described in the PC2 loadings represented in Figure 3b (right).
Fig 3.
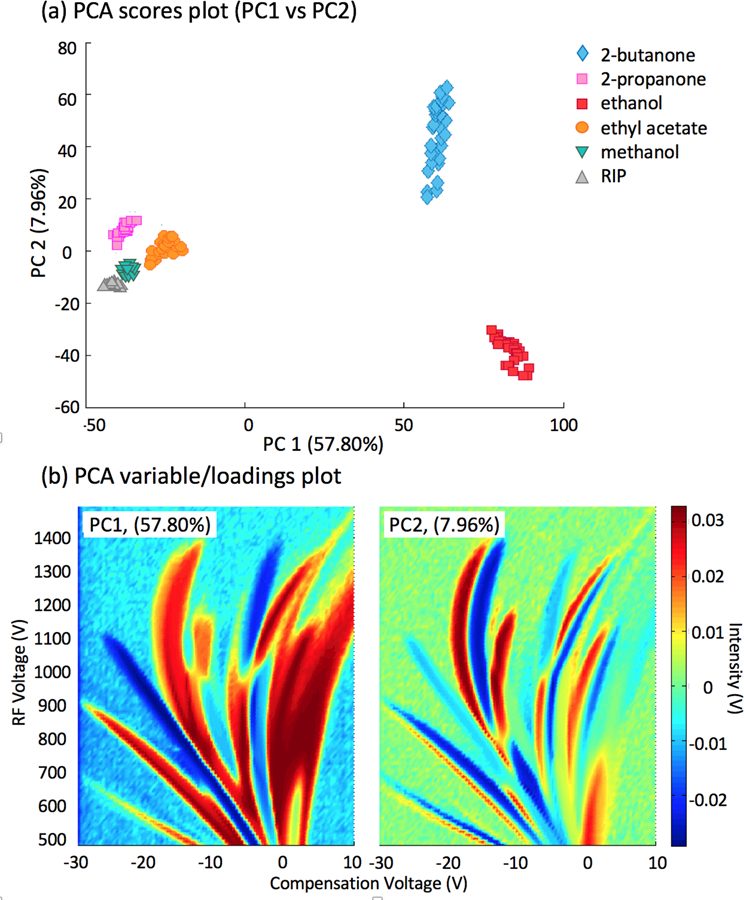
PCA results obtained by DMS measurements of five different compounds. (a) Scores for 30–34 replicates, and (b) loadings for the first two principal component (PC).
3.3. Differentiation of a mixture
Apart from detecting differences between compounds, another application of the DMS measurements is the differentiation a mixture from its individual chemicals. Figure 4 presents the PCA results for an untargeted analysis of the dispersion plots from the mixture of ethyl acetate and 2-butanone and the individual compounds.
Fig 4.
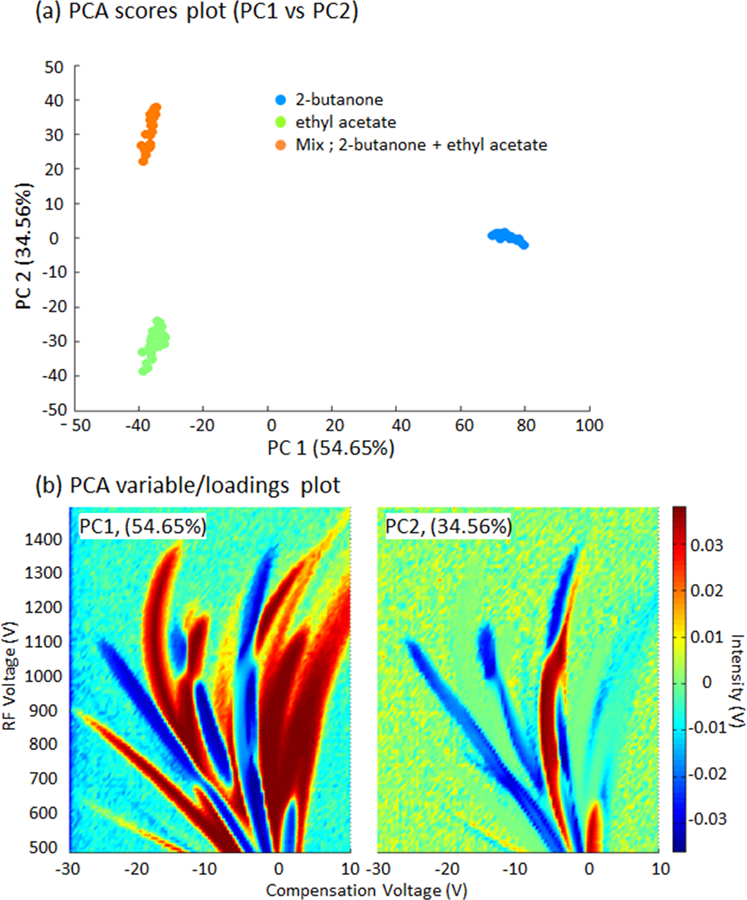
PCA results obtained by DMS spectrometry measurements of two individual compounds: 2- butanone and ethyl acetate, and a mixture of both compounds. (a) Scores for 30–34 replicates, and loadings (b) for the two first principal component (PCs).
In this case, clear differences between 2-butanone and the rest of the samples are described by the PCA (Fig. 4a). These differences are explained by the variables presented in Fig. 4b (left). The variations of peak intensities at the RIP, monomer, dimer, and the peaks I and F of both individual sample and mixture (see individual peak intensity variations of chemicals, Figure 2b, 2c and supplementary figure of the mixture) have contributed high intensities of the PC1 loadings (Figure 4b, left) at the corresponding peak intensities, suggesting the main reason for the separations of chemicals along the PC1 axis. However, PC2 retains the main differences between the two compounds and the mixture. The highest ion intensity of the PC2 loadings from these variables (Fig. 4b right) suggest that ion intensity between the RIP and dimer ions has significantly contributed to the separation of the mixture from its initial chemicals, 2-butanone and ethyl acetate along the PC2 axis. This ion intensity is mainly associated with the mixture that can be seen in the supplementary figure of the mixture of DMS dispersion plot. The shape of this highest ion intensity in PC2 may be a combine effect of the monomer ion intensity of ethyl acetate and ion intensity of peak I of 2-butanone. Figure 5 shows the same untargeted analysis using three chemicals (2-butanone, ethyl acetate, and methanol). It can be seen that PCA can differentiate the individual compounds from the mixture.
Fig 5.
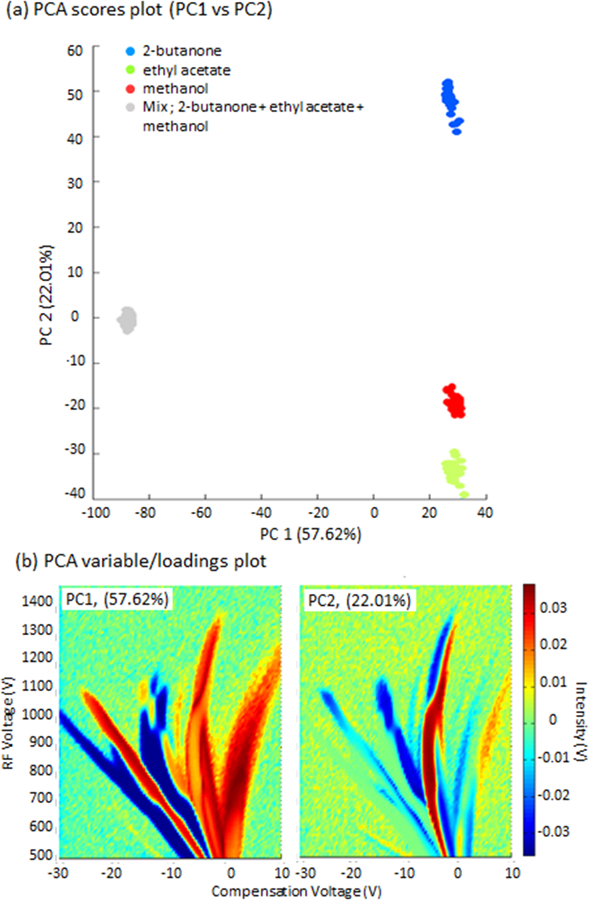
PCA results obtained by DMS dispersion plot measurements of three individual chemicals: 2- butanone, ethyl acetate, methanol, and a mixture of the three chemicals. (a) Scores for replicates, and loadings (b) for the two first principal components (PCs).
Finally, a PLS-DA calibration model was built to test the hypothesis that we could both model the data and use a model to predict chemical composition of a mixture. The model used the signals corresponding to the individual compounds: 2-butanone and ethyl acetate. The model was leave-one out cross validated selecting the first two latent variables (LVs). The PLS-DA scores plot shows an outstanding discrimination between the measured compounds (Figure 6a) explained by the first LV. Its loadings described the variables that mainly explain these differences. Using this calibration model, 15% of the spectra from each compound (5 samples) and all the measures of the mixture were used as test validation to determine the prediction ability of the model. In order to classify the samples a threshold value was calculated (0.56) and whose sample values (Y predicted) that were below or above the threshold value were classified as ethyl acetate or 2-butanone, respectively (Figure 6b).
Fig 6.
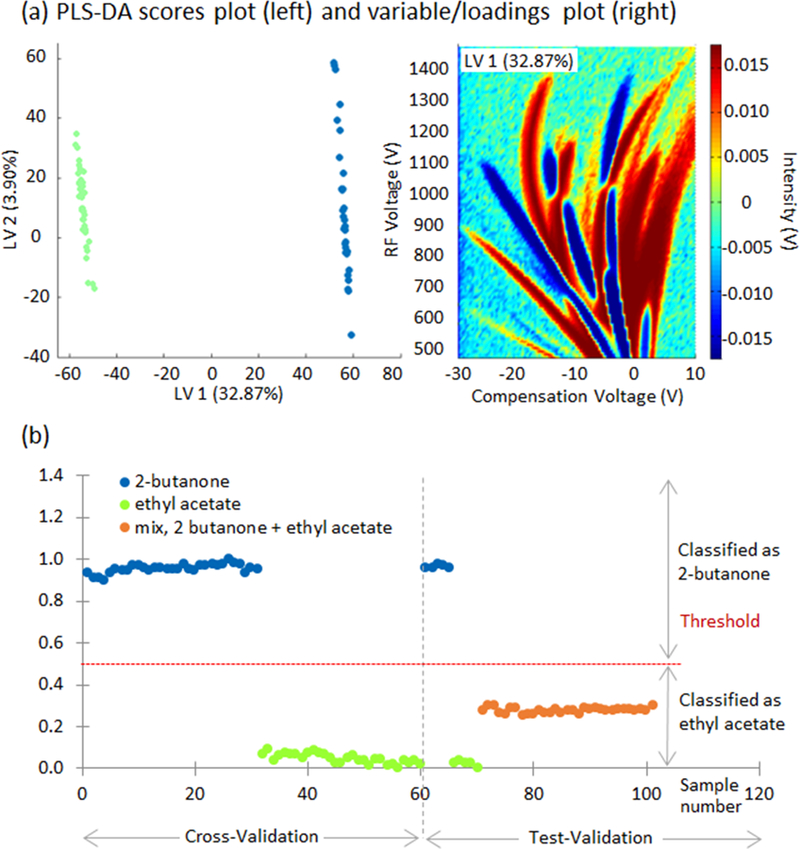
PLS-DA model results for 2-butanone and ethyl acetate. (a) Scores of the first two latent variables (LV, left) and loadings plot for the first LV (right) explaining differences between compounds, and (b) Y predicted values for cross-validation and test-validation.
In this case, PLS-DA classified the mixture of two as ethyl acetate. A shortcoming of training the algorithm with only pure compounds is that PLS-DA will not be able to capture the relationships or confounding variables in the mixture. Thus a more robust method is to utilize the mixture in the train data. Figure 7a and 7b follows this approach using PLS-DA. The training (cross-validation) phase shows three different chemicals: 2-butanone, ethyl acetate, and the mixture of 2-butanone and ethyl acetate. The purpose of Figure 7a is to test if 2-butanone is present in the mixture and in the pure compounds. This is achieved by utilizing 25% of the sample data from the mixture (2-butanone and ethyl acetate) in the training data. PLS-DA is a supervised machine learning algorithm, thus each sample must have a corresponding label or class: 2-butanone or ethyl acetate. During the training phase, the mixture is labeled as 2-butanone, because the model is testing to see if 2-butanone is present in the mixture. The black circle indicates all samples in Figure 7a were labeled as 2-butanone. A threshold of 0.79 was calculated. During the test validation phase, if the compound was above the threshold of 0.79 then the pure compound is classified as 2-butanone and the mixture shows that 2-butanone is present. It is evident from Figure 7a that PLS-DA can accurately predict 2-butanone is present in the mixture and the 25% of the test data (2-butanone and ethyl acetate) used for the test validation are predicted correctly. Figure 7b uses the same methodology but labels the mixture as ethyl acetate to test if ethyl acetate is present. The model yields the similar results.
Fig 7.
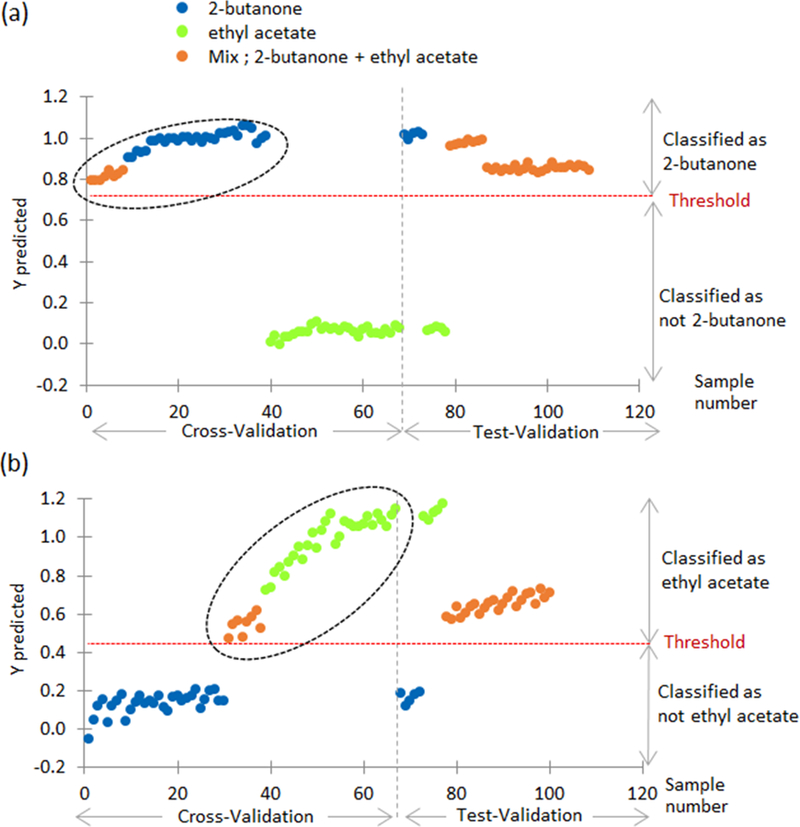
Y predicted values for cross-validation and test-validation using mixture 02 chemicals in training data.
Figure 8a shows the scores and loading plots for 2-butanone, ethyl acetate, and methanol. It is evident that PLS-DA can be used to separate the three compounds along the first and second LV. Figure 8b-d show PLS-DA training using only pure compounds in the training data. The results are not very consistent with what is expected as Figure 8b-d show that ethyl acetate and methanol are not present in the mixture and only 2-butanone is present in the mixture.
Fig 8.
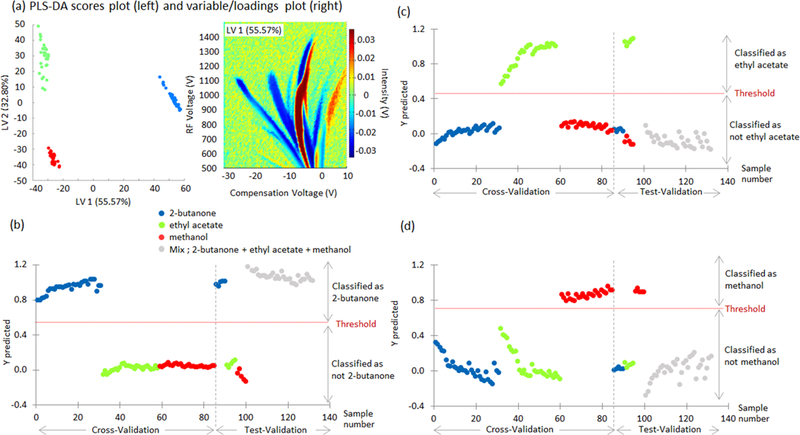
PLS-DA model results for 2-butanone, ethyl acetate, and methanol. (a) scores of the first two latent variables (LV, left) and loadings plot for the first LV (right) explaining differences between compounds, and (b,c,d) Y predicted values for cross validation and test-validation.
Using the more robust method of using the mixture in the training data, Figure 9a-c show the same methodology used in figure 7a and 7b. 25% of the sample data from the mixture (2-butanone, ethyl acetate, and methanol) is used in the training data. The black circle in Figure 9 indicates what the mixtures were labeled as 2-butanone (Figure 9a), ethyl acetate (Figure 9b), and methanol (Figure 9c). A threshold of 0.57 was calculated in Figure 9a. During the test validation phase, if the compound was above the threshold of 0.57 then the pure compound is classified as 2-butanone and the mixture shows that 2-butanone is present. It is evident from Figure 9a that PLS-DA can accurately predict 2-butanone is present in the mixture. Figure 9b-c uses the same methodology and show similar results. These results validate that PLS-DA can be used to determine whether or not a particular chemical of interest is present or not. This is the first demonstration to our knowledge of an automated PLS-DA software identification of single chemicals from a dispersion plot representing mixtures of more than one chemical. Other reports have used the dispersion plot as an overall fingerprint of a mixture of chemicals, but we are effectively identifying the contributing signatures of specific chemicals in the mixture. This is a first step towards generating an effective “peak table” of chemical constituents from differential mobility spectrometer data.
Fig 9.
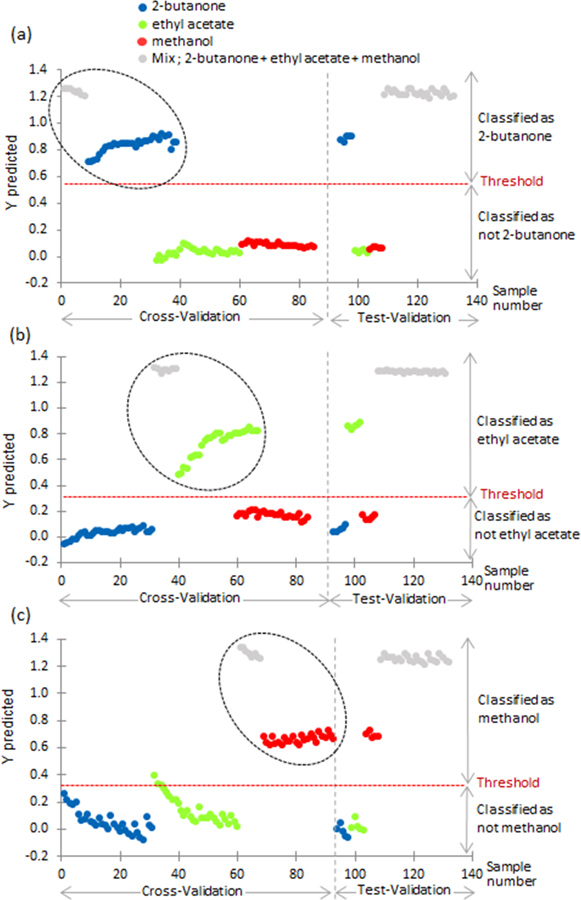
Y predicted values for cross-validation and test-validation using mixture of 03 chemicals in training data.
4. Conclusions
This article shows the first promising results using PLS-DA to perform chemical discrimination and chemical separation using 3-D DMS dispersion data. Our AIMS software successfully separated five data sets of DMS dispersion plots of common VOCs. In addition, it is demonstrated that PCA and PLS-DA can be used to identify and predict chemicals from mixtures. This software is highly sensitive to any slight variation on a topographical plot. This automated numerical analysis approach may also have potential applications on 3-D data generated by other analytical techniques such as GC-IMS, LC-MS, and GC-MS. Data collection of individual samples and mixtures with variation of chemical concentration, consideration of pressure and temperature changes of the drift gas and precise chemical identification by DMS-MS will be considered as major tasks in the future to achieve precise predictions of chemicals from DMS dispersion data using this algorithm and approach.
Supplementary Material
Acknowledgements
Partial support was provided by: NIH award U01 EB0220003-01 (CED, NJK); NIH National Centre for Advancing Translational Sciences (NCATS) through award UL1 TR000002 (CED, NJK); NIH award UG3-OD023365 (CED, NJK); NIH award 1P30ES023513–01A1 (CED, NJK); and NSF award 1255915 (CED). Student support was partially provided by the US Department of Veterans Affairs, Post-9/11 GI-Bill (DJP), and the National Science Foundation award 1343479 Veteran’s Research Supplement (DJP). The contents of this manuscript are solely the responsibility of the authors and do not necessarily represent the official views of the funding agencies. The authors would like to thank Alexander G. Fung for discussions about gas dilutions and sample introduction methods for these experiments.
Footnotes
Electronic Supplementary Information (ESI) available: The AnalyzeIMS (AIMS) software and this sample data set is available on GitHub. Please refer to Professor Cristina Davis' webpage for more information. AnalyzeIMS is available as open source for re-search and personal use under a modified BSD license. Commercial licensing may be available, and a license fee may be required. The Regents of the University of California own the copyrights to the software. Future published scientific manuscripts or reports using this software must cite the original software publication (DOI:10.1007/s12127-016-0200-9). See DOI: 10.1039/C8AY00846A
Notes and references
- 1.Ewing RG, Atkinson DA, Eiceman GA, Ewing GJ. A critical review of ion mobility spectrometry for the detection of explosives and explosive related compounds. Talanta 2001;54(3):515–29. [DOI] [PubMed] [Google Scholar]
- 2.Rajapakse MY, Fowler PE, Eiceman GA, Stone JA. Dissociation Enthalpies of Chloride Adducts of Nitrate and Nitrite Explosives Determined by Ion Mobility Spectrometry. J Phys Chem A 2016;120(5):690–8. [DOI] [PubMed] [Google Scholar]
- 3.Eiceman GA, Karpas Z, Hill HH. Ion Mobility Spectrometry, 3rd Edition. Ion Mobility Spectrometry, 3rd Edition. 2014:1–400.
- 4.Hall AB, Coy SL, Nazarov EG, Vouros P. Rapid separation and characterization of cocaine and cocaine cutting agents by differential mobility spectrometry-mass spectrometry. J Forensic Sci 2012;57(3):750–6. [DOI] [PubMed] [Google Scholar]
- 5.Eiceman GA, Krylov EV, Tadjikov B, Ewing RG, Nazarov EG, Miller RA. Differential mobility spectrometry of chlorocarbons with a micro-fabricated drift tube. Analyst 2004;129(4):297–304. [DOI] [PubMed] [Google Scholar]
- 6.Schneider BB, Covey TR, Coy SL, Krylov EV, Nazarov EG. Planar differential mobility spectrometer as a pre-filter for atmospheric pressure ionization mass spectrometry. Int J Mass Spectrom 2010;298(1–3):45–54. [DOI] [PMC free article] [PubMed] [Google Scholar]
- 7.Schneider BB, Londry F, Nazarov EG, Kang Y, Covey TR. Maximizing Ion Transmission in Differential Mobility Spectrometry. J Am Soc Mass Spectrom 2017. [DOI] [PubMed]
- 8.Schneider BB, Nazarov EG, Londry F, Vouros P, Covey TR. Differential mobility spectrometry/mass spectrometry history, theory, design optimization, simulations, and applications. Mass Spectrom Rev 2016;35(6):687–737. [DOI] [PubMed] [Google Scholar]
- 9.Eiceman GA, Wang M, Prasad S, Schmidt H, Tadjimukhamedov FK, Lavine BK, et al. Pattern recognition analysis of differential mobility spectra with classification by chemical family. Anal Chim Acta 2006;579(1):1–10. [DOI] [PubMed] [Google Scholar]
- 10.Aksenov AA, Pasamontes A, Peirano DJ, Zhao W, Dandekar AM, Fiehn O, et al. Detection of Huanglongbing disease using differential mobility spectrometry. Anal Chem 2014;86(5):2481–8. [DOI] [PubMed] [Google Scholar]
- 11.Fong SS, Rearden P, Kanchagar C, Sassetti C, Trevejo J, Brereton RG. Automated peak detection and matching algorithm for gas chromatography-differential mobility spectrometry. Anal Chem 2011;83(5):1537–46. [DOI] [PMC free article] [PubMed] [Google Scholar]
- 12.Peirano DJ, Pasamontes A, Davis CE. Supervised Semi-Automated Data Analysis Software for Gas Chromatography / Differential Mobility Spectrometry (GC/DMS) Metabolomics Applications. Int J Ion Mobil Spectrom 2016;19(2):155–66. [DOI] [PMC free article] [PubMed] [Google Scholar]
- 13.Jackson JE. A User’s Guide to Principal Components: John Wiley & Sons, Inc.; 2004. [Google Scholar]
- 14.Gemperline P Principal Component Analysis. Practical Guide To Chemometrics, Second Edition: CRC Press; 2006. p. 69–104. [Google Scholar]
- 15.Wold S, Sjöström M, Eriksson L. PLS-regression: a basic tool of chemometrics. Chemometrics and Intelligent Laboratory Systems 2001;58(2):109–30. [Google Scholar]
- 16.An X, Eiceman GA, Rodriguez JE, Stone JA. Gas phase fragmentation of protonated esters in air at ambient pressure through ion heating by electric field in differential mobility spectrometry. International Journal of Mass Spectrometry 2011;303(2–3):181–90. [Google Scholar]
- 17.Kim SH, Betty KR, Karasek FW. Mobility Behavior and Composition of Hydrated Positive Reactant Ions in Plasma Chromatography with Nitrogen Carrier Gas. Analytical Chemistry 1978;50(14):2006–12. [Google Scholar]
- 18.An X, Eiceman GA, Rasanen RM, Rodriguez JE, Stone JA. Dissociation of proton bound ketone dimers in asymmetric electric fields with differential mobility spectrometry and in uniform electric fields with linear ion mobility spectrometry. J Phys Chem A 2013;117(30):6389–401. [DOI] [PubMed] [Google Scholar]
- 19.Ewing RG. Ion Mobility Spectrometry, 2nd Edition By Eiceman Gary A. (New Mexico State University, Las Cruces, NM: ) and Karpas Zeev (Nuclear Research Center, Beer-Sheva, Israel: ). CRC Press (an imprint of Taylor and Francis Group): Boca Raton, FL. 2005. xvi + 350 pp. ISBN 0–8493-2247-2. J Am Chem Soc 2006;128(16):5585–6. [Google Scholar]
Associated Data
This section collects any data citations, data availability statements, or supplementary materials included in this article.


