

Abstract
Background
Diabetes is the leading cause of end‐stage kidney disease (ESKD) around the world. Blood pressure lowering and glucose control are used to reduce diabetes‐associated disability including kidney failure. However there is a lack of an overall evidence summary of the optimal target range for blood glucose control to prevent kidney failure.
Objectives
To evaluate the benefits and harms of intensive (HbA1c < 7% or fasting glucose levels < 120 mg/dL versus standard glycaemic control (HbA1c ≥ 7% or fasting glucose levels ≥ 120 mg/dL for preventing the onset and progression of kidney disease among adults with diabetes.
Search methods
We searched the Cochrane Kidney and Transplant Specialised Register up to 31 March 2017 through contact with the Information Specialist using search terms relevant to this review. Studies contained in the Specialised Register are identified through search strategies specifically designed for CENTRAL, MEDLINE, and EMBASE; handsearching conference proceedings; and searching the International Clinical Trials Register (ICTRP) Search Portal and ClinicalTrials.gov.
Selection criteria
Randomised controlled trials evaluating glucose‐lowering interventions in which people (aged 14 year or older) with type 1 or 2 diabetes with and without kidney disease were randomly allocated to tight glucose control or less stringent blood glucose targets.
Data collection and analysis
Two authors independently assessed studies for eligibility and risks of bias, extracted data and checked the processes for accuracy. Outcomes were mortality, cardiovascular complications, doubling of serum creatinine (SCr), ESKD and proteinuria. Confidence in the evidence was assessing using GRADE. Summary estimates of effect were obtained using a random‐effects model, and results were expressed as risk ratios (RR) and their 95% confidence intervals (CI) for dichotomous outcomes, and mean difference (MD) and 95% CI for continuous outcomes.
Main results
Fourteen studies involving 29,319 people with diabetes were included and 11 studies involving 29,141 people were included in our meta‐analyses. Treatment duration was 56.7 months on average (range 6 months to 10 years). Studies included people with a range of kidney function. Incomplete reporting of key methodological details resulted in uncertain risks of bias in many studies. Using GRADE assessment, we had moderate confidence in the effects of glucose lowering strategies on ESKD, all‐cause mortality, myocardial infarction, and progressive protein leakage by kidney disease and low or very low confidence in effects of treatment on death related to cardiovascular complications and doubling of serum creatinine (SCr).
For the primary outcomes, tight glycaemic control may make little or no difference to doubling of SCr compared with standard control (4 studies, 26,874 participants: RR 0.84, 95% CI 0.64 to 1.11; I2= 73%, low certainty evidence), development of ESKD (4 studies, 23,332 participants: RR 0.62, 95% CI 0.34 to 1.12; I2= 52%; low certainty evidence), all‐cause mortality (9 studies, 29,094 participants: RR 0.99, 95% CI 0.86 to 1.13; I2= 50%; moderate certainty evidence), cardiovascular mortality (6 studies, 23,673 participants: RR 1.19, 95% CI 0.73 to 1.92; I2= 85%; low certainty evidence), or sudden death (4 studies, 5913 participants: RR 0.82, 95% CI 0.26 to 2.57; I2= 85%; very low certainty evidence). People who received treatment to achieve tighter glycaemic control probably experienced lower risks of non‐fatal myocardial infarction (5 studies, 25,596 participants: RR 0.82, 95% CI 0.67 to 0.99; I2= 46%, moderate certainty evidence), onset of microalbuminuria (4 studies, 19,846 participants: RR 0.82, 95% CI 0.71 to 0.93; I2= 61%, moderate certainty evidence), and progression of microalbuminuria (5 studies, 13,266 participants: RR 0.59, 95% CI 0.38 to 0.93; I2= 75%, moderate certainty evidence). In absolute terms, tight versus standard glucose control treatment in 1,000 adults would lead to between zero and two people avoiding non‐fatal myocardial infarction, while seven adults would avoid experiencing new‐onset albuminuria and two would avoid worsening albuminuria.
Authors' conclusions
This review suggests that people who receive intensive glycaemic control for treatment of diabetes had comparable risks of kidney failure, death and major cardiovascular events as people who received less stringent blood glucose control, while experiencing small clinical benefits on the onset and progression of microalbuminuria and myocardial infarction. The adverse effects of glycaemic management are uncertain. Based on absolute treatment effects, the clinical impact of targeting an HbA1c < 7% or blood glucose < 6.6 mmol/L is unclear and the potential harms of this treatment approach are largely unmeasured.
Plain language summary
Glucose targets for preventing diabetic kidney disease and its progression
What is the issue?
In many parts of the world, diabetes is the most common reason that people experience kidney failure and need treatment with a kidney transplant or dialysis. Disability (blindness, limb loss, kidney failure) due to diabetes is caused by high blood glucose (sugar) levels. An important question is whether extra treatment to control blood glucose levels to near normal can safely prevent the health consequences of diabetes including lower life expectancy and loss of kidney function, without causing problems such as low blood glucose leading to loss of awareness or seizures. Some medical care of diabetes includes careful blood glucose control to low levels (measured by a blood test called the HbA1C) through the use of extra medication and careful blood glucose monitoring with the help of health professionals.
What did we do?
We looked at the evidence for tighter blood glucose control (lower blood glucose in the long term, that is HbA1c < 7% ) compared with less tight blood glucose control (HbA1c > 7%) in people who have either type 1 or type 2 diabetes. Blood glucose was achieved by any sort of treatment including pills or insulin.
What did we find?
Fourteen studies involving 29,319 people with at risk of diabetes complications were included and 11 studies involving 29,141 people were included in our analyses. Tighter blood glucose control generally didn't show any benefits for patients compared to less tight glucose control. There was no difference in the risks for patients on kidney failure, death, or heart disease complications. A very small number of patients (1 in every 1000 treated each year) might avoid a heart attack with more intense blood glucose management. Some patients would expect to have less protein leakage through kidney function although the clinical impact of this benefit is unclear in the long term. The potential problems with treatment, such as side effects and risks of very low blood glucose (hypoglycaemia) were not generally measured in the studies.
Our conclusions
The review concludes that people with diabetes receive uncertain benefits from tighter blood glucose control in the long‐term and the immediate complications of this treatment approach are difficult to know accurately.
Summary of findings
Summary of findings for the main comparison. Tight glycaemic control compared with non‐tight control for preventing diabetic kidney disease (DKD) and its progression.
| Tight glycaemic control compared with non‐tight control for preventing DKD and its progression | ||||||
|
Patient or population: patients with diabetes Intervention: tight glycaemic control Comparison: non‐tight glycaemic control | ||||||
| Outcomes | Illustrative comparative risks* (95% CI) | Relative effect (95% CI) | No. of participants (studies) | Confidence of the evidence (GRADE) | Comments | |
| Assumed risk | Corresponding risk | |||||
| Non‐tight control | Tight control | |||||
|
Doubling serum creatinine 8.3 years |
39 per 1000 |
33 per 1000 (24.95 to 43.29) NNT: 167 |
RR 0.84 (0.64 to 1.11) | 26,874 (4) | ⊕⊕⊝⊝ low | Imprecision (‐1) Heterogeneity (‐1) |
|
ESKD 5.9 years |
3 per 1000 |
2 per 1000 (1.02 to 3.36) NNT: 1000 |
RR 0.62 (0.34 to 1.12) | 23,332 (4) | ⊕⊕⊝⊝ low | Imprecision (‐1) Heterogeneity (‐1) |
|
Sudden death 4.6 years |
2 per 1000 |
2 per 1000 (0.52 to 5.14) NNT: 0 |
RR 0.82 (0.26 to 2.57) | 5,913 (4) | ⊕⊝⊝⊝ very low | Study limitation (‐1) Imprecision (‐1) Heterogeneity (‐1) |
|
All‐cause mortality 5.6 years |
16 per 1000 |
16 per 1000 (13.76‐18.08) NNT: 0 |
RR 0.99 (0.86 to 1.13) | 29,094 (9) | ⊕⊕⊕⊝ moderate | Imprecision (‐1) |
|
Cardiovascular mortality 4.4 years |
9 per 1000 |
11 per 1000 (6.57 to 17.28) NNH: 500 |
RR 1.19 (0.73 to 1.92) | 23,673 (6) | ⊕⊕⊝⊝ low | Imprecision (‐1) Heterogeneity (‐1) |
|
Non‐fatal myocardial infarction 5.6 years |
8 per 1000 |
7 per 1000 (5.36 to 7.92) NNT: 1000 |
RR 0.82 (0.67 to 0.99) | 25,596 (5) | ⊕⊕⊕⊝ moderate | Study limitation (‐1) |
|
Onset microalbuminuria 5.4 years |
46 per 1000 |
39 per 1000 (35.42 to 43.24) NNT: 143 |
RR 0.85 (0.77 to 0.94) | 19,933 (4) | ⊕⊕⊕⊝ moderate | Heterogeneity (‐1) |
|
Progression of microalbuminuria 5.8 years |
4 per 1000 |
2 per 1000 (1.52 to 3.72) NNT: 500 |
RR 0.59 (0.38 to 0.93) | 13,266 (5) | ⊕⊕⊕⊝ moderate | Heterogeneity (‐1) |
| *The basis for the assumed risk (e.g. the median control group risk across studies) is calculated from data in the meta‐analyses. The corresponding risk (and its 95% confidence interval) is based on the assumed risk in the comparison group and the relative effect of the intervention (and its 95% CI).
CI: Confidence Interval; RR: Risk Ratio; NNT: Number Needed to Treat; NNH: Number Needed to Harm. We did not downgrade for reason of publication bias as insufficient studies contributed to treatment estimates to draw meaningful conclusions | ||||||
| GRADE Working Group grades of evidence High confidence: Further research is very unlikely to change our confidence in the estimate of effect. Moderate confidence: Further research is likely to have an important impact on our confidence in the estimate of effect and may change the estimate. Low confidence: Further research is very likely to have an important impact on our confidence in the estimate of effect and is likely to change the estimate. Very low confidence: We are very uncertain about the estimate. | ||||||
ESKD ‐ end‐stage kidney disease
Background
Description of the condition
The prevalence of diabetes is increasing worldwide (IDF 2015) and people with type 1 or type 2 diabetes are at high risk for a number of serious health problems, including cardiovascular complications, premature death, end‐stage kidney disease (ESKD), blindness, and limb loss (CDC 2011). Diabetes is estimated to cause 43 million people around the world to live with disability each year (Murray 2012).
Diabetic kidney disease (DKD), which refers to kidney disease caused by diabetes (also called diabetic nephropathy), is the leading cause of people experiencing ESKD. In the USA alone, diabetes is responsible for 44% of people needing treatment with dialysis or transplantation (USRDS 2011). Diabetes mellitus affects 3% to 4% of adults worldwide, with prevalence projected to double over the first three decades of the 21st century (Wild 2004). Chronic kidney disease (CKD) generally occurs in 25& to 40% of patients with diabetes within 20 to 25 years of onset (Ritz 1999) but although its incidence has decreased, diabetes is still the most important cause of ESKD in industrialised countries (USRDS 2013). Recent data have shown a reduction of the incidence of DKD in patients whose diagnosis occurred in more recent years, indicating a most favourable prognosis of type 1 diabetes when diagnosed in the early years, and a lower incidence of ESKD (Finne 2005), Similar studies also suggest that early‐onset type 2 diabetes mellitus is associated with substantially increased incidence of ESKD and mortality in middle age (Pavkov 2006).
Description of the intervention
The risk of kidney disease among people with diabetes is associated with blood glucose control (DCCT 1986; Krolewski 1995; UKPDS 1998). Consequently, the role of tight glycaemic control (glycated haemoglobin (HbA1c) < 7% or fasting glucose levels < 120 mg/dL (6.7 mmol/L)) on the onset and progression of DKD has been explored by several randomised controlled trials (RCTs) in patients with type 1 (DCCT 1986) and type 2 (Ismail 2010; Moritz 2009; Patel 2008; UKPDS 1998) diabetes. These studies have specifically compared the effect of more intensive treatment to target lower fasting plasma glucose levels or HbA1c on kidney outcomes compared with conventional hypoglycaemic therapy.
While there is an association between higher blood glucose levels and poorer clinical outcomes among people with diabetes, the impact of glucose‐lowering treatment to tighter glucose treatment targets remains uncertain and potential harms including hypoglycaemia are increased. A meta‐analysis of tight blood glucose control showed that people receiving intensive antihyperglycaemic treatment had similar risks of all‐cause mortality and cardiovascular mortality as people with conventional blood glucose targets and insufficient information was available in accrued clinical studies to evaluate benefits of tighter glycaemia targets on non‐fatal myocardial infarction, composite microvascular complications, or retinopathy (Hemmingsen 2011), while people allocated to lower blood glucose levels experienced a 30% increased risk of severe hypoglycaemia.
How the intervention might work
Hyperglycaemia is a crucial factor in the development of DKD due to tissue glycosylation including glomerular and mesangial cells. Three mechanisms have been postulated that explain pathways of glucose‐mediated tissue damage: non‐enzymatic glycosylation that generates advanced glycosylation end products; activation of protein kinase C (PKC); and acceleration of the aldose reductase pathway. RCTs have shown that people receiving tight glycaemic control experience less new microalbuminuria, while the impact of tighter glucose targets on the progression from microalbuminuria to overt kidney failure (doubling serum creatinine (SCr) and ESKD), remains unclear. Conflicting results on the role played by tight glycaemic control on cardiovascular events and total mortality among people with kidney disease have been reported (Duckworth 2009; Patel 2008), with a recent study showing an increased risk of death associated with intensive glucose treatment (Gerstain 2008). Hypoglycaemia is the major risk of intensive glucose treatment and a higher rate of severe hypoglycaemia has been consistently reported with tight glucose control (DCCT 1986; UKPDS 1998). Although mild episodes generally may be well tolerated, severe hypoglycaemia can cause serious injury, unconsciousness, seizures, coma, myocardial ischaemia, angina, residual neurological impairment, or death (Desouza 2003).
Why it is important to do this review
The benefits and harms of tight versus standard blood glucose control for cardiovascular and kidney‐related outcomes in people with diabetes and kidney disease have not been formally summarised in a systematic review. This review attempts to provide this overview of the existing evidence.
Objectives
To evaluate the benefits and harms of intensive (HbA1c < 7% or fasting glucose levels < 120 mg/dL versus standard glycaemic control (HbA1c ≥ 7% or fasting glucose levels ≥120 mg/dL for preventing the onset and progression of kidney disease among adults with diabetes.
Methods
Criteria for considering studies for this review
Types of studies
All RCTs and quasi‐RCTs (RCTs in which allocation to treatment was obtained by alternation, use of alternate medical records, date of birth or other predictable methods) that evaluated the effect of tight versus standard glycaemic control administered to patients with type 1 or type 2 diabetes with or without kidney disease were included. Studies were included if they reported follow‐up data during treatment of 6 months or longer.
Types of participants
Inclusion criteria
People with type 1 or type 2 diabetes, irrespective of blood pressure (BP) and baseline blood glucose levels
Without kidney disease: defined as a normal estimated (e) or measured (m) glomerular filtration rate (GFR) (> 90 mL/min) and an albumin excretion rate of < 30 mg/d on a timed specimen or urinary albumin/creatinine ratio (ACR) < 30 mg/g confirmed with three serial measurements)
-
With kidney disease
Normal or impaired GFR (> 90 mL/min) with or without microalbuminuria defined as an albumin excretion rate between 30 and 300 mg/d or 20 to 200 μg/min on a timed specimen or urinary ACR between 30 and 300 mg/g, confirmed with three serial measurements
Macroalbuminuria defined as an albumin excretion rate ≥ 300 mg/d or ≥ 200 μg/min on a timed specimen or urinary ACR ≥ 300 mg/g, confirmed with three serial measurements.
Exclusion criteria
People with diabetes and CKD not caused by diabetes, as proven by kidney biopsy
Children and adolescents aged < 14 years
Pregnant women.
Types of interventions
The interventions of interest were tight glycaemic control versus standard glycaemic control.
Tight glycaemic control was defined by allocation to a treatment approach targeting an HbA1c < 7% or fasting glucose levels < 120 mg/dL (6.7 mmol/L).
Standard (conventional) glycaemic control was defined by allocation to a treatment approach targeting HbA1c ≥ 7% or fasting glycaemic control ≥ 120 mg/dL (6.7 mmol/L) or as defined by the authors, including standard practice clinical care. Three sub‐categories of conventional control (HbA1C: i. 7.0% to 8.5%; ii. 8.5% to 10.0%; iii. > 10.0%) were considered.
Glycaemic control could be achieved by any blood glucose‐lowering approach, administered at any dose and for a duration of at least six months. We considered studies in which people were randomly allocated to placebo or standard care (no targeted treatment) and studies that allocated participants to two different treatments or different doses of the same treatment as long as the glucose target was tight versus conventional in the study.
Types of outcome measures
Primary outcomes
Doubling of SCr
ESKD (GFR < 15 mL/min for 3 months or longer, treated with dialysis, transplantation or symptomatic management)
Death (any cause, cardiovascular, sudden) or nonfatal myocardial infarction or stroke
Secondary outcomes
Onset, progression, or regression of microalbuminuria
Urinary ACR at the end of treatment or change between beginning and end of treatment
SCr (mg/dL, μmol/L) at the end of treatment or change in SCr between beginning and end of treatment
Creatinine clearance (CrCl) or GFR (any measure) at the end of treatment or change (any measure) between beginning and end of treatment and change in GFR per year of follow‐up (mL/min/y)
-
Hypoglycaemia defined as:
Minor hypoglycaemia
Major hypoglycaemia
Serious or severe hypoglycaemia.
Glycaemic control (%HbA1c) at end of treatment or change from beginning to end of treatment and hypoglycaemia (as a dichotomous outcome) defined according to the definitions of individual studies
Lipid profile (low density lipoprotein (LDL), high density lipoprotein (HDL), total cholesterol, triglycerides) at end of treatment and change from beginning to end of treatment.
Search methods for identification of studies
Electronic searches
We searched the Cochrane Kidney and Transplant Specialised Register up to 31 March 2017 through contact with the Information Specialist using search terms relevant to this review. The Cochrane Kidney and Transplant Specialised Register contains studies identified from several sources.
Monthly searches of the Cochrane Central Register of Controlled Trials (CENTRAL)
Weekly searches of MEDLINE OVID SP
Handsearching of kidney‐related journals and the proceedings of major kidney conferences
Searching of the current year of EMBASE OVID SP
Weekly current awareness alerts for selected kidney and transplant journals
Searches of the International Clinical Trials Register (ICTRP) Search Portal and ClinicalTrials.gov.
Studies contained in the Specialised Register are identified through search strategies for CENTRAL, MEDLINE, and EMBASE based on the scope of Cochrane Kidney and Transplant. Details of these strategies, as well as a list of handsearched journals, conference proceedings and current awareness alerts, are available in the Specialised Register section of information about Cochrane Kidney and Transplant.
See Appendix 1 for search terms used in strategies for this review.
Searching other resources
Reference lists of nephrology textbooks, review articles and relevant studies.
Letters seeking information about unpublished or incomplete studies to investigators known to be involved in previous studies.
Conference proceedings from nephrology meetings.
Data collection and analysis
Selection of studies
The search strategy was used to obtain titles and abstracts of studies that might be relevant to the review. The titles and abstracts were screened independently by two authors, who discarded studies that were not applicable; however, studies and reviews that might include relevant data or information on studies were retained initially. Two authors independently assessed retrieved abstracts, and if necessary the full text, of these studies to determine which studies satisfied the inclusion criteria. Disagreements in the adjudication of eligible studies was resolved by consensus and discussion with a third author.
Data extraction and management
Data extraction was carried out independently by two authors using standard electronic data extraction forms. Studies reported in non‐English language journals were translated before assessment. Where more than one publication of one study existed, reports were grouped together and the publication with the most complete data was included. Where relevant outcomes are only published in earlier versions these data were used. Any discrepancy between published versions was highlighted. Disagreements in data extraction were resolved by consultation with all authors.
Assessment of risk of bias in included studies
The following items were independently assessed by two authors using the Cochrane risk of bias assessment tool (Higgins 2011) (seeAppendix 2).
Was there adequate sequence generation (selection bias)?
Was allocation adequately concealed (selection bias)?
-
Was knowledge of the allocated interventions adequately prevented during the study (detection bias)?
Participants and personnel
Outcome assessors
Were incomplete outcome data adequately addressed (attrition bias)?
Are reports of the study free of suggestion of selective outcome reporting (reporting bias)?
Was the study apparently free of other problems that could put it at a risk of bias?
Measures of treatment effect
For dichotomous outcomes (doubling of SCr, ESKD, death (any cause), sudden death, death (due to cardiovascular causes), non‐fatal cardiovascular events (myocardial infarction and stroke), onset of microalbuminuria, progression of albuminuria or proteinuria, regression to normoalbuminuria, regression to microalbuminuria, or regression to normoalbuminuria, or adverse effects including hypoglycaemia, the treatment effects were expressed as risk ratios (RR) together with 95% confidence intervals (CI). Where continuous scales of measurement were used to assess the effects of treatment (urinary albumin excretion, urinary ACR, BP, SCr, CrCl, GFR), the mean difference (MD) was used, or the standardised mean difference (SMD) if different scales were used.
Unit of analysis issues
Cluster RCTs: we considered cluster studies if they had been appropriately analysed taking into account intra‐class correlation coefficients and relevant data were documented in the report, however, no cluster RCTs were eligible for inclusion
Cross‐over studies: no cross‐over studies were eligible for inclusion
Studies with multiple treatment groups: studies in which there were more than two treatment arms, data for dichotomous outcomes were combined according to treatment intervention to avoid double‐counting of information.
Dealing with missing data
No correspondence was sought from investigators of eligible studies.
Assessment of heterogeneity
We first assessed the heterogeneity by visual inspection of the forest plot. Heterogeneity was then analysed using a Chi2 test on N‐1 degrees of freedom, with an alpha of 0.05 used for statistical significance and with the I2 test (Higgins 2003). A guide to the interpretation of I2 values is as follows.
0% to 40%: might not be important
30% to 60%: may represent moderate heterogeneity
50% to 90%: may represent substantial heterogeneity
75% to 100%: considerable heterogeneity.
The importance of the observed value of I2 depends on the magnitude and direction of treatment effects and the strength of evidence for heterogeneity (e.g. P‐value from the Chi2 test, or a confidence interval for I2) (Higgins 2011).
Assessment of reporting biases
We generated funnel plots to assess for evidence of small‐study effects for outcomes in which there were data for nine or more studies (Higgins 2011).
Data synthesis
Data were pooled using random‐effects meta‐analysis.
Subgroup analysis and investigation of heterogeneity
Subgroup analysis were prespecified to explore possible sources of heterogeneity (e.g. participants, interventions, and study quality). We assessed for evidence of different treatment effects based on the following characteristics:
Age
GFR (≥ 90 mL/min/1.73 m2 versus < 90 mL/min/1.73 m2)
Duration of follow‐up (≥ 60 months versus < 60 months)
Allocation concealment (low versus unclear risk)
Sensitivity analysis
We planned sensitivity analyses to explore the influence of the following factors on effect size, although insufficient data were available to complete such analyses.
'Summary of findings' tables
We presented the main results of the review in 'Summary of findings' tables. These tables present key information concerning the quality of the evidence, the magnitude of the effects of the interventions examined, and the sum of the available data for the main outcomes (Schünemann 2011a). The 'Summary of findings' tables also include an overall grading of the evidence related to each of the main outcomes using the GRADE (Grades of Recommendation, Assessment, Development and Evaluation) approach (GRADE 2008). The GRADE approach defines the quality of a body of evidence as the extent to which one can be confident that an estimate of effect or association is close to the true quantity of specific interest. The quality of a body of evidence involves consideration of within‐trial risk of bias (methodological quality), directness of evidence, heterogeneity, precision of effect estimates and risk of publication bias (Schünemann 2011b). We presented the following outcomes in the 'Summary of findings' tables.
Doubling of SCr
ESKD
Sudden death
All‐cause mortality
Cardiovascular mortality
Non‐fatal myocardial infarction
Onset microalbuminuria
Results
Description of studies
Results of the search
The electronic search strategy identified 3348 unique citations. After title and abstract review 3140 records were excluded (not randomised, wrong population, wrong intervention). Of the remaining 208 records, we identified 18 studies; 14 included studies (204 records) (ACCORD Study 2007; ADVANCE Study 2001; Ciavarella 1985; DCCT 1986; Feldt‐Rasmussen 1986; KUMAMOTO Study 1995; MEMO Study 2011; OSLO Study 1986; SDIS Study 1988; STENO‐2 Study 1999; STENO Study 1982; UKPDS Study 1991; VA‐CSDM Study 1992; VADT Study 2003), and four excluded studies (four records) (Christiansen 1987; Holman 1983; Kawamori 1991; Wiseman 1985) (Figure 1).
1.
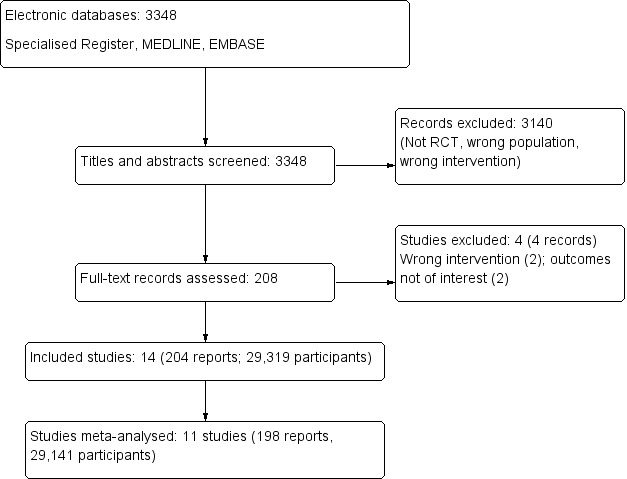
Study flow diagram
Included studies
The 14 included studies enrolled 29,319 participants from Europe and USA published between 1982 and 2011 were included in the systematic review and 11 studies involving 29,141 participants could be included in our meta‐analysis (Characteristics of included studies). Three studies were not included in meta‐analyses as outcome data were not reported in a format that could be extracted for analysis (KUMAMOTO Study 1995; OSLO Study 1986; STENO Study 1982).
The mean duration of follow‐up in included studies was 56.7 months (ranging from 6 to 120 months).
There were four studies involving 1589 people with type 1 diabetes (Ciavarella 1985; DCCT 1986; Feldt‐Rasmussen 1986; SDIS Study 1988), eight studies involving 27,654 people with type 2 diabetes (ACCORD Study 2007; ADVANCE Study 2001; KUMAMOTO Study 1995; MEMO Study 2011; STENO‐2 Study 1999; UKPDS Study 1991; VA‐CSDM Study 1992; VADT Study 2003), and two studies involving 1665 people who had insulin‐dependent diabetes (OSLO Study 1986; STENO Study 1982).
The average age of participants was highly variable (ranging between 18 and 66 years). Of the 11 studies contributing outcome data, one study (190 participants) involved people with stage 2 CKD (eGFR 60 to 90 mL/min) (MEMO Study 2011), and five studies (11,990 participants) reported treatment in people with stage 1 CKD (eGFR > 90 mL/min/1.73 m2) (ACCORD Study 2007; DCCT 1986; Feldt‐Rasmussen 1986; SDIS Study 1988; STENO‐2 Study 1999). In the remaining studies, the level of kidney function was not specified.
Among studies included in our meta‐analyses, five (ACCORD Study 2007; Feldt‐Rasmussen 1986; SDIS Study 1988; VA‐CSDM Study 1992; VADT Study 2003) compared conventional versus intensive (continuous) therapy (12,333 participants); two studies (MEMO Study 2011; STENO‐2 Study 1999) compared standard care within general practice with intensive multifactorial intervention with behaviour modification or a structured education program (350 participants); two studies (Ciavarella 1985; DCCT 1986) compared one or two daily insulin injections versus three or more or continuous injections (1,451 participants); one study (UKPDS Study 1991) compared conventional therapy, primarily with diet alone, versus intensive therapy with sulphonylurea or metformin (3,867 participants) and one study (ADVANCE Study 2001) compared standard glucose control (with target HbA1c levels defined on the basis of local guidelines) versus intensive glucose control, defined as the use of gliclazide plus other drugs (11,140 participants) to target HbA1c ≤ 6.5%.
A detailed description of the glucose targets to which participants were randomly allocated is provided in Table 2.
1. Table of targets definition.
| Study | Tight control | Non‐tight control | ||||||
| Treatment | Definition | Cut point | Achieved HbA1c (%)* | Treatment | Definition | Cut point | Achieved HbA1c (%)* | |
| ACCORD Study 2007 | Intensive therapy | Target HbA1c < 6.0% | HbA1c < 6.0% | 7.2 (6.6 to 7.9) | Conventional therapy | HbA1c: 7.0% to 7.9% | HbA1c: 7.0% to 7.9% | 7.6 (7 to 8.3) |
| ADVANCE Study 2001 | Intensive with gliclazide ± metformin, thiazolidinediones, acarbose or insulin | Target HbA1c≤ 6.5% | HbA1C ≤ 6.5% | 6.53 ± 0.91 | Conventional with sulphonylurea other than gliclazide | HbA1c levels defined by local guidelines | Local target | 7.30 ± 1.26 |
| Ciavarella 1985 | Insulin infusion (SC) | NR | NR | 9 ± 0.7 | 1 or 2 or 3 daily insulin injections | NR | NR | 11.4 ± 0.8 |
| DCCT 1986 | 3 or more daily insulin injections or insulin infusion (SC) | prePBG 3.9 to 6.7 mmol/L postPBG < 10 mmol/L HbA1c < 6.05% |
prePBG 3.9 to 6.7 mmol/L postPBG < 10 mmol/L HbA1c < 6.05% |
7.2 ± NR | 1 or 2 daily insulin injections | No glycosuria, hyperglycaemia and ketonuria | No glycosuria hyperglycaemia and ketonuria | 9.1 ± NR |
| Feldt‐Rasmussen 1986 | Insulin infusion (SC) | FBG levels 5 to 10 mmol/L postPBG morning 4 to 7 mmol/L Avoiding blood glucose levels < 3 mmol/L |
FPG 5 to 10 mmol/L postPBG 4 to 7 mmol/L BG > 3 mmol/L |
7.2 (5.9 to 8.8) | Conventional insulin therapy | PostPBG <15 mmol/L Glucose excretion < 20 g/24h |
PostPBG < 15 mmol/L Glucose excretion < 20 g/24h |
8.6 (7.2 to 13.3) |
| KUMAMOTO Study 1995 | 3 or more daily insulin injections | Glycaemic control as close to the FBG < 7.78 mmol/L HbA1c < 7.0% |
FBG < 7.78 mmol/L HbA1c < 7.0% |
7.2 ± 1 | 1 or 2 daily injections of intermediate‐acting insulin | glycaemic control as close to FBG < 7.78 mmol/L | FPG < 7.78 mmol/L | 9.4 ± 1.3 |
| MEMO Study 2011 | Intensive care + structured education program | HbA1c ≤ 6.5% | HbA1c ≤ 6.5% | 8 ± 1.6 | Standard care by general practitioner | HbA1c ≤ 6.5% | HbA1c ≤ 6.5% | 7.5 ± 1.4 |
| OSLO Study 1986 | 3 or more daily insulin injections or insulin infusion (SC) | NR | NR | NR | 2 daily mixed insulin injections | NR | NR | NR |
| SDIS Study 1988 | Intensive therapy | NR | NR | 7.1 ± 0.7 | Conventional therapy | NR | NR | 8.5 ± 0.7 |
| STENO‐2 Study 1999 | Intensive multifactorial intervention with behaviour modification | HbA1c < 6.5% | HbA1c < 6.5% | NR | Standard care by general practitioner | HbA1c < 7.5% | HbA1c < 7.5% | NR |
| STENO Study 1982 | Insulin infusion (SC) | PostPBG < 9 mmol/L No glycosuria |
PostPBG < 9 mmol/L No glycosuria |
6.7 ± 1 | 1 or more daily injections of insulin | PostPBG <15 mmol/L Glucose excretion < 20 g/24h |
PostPBG < 15mmol/L Glucose excretion < 20 g/24h |
8 ± 1.2 |
| UKPDS Study 1991 | Intensive with metformin or sulphonylurea ± metformin or insulin | FPG < 6 mmol/L In insulin‐treated patients, pre‐meal glucose concentrations 4 to 7 mmol/L |
FPG < 6 mmol/L prePBG 4 to 7 mmol/L |
7 (6.2 to 8.2) | Conventional with diet or metformin ± sulphonylurea or sulphonylurea ± metformin or insulin | Maintain FPG < 15 mmol/L without symptoms of hyperglycaemia |
FPG < 15 mmol/L | 7.9 (6.9 to 8.8) |
| VA‐CSDM Study 1992 | Intensive therapy | HbA1c as close to the normal range as possible (5.1 ± 1% (mean ± 2 SD)) Normal mean FSG 4.44 to 6.38 mmol/L Other prePBG < 7.22 mmol/L |
HbA1c 5.1% + 1 FBG 4.44 to 6.38 mmol/L prePBG < 7.22 mmol/L |
7.1 ± 0.1 | Conventional therapy | Avoid diabetic symptoms, excessive glycosuria, or overt hypoglycaemia | No diabetes, glycosuria or hypoglycaemia | 9.1 ± NR |
| VADT Study 2003 | Intensive with maximal OHA doses ± insulin | Aiming for HbA1c ≤ 6% A priority is to avoid hypoglycaemia |
HbA1c ≤ 6.0% No hypoglycaemia |
6.9 (NR) | Conventional with half the maximal OHA doses ± insulin | Avoidance of deterioration of HbA1c 8% to 9% and preventing symptoms of glycosuria, hypoglycaemia, and ketonuria | HbA1c 8% to 9% No glycosuria, hyperglycaemia and ketonuria |
8.4 (NR) |
* value reported as mean ± SD or median (range)
FBG ‐ fasting blood glucose; HbA1c ‐ glycated haemoglobin; NR: not reported; PBG ‐ prandial blood glucose; SC‐ subcutaneous
Excluded studies
Four studies that were initially selected after title and abstract review were ineligible after full‐text review because of one of the following reasons: not assessing the outcome of interest (Christiansen 1987; Wiseman 1985), not targeting HbA1c less than 7% (two studies: Holman 1983; Kawamori 1991) (Characteristics of excluded studies).
Risk of bias in included studies
The risks of bias are summarised in and Figure 2 and Figure 3. See also Characteristics of included studies for details for each study.
2.
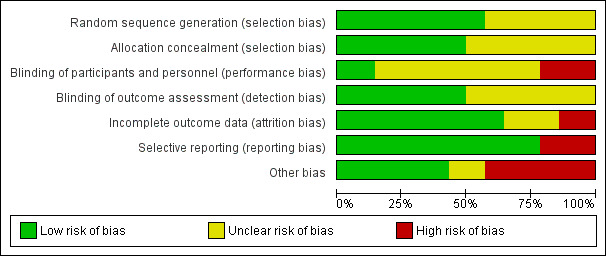
Risk of bias graph: review authors' judgements about each risk of bias item presented as percentages across all included studies.
3.

Risk of bias summary: review authors' judgements about each risk of bias item for each included study.
Allocation
Sequence generation
Eight studies (57%) reported low risk methods for generation of the random sequence (ACCORD Study 2007; ADVANCE Study 2001; DCCT 1986; OSLO Study 1986; STENO‐2 Study 1999; UKPDS Study 1991; VADT Study 2003; VA‐CSDM Study 1992). There was insufficient information to determine sequence generation in the remaining six studies (43%) and these were judged to have unclear risk of bias.
Allocation concealment
Seven studies (50%) reported adequate methods for allocation concealment (low risk of bias) (ADVANCE Study 2001; DCCT 1986; SDIS Study 1988; STENO‐2 Study 1999; UKPDS Study 1991; VA‐CSDM Study 1992; VADT Study 2003). There was insufficient information to determine methods of allocation concealment in the remaining seven studies (50%) and these were judged to have unclear risk of bias.
Blinding
Performance bias
Two studies (14%) reported that participants and investigators were masked to treatment (ADVANCE Study 2001; DCCT 1986), three studies (21%) were open‐label and so were considered at high risk of bias (ACCORD Study 2007; STENO‐2 Study 1999; VADT Study 2003), and the remaining nine studies (65%) did not provide sufficient information to enable assessment (unclear).
Detection bias
Seven studies (50%) reported adequate methods of masking outcome assessment (ACCORD Study 2007; ADVANCE Study 2001; DCCT 1986; MEMO Study 2011; STENO‐2 Study 1999; VADT Study 2003; VA‐CSDM Study 1992); the remainder did not provide sufficient information and where judged to have unclear risk of bias.
Incomplete outcome data
Nine studies (64%) met criteria for low risk of bias (fewer than 10% missing from follow‐up analyses and balanced numbers across intervention groups with similar reasons for loss to follow‐up) of incomplete outcome data bias (ACCORD Study 2007; ADVANCE Study 2001; DCCT 1986; KUMAMOTO Study 1995; MEMO Study 2011; SDIS Study 1988; STENO Study 1982; UKPDS Study 1991; VA‐CSDM Study 1992), two studies (14%) was at high risk of bias (Ciavarella 1985; Feldt‐Rasmussen 1986), and the remaining three studies (21%) did not provide sufficient information and were judged to unclear risk of bias.
Selective reporting
Eleven studies (89%) reported all expected outcomes and were judged to be at low risk of bias (ACCORD Study 2007; ADVANCE Study 2001; Ciavarella 1985DCCT 1986; Feldt‐Rasmussen 1986; MEMO Study 2011; SDIS Study 1988; STENO‐2 Study 1999; UKPDS Study 1991; VA‐CSDM Study 1992; VADT Study 2003). Three studies (21%) were not able to be meta‐analysed and were judged to be at high risk of bias (KUMAMOTO Study 1995; OSLO Study 1986; STENO Study 1982).
Other potential sources of bias
There were three studies (21%) that reported the sponsor was involved in authorship of the study report or in data management or analysis (ACCORD Study 2007; STENO‐2 Study 1999; VADT Study 2003).
Effects of interventions
See: Table 1
The Table 1 for the main comparison provides overall estimates and our confidence in treatment effects for the key (preventing the onset and progression of kidney disease) and safety (cardiovascular events or death) outcomes.
Primary outcomes
Doubling of serum creatinine
Tight glycaemic control may make little or no difference to doubling of SCr compared with standard control (Analysis 1.1 (4 studies, 26,874 participants): RR 0.84, 95% CI 0.64 to 1.11; I2= 73%; low certainty evidence).
1.1. Analysis.
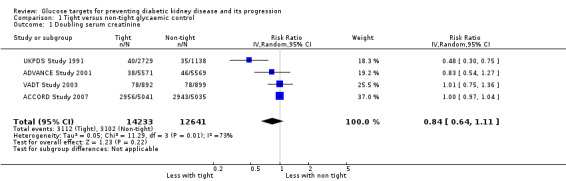
Comparison 1 Tight versus non‐tight glycaemic control, Outcome 1 Doubling serum creatinine.
End‐stage kidney disease
Tight glycaemic control may make little or no difference to patients developing ESKD compared with standard glycaemic control (Analysis 1.2 (4 studies, 23,332 participants): RR 0.62, 95% CI 0.34 to 1.12; I2= 52%; low certainty evidence).
1.2. Analysis.
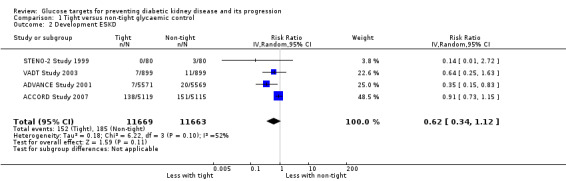
Comparison 1 Tight versus non‐tight glycaemic control, Outcome 2 Development ESKD.
Death (from any cause, cardiovascular causes, or sudden)
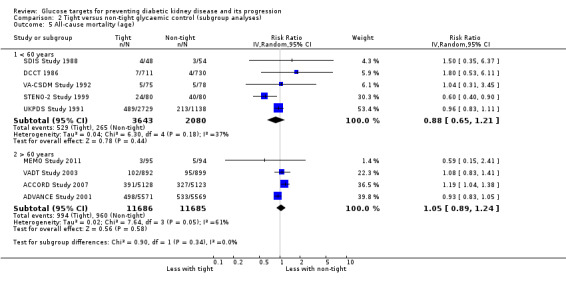
Tight glycaemic control probably makes little or no difference to all‐cause mortality (Analysis 1.3 (9 studies, 29,094 participants): RR 0.99, 95% CI 0.86 to 1.13; I2= 50%; moderate certainty evidence), cardiovascular mortality (Analysis 1.4 (6 studies, 23,673 participants): RR 1.19, 95% CI 0.73 to 1.92; I2= 85%; low certainty evidence) and sudden death (Analysis 1.5 (4 studies, 5913 participants): RR 0.82, 95% CI 0.26 to 2.57; I2= 85%; very low certainty evidence) compared with standard glycaemic control.
1.3. Analysis.
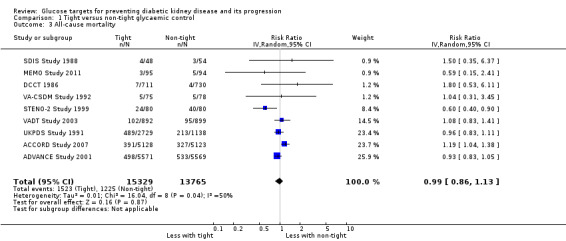
Comparison 1 Tight versus non‐tight glycaemic control, Outcome 3 All‐cause mortality.
1.4. Analysis.
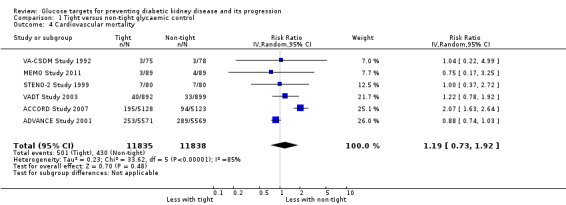
Comparison 1 Tight versus non‐tight glycaemic control, Outcome 4 Cardiovascular mortality.
1.5. Analysis.
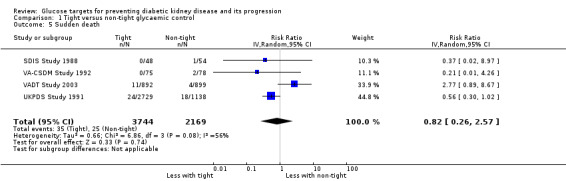
Comparison 1 Tight versus non‐tight glycaemic control, Outcome 5 Sudden death.
Fatal and non‐fatal cardiovascular events including myocardial infarction and stroke
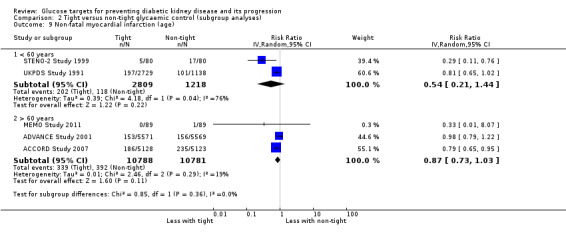
Tight glycaemic control may make little or no difference to fatal myocardial infarction (Analysis 1.6 (3 studies, 14,220 participants): RR 1.11, 95% CI 0.76 to 1.62; I2= 24%) and stroke (Analysis 1.7 (3 studies, 15,909 participants): RR 1.11, 95% CI 0.71 to 1.75; I2= 0%) compared with standard glycaemic control.
1.6. Analysis.
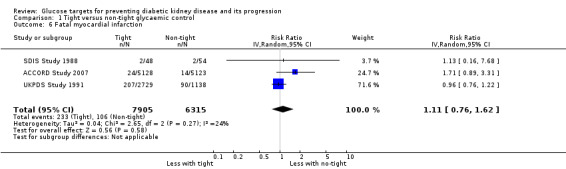
Comparison 1 Tight versus non‐tight glycaemic control, Outcome 6 Fatal myocardial infarction.
1.7. Analysis.
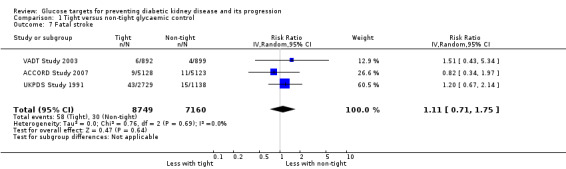
Comparison 1 Tight versus non‐tight glycaemic control, Outcome 7 Fatal stroke.
Tight glycaemic control probably reduces non‐fatal myocardial infarction (Analysis 1.8 (5 studies, 25,596 participants): RR 0.82, 95% CI 0.67 to 0.99; I2= 46%, moderate certainty evidence), but probably makes little or no difference to the risk of non‐fatal stroke (Analysis 1.9 (5 studies, 25,596 participants): RR 0.94, 95% CI 0.68 to 1.31; I2= 64%) compared with standard glycaemic control.
1.8. Analysis.
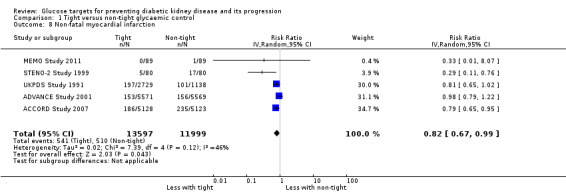
Comparison 1 Tight versus non‐tight glycaemic control, Outcome 8 Non‐fatal myocardial infarction.
1.9. Analysis.
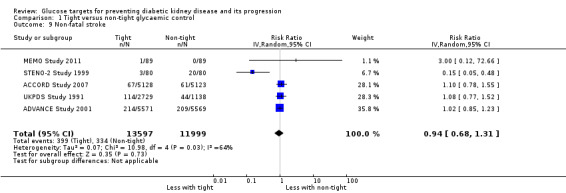
Comparison 1 Tight versus non‐tight glycaemic control, Outcome 9 Non‐fatal stroke.
Secondary outcomes
Onset, progression or regression of microalbuminuria
Tight glycaemic control probably reduces the risk of onset of microalbuminuria compared with standard control (Analysis 1.10 (4 studies, 19,846 participants): RR 0.82, 95% CI 0.71 to 0.93; I2= 61%, moderate certainty evidence). Similarly, tight glycaemic control probably decreases the risk of progression of microalbuminuria (Analysis 1.11 (5 studies, 13,266 participants): RR 0.59, 95% CI 0.38 to 0.93; I2= 75%, moderate certainty evidence) compared to standard control.
1.10. Analysis.

Comparison 1 Tight versus non‐tight glycaemic control, Outcome 10 Onset microalbuminuria.
1.11. Analysis.
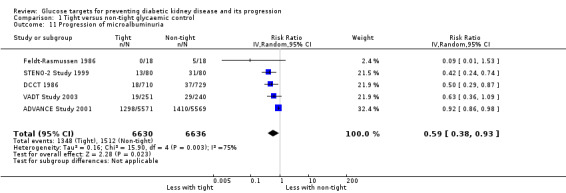
Comparison 1 Tight versus non‐tight glycaemic control, Outcome 11 Progression of microalbuminuria.
DCCT 1986 reported tight glycaemic control may make little or no difference to regression of albuminuria compared with conventional control (Analysis 1.12, (1 study, 73 participants): RR 1.18, 95% CI 0.78 to 1.78).
1.12. Analysis.

Comparison 1 Tight versus non‐tight glycaemic control, Outcome 12 Regression of albuminuria.
End of treatment urinary albumin‐creatinine ratio
This outcome was not reported in any of the included studies.
End of treatment serum creatinine
Tight glycaemic control had may make little of no difference to SCr compared with conventional glycaemic control (Analysis 1.13 (4 studies, 12718 participants): MD 0.96 µmol/L, 95% CI ‐0.42 to 2.34; I2 = 0%).
1.13. Analysis.
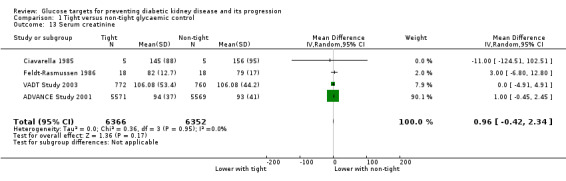
Comparison 1 Tight versus non‐tight glycaemic control, Outcome 13 Serum creatinine.
End of treatment creatinine clearance or glomerular filtration rate
Tight glycaemic control may make little of no difference to GFR compared with conventional glycaemic control (Analysis 1.14 (3 studies, 164 participants): MD ‐4.86 mL/min, 95% CI ‐15.69 to 5.97; I2 = 31%).
1.14. Analysis.
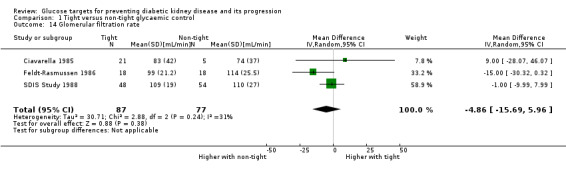
Comparison 1 Tight versus non‐tight glycaemic control, Outcome 14 Glomerular filtration rate.
Hypoglycaemia
Data on side effects related to metformin, sulphonylureas, glitazones, meglitinides, alpha‐glucosidase, exenatide, liraglutide and insulin were not reported. The narrative findings for hypoglycaemia are shown in Table 3 as these were reported in heterogeneous ways that precluded meta‐analysis.
2. Narrative table for hypoglycaemia.
| Study ID | Intervention | Control | Statistical inference |
| ACCORD Study 2007 | 3,1 severe hypoglycaemia /100 patient‐year (830 patient, 16.2%) 1 hypoglycaemia‐related death |
1 severe hypoglycaemia/100 patient‐year (261 patient, 5.1%) 1 hypoglycaemia‐related death |
P < 0.001 |
| ADVANCE Study 2001 | 0.7 severe hypoglycaemia/100 patient‐year (150 patients, 2.7%) 120 minor hypoglycaemia/100 patient‐year |
0.4 severe hypoglycaemia/100 patient‐year (81 patients, 1.5%) 90 minor hypoglycaemia/100 patient‐year |
P < 0.001 |
| DCCT 1986 | 549 (77%) severe hypoglycaemia | 165 (23%) severe hypoglycaemia | P < 0.001 |
| MEMO Study 2011 | 42.4% mild hypoglycaemia 11.2% moderate hypoglycaemia 0% severe hypoglycaemia |
32.5% mild hypoglycaemia 29% moderate hypoglycaemia 6.3% severe hypoglycaemia |
P = 0.52 P = 0.001 P = 0.07 |
| SDIS Study 1988 | 1.1 serious hypoglycaemia/patient‐year (80%) | 0.4 serious hypoglycaemia/patient‐year (58%) | P < 0.5 |
| STENO‐2 Study 1999 | 42 patients ≥1 minor hypoglycaemia 5 patients ≥1 major hypoglycaemia |
39 patients ≥1 minor hypoglycaemia 12 patients ≥1 major hypoglycaemia |
P = 0.50 P = 0.12 |
| VADT Study 2003 | 1566 any hypoglycaemia/100 patient‐year 12 major hypoglycaemia/100 patient‐year |
432 any hypoglycaemia/100 patient‐year 4 major hypoglycaemia/100 patient‐year |
P < 0.001 |
End of treatment glycaemic control (HbA1c)
Glycaemic control at the end of treatment was probably reduced with intensive therapy compared with standard therapy (Analysis 1.15 (5 studies, 11583 participants): MD ‐1.38%, 95% CI ‐1.93 to ‐0.82; I2 = 96%).
1.15. Analysis.
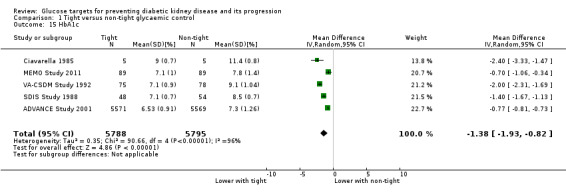
Comparison 1 Tight versus non‐tight glycaemic control, Outcome 15 HbA1c.
Lipid profile
This outcome was not reported in any of the included studies.
Subgroup and sensitivity analysis
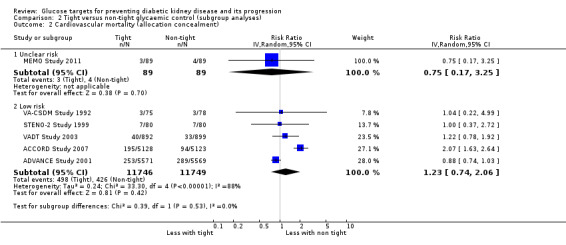
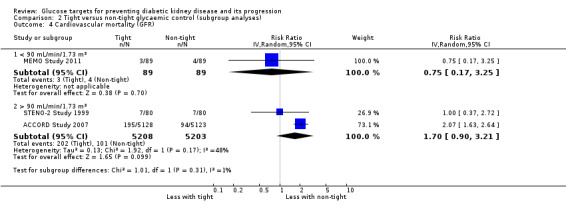
Subgroup analysis were run to explore potential different effects of the treatment related to age (greater or less than 60 years old), allocation concealment (unclear versus low risk), study duration (greater or less than 60 months) and GFR (greater or less than 90 mL/min/1.72m2). There was no evidence of a difference between the subgroups for any of the outcomes included in the subgroup analysis related to age, allocation concealment, or GFR.
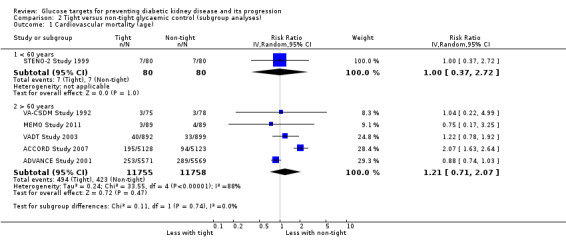
We found that in studies with a duration of less than 60 months, the risk of cardiovascular (Analysis 2.3.1: RR 1.73, 95% CI 1.04 to 2.90; test for subgroup differences: Chi2 = 5.49, (P = 0.02), I2 = 81.8%) and all‐cause mortality (Analysis 2.7.1: RR 1.18, 95% CI 1.03 to 1.36; test for subgroup differences: Chi2 = 5.74, (P = 0.02), I2 = 82.6%) was statistically significant.
2.3. Analysis.
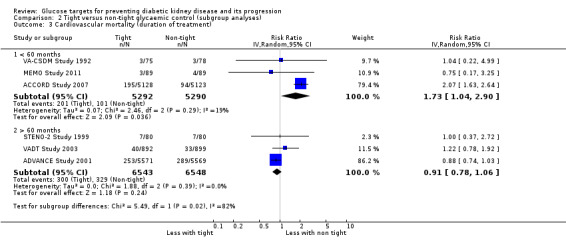
Comparison 2 Tight versus non‐tight glycaemic control (subgroup analyses), Outcome 3 Cardiovascular mortality (duration of treatment).
2.7. Analysis.
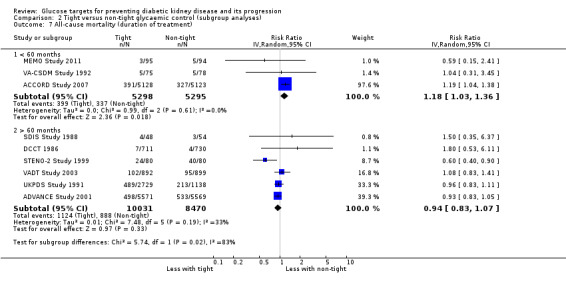
Comparison 2 Tight versus non‐tight glycaemic control (subgroup analyses), Outcome 7 All‐cause mortality (duration of treatment).
We did sensitivity analysis excluding STENO‐2 Study 1999 to check for the robustness of results as this study evaluated a multifactorial intervention including glucose targets but also including cholesterol lowering, lifestyle management, BP control. This did not alter the findings for any outcome, which remained consistent with overall findings with all studies included (specifically for the primary outcomes ESKD: RR 0.66, 95% CI 0.36 to 1.19; all‐cause mortality: RR 1.03, 95% CI 0.93 to 1.14; cardiovascular mortality: RR 1.21, 95% CI 0.71 to 2.07). We did an additional sensitivity analysis restricted to studies involving people with type 2 diabetes. In these sensitivity analyses all treatment effects were not substantively different from the principal analyses including all study populations.
We generated a funnel plot for the outcome of all‐cause mortality to assess for evidence of small‐study effects (Figure 4). There was no evidence of small‐study effects in this meta‐analysis. There were insufficient observations in the meta‐analyses for all other outcomes (fewer than 9 to 10 studies) to permit funnel plot generation.
4.

Funnel plot of comparison: 1 Tight versus non‐tight glycaemic control, outcome: 1.3 All‐cause mortality.
Discussion
Summary of main results
This review summarises 14 studies involving 29,319 people with diabetes that evaluated the effects of tight versus standard glycaemic control. Studies included people with both type 1 and type 2 diabetes and people with a range of kidney function. Studies lasted approximately five years on average, although this ranged between six months and 10 years. Intensive glycaemic control was achieved by multifactorial behavioural and education interventions in general practice, different insulin regimens, or intensive oral hypoglycaemic medication.
Although glucose‐lowering strategies to achieve tighter glucose control led to people experiencing better glycaemic control (reducing their HbA1C by 1.24% on average), this did not result in clinically important reductions in experiences of kidney failure (doubling of SCr or ESKD), or premature mortality or major cardiovascular complications. While treatment might have reduce the risks of non‐fatal myocardial infarction proportionally by 18%, in absolute terms, out of 1,000 people with diabetes receiving interventions to achieve tight glycaemic control for four to eight years might lead to between zero and two people avoiding complications (each of mortality, cardiovascular death, sudden death, ESKD, doubling of SCr, nonfatal myocardial infarction). People who were allocated to tight glycaemic control had measurable reductions in their risk of developing new microalbuminuria or progression to higher levels of microalbuminuria (proportional risk reductions of 18% and 41% respectively), but as these are surrogate measures of kidney injury, these treatment effects are of uncertain future clinical significance for these treated patients.
It is possible that tight glycaemic control might have different effects in different practice settings. We therefore examined whether treatment effects were different based on age, duration of treatment, the baseline level of kidney function and the methodological quality of the study. There was no discernible effect of age, kidney function or study methodology on estimated treatment effects. A longer duration of treatment was associated with lower risks of all‐cause mortality and cardiovascular death, although an in‐depth exploration of the mechanisms by which longer treatment might work is beyond the scope of this review and might be confounded by other factors such as study quality or participant characteristics.
In general, adverse events were incompletely reports and due to limitations in the evidence because of inconsistent treatment effects measured by different studies, and limitations in studies based on the reporting of methods, the confidence in the evidence for most outcomes was downgraded from high confidence, meaning that future studies might have different results and lead to changing in our knowledge about the impact of glucose control for people with diabetes.
Overall, this evidence summary does not support the use of tighter glucose control to offer people with diabetes a lower risk of premature mortality or protection against kidney failure. While tighter glucose control does appear to reduce some biochemical markers of kidney disease, the clinical relevance of these endpoints is uncertain and there is no evidence that these treatment effects translate to a reduction in needing dialysis or kidney transplantation in the long‐term based on the current trial evidence. People may reasonably wish to consider treatment that targets lower blood sugars with the understanding that the potentially harmful consequences of this approach are poorly measured and the absolute clinical treatment benefits are probably small during treatment on average of five to eight years.
Overall completeness and applicability of evidence
Although this review could include studies with a relatively large number of people, there were few studies overall measuring treatment impact on kidney failure and cardiovascular complications. The imprecision in our estimates of treatment effect reduced our confidence in the results, meaning that future studies might provide different results and change our knowledge about the effects of tight glucose control on kidney function. Notably, most of the studies included in this meta‐analysis have involved patients with type 2 diabetes, suggesting the results of this analysis may not be applicable to the management of type 1 diabetes.
Although kidney failure requiring dialysis or kidney transplantation is a common complication of diabetes in the long‐term, ESKD was a rare complication for people treated in the included studies, even over treatment lasting 5 to 10 years. Despite over 12,000 people included in available studies, fewer than 2% experienced kidney failure. As kidney failure is a rare outcome, it is very unlikely that future studies will be sufficiently prioritised or statistically large enough to determine whether glycaemic control can prevent long‐term kidney failure. Current studies have measured treatment impact on levels of kidney albumin excretion, a biochemical marker of kidney injury associated with higher risks of kidney failure and cardiovascular complications, however it is unclear whether drug‐related reductions in albuminuria necessarily translate into prevention of kidney failure with treatment.
Despite modest average reductions in the risk of nonfatal myocardial infarction for people allocated to tight glycaemic control, the absolute number of people avoiding this complication for 1000 people treated is very small and of uncertain clinical importance. In light of the small absolute benefits of tight glucose control, it is important to have a full understanding of treatment‐related harms. However, existing studies infrequently reported harms, including serious hypoglycaemia, such that people considering treatment to stricter glycaemic targets cannot reasonably balance the advantages and disadvantages of treatment to their health in both the short and long‐term.
Quality of the evidence
We graded our confidence in the evidence using the Grading of Recommendations Assessment, Development and Evaluation (GRADE) approach (Guyatt 2011), which considers study limitations, imprecision, indirectness, inconsistency and publication bias. Overall, most studies had overall unclear risks of bias for most domains of study reporting assessed. Estimated effects on efficacy and safety outcomes were frequently imprecise with confidence intervals that were consistent with both considerable benefit or harm. The drop‐out rate in 10/14 studies was <10%. Moderate heterogeneity in treatment estimates for tight compared with non‐tight glucose control were present in analyses for sudden death, cardiovascular mortality, doubling SCr and onset of microalbuminuria.
Overall, based on important limitations, our confidence in the evidence varied between very low and moderate for most outcomes, indicating that future research might have an important impact on the treatment effects observed and may change the estimated treatment impact. We carried out sensitivity analyses to explore the effect of study quality (allocation concealment) in order to assess whether this made any difference to the results. There was no strong evidence that different clinical settings and design modified the results, although the statistical power of these analyses was low and these results are hypothesis‐generating. There was no strong evidence of different treatment effects from smaller studies, though this is difficult to detect with the number of studies in this review.
Potential biases in the review process
We did this review according to a prespecified protocol and using a highly sensitive search strategy without date or language restrictions. We considered the evidence in the context of study methodological limitations using the GRADE approach. We carried out sensitivity analyses to assess the impact of study quality and other participant and study characteristics on the results.
Despite these processes, the study has limitations which need to be considered when interpreting the results, principally related to the primary studies in the review. Many of the studies did not report methodological elements in sufficient detail to ascertain risks of bias, which reduced our confidence in the results. The number of people in the studies who reached ESKD was very small, leading to considerable uncertainty for this outcome. Further studies are unlikely to address this issue meaningfully as very large numbers of people will need to be included in studies. As a consequence, many of the studies reported surrogate measures of outcomes for kidney function including albuminuria. While statistical effects were observed, the clinical value of these results remains uncertain. In future, standardised outcomes of most relevance to patients and health professionals will help the design of studies that measure outcomes that are clinically important.
Agreements and disagreements with other studies or reviews
This review finds similar results to a previous similar systematic review of intensive glycaemic control in people with type 2 diabetes and extends analyses of that review to also include kidney function outcomes. As was observed in this review, a previous review did not find any differences in risks of death (due to any cause or cardiovascular‐related) for people treated with tight glycaemic control and there was insufficient information in accrued studies published in 2011 to show conclusive benefits on risks of cardiac complications. When asked, patients foster supportive collaborative relationships to balance their need for support and advice with the need to maintain autonomy and self‐esteem. In this context, this review might help discussions between patients and health practitioners to personalise glycaemic targets to balance the small potential benefits with the uncertain and potentially important hazards of hypoglycaemia (Paterson 1998).
Authors' conclusions
Implications for practice.
Tight glycaemic control confers little clinically important benefit and uncertain adverse outcomes for people with diabetes. Targeting an HbA1c below 7% might prevent zero to two people experiencing a nonfatal myocardial infarction and result in clinically uncertain effects on death and risks of ESKD during four to eight years of treatment. The effects of tight glucose control on kidney function is unknown and limited to altering albumin excretion, a disease marker of uncertain clinical relevance. While treatment benefits are uncertain, it is possible this is because studies were not sufficiently long (5 to 10 years) to capture the long‐term risks of death and ESKD with diabetes which tend to accrue at 10 to 20 years after diagnosis. Tight glycaemic control may incur important treatment‐related complications (seen in other similar systematic reviews) that may alter the risk‐benefit trade‐off that patients make when considering treatment. Currently, there is insufficient evidence that clinicians and policy‐makers should adopt widespread intensive glycaemic control for patients with diabetes.
Implications for research.
Although the results of this review are generally inconclusive, it is unlikely that future similar studies will change our understanding of tight glycaemic control on risks of kidney failure as this endpoint is very rare and large studies would be needed to ascertain true treatment effects. In the context of limited research funding it is unlikely that future large‐scale studies will be conducted. New study ethology such as the registry‐based study might be an appropriate setting for a large‐scale glycaemic control study but despite highly‐efficient study methods, it is still unlikely that ongoing studies will address the question of glycaemic control on patient‐level outcomes. Additional studies that principally measure treatment effects on surrogate outcomes such as albuminuria are not clinically meaningful. Future standardisation of study outcomes that prioritise patient‐important endpoints will facilitate the comparability and design of future studies to assess meaningful treatment effects.
Acknowledgements
We thank the referees of the protocol and this review for helpful comments during the process of generating this review.
Appendices
Appendix 1. Electronic search strategies
| Database | Search terms |
| CENTRAL |
|
| MEDLINE |
|
| EMBASE |
|
Appendix 2. Risk of bias assessment tool
| Potential source of bias | Assessment criteria |
|
Random sequence generation Selection bias (biased allocation to interventions) due to inadequate generation of a randomised sequence |
Low risk of bias: Random number table; computer random number generator; coin tossing; shuffling cards or envelopes; throwing dice; drawing of lots; minimization (minimization may be implemented without a random element, and this is considered to be equivalent to being random). |
| High risk of bias: Sequence generated by odd or even date of birth; date (or day) of admission; sequence generated by hospital or clinic record number; allocation by judgement of the clinician; by preference of the participant; based on the results of a laboratory test or a series of tests; by availability of the intervention. | |
| Unclear: Insufficient information about the sequence generation process to permit judgement. | |
|
Allocation concealment Selection bias (biased allocation to interventions) due to inadequate concealment of allocations prior to assignment |
Low risk of bias: Randomisation method described that would not allow investigator/participant to know or influence intervention group before eligible participant entered in the study (e.g. central allocation, including telephone, web‐based, and pharmacy‐controlled, randomisation; sequentially numbered drug containers of identical appearance; sequentially numbered, opaque, sealed envelopes). |
| High risk of bias: Using an open random allocation schedule (e.g. a list of random numbers); assignment envelopes were used without appropriate safeguards (e.g. if envelopes were unsealed or non‐opaque or not sequentially numbered); alternation or rotation; date of birth; case record number; any other explicitly unconcealed procedure. | |
| Unclear: Randomisation stated but no information on method used is available. | |
|
Blinding of participants and personnel Performance bias due to knowledge of the allocated interventions by participants and personnel during the study |
Low risk of bias: No blinding or incomplete blinding, but the review authors judge that the outcome is not likely to be influenced by lack of blinding; blinding of participants and key study personnel ensured, and unlikely that the blinding could have been broken. |
| High risk of bias: No blinding or incomplete blinding, and the outcome is likely to be influenced by lack of blinding; blinding of key study participants and personnel attempted, but likely that the blinding could have been broken, and the outcome is likely to be influenced by lack of blinding. | |
| Unclear: Insufficient information to permit judgement | |
|
Blinding of outcome assessment Detection bias due to knowledge of the allocated interventions by outcome assessors. |
Low risk of bias: No blinding of outcome assessment, but the review authors judge that the outcome measurement is not likely to be influenced by lack of blinding; blinding of outcome assessment ensured, and unlikely that the blinding could have been broken. |
| High risk of bias: No blinding of outcome assessment, and the outcome measurement is likely to be influenced by lack of blinding; blinding of outcome assessment, but likely that the blinding could have been broken, and the outcome measurement is likely to be influenced by lack of blinding. | |
| Unclear: Insufficient information to permit judgement | |
|
Incomplete outcome data Attrition bias due to amount, nature or handling of incomplete outcome data. |
Low risk of bias: No missing outcome data; reasons for missing outcome data unlikely to be related to true outcome (for survival data, censoring unlikely to be introducing bias); missing outcome data balanced in numbers across intervention groups, with similar reasons for missing data across groups; for dichotomous outcome data, the proportion of missing outcomes compared with observed event risk not enough to have a clinically relevant impact on the intervention effect estimate; for continuous outcome data, plausible effect size (difference in means or standardized difference in means) among missing outcomes not enough to have a clinically relevant impact on observed effect size; missing data have been imputed using appropriate methods. |
| High risk of bias: Reason for missing outcome data likely to be related to true outcome, with either imbalance in numbers or reasons for missing data across intervention groups; for dichotomous outcome data, the proportion of missing outcomes compared with observed event risk enough to induce clinically relevant bias in intervention effect estimate; for continuous outcome data, plausible effect size (difference in means or standardized difference in means) among missing outcomes enough to induce clinically relevant bias in observed effect size; ‘as‐treated’ analysis done with substantial departure of the intervention received from that assigned at randomisation; potentially inappropriate application of simple imputation. | |
| Unclear: Insufficient information to permit judgement | |
|
Selective reporting Reporting bias due to selective outcome reporting |
Low risk of bias: The study protocol is available and all of the study’s pre‐specified (primary and secondary) outcomes that are of interest in the review have been reported in the pre‐specified way; the study protocol is not available but it is clear that the published reports include all expected outcomes, including those that were pre‐specified (convincing text of this nature may be uncommon). |
| High risk of bias: Not all of the study’s pre‐specified primary outcomes have been reported; one or more primary outcomes is reported using measurements, analysis methods or subsets of the data (e.g. subscales) that were not pre‐specified; one or more reported primary outcomes were not pre‐specified (unless clear justification for their reporting is provided, such as an unexpected adverse effect); one or more outcomes of interest in the review are reported incompletely so that they cannot be entered in a meta‐analysis; the study report fails to include results for a key outcome that would be expected to have been reported for such a study. | |
| Unclear: Insufficient information to permit judgement | |
|
Other bias Bias due to problems not covered elsewhere in the table |
Low risk of bias: The study appears to be free of other sources of bias. |
| High risk of bias: Had a potential source of bias related to the specific study design used; stopped early due to some data‐dependent process (including a formal‐stopping rule); had extreme baseline imbalance; has been claimed to have been fraudulent; had some other problem. | |
| Unclear: Insufficient information to assess whether an important risk of bias exists; insufficient rationale or evidence that an identified problem will introduce bias. |
Data and analyses
Comparison 1. Tight versus non‐tight glycaemic control.
| Outcome or subgroup title | No. of studies | No. of participants | Statistical method | Effect size |
|---|---|---|---|---|
| 1 Doubling serum creatinine | 4 | 26874 | Risk Ratio (IV, Random, 95% CI) | 0.84 [0.64, 1.11] |
| 2 Development ESKD | 4 | 23332 | Risk Ratio (IV, Random, 95% CI) | 0.62 [0.34, 1.12] |
| 3 All‐cause mortality | 9 | 29094 | Risk Ratio (IV, Random, 95% CI) | 0.99 [0.86, 1.13] |
| 4 Cardiovascular mortality | 6 | 23673 | Risk Ratio (IV, Random, 95% CI) | 1.19 [0.73, 1.92] |
| 5 Sudden death | 4 | 5913 | Risk Ratio (IV, Random, 95% CI) | 0.82 [0.26, 2.57] |
| 6 Fatal myocardial infarction | 3 | 14220 | Risk Ratio (IV, Random, 95% CI) | 1.11 [0.76, 1.62] |
| 7 Fatal stroke | 3 | 15909 | Risk Ratio (IV, Random, 95% CI) | 1.11 [0.71, 1.75] |
| 8 Non‐fatal myocardial infarction | 5 | 25596 | Risk Ratio (IV, Random, 95% CI) | 0.82 [0.67, 0.99] |
| 9 Non‐fatal stroke | 5 | 25596 | Risk Ratio (IV, Random, 95% CI) | 0.94 [0.68, 1.31] |
| 10 Onset microalbuminuria | 4 | 19933 | Risk Ratio (IV, Random, 95% CI) | 0.85 [0.77, 0.94] |
| 11 Progression of microalbuminuria | 5 | 13266 | Risk Ratio (IV, Random, 95% CI) | 0.59 [0.38, 0.93] |
| 12 Regression of albuminuria | 1 | Risk Ratio (IV, Random, 95% CI) | Totals not selected | |
| 13 Serum creatinine | 4 | 12718 | Mean Difference (IV, Random, 95% CI) | 0.96 [‐0.42, 2.34] |
| 14 Glomerular filtration rate | 3 | 164 | Mean Difference (IV, Random, 95% CI) | ‐4.86 [‐15.69, 5.96] |
| 15 HbA1c | 5 | 11583 | Mean Difference (IV, Random, 95% CI) | ‐1.38 [‐1.93, ‐0.82] |
Comparison 2. Tight versus non‐tight glycaemic control (subgroup analyses).
| Outcome or subgroup title | No. of studies | No. of participants | Statistical method | Effect size |
|---|---|---|---|---|
| 1 Cardiovascular mortality (age) | 6 | Risk Ratio (IV, Random, 95% CI) | Subtotals only | |
| 1.1 < 60 years | 1 | 160 | Risk Ratio (IV, Random, 95% CI) | 1.0 [0.37, 2.72] |
| 1.2 > 60 years | 5 | 23513 | Risk Ratio (IV, Random, 95% CI) | 1.21 [0.71, 2.07] |
| 2 Cardiovascular mortality (allocation concealment) | 6 | Risk Ratio (IV, Random, 95% CI) | Subtotals only | |
| 2.1 Unclear risk | 1 | 178 | Risk Ratio (IV, Random, 95% CI) | 0.75 [0.17, 3.25] |
| 2.2 Low risk | 5 | 23495 | Risk Ratio (IV, Random, 95% CI) | 1.23 [0.74, 2.06] |
| 3 Cardiovascular mortality (duration of treatment) | 6 | Risk Ratio (IV, Random, 95% CI) | Subtotals only | |
| 3.1 < 60 months | 3 | 10582 | Risk Ratio (IV, Random, 95% CI) | 1.73 [1.04, 2.90] |
| 3.2 > 60 months | 3 | 13091 | Risk Ratio (IV, Random, 95% CI) | 0.91 [0.78, 1.06] |
| 4 Cardiovascular mortality (GFR) | 3 | Risk Ratio (IV, Random, 95% CI) | Subtotals only | |
| 4.1 < 90 mL/min/1.73 m² | 1 | 178 | Risk Ratio (IV, Random, 95% CI) | 0.75 [0.17, 3.25] |
| 4.2 > 90 mL/min/1.73 m² | 2 | 10411 | Risk Ratio (IV, Random, 95% CI) | 1.70 [0.90, 3.21] |
| 5 All‐cause mortality (age) | 9 | Risk Ratio (IV, Random, 95% CI) | Subtotals only | |
| 5.1 < 60 years | 5 | 5723 | Risk Ratio (IV, Random, 95% CI) | 0.88 [0.65, 1.21] |
| 5.2 > 60 years | 4 | 23371 | Risk Ratio (IV, Random, 95% CI) | 1.05 [0.89, 1.24] |
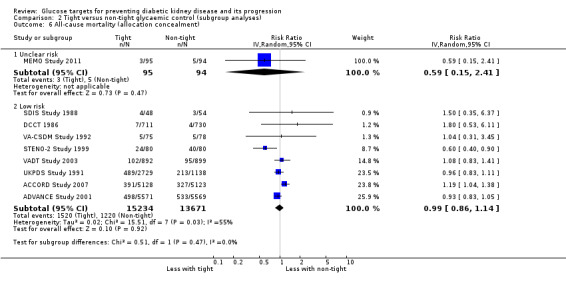
| 6 All‐cause mortality (allocation concealment) | 9 | Risk Ratio (IV, Random, 95% CI) | Subtotals only | |
| 6.1 Unclear risk | 1 | 189 | Risk Ratio (IV, Random, 95% CI) | 0.59 [0.15, 2.41] |
| 6.2 Low risk | 8 | 28905 | Risk Ratio (IV, Random, 95% CI) | 0.99 [0.86, 1.14] |
| 7 All‐cause mortality (duration of treatment) | 9 | Risk Ratio (IV, Random, 95% CI) | Subtotals only | |
| 7.1 < 60 months | 3 | 10593 | Risk Ratio (IV, Random, 95% CI) | 1.18 [1.03, 1.36] |
| 7.2 > 60 months | 6 | 18501 | Risk Ratio (IV, Random, 95% CI) | 0.94 [0.83, 1.07] |
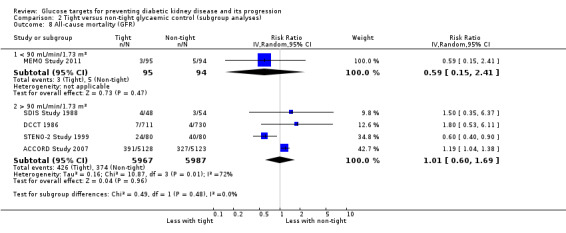
| 8 All‐cause mortality (GFR) | 5 | Risk Ratio (IV, Random, 95% CI) | Subtotals only | |
| 8.1 < 90 mL/min/1.73 m² | 1 | 189 | Risk Ratio (IV, Random, 95% CI) | 0.59 [0.15, 2.41] |
| 8.2 > 90 mL/min/1.73 m² | 4 | 11954 | Risk Ratio (IV, Random, 95% CI) | 1.01 [0.60, 1.69] |
| 9 Non‐fatal myocardial infarction (age) | 5 | Risk Ratio (IV, Random, 95% CI) | Subtotals only | |
| 9.1 < 60 years | 2 | 4027 | Risk Ratio (IV, Random, 95% CI) | 0.54 [0.21, 1.44] |
| 9.2 > 60 years | 3 | 21569 | Risk Ratio (IV, Random, 95% CI) | 0.87 [0.73, 1.03] |
| 10 Non‐fatal myocardial infarction (allocation concealment) | 5 | Risk Ratio (IV, Random, 95% CI) | Subtotals only | |
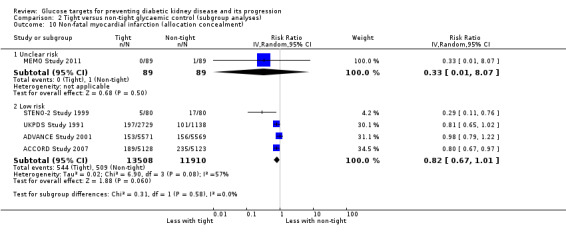
| 10.1 Unclear risk | 1 | 178 | Risk Ratio (IV, Random, 95% CI) | 0.33 [0.01, 8.07] |
| 10.2 Low risk | 4 | 25418 | Risk Ratio (IV, Random, 95% CI) | 0.82 [0.67, 1.01] |
| 11 Non‐fatal myocardial infarction (duration of treatment) | 5 | Risk Ratio (IV, Random, 95% CI) | Subtotals only | |
| 11.1 < 60 months | 2 | 10429 | Risk Ratio (IV, Random, 95% CI) | 0.79 [0.65, 0.95] |
| 11.2 > 60 months | 3 | 15167 | Risk Ratio (IV, Random, 95% CI) | 0.80 [0.57, 1.12] |
| 12 Non‐fatal myocardial infarction (GFR) | 3 | Risk Ratio (IV, Random, 95% CI) | Subtotals only | |
| 12.1 < 90 mL/min/1.73 m² | 1 | 178 | Risk Ratio (IV, Random, 95% CI) | 0.33 [0.01, 8.07] |
| 12.2 > 90 mL/min/1.73 m² | 2 | 10411 | Risk Ratio (IV, Random, 95% CI) | 0.54 [0.21, 1.39] |
2.1. Analysis.
Comparison 2 Tight versus non‐tight glycaemic control (subgroup analyses), Outcome 1 Cardiovascular mortality (age).
2.2. Analysis.
Comparison 2 Tight versus non‐tight glycaemic control (subgroup analyses), Outcome 2 Cardiovascular mortality (allocation concealment).
2.4. Analysis.
Comparison 2 Tight versus non‐tight glycaemic control (subgroup analyses), Outcome 4 Cardiovascular mortality (GFR).
2.5. Analysis.
Comparison 2 Tight versus non‐tight glycaemic control (subgroup analyses), Outcome 5 All‐cause mortality (age).
2.6. Analysis.
Comparison 2 Tight versus non‐tight glycaemic control (subgroup analyses), Outcome 6 All‐cause mortality (allocation concealment).
2.8. Analysis.
Comparison 2 Tight versus non‐tight glycaemic control (subgroup analyses), Outcome 8 All‐cause mortality (GFR).
2.9. Analysis.
Comparison 2 Tight versus non‐tight glycaemic control (subgroup analyses), Outcome 9 Non‐fatal myocardial infarction (age).
2.10. Analysis.
Comparison 2 Tight versus non‐tight glycaemic control (subgroup analyses), Outcome 10 Non‐fatal myocardial infarction (allocation concealment).
2.11. Analysis.

Comparison 2 Tight versus non‐tight glycaemic control (subgroup analyses), Outcome 11 Non‐fatal myocardial infarction (duration of treatment).
2.12. Analysis.

Comparison 2 Tight versus non‐tight glycaemic control (subgroup analyses), Outcome 12 Non‐fatal myocardial infarction (GFR).
Characteristics of studies
Characteristics of included studies [ordered by study ID]
ACCORD Study 2007.
| Methods |
|
|
| Participants |
|
|
| Interventions | Treatment group
Control group
|
|
| Outcomes |
|
|
| Notes |
|
|
| Risk of bias | ||
| Bias | Authors' judgement | Support for judgement |
| Random sequence generation (selection bias) | Low risk | Randomisation sequences were computer generated for every clinical site centrally at the coordinating centre |
| Allocation concealment (selection bias) | Unclear risk | Randomisation was stratified by clinical site with permuted blocks. Methods to assure allocation concealment were not reported. |
| Blinding of participants and personnel (performance bias) All outcomes | High risk | Open‐label |
| Blinding of outcome assessment (detection bias) All outcomes | Low risk | Data on clinical outcomes were adjudicated by a central committee whose members were unaware of study group assignments |
| Incomplete outcome data (attrition bias) All outcomes | Low risk | 50/10251 lost to follow‐up (0.5%) |
| Selective reporting (reporting bias) | Low risk | Important patient‐level outcomes provided |
| Other bias | High risk | Data not independent of sponsor |
ADVANCE Study 2001.
| Methods |
|
|
| Participants |
|
|
| Interventions | Treatment group
Control group
|
|
| Outcomes |
|
|
| Notes |
|
|
| Risk of bias | ||
| Bias | Authors' judgement | Support for judgement |
| Random sequence generation (selection bias) | Low risk | Randomisation was stratified by study centre, history of macrovascular disease, history of microvascular disease, and background use of perindopril at baseline |
| Allocation concealment (selection bias) | Low risk | Study treatments were allocated using a central, computer‐based, randomisation service accessible by Internet, telephone, and facsimile |
| Blinding of participants and personnel (performance bias) All outcomes | Low risk | Double‐blind |
| Blinding of outcome assessment (detection bias) All outcomes | Low risk | An Endpoint Adjudication Committee, masked to treatment allocation, reviewed source documentation for all individuals who had a suspected primary endpoint or who died during follow‐up |
| Incomplete outcome data (attrition bias) All outcomes | Low risk | 15/11140 lost to follow‐up (0.1%) |
| Selective reporting (reporting bias) | Low risk | Important patient‐level outcomes provided |
| Other bias | Low risk | Funded by Servier however "data was collected and retained by investigators and were not made available to the study sponsors" |
Ciavarella 1985.
| Methods |
|
|
| Participants |
|
|
| Interventions | Treatment group
Control group
|
|
| Outcomes |
|
|
| Notes |
|
|
| Risk of bias | ||
| Bias | Authors' judgement | Support for judgement |
| Random sequence generation (selection bias) | Unclear risk | Study was reported as randomised; method of randomisation not reported |
| Allocation concealment (selection bias) | Unclear risk | Insufficient information to permit judgement |
| Blinding of participants and personnel (performance bias) All outcomes | Unclear risk | Insufficient information to permit judgement |
| Blinding of outcome assessment (detection bias) All outcomes | Unclear risk | Insufficient information to permit judgement |
| Incomplete outcome data (attrition bias) All outcomes | High risk | 4 patients were "excluded because of poor compliance" (26%) |
| Selective reporting (reporting bias) | Low risk | All expected outcomes reported |
| Other bias | Unclear risk | Insufficient information to permit judgement |
DCCT 1986.
| Methods |
|
|
| Participants |
|
|
| Interventions | Treatment group
Control group
|
|
| Outcomes |
|
|
| Notes |
|
|
| Risk of bias | ||
| Bias | Authors' judgement | Support for judgement |
| Random sequence generation (selection bias) | Low risk | "For each clinic‐age stratum, a separate randomization sequence was prepared by and secured at the Coordinating Center" |
| Allocation concealment (selection bias) | Low risk | "The Coordinating Center disclosed the random assignment of each patient to the clinic via telephone at the time of randomization" |
| Blinding of participants and personnel (performance bias) All outcomes | Low risk | Double‐blind |
| Blinding of outcome assessment (detection bias) All outcomes | Low risk | All centrally determined outcome measurements |
| Incomplete outcome data (attrition bias) All outcomes | Low risk | 8/1441 lost to follow‐up (0.5%) |
| Selective reporting (reporting bias) | Low risk | Important patient‐level outcomes provided |
| Other bias | Low risk | Study appears free of other biases |
Feldt‐Rasmussen 1986.
| Methods |
|
|
| Participants |
|
|
| Interventions | Treatment group
Control group
|
|
| Outcomes |
|
|
| Notes |
|
|
| Risk of bias | ||
| Bias | Authors' judgement | Support for judgement |
| Random sequence generation (selection bias) | Unclear risk | Insufficient information to permit judgement |
| Allocation concealment (selection bias) | Unclear risk | Insufficient information to permit judgement |
| Blinding of participants and personnel (performance bias) All outcomes | Unclear risk | Insufficient information to permit judgement |
| Blinding of outcome assessment (detection bias) All outcomes | Unclear risk | Not centrally determined outcome measurements |
| Incomplete outcome data (attrition bias) All outcomes | High risk | 5/36 lost to follow‐up (14%) |
| Selective reporting (reporting bias) | Low risk | All expected outcomes reported |
| Other bias | Low risk | Study appears free of other biases |
KUMAMOTO Study 1995.
| Methods |
|
|
| Participants |
|
|
| Interventions | Treatment group
Control group
|
|
| Outcomes |
|
|
| Notes |
|
|
| Risk of bias | ||
| Bias | Authors' judgement | Support for judgement |
| Random sequence generation (selection bias) | Unclear risk | Insufficient information to permit judgement |
| Allocation concealment (selection bias) | Unclear risk | Insufficient information to permit judgement |
| Blinding of participants and personnel (performance bias) All outcomes | Unclear risk | Insufficient information to permit judgement |
| Blinding of outcome assessment (detection bias) All outcomes | Unclear risk | Not centrally determined outcome measurements |
| Incomplete outcome data (attrition bias) All outcomes | Low risk | All patients were included in the analysis |
| Selective reporting (reporting bias) | High risk | Data could not be meta‐analysed |
| Other bias | High risk | Funded by Aventis Pharma |
MEMO Study 2011.
| Methods |
|
|
| Participants |
|
|
| Interventions | Treatment group
Control group
|
|
| Outcomes |
|
|
| Notes |
|
|
| Risk of bias | ||
| Bias | Authors' judgement | Support for judgement |
| Random sequence generation (selection bias) | Unclear risk | Insufficient information to permit judgement |
| Allocation concealment (selection bias) | Unclear risk | Insufficient information to permit judgement |
| Blinding of participants and personnel (performance bias) All outcomes | Unclear risk | Insufficient information to permit judgement |
| Blinding of outcome assessment (detection bias) All outcomes | Low risk | Data was recorded separately and assessed independently by a research physician who was not aware of the study participant’s treatment allocation and was not involved with any aspect of the study |
| Incomplete outcome data (attrition bias) All outcomes | Low risk | 11/189 lost to follow‐up (6%) |
| Selective reporting (reporting bias) | Low risk | All expected outcomes reported |
| Other bias | Low risk | Study appears free of other biases |
OSLO Study 1986.
| Methods |
|
|
| Participants |
|
|
| Interventions | Treatment group 1
Treatment group 2
Control group
|
|
| Outcomes |
|
|
| Notes |
|
|
| Risk of bias | ||
| Bias | Authors' judgement | Support for judgement |
| Random sequence generation (selection bias) | Low risk | Block randomisation |
| Allocation concealment (selection bias) | Unclear risk | Insufficient information to permit judgement |
| Blinding of participants and personnel (performance bias) All outcomes | Unclear risk | Insufficient information to permit judgement |
| Blinding of outcome assessment (detection bias) All outcomes | Unclear risk | Not centrally determined outcome measurements |
| Incomplete outcome data (attrition bias) All outcomes | Unclear risk | Insufficient information to permit judgement |
| Selective reporting (reporting bias) | High risk | Data could not be meta‐analysed |
| Other bias | Unclear risk | Study appears free of other bias |
SDIS Study 1988.
| Methods |
|
|
| Participants |
|
|
| Interventions | Treatment group
Control group
|
|
| Outcomes |
|
|
| Notes |
|
|
| Risk of bias | ||
| Bias | Authors' judgement | Support for judgement |
| Random sequence generation (selection bias) | Unclear risk | Insufficient information to permit judgement |
| Allocation concealment (selection bias) | Low risk | Closed identical envelopes |
| Blinding of participants and personnel (performance bias) All outcomes | Unclear risk | Insufficient information to permit judgement |
| Blinding of outcome assessment (detection bias) All outcomes | Unclear risk | Not centrally determined outcome measurements |
| Incomplete outcome data (attrition bias) All outcomes | Low risk | 6/102 lost to follow‐up (6%) |
| Selective reporting (reporting bias) | Low risk | All outcome data reported |
| Other bias | High risk | Funded by Novo‐Nordisk, Boehringer‐Mannheim Scandinavia |
STENO Study 1982.
| Methods |
|
|
| Participants |
|
|
| Interventions | Treatment group
Control group
|
|
| Outcomes |
|
|
| Notes |
|
|
| Risk of bias | ||
| Bias | Authors' judgement | Support for judgement |
| Random sequence generation (selection bias) | Unclear risk | Insufficient information to permit judgement |
| Allocation concealment (selection bias) | Unclear risk | Insufficient information to permit judgement |
| Blinding of participants and personnel (performance bias) All outcomes | Unclear risk | Insufficient information to permit judgement |
| Blinding of outcome assessment (detection bias) All outcomes | Unclear risk | Not centrally determined outcome measurements |
| Incomplete outcome data (attrition bias) All outcomes | Low risk | 1/32 lost to follow‐up (3%) |
| Selective reporting (reporting bias) | High risk | Data could not be meta‐analysed |
| Other bias | Low risk | Study appears free of other biases |
STENO‐2 Study 1999.
| Methods |
|
|
| Participants |
|
|
| Interventions | Treatment group
Control group
|
|
| Outcomes |
|
|
| Notes |
|
|
| Risk of bias | ||
| Bias | Authors' judgement | Support for judgement |
| Random sequence generation (selection bias) | Low risk | Block randomisation (groups of 4 with 2 in each treatment arm and thus allowed a maximum difference of two patients per group per stratum) |
| Allocation concealment (selection bias) | Low risk | Performed with the use of sealed envelopes |
| Blinding of participants and personnel (performance bias) All outcomes | High risk | Open‐label |
| Blinding of outcome assessment (detection bias) All outcomes | Low risk | All endpoints specified in the protocol were adjudicated by an independent committee whose members were unaware of the patients’ treatment assignments |
| Incomplete outcome data (attrition bias) All outcomes | Unclear risk | 3/160 lost to follow‐up (2%) |
| Selective reporting (reporting bias) | Low risk | Important patient‐level outcomes provided |
| Other bias | High risk | Data not independent of sponsor |
UKPDS Study 1991.
| Methods |
|
|
| Participants |
|
|
| Interventions | Treatment group
Control group
|
|
| Outcomes |
|
|
| Notes |
|
|
| Risk of bias | ||
| Bias | Authors' judgement | Support for judgement |
| Random sequence generation (selection bias) | Low risk | Randomisation was by means of centrally produced, computer‐generated therapy allocations |
| Allocation concealment (selection bias) | Low risk | Sealed opaque envelopes |
| Blinding of participants and personnel (performance bias) All outcomes | Unclear risk | Insufficient information to permit judgement |
| Blinding of outcome assessment (detection bias) All outcomes | Unclear risk | Not centrally determined outcome measurements |
| Incomplete outcome data (attrition bias) All outcomes | Low risk | 47/1148 lost to follow‐up (4%) |
| Selective reporting (reporting bias) | Low risk | All expected outcomes reported |
| Other bias | High risk | Funded by Pharma |
VA‐CSDM Study 1992.
| Methods |
|
|
| Participants |
|
|
| Interventions | Treatment group
Control group
|
|
| Outcomes |
|
|
| Notes |
|
|
| Risk of bias | ||
| Bias | Authors' judgement | Support for judgement |
| Random sequence generation (selection bias) | Low risk | Stratification was done separately for each participating hospital and by status of any known cardiovascular complications at entry |
| Allocation concealment (selection bias) | Low risk | Small balance intervals were used to ensure that an equal number of patients were randomised to each treatment group within each stratum |
| Blinding of participants and personnel (performance bias) All outcomes | Unclear risk | Insufficient information to permit judgement |
| Blinding of outcome assessment (detection bias) All outcomes | Low risk | Data on clinical outcomes were adjudicated by a central committee whose members were unaware of study group assignments |
| Incomplete outcome data (attrition bias) All outcomes | Low risk | 4/153 lost to follow‐up (3%) |
| Selective reporting (reporting bias) | Low risk | All outcome data reported |
| Other bias | Low risk | Funded by Roerig/Pfizer |
VADT Study 2003.
| Methods |
|
|
| Participants |
|
|
| Interventions | Treatment group
Control group
|
|
| Outcomes |
|
|
| Notes |
|
|
| Risk of bias | ||
| Bias | Authors' judgement | Support for judgement |
| Random sequence generation (selection bias) | Low risk | The randomisation codes were generated by the study’s biostatistician at the Hines Cooperative Studies Program Coordinating Center |
| Allocation concealment (selection bias) | Low risk | Patients were randomly assigned with the use of a permuted‐block design with a block size of six and stratified according to study site |
| Blinding of participants and personnel (performance bias) All outcomes | High risk | Open‐label |
| Blinding of outcome assessment (detection bias) All outcomes | Low risk | Outcome was adjudicated by an end‐point committee that was unaware of assignments to study groups |
| Incomplete outcome data (attrition bias) All outcomes | Unclear risk | 115/1791 lost to follow‐up (6%) |
| Selective reporting (reporting bias) | Low risk | Important patient‐level outcomes provided |
| Other bias | High risk | Data not independent of sponsor |
Characteristics of excluded studies [ordered by study ID]
| Study | Reason for exclusion |
|---|---|
| Christiansen 1987 | Outcomes not of interest |
| Holman 1983 | Wrong intervention: not glucose target |
| Kawamori 1991 | Wrong intervention: not glucose target |
| Wiseman 1985 | Outcomes not of interest |
Contributions of authors
Draft the protocol: MR, VS, SP, SDC, AP, OL, MC, PF, MV, JCC, GFMS
Study selection: AP, MR, SP
Extract data from studies: AP, MR, VS
Enter data into RevMan: MR, SP
Carry out the analysis: MR, SP, VS
Interpret the analysis: MR, SP, VS, GFMS
Draft the final review: MR, VS, SP, SDC, AP, OL, MC, PF, MV, JCC, GFMS
Disagreement resolution: GFMS
Update the review: MR, SP
Declarations of interest
None known.
New
References
References to studies included in this review
ACCORD Study 2007 {published data only}
- ACCORD Study Group, ACCORD Eye Study Group, Chew EY, Ambrosius WT, Davis MD, Danis RP, et al. Effects of medical therapies on retinopathy progression in type 2 diabetes.[Erratum appears in N Engl J Med. 2011 Jan 13;364(2):190], [Erratum appears in N Engl J Med. 2012 Dec 20;367(25):2458]. New England Journal of Medicine 2010;363(3):233‐44. [MEDLINE: ] [DOI] [PMC free article] [PubMed] [Google Scholar]
- ACCORD Study Group, Buse JB, Bigger JT, Byington RP, Cooper LS, Cushman WC, et al. Action to Control Cardiovascular Risk in Diabetes (ACCORD) trial: design and methods. American Journal of Cardiology 2007;99(12A):21i‐33i. [MEDLINE: ] [DOI] [PubMed] [Google Scholar]
- ACCORD Study Group, Cushman WC, Evans GW, Byington RP, Goff DC Jr, Grimm RH Jr, et al. Effects of intensive blood‐pressure control in type 2 diabetes mellitus. New England Journal of Medicine 2010;362(17):1575‐85. [MEDLINE: ] [DOI] [PMC free article] [PubMed] [Google Scholar]
- ACCORD Study Group, Gerstein HC, Miller ME, Genuth S, Ismail‐Beigi F, Buse JB, et al. Long‐term effects of intensive glucose lowering on cardiovascular outcomes. New England Journal of Medicine 2011;364(9):818‐28. [MEDLINE: ] [DOI] [PMC free article] [PubMed] [Google Scholar]
- ACCORD Study Group, Ginsberg HN, Elam MB, Lovato LC, Crouse JR 3rd, Leiter LA, et al. Effects of combination lipid therapy in type 2 diabetes mellitus.[Erratum appears in N Engl J Med. 2010 May 6;362(18):1748]. New England Journal of Medicine 2010;362(17):1563‐74. [MEDLINE: ] [DOI] [PMC free article] [PubMed] [Google Scholar]
- Action to Control Cardiovascular Risk in Diabetes Study Group, Gerstein HC, Miller ME, Byington RP, Goff DC Jr, Bigger JT, et al. Effects of intensive glucose lowering in type 2 diabetes. New England Journal of Medicine 2008;358(24):2545‐59. [MEDLINE: ] [DOI] [PMC free article] [PubMed] [Google Scholar]
- Barzilay JI, Howard AG, Evans GW, Fleg JL, Cohen RM, Booth GL, et al. Intensive blood pressure treatment does not improve cardiovascular outcomes in centrally obese hypertensive individuals with diabetes: the Action to Control Cardiovascular Risk in Diabetes (ACCORD) Blood Pressure Trial. Diabetes Care 2012;35(7):1401‐5. [MEDLINE: ] [DOI] [PMC free article] [PubMed] [Google Scholar]
- Barzilay JI, Lovato JF, Murray AM, Williamson J, Ismail‐Beigi F, Karl D, et al. Albuminuria and cognitive decline in people with diabetes and normal renal function. Clinical Journal of the American Society of Nephrology: CJASN 2013;8(11):1907‐14. [MEDLINE: ] [DOI] [PMC free article] [PubMed] [Google Scholar]
- Bonds DE, Craven TE, Buse J, Crouse JR, Cuddihy R, Elam M, et al. Fenofibrate‐associated changes in renal function and relationship to clinical outcomes among individuals with type 2 diabetes: the Action to Control Cardiovascular Risk in Diabetes (ACCORD) experience. Diabetologia 2012;55(6):1641‐50. [MEDLINE: ] [DOI] [PMC free article] [PubMed] [Google Scholar]
- Bonds DE, Kurashige EM, Bergenstal R, Brillon D, Domanski M, Felicetta JV, et al. Severe hypoglycemia monitoring and risk management procedures in the Action to Control Cardiovascular Risk in Diabetes (ACCORD) trial. American Journal of Cardiology 2007;99(12A):80i‐9i. [MEDLINE: ] [DOI] [PubMed] [Google Scholar]
- Bonds DE, Miller ME, Bergenstal RM, Buse JB, Byington RP, Cutler JA, et al. The association between symptomatic, severe hypoglycaemia and mortality in type 2 diabetes: retrospective epidemiological analysis of the ACCORD study. BMJ 2010;340:b4909. [MEDLINE: ] [DOI] [PMC free article] [PubMed] [Google Scholar]
- Bonds DE, Miller ME, Dudl J, Feinglos M, Ismail‐Beigi F, Malozowski S, et al. Severe hypoglycemia symptoms, antecedent behaviors, immediate consequences and association with glycemia medication usage: Secondary analysis of the ACCORD clinical trial data. BMC Endocrine Disorders 2012;12:5. [MEDLINE: ] [DOI] [PMC free article] [PubMed] [Google Scholar]
- Chew EY, Ambrosius WT, Howard LT, Greven CM, Johnson S, Danis RP, et al. Rationale, design, and methods of the Action to Control Cardiovascular Risk in Diabetes Eye Study (ACCORD‐EYE). American Journal of Cardiology 2007;99(12A):103i‐11i. [MEDLINE: ] [DOI] [PubMed] [Google Scholar]
- Cushman WC, Grimm RH Jr, Cutler JA, Evans GW, Capes S, Corson MA, et al. Rationale and design for the blood pressure intervention of the Action to Control Cardiovascular Risk in Diabetes (ACCORD) trial. American Journal of Cardiology 2007;99(12A):44i‐55i. [MEDLINE: ] [DOI] [PubMed] [Google Scholar]
- Fatemi O, Yuriditsky E, Tsioufis C, Tsachris D, Morgan T, Basile J, et al. Impact of intensive glycemic control on the incidence of atrial fibrillation and associated cardiovascular outcomes in patients with type 2 diabetes mellitus (from the Action to Control Cardiovascular Risk in Diabetes Study). American Journal of Cardiology 2014;114(8):1217‐22. [MEDLINE: ] [DOI] [PMC free article] [PubMed] [Google Scholar]
- Fonseca V, McDuffie R, Calles J, Cohen RM, Feeney P, Feinglos M, et al. Determinants of weight gain in the action to control cardiovascular risk in diabetes trial. Diabetes Care 2013;36(8):2162‐8. [MEDLINE: ] [DOI] [PMC free article] [PubMed] [Google Scholar]
- Genuth S, Ismail‐Beigi F. Clinical implications of the ACCORD trial. Journal of Clinical Endocrinology & Metabolism 2012;97(1):41‐8. [MEDLINE: ] [DOI] [PubMed] [Google Scholar]
- Gerstein HC, Ambrosius WT, Danis R, Ismail‐Beigi F, Cushman W, Calles J, et al. Diabetic retinopathy, its progression, and incident cardiovascular events in the ACCORD trial. Diabetes Care 2013;36(5):1266‐71. [MEDLINE: ] [DOI] [PMC free article] [PubMed] [Google Scholar]
- Gerstein HC, Miller ME, Ismail‐Beigi F, Largay J, McDonald C, Lochnan HA, et al. Effects of intensive glycaemic control on ischaemic heart disease: analysis of data from the randomised, controlled ACCORD trial. Lancet 2014;384(9958):1936‐41. [MEDLINE: ] [DOI] [PMC free article] [PubMed] [Google Scholar]
- Gerstein HC, Riddle MC, Kendall DM, Cohen RM, Goland R, Feinglos MN, et al. Glycemia treatment strategies in the Action to Control Cardiovascular Risk in Diabetes (ACCORD) trial. American Journal of Cardiology 2007;99(12A):34i‐43i. [MEDLINE: ] [DOI] [PubMed] [Google Scholar]
- Ginsberg HN, Bonds DE, Lovato LC, Crouse JR, Elam MB, Linz PE, et al. Evolution of the lipid trial protocol of the Action to Control Cardiovascular Risk in Diabetes (ACCORD) trial. American Journal of Cardiology 2007;99(12A):56i‐67i. [MEDLINE: ] [DOI] [PubMed] [Google Scholar]
- Goff DC Jr, Gerstein HC, Ginsberg HN, Cushman WC, Margolis KL, Byington RP, et al. Prevention of cardiovascular disease in persons with type 2 diabetes mellitus: current knowledge and rationale for the Action to Control Cardiovascular Risk in Diabetes (ACCORD) trial. American Journal of Cardiology 2007;99(12A):4i‐20i. [MEDLINE: ] [DOI] [PubMed] [Google Scholar]
- Isakova T, Craven TE, Scialla JJ, Nickolas TL, Schnall A, Barzilay J, et al. Change in estimated glomerular filtration rate and fracture risk in the Action to Control Cardiovascular Risk in Diabetes Trial. Bone 2015;78:23‐7. [MEDLINE: ] [DOI] [PMC free article] [PubMed] [Google Scholar]
- Ismail‐Beigi F, Craven T, Banerji MA, Basile J, Calles J, Cohen RM, et al. Effect of intensive treatment of hyperglycaemia on microvascular outcomes in type 2 diabetes: an analysis of the ACCORD randomised trial.[Erratum appears in Lancet. 2010 Oct 30;376(9751):1466]. Lancet 2010;376(9739):419‐30. [MEDLINE: ] [DOI] [PMC free article] [PubMed] [Google Scholar]
- Ismail‐Beigi F, Craven TE, O'Connor PJ, Karl D, Calles‐Escandon J, Hramiak I, et al. Combined intensive blood pressure and glycemic control does not produce an additive benefit on microvascular outcomes in type 2 diabetic patients. Kidney International 2012;81(6):586‐94. [MEDLINE: ] [DOI] [PMC free article] [PubMed] [Google Scholar]
- Kingry C, Bastien A, Booth G, Geraci TS, Kirpach BR, Lovato LC, et al. Recruitment strategies in the Action to Control Cardiovascular Risk in Diabetes (ACCORD) trial. American Journal of Cardiology 2007;99(12A):68i‐79i. [MEDLINE: ] [DOI] [PubMed] [Google Scholar]
- Linz PE, Lovato LC, Byington RP, O'Connor PJ, Leiter LA, Weiss D, et al. Paradoxical reduction in HDL‐C with fenofibrate and thiazolidinedione therapy in type 2 diabetes: the ACCORD Lipid Trial. Diabetes Care 2014;37(3):686‐93. [MEDLINE: ] [DOI] [PMC free article] [PubMed] [Google Scholar]
- Margolis KL, O'Connor PJ, Morgan TM, Buse JB, Cohen RM, Cushman WC, et al. Outcomes of combined cardiovascular risk factor management strategies in type 2 diabetes: the ACCORD randomized trial. Diabetes Care 2014;37(6):1721‐8. [MEDLINE: ] [DOI] [PMC free article] [PubMed] [Google Scholar]
- Meier M, Hummel M. Cardiovascular disease and intensive glucose control in type 2 diabetes mellitus: moving practice toward evidence‐based strategies. Vascular Health & Risk Management 2009;5:859‐71. [MEDLINE: ] [DOI] [PMC free article] [PubMed] [Google Scholar]
- Miller ME, Bonds DE, Gerstein HC, Seaquist ER, Bergenstal RM, Calles‐Escandon J, et al. The effects of baseline characteristics, glycaemia treatment approach, and glycated haemoglobin concentration on the risk of severe hypoglycaemia: post hoc epidemiological analysis of the ACCORD study. BMJ 2010;340:b5444. [MEDLINE: ] [DOI] [PMC free article] [PubMed] [Google Scholar]
- Miller ME, Williamson JD, Gerstein HC, Byington RP, Cushman WC, Ginsberg HN, et al. Effects of randomization to intensive glucose control on adverse events, cardiovascular disease, and mortality in older versus younger adults in the ACCORD Trial. Diabetes Care 2014;37(3):634‐43. [MEDLINE: ] [DOI] [PMC free article] [PubMed] [Google Scholar]
- Mottl AK, Pajewski N, Fonseca V, Ismail‐Beigi F, Chew E, Ambrosius WT, et al. The degree of retinopathy is equally predictive for renal and macrovascular outcomes in the ACCORD Trial. Journal of Diabetes & its Complications 2014;28(6):874‐9. [MEDLINE: ] [DOI] [PMC free article] [PubMed] [Google Scholar]
- Mychaleckyj JC, Craven T, Nayak U, Buse J, Crouse JR, Elam M, et al. Reversibility of fenofibrate therapy‐induced renal function impairment in ACCORD type 2 diabetic participants. Diabetes Care 2012;35(5):1008‐14. [MEDLINE: ] [DOI] [PMC free article] [PubMed] [Google Scholar]
- Mychaleckyj JC, Farber EA, Chmielewski J, Artale J, Light LS, Bowden DW, et al. Buffy coat specimens remain viable as a DNA source for highly multiplexed genome‐wide genetic tests after long term storage. Journal of Translational Medicine 2011;9:91. [MEDLINE: ] [DOI] [PMC free article] [PubMed] [Google Scholar]
- Nadkarni GN, Rao V, Ismail‐Beigi F, Fonseca VA, Shah SV, Simonson MS, et al. Association of urinary biomarkers of inflammation, injury, and fibrosis with renal function decline: The ACCORD Trial. Clinical Journal of the American Society of Nephrology: CJASN 2016;11(8):1343‐52. [MEDLINE: ] [DOI] [PMC free article] [PubMed] [Google Scholar]
- Papademetriou V, Lovato L, Doumas M, Nylen E, Mottl A, Cohen RM, et al. Chronic kidney disease and intensive glycemic control increase cardiovascular risk in patients with type 2 diabetes. Kidney International 2015;87(3):649‐59. [MEDLINE: ] [DOI] [PubMed] [Google Scholar]
- Pop‐Busui R, Evans GW, Gerstein HC, Fonseca V, Fleg JL, Hoogwerf BJ, et al. Effects of cardiac autonomic dysfunction on mortality risk in the Action to Control Cardiovascular Risk in Diabetes (ACCORD) trial. Diabetes Care 2010;33(7):1578‐84. [MEDLINE: ] [DOI] [PMC free article] [PubMed] [Google Scholar]
- Punthakee Z, Miller ME, Launer LJ, Williamson JD, Lazar RM, Cukierman‐Yaffee T, et al. Poor cognitive function and risk of severe hypoglycemia in type 2 diabetes: post hoc epidemiologic analysis of the ACCORD trial. Diabetes Care 2012;35(4):787‐93. [MEDLINE: ] [DOI] [PMC free article] [PubMed] [Google Scholar]
- Raisch DW, Feeney P, Goff DC Jr, Narayan KM, O'Connor PJ, Zhang P, et al. Baseline comparison of three health utility measures and the feeling thermometer among participants in the Action to Control Cardiovascular Risk in Diabetes trial. Cardiovascular Diabetology 2012;11:35. [MEDLINE: ] [DOI] [PMC free article] [PubMed] [Google Scholar]
- Reyes‐Soffer G, Ngai CI, Lovato L, Karmally W, Ramakrishnan R, Holleran S, et al. Effect of combination therapy with fenofibrate and simvastatin on postprandial lipemia in the ACCORD lipid trial. Diabetes Care 2013;36(2):422‐8. [MEDLINE: ] [DOI] [PMC free article] [PubMed] [Google Scholar]
- Riddle MC, Ambrosius WT, Brillon DJ, Buse JB, Byington RP, Cohen RM, et al. Epidemiologic relationships between A1C and all‐cause mortality during a median 3.4‐year follow‐up of glycemic treatment in the ACCORD trial. Diabetes Care 2010;33(5):983‐90. [MEDLINE: ] [DOI] [PMC free article] [PubMed] [Google Scholar]
- Samaropoulos XF, Light L, Ambrosius WT, Marcovina SM, Probstfield J, Jr DC. The effect of intensive risk factor management in type 2 diabetes on inflammatory biomarkers. Diabetes Research & Clinical Practice 2012;95(3):389‐98. [MEDLINE: ] [DOI] [PubMed] [Google Scholar]
- Seaquist ER, Miller ME, Bonds DE, Feinglos M, Goff DC Jr, Peterson K, et al. The impact of frequent and unrecognized hypoglycemia on mortality in the ACCORD study. Diabetes Care 2012;35(2):409‐14. [MEDLINE: ] [DOI] [PMC free article] [PubMed] [Google Scholar]
- Strylewicz G, Doctor J. Evaluation of an automated method to assist with error detection in the ACCORD central laboratory. Clinical Trials 2010;7(4):380‐9. [MEDLINE: ] [DOI] [PubMed] [Google Scholar]
- Sullivan MD, Anderson RT, Aron D, Atkinson HH, Bastien A, Chen GJ, et al. Health‐related quality of life and cost‐effectiveness components of the Action to Control Cardiovascular Risk in Diabetes (ACCORD) trial: rationale and design. American Journal of Cardiology 2007;99(12A):90i‐102i. [MEDLINE: ] [DOI] [PubMed] [Google Scholar]
- Sullivan MD, O'Connor P, Feeney P, Hire D, Simmons DL, Raisch DW, et al. Depression predicts all‐cause mortality: epidemiological evaluation from the ACCORD HRQL substudy. Diabetes Care 2012;35(8):1708‐15. [MEDLINE: ] [DOI] [PMC free article] [PubMed] [Google Scholar]
- Thethi T, Rajapurkar M, Walker P, McDuffie R, Goff DC Jr, Probstfield J, et al. Urinary catalytic iron in patients with type 2 diabetes without microalbuminuria‐‐a substudy of the ACCORD Trial. Clinical Chemistry 2011;57(2):341‐4. [MEDLINE: ] [DOI] [PubMed] [Google Scholar]
- Williamson JD, Launer LJ, Bryan RN, Coker LH, Lazar RM, Gerstein HC, et al. Cognitive function and brain structure in persons with type 2 diabetes mellitus after intensive lowering of blood pressure and lipid levels: a randomized clinical trial. JAMA Internal Medicine 2014;174(3):324‐33. [MEDLINE: ] [DOI] [PMC free article] [PubMed] [Google Scholar]
- Williamson JD, Miller ME, Bryan RN, Lazar RM, Coker LH, Johnson J, et al. The Action to Control Cardiovascular Risk in Diabetes Memory in Diabetes Study (ACCORD‐MIND): rationale, design, and methods. American Journal of Cardiology 2007;99(12A):112i‐22i. [MEDLINE: ] [DOI] [PubMed] [Google Scholar]
ADVANCE Study 2001 {published and unpublished data}
- Rationale and design of the ADVANCE study: a randomised trial of blood pressure lowering and intensive glucose control in high‐risk individuals with type 2 diabetes mellitus. Action in Diabetes and Vascular Disease: Preterax and diamicron modified‐release controlled evaluation. Journal of Hypertension ‐ Supplement 2001;19(4):S21‐8. [MEDLINE: ] [PubMed] [Google Scholar]
- ADVANCE Collaborative Group. ADVANCE‐‐Action in Diabetes and Vascular Disease: patient recruitment and characteristics of the study population at baseline. Diabetic Medicine 2005;22(7):882‐8. [MEDLINE: ] [DOI] [PubMed] [Google Scholar]
- ADVANCE Collaborative Group, Patel A, MacMahon S, Chalmers J, Neal B, Billot L, et al. Intensive blood glucose control and vascular outcomes in patients with type 2 diabetes. New England Journal of Medicine 2008;358(24):2560‐72. [MEDLINE: ] [DOI] [PubMed] [Google Scholar]
- ADVANCE Management Committee. Study rationale and design of ADVANCE: action in diabetes and vascular disease‐‐Preterax and Diamicron MR Controlled Evaluation. Diabetologia 2001;44(9):1118‐20. [MEDLINE: ] [DOI] [PubMed] [Google Scholar]
- Blomster JI, Woodward M, Zoungas S, Hillis GS, Harrap S, Neal B, et al. The harms of smoking and benefits of smoking cessation in women compared with men with type 2 diabetes: an observational analysis of the ADVANCE (Action in Diabetes and Vascular Disease: Preterax and Diamicron modified release Controlled Evaluation) trial. BMJ Open 2016;6(1):e009668. [MEDLINE: ] [DOI] [PMC free article] [PubMed] [Google Scholar]
- Chalmers J. ADVANCE study: objectives, design and current status [Etude ADVANCE: objectifs, protocole et etat actuel]. Drugs 2003;63(Spec No 1):39‐44. [MEDLINE: ] [PubMed] [Google Scholar]
- Chalmers J, Marre M, Galan BE, Zoungas S, Hamet P, Neal B, et al. The efficacy of lowering HbAlc with a gliclazide modified release‐based intensive glucose lowering regimen in the ADVANCE trial [abstract]. Diabetologia 2009;52(Suppl 1):S354. [EMBASE: 70068392] [Google Scholar]
- Chalmers J, Perkovic V, Joshi R, Patel A. ADVANCE: breaking new ground in type 2 diabetes. Journal of Hypertension ‐ Supplement 2006;24(5):S22‐S8. [MEDLINE: ] [DOI] [PubMed] [Google Scholar]
- Cooper ME, Zoungas S, Jardine M, Hata J, Perkovic V, Ninomiya T, et al. Risk of major renal events in people with type 2 diabetes: prediction models based on the ADVANCE study population [abstract]. Diabetologia 2011;54(1 Suppl):S442. [EMBASE: 70563236] [Google Scholar]
- Hata J, Arima H, Rothwell PM, Woodward M, Zoungas S, Anderson C, et al. Effects of visit‐to‐visit variability in systolic blood pressure on macrovascular and microvascular complications in patients with type 2 diabetes mellitus: the ADVANCE trial. Circulation 2013;128(12):1325‐34. [MEDLINE: ] [DOI] [PubMed] [Google Scholar]
- Heerspink HJ, Ninomiya T, Perkovic V, Woodward M, Zoungas S, Cass A, et al. Effects of a fixed combination of perindopril and indapamide in patients with type 2 diabetes and chronic kidney disease. European Heart Journal 2010;31(23):2888‐96. [MEDLINE: ] [DOI] [PubMed] [Google Scholar]
- Jardine M, Ninomiya T, Perkovic V, Woodward M, Pillai A, Cass A, et al. Predictive baseline factors for major renal events: a proportional hazards model based on the ADVANCE Study [abstract no: F‐PO1916]. Journal of the American Society of Nephrology 2008;19(Abstracts Issue):543A. [CENTRAL: CN‐00724903] [Google Scholar]
- Jardine MJ, Hata J, Woodward M, Perkovic V, Ninomiya T, Arima H, et al. Prediction of kidney‐related outcomes in patients with type 2 diabetes. American Journal of Kidney Diseases 2012;60(5):770‐8. [MEDLINE: ] [DOI] [PubMed] [Google Scholar]
- Mohammedi K, Woodward M, Hirakawa Y, Zoungas S, Colagiuri S, Hamet P, et al. Presentations of major peripheral arterial disease and risk of major outcomes in patients with type 2 diabetes: results from the ADVANCE‐ON study. Cardiovascular Diabetology 2016;15(1):129. [MEDLINE: ] [DOI] [PMC free article] [PubMed] [Google Scholar]
- Ninomiya T, Zoungas S, Neal B, Woodward M, Patel A, Perkovic V, et al. Efficacy and safety of routine blood pressure lowering in older patients with diabetes: results from the ADVANCE trial. Journal of Hypertension 2010;28(6):1141‐9. [MEDLINE: ] [PubMed] [Google Scholar]
- Patel A, ADVANCE Collaborative Group, MacMahon S, Chalmers J, Neal B, Woodward M, et al. Effects of a fixed combination of perindopril and indapamide on macrovascular and microvascular outcomes in patients with type 2 diabetes mellitus (the ADVANCE trial): a randomised controlled trial. Lancet 2007;370(9590):829‐40. [MEDLINE: ] [DOI] [PubMed] [Google Scholar]
- Patel A, Chalmers J, Poulter N. ADVANCE: action in diabetes and vascular disease. Journal of Human Hypertension 2005;19 Suppl 1:S27‐32. [MEDLINE: ] [DOI] [PubMed] [Google Scholar]
- Perkovic V, Heerspink HL, Chalmers J, Woodward M, Jun M, Li Q, et al. Intensive glucose control improves kidney outcomes in patients with type 2 diabetes. Kidney International 2013;83(3):517‐23. [MEDLINE: ] [DOI] [PubMed] [Google Scholar]
- Perkovic V, Ninomiya T, Galan BE, Zoungas S, Cass A, Patel A, et al. Joint effects of routine blood pressure lowering and intensive glucose control in the ADVANCE trial [abstract no: LB‐002]. American Society of Nephrology (ASN) Renal Week; 2008 Nov 4‐9; Philadelphia, PA. 2008. [CENTRAL: CN‐00740604]
- Perkovic V, Zoungas S, Heerspink HL, Woodward M, Jun M, Cass A, et al. Intensive glucose lowering and end stage kidney disease ‐ new data from the ADVANCE trial [abstract no: 071]. Nephrology 2011;16(Suppl 1):42. [EMBASE: 70532419] [Google Scholar]
- Perkovic V, Galan B, Chalmers J, Ninomiya T, Patel A, Cass A, et al. Renoprotection with perindopril‐indapamide below current recommended blood pressure targets in patients with type 2 diabetes mellitus: results of the ADVANCE trial [abstract no: 085]. Nephrology 2008;13(Suppl 3):A121. [CENTRAL: CN‐00740462] [Google Scholar]
- Poulter NR. Blood pressure and glucose control in subjects with diabetes: new analyses from ADVANCE. Journal of Hypertension ‐ Supplement 2009;27(1):S3‐8. [MEDLINE: ] [DOI] [PubMed] [Google Scholar]
- Wong G, Zoungas S, Lo S, Chalmers J, Cass A, Neal B, et al. The risk of cancer in people with diabetes and chronic kidney disease. Nephrology Dialysis Transplantation 2012;27(8):3337‐44. [MEDLINE: ] [DOI] [PubMed] [Google Scholar]
- Wong MG, Perkovic V, Chalmers J, Woodward M, Li Q, Cooper ME, et al. Long‐term benefits of intensive glucose control for preventing end‐stage kidney disease: ADVANCE‐ON. Diabetes Care 2016;39(5):694‐700. [MEDLINE: ] [DOI] [PubMed] [Google Scholar]
- Zoungas S, Chalmers J, Ninomiya T, Li Q, Cooper ME, Colagiuri S, et al. Association of HbA1c levels with vascular complications and death in patients with type 2 diabetes: evidence of glycaemic thresholds. Diabetologia 2012;55(3):636‐43. [MEDLINE: ] [DOI] [PubMed] [Google Scholar]
- Zoungas S, Lambers Heerspink HJ, Chalmers J, Woodward M, Jun M, Cass A, et al. Intensive glucose lowering and end stage kidney disease: new data from the ADVANCE trial [abstract]. Diabetologia 2011;54(1 Suppl):S23. [EMBASE: 70562184] [Google Scholar]
- Zoungas S, Patel A, Chalmers J, Galan BE, Li Q, Billot L, et al. Severe hypoglycemia and risks of vascular events and death. New England Journal of Medicine 2010;363(15):1410‐8. [MEDLINE: ] [DOI] [PubMed] [Google Scholar]
- Zoungas S, Perkovic V, Ninomiya T, Galan BE, Pillai I, Patel A, et al. Joint effects of blood pressure lowering and glucose control in the ADVANCE trial [abstract]. Hypertension 2009;53(6):1103. [EMBASE: 70036220] [Google Scholar]
- Zoungas S, Galan BE, Ninomiya T, Grobbee D, Hamet P, Heller S, et al. Combined effects of routine blood pressure lowering and intensive glucose control on macrovascular and microvascular outcomes in patients with type 2 diabetes: new results from the ADVANCE trial. Diabetes Care 2009;32(11):2068‐74. [MEDLINE: ] [DOI] [PMC free article] [PubMed] [Google Scholar]
- Galan BE, Ninomiya T, Perrovic V, Pillai A, Patel A, Neal ACB, et al. Renoprotective effects of blood pressure lowering with perindopril‐indapamide below current targets in people with type 2 diabetes mellitus: Results of the ADVANCE trial [abstract]. Diabetes 2008;57(Suppl 1):A218‐9. [CENTRAL: CN‐00757885] [Google Scholar]
- Galan BE, Perkovic V, Ninomiya T, Pillai A, Patel A, Cass A, et al. Lowering blood pressure reduces renal events in type 2 diabetes. Journal of the American Society of Nephrology 2009;20(4):883‐92. [MEDLINE: ] [DOI] [PMC free article] [PubMed] [Google Scholar]
Ciavarella 1985 {published data only}
- Ciavarella A, Vannini P, Flammini M, Bacci L, Forlani G, Borgnino LC. Effect of long‐term near‐normoglycemia on the progression of diabetic nephropathy. Diabete et Metabolisme 1985;11(1):3‐8. [MEDLINE: ] [PubMed] [Google Scholar]
DCCT 1986 {published data only}
- Diabetes Control and Complications Trial (DCCT). Design and methodologic considerations for the feasibility phase. The DCCT Research Group. Diabetes 1986;35(5):530‐45. [MEDLINE: ] [PubMed] [Google Scholar]
- Diabetes Control and Complications Trial (DCCT). Update. DCCT Research Group. Diabetes Care 1990;13(4):427‐33. [MEDLINE: ] [DOI] [PubMed] [Google Scholar]
- Diabetes Control and Complications Trial (DCCT): results of feasibility study. The DCCT Research Group. Diabetes Care 1987;10(1):1‐19. [MEDLINE: ] [DOI] [PubMed] [Google Scholar]
- Effect of intensive diabetes treatment on the development and progression of long‐term complications in adolescents with insulin‐dependent diabetes mellitus: Diabetes Control and Complications Trial. Diabetes Control and Complications Trial Research Group. Journal of Pediatrics 1994;125(2):177‐88. [MEDLINE: ] [DOI] [PubMed] [Google Scholar]
- Effect of intensive therapy on the development and progression of diabetic nephropathy in the Diabetes Control and Complications Trial. The Diabetes Control and Complications (DCCT) Research Group. Kidney International 1995;47(6):1703‐20. [MEDLINE: ] [DOI] [PubMed] [Google Scholar]
- Retinopathy and nephropathy in patients with type 1 diabetes four years after a trial of intensive therapy. The Diabetes Control and Complications Trial/Epidemiology of Diabetes Interventions and Complications Research Group.[Erratum appears in N Engl J Med 2000 May 4;342(18):1376]. New England Journal of Medicine 2000;342(6):381‐9. [MEDLINE: ] [Google Scholar]
- The effect of intensive treatment of diabetes on the development and progression of long‐term complications in insulin‐dependent diabetes mellitus. The Diabetes Control and Complications Trial Research Group. New England Journal of Medicine 1993;329(14):977‐86. [MEDLINE: ] [DOI] [PubMed] [Google Scholar]
- Al‐Kateb H, Boright AP, Mirea L, Xie X, Sutradhar R, Mowjoodi A, et al. Multiple superoxide dismutase 1/splicing factor serine alanine 15 variants are associated with the development and progression of diabetic nephropathy: the Diabetes Control and Complications Trial/Epidemiology of Diabetes Interventions and Complications Genetics study. Diabetes 2008;57(1):218‐28. [MEDLINE: ] [DOI] [PMC free article] [PubMed] [Google Scholar]
- DCCT/EDIC Research Group. Effect of intensive diabetes treatment on albuminuria in type 1 diabetes: long‐term follow‐up of the Diabetes Control and Complications Trial and Epidemiology of Diabetes Interventions and Complications study. The Lancet Diabetes & Endocrinology 2014;2(10):793‐800. [MEDLINE: ] [DOI] [PMC free article] [PubMed] [Google Scholar]
- DCCT/EDIC Research Group, Aiello LP, Sun W, Das A, Gangaputra S, Kiss S, et al. Intensive diabetes therapy and ocular surgery in type 1 diabetes. New England Journal of Medicine 2015;372(18):1722‐33. [MEDLINE: ] [DOI] [PMC free article] [PubMed] [Google Scholar]
- DCCT/EDIC Research Group, Boer IH, Sun W, Cleary PA, Lachin JM, Molitch ME, et al. Intensive diabetes therapy and glomerular filtration rate in type 1 diabetes. New England Journal of Medicine 2011;365(25):2366‐76. [MEDLINE: ] [DOI] [PMC free article] [PubMed] [Google Scholar]
- Diabetes Control and Complications Trial/Epidemiology of Diabetes Interventions and Complications (DCCT/EDIC) Research Group, Nathan DM, Zinman B, Cleary PA, Backlund JY, Genuth S, et al. Modern‐day clinical course of type 1 diabetes mellitus after 30 years' duration: the diabetes control and complications trial/epidemiology of diabetes interventions and complications and Pittsburgh epidemiology of diabetes complications experience (1983‐2005). Archives of Internal Medicine 2009;169(14):1307‐16. [MEDLINE: ] [DOI] [PMC free article] [PubMed] [Google Scholar]
- Gai N, Turkbey EB, Nazarian S, Geest RJ, Liu CY, Lima JA, et al. T1 mapping of the gadolinium‐enhanced myocardium: adjustment for factors affecting interpatient comparison. Magnetic Resonance in Medicine 2011;65(5):1407‐15. [MEDLINE: ] [DOI] [PMC free article] [PubMed] [Google Scholar]
- Gubitosi‐Klug RA, DCCT/EDIC Research Group. The diabetes control and complications trial/epidemiology of diabetes interventions and complications study at 30 years: summary and future directions. Diabetes Care 2014;37(1):44‐9. [MEDLINE: ] [DOI] [PMC free article] [PubMed] [Google Scholar]
- Hoeldtke RD, Hampe CS, Bekris LM, Hobbs G, Bryner KD, Lernmark A, et al. Antibodies to GAD65 and peripheral nerve function in the DCCT. Journal of Neuroimmunology 2007;185(1‐2):182‐9. [MEDLINE: ] [DOI] [PubMed] [Google Scholar]
- Jacobson AM, Braffett BH, Cleary PA, Gubitosi‐Klug RA, Larkin ME, DCCT/EDIC Research Group. The long‐term effects of type 1 diabetes treatment and complications on health‐related quality of life: a 23‐year follow‐up of the Diabetes Control and Complications/Epidemiology of Diabetes Interventions and Complications cohort. Diabetes Care 2013;36(10):3131‐8. [MEDLINE: ] [DOI] [PMC free article] [PubMed] [Google Scholar]
- Jenkins AJ, Yu J, Alaupovic P, Basu A, Klein RL, Lopes‐Virella M, et al. Apolipoprotein‐defined lipoproteins and apolipoproteins: associations with abnormal albuminuria in type 1 diabetes in the diabetes control and complications trial/epidemiology of diabetes interventions and complications cohort. Journal of Diabetes & its Complications 2013;27(5):447‐53. [MEDLINE: ] [DOI] [PMC free article] [PubMed] [Google Scholar]
- Kilpatrick ES, Rigby AS, Atkin SL. A1C variability and the risk of microvascular complications in type 1 diabetes: data from the Diabetes Control and Complications Trial. Diabetes Care 2008;31(11):2198‐202. [MEDLINE: ] [DOI] [PMC free article] [PubMed] [Google Scholar]
- Kim C, Cleary PA, Cowie CC, Braffett BH, Dunn RL, Larkin ME, et al. Effect of glycemic treatment and microvascular complications on menopause in women with type 1 diabetes in the Diabetes Control and Complications Trial/Epidemiology of Diabetes Interventions and Complications (DCCT/EDIC) cohort. Diabetes Care 2014;37(3):701‐8. [MEDLINE: ] [DOI] [PMC free article] [PubMed] [Google Scholar]
- Klein RL, Hammad SM, Baker NL, Hunt KJ, Al Gadban MM, Cleary PA, et al. Decreased plasma levels of select very long chain ceramide species are associated with the development of nephropathy in type 1 diabetes. Metabolism: Clinical & Experimental 2014;63(10):1287‐95. [MEDLINE: ] [DOI] [PMC free article] [PubMed] [Google Scholar]
- Kramer CK, Retnakaran R. Concordance of retinopathy and nephropathy over time in Type 1 diabetes: an analysis of data from the Diabetes Control and Complications Trial. Diabetic Medicine 2013;30(11):1333‐41. [MEDLINE: ] [DOI] [PubMed] [Google Scholar]
- Lachin JM, McGee P, Palmer JP, DCCT/EDIC Research Group. Impact of C‐peptide preservation on metabolic and clinical outcomes in the Diabetes Control and Complications Trial. Diabetes 2014;63(2):739‐48. [MEDLINE: ] [DOI] [PMC free article] [PubMed] [Google Scholar]
- Larkin ME, Backlund JY, Cleary P, Bayless M, Schaefer B, Canady J, et al. Disparity in management of diabetes and coronary heart disease risk factors by sex in DCCT/EDIC. Diabetic Medicine 2010;27(4):451‐8. [MEDLINE: ] [DOI] [PubMed] [Google Scholar]
- Lee CC, Sharp SJ, Wexler DJ, Adler AI. Dietary intake of eicosapentaenoic and docosahexaenoic acid and diabetic nephropathy: cohort analysis of the Diabetes Control and Complications Trial. Diabetes Care 2010;33(7):1454‐6. [MEDLINE: ] [DOI] [PMC free article] [PubMed] [Google Scholar]
- Levey AS, Greene T, Schluchter MD, Cleary PA, Teschan PE, Lorenz RA, et al. Glomerular filtration rate measurements in clinical trials. Modification of Diet in Renal Disease Study Group and the Diabetes Control and Complications Trial Research Group. Journal of the American Society of Nephrology 1993;4(5):1159‐71. [MEDLINE: ] [DOI] [PMC free article] [PubMed] [Google Scholar]
- Lin J, Manson J, Schaumberg D. Inflammation and progressive nephropathy in the diabetes complication and control trial (DCCT) [abstract no: F‐PO1015]. Journal of the American Society of Nephrology 2007;18(Abstracts):325A‐6A. [Google Scholar]
- Lopes‐Virella MF, Baker NL, Hunt KJ, Cleary PA, Klein R, Virella G, et al. Baseline markers of inflammation are associated with progression to macroalbuminuria in type 1 diabetic subjects. Diabetes Care 2013;36(8):2317‐23. [MEDLINE: ] [DOI] [PMC free article] [PubMed] [Google Scholar]
- Lopes‐Virella MF, Carter RE, Baker NL, Lachin J, Virella G, DCCT/EDIC Research Group. High levels of oxidized LDL in circulating immune complexes are associated with increased odds of developing abnormal albuminuria in Type 1 diabetes. Nephrology Dialysis Transplantation 2012;27(4):1416‐23. [MEDLINE: ] [DOI] [PMC free article] [PubMed] [Google Scholar]
- McGee P, Steffes M, Nowicki M, Bayless M, Gubitosi‐Klug R, Cleary P, et al. Insulin secretion measured by stimulated C‐peptide in long‐established Type 1 diabetes in the Diabetes Control and Complications Trial (DCCT)/ Epidemiology of Diabetes Interventions and Complications (EDIC) cohort: a pilot study. Diabetic Medicine 2014;31(10):1264‐8. [MEDLINE: ] [DOI] [PMC free article] [PubMed] [Google Scholar]
- Molitch ME, Steffes M, Sun W, Rutledge B, Cleary P, Boer IH, et al. Development and progression of renal insufficiency with and without albuminuria in adults with type 1 diabetes in the diabetes control and complications trial and the epidemiology of diabetes interventions and complications study. Diabetes Care 2010;33(7):1536‐43. [MEDLINE: ] [DOI] [PMC free article] [PubMed] [Google Scholar]
- Nathan DM, Steffes MW, Sun W, Rynders GP, Lachin JM. Determining stability of stored samples retrospectively: the validation of glycated albumin. Clinical Chemistry 2011;57(2):286‐90. [MEDLINE: ] [DOI] [PubMed] [Google Scholar]
- Polak JF, Backlund JY, Cleary PA, Harrington AP, O'Leary DH, Lachin JM, et al. Progression of carotid artery intima‐media thickness during 12 years in the Diabetes Control and Complications Trial/Epidemiology of Diabetes Interventions and Complications (DCCT/EDIC) study. Diabetes 2011;60(2):607‐13. [MEDLINE: ] [DOI] [PMC free article] [PubMed] [Google Scholar]
- Siebert C, Clark CM Jr. Operational and policy considerations of data monitoring in clinical trials: the Diabetes Control and Complications Trial experience. Controlled Clinical Trials 1993;14(1):30‐44. [MEDLINE: ] [DOI] [PubMed] [Google Scholar]
- Tello A, Mondress M, Fan Y, Thomas W, Steffes M, Ibrahim H. The utility of serum creatinine based formulas in predicting the glomerular filtration rate in Type 1 diabetics with normal serum creatinine [abstract no: SU‐PO169]. Journal of the American Society of Nephrology 2004;15(Oct):569A. [CENTRAL: CN‐00583257] [Google Scholar]
- Turkbey EB, Backlund JY, Genuth S, Jain A, Miao C, Cleary PA, et al. Myocardial structure, function, and scar in patients with type 1 diabetes mellitus. Circulation 2011;124(16):1737‐46. [MEDLINE: ] [DOI] [PMC free article] [PubMed] [Google Scholar]
- White NH, Sun W, Cleary PA, Danis RP, Davis MD, Hainsworth DP, et al. Prolonged effect of intensive therapy on the risk of retinopathy complications in patients with type 1 diabetes mellitus: 10 years after the Diabetes Control and Complications Trial. Archives of Ophthalmology 2008;126(12):1707‐15. [MEDLINE: ] [DOI] [PMC free article] [PubMed] [Google Scholar]
- White NH, Sun W, Cleary PA, Tamborlane WV, Danis RP, Hainsworth DP, et al. Effect of prior intensive therapy in type 1 diabetes on 10‐year progression of retinopathy in the DCCT/EDIC: comparison of adults and adolescents. Diabetes 2010;59(5):1244‐53. [MEDLINE: ] [DOI] [PMC free article] [PubMed] [Google Scholar]
- Younes N, Cleary PA, Steffes MW, Boer IH, Molitch ME, Rutledge BN, et al. Comparison of urinary albumin‐creatinine ratio and albumin excretion rate in the diabetes control and complications trial/epidemiology of diabetes interventions and complications study. Clinical Journal of the American Society of Nephrology: CJASN 2010;5(7):1235‐42. [MEDLINE: ] [DOI] [PMC free article] [PubMed] [Google Scholar]
- Boer IH, Afkarian M, Rue TC, Cleary PA, Lachin JM, Molitch ME, et al. Renal outcomes in patients with type 1 diabetes and macroalbuminuria. Journal of the American Society of Nephrology 2014;25(10):2342‐50. [MEDLINE: ] [DOI] [PMC free article] [PubMed] [Google Scholar]
- Boer IH, Rue TC, Cleary PA, Lachin JM, Molitch ME, Steffes MW, et al. Long‐term renal outcomes of patients with type 1 diabetes mellitus and microalbuminuria: an analysis of the Diabetes Control and Complications Trial/Epidemiology of Diabetes Interventions and Complications cohort. Archives of Internal Medicine 2011;171(5):412‐20. [MEDLINE: ] [DOI] [PMC free article] [PubMed] [Google Scholar]
- Boer IH, Sun W, Cleary PA, Lachin JM, Molitch ME, Steffes M, et al. Effects of intensive diabetes therapy on glomerular filtration rate of type 1 diabetes: results from the DCCT/EDIC [Diabetes Control and Complications Trial/Epidemiology of Diabetes Interventions and Complications study] [abstract no: LB‐OR05]. Journal of the American Society of Nephrology 2011;22(Abstracts):2B. [Google Scholar]
Feldt‐Rasmussen 1986 {published data only}
- Feldt‐Rasmussen B, Mathiesen ER, Deckert T. Effect of two years of strict metabolic control on progression of incipient nephropathy in insulin‐dependent diabetes. Lancet 1986;2(8519):1300‐4. [MEDLINE: ] [DOI] [PubMed] [Google Scholar]
- Feldt‐Rasmussen B, Mathiesen ER, Hegedus L, Deckert T. Kidney function during 12 months of strict metabolic control in insulin‐dependent diabetic patients with incipient nephropathy. New England Journal of Medicine 1986;314(11):665‐70. [MEDLINE: ] [DOI] [PubMed] [Google Scholar]
KUMAMOTO Study 1995 {published data only}
- Ohkubo Y, Kishikawa H, Araki E, Miyata T, Isami S, Motoyoshi S, et al. Intensive insulin therapy prevents the progression of diabetic microvascular complications in Japanese patients with non‐insulin‐dependent diabetes mellitus: a randomized prospective 6‐year study. Diabetes Research & Clinical Practice 1995;28(2):103‐17. [MEDLINE: ] [DOI] [PubMed] [Google Scholar]
- Shichiri M, Kishikawa H, Ohkubo Y, Wake N. Long‐term results of the Kumamoto Study on optimal diabetes control in type 2 diabetic patients. Diabetes Care 2000;23 Suppl 2:B21‐9. [MEDLINE: ] [PubMed] [Google Scholar]
- Wake N, Hisashige A, Katayama T, Kishikawa H, Ohkubo Y, Sakai M, et al. Cost‐effectiveness of intensive insulin therapy for type 2 diabetes: a 10‐year follow‐up of the Kumamoto study. Diabetes Research & Clinical Practice 2000;48(3):201‐10. [MEDLINE: ] [DOI] [PubMed] [Google Scholar]
MEMO Study 2011 {published data only}
- Crasto W, Jarvis J, Khunti K, Skinner TC, Gray LJ, Brela J, et al. Multifactorial intervention in individuals with type 2 diabetes and microalbuminuria: the Microalbuminuria Education and Medication Optimisation (MEMO) study. Diabetes Research & Clinical Practice 2011;93(3):328‐36. [MEDLINE: ] [DOI] [PubMed] [Google Scholar]
- Crasto W, Khunti K, Jarvis KJ, Skinner TC, Gray LJ, Brela J, et al. Impact of intensive multi‐factorial intervention on novel markers of inflammation and vascular stiffness [abstract no: P446]. Diabetic Medicine 2011;28(Suppl 1):166. [EMBASE: 70631246] [Google Scholar]
- Crasto WA, Jarvis J, Brela J, Daly H, Gray LJ, Troughton J, et al. Interim analysis of the effects of a multifactorial intervention in people with type 2 diabetes and microalbuminuria after twelve months [abstract no: P410]. Diabetic Medicine 2009;26(Suppl 1):160. [EMBASE: 70342536] [Google Scholar]
OSLO Study 1986 {published data only}
- Dahl‐Jorgensen K, Brinchmann‐Hansen O, Hanssen KF, Ganes T, Kierulf P, Smeland E, et al. Effect of near normoglycaemia for two years on progression of early diabetic retinopathy, nephropathy, and neuropathy: the Oslo study. British Medical Journal Clinical Research Ed 1986;293(6556):1195‐9. [MEDLINE: ] [DOI] [PMC free article] [PubMed] [Google Scholar]
- Dahl‐Jorgensen K, Hanssen KF, Kierulf P, Bjoro T, Sandvik L, Aagenaes O. Reduction of urinary albumin excretion after 4 years of continuous subcutaneous insulin infusion in insulin‐dependent diabetes mellitus. The Oslo Study. Acta Endocrinologica 1988;117(1):19‐25. [MEDLINE: ] [DOI] [PubMed] [Google Scholar]
SDIS Study 1988 {published data only}
- Jensen‐Urstad K, Reichard P, Jensen‐Urstad M. Decreased heart rate variability in patients with type 1 diabetes mellitus is related to arterial wall stiffness. Journal of Internal Medicine 1999;245(1):57‐61. [MEDLINE: ] [DOI] [PubMed] [Google Scholar]
- Johansson J, Reichard P, Jensen‐Urstad K, Rosfors S, Jensen‐Urstad M. Influence of glucose control, lipoproteins, and haemostasis function on brachial endothelial reactivity and carotid intima‐media area, stiffness and diameter in Type 1 diabetes mellitus patients. European Journal of Clinical Investigation 2003;33(6):472‐9. [MEDLINE: ] [DOI] [PubMed] [Google Scholar]
- Rathsman B, Jensen‐Urstad K, Nystrom T. Intensified insulin treatment is associated with improvement in skin microcirculation and ischaemic foot ulcer in patients with type 1 diabetes mellitus: a long‐term follow‐up study. Diabetologia 2014;57(8):1703‐10. [MEDLINE: ] [DOI] [PubMed] [Google Scholar]
- Reichard P. Risk factors for progression of microvascular complications in the Stockholm Diabetes Intervention Study (SDIS). Diabetes Research & Clinical Practice 1992;16(2):151‐6. [MEDLINE: ] [DOI] [PubMed] [Google Scholar]
- Reichard P, Berglund B, Britz A, Cars I, Nilsson BY, Rosenqvist U. Intensified conventional insulin treatment retards the microvascular complications of insulin‐dependent diabetes mellitus (IDDM): the Stockholm Diabetes Intervention Study (SDIS) after 5 years. Journal of Internal Medicine 1991;230(2):101‐8. [MEDLINE: ] [DOI] [PubMed] [Google Scholar]
- Reichard P, Britz A, Carlsson P, Cars I, Lindblad L, Nilsson BY, et al. Metabolic control and complications over 3 years in patients with insulin dependent diabetes (IDDM): the Stockholm Diabetes Intervention Study (SDIS). Journal of Internal Medicine 1990;228(5):511‐7. [MEDLINE: ] [DOI] [PubMed] [Google Scholar]
- Reichard P, Britz A, Cars I, Nilsson BY, Sobocinsky‐Olsson B, Rosenqvist U. The Stockholm Diabetes Intervention Study (SDIS): 18 months' results. Acta Medica Scandinavica 1988;224(2):115‐22. [MEDLINE: ] [DOI] [PubMed] [Google Scholar]
- Reichard P, Jensen‐Urstad K, Ericsson M, Jensen‐Urstad M, Lindblad LE. Autonomic neuropathy‐‐a complication less pronounced in patients with type 1 diabetes mellitus who have lower blood glucose levels. Diabetic Medicine 2000;17(12):860‐6. [MEDLINE: ] [DOI] [PubMed] [Google Scholar]
- Reichard P, Nilsson BY, Rosenqvist U. The effect of long‐term intensified insulin treatment on the development of microvascular complications of diabetes mellitus. New England Journal of Medicine 1993;329(5):304‐9. [MEDLINE: ] [DOI] [PubMed] [Google Scholar]
- Reichard P, Pihl M. Mortality and treatment side‐effects during long‐term intensified conventional insulin treatment in the Stockholm Diabetes Intervention Study. Diabetes 1994;43(2):313‐7. [MEDLINE: ] [DOI] [PubMed] [Google Scholar]
- Reichard P, Pihl M, Rosenqvist U, Sule J. Complications in IDDM are caused by elevated blood glucose level: the Stockholm Diabetes Intervention Study (SDIS) at 10‐year follow up. Diabetologia 1996;39(12):1483‐8. [MEDLINE: ] [DOI] [PubMed] [Google Scholar]
- Reichard P, Rosenqvist U. Nephropathy is delayed by intensified insulin treatment in patients with insulin‐dependent diabetes mellitus and retinopathy. Journal of Internal Medicine 1989;226(2):81‐7. [MEDLINE: ] [DOI] [PubMed] [Google Scholar]
- Reichard P, Toomingas B, Rosenqvist U. Changes in conceptions and attitudes during five years of intensified conventional insulin treatment in the Stockholm Diabetes Intervention Study (SDIS). Diabetes Educator 1994;20(6):503‐8. [MEDLINE: ] [DOI] [PubMed] [Google Scholar]
STENO‐2 Study 1999 {published data only}
- Gaede P, Lund‐Andersen H, Parving HH, Pedersen O. Effect of a multifactorial intervention on mortality in type 2 diabetes. New England Journal of Medicine 2008;358(6):580‐91. [MEDLINE: ] [DOI] [PubMed] [Google Scholar]
- Gaede P, Parving H, Pedersen O. Multifactorial intervention in patients with type 2 diabetes: long‐term effects on mortality and vascular complications [abstract no: SA‐FC042]. Journal of the American Society of Nephrology 2007;18(Abstracts):43A. [CENTRAL: CN‐00740461] [Google Scholar]
- Gaede P, Valentine WJ, Palmer AJ, Tucker DM, Lammert M, Parving HH, et al. Cost‐effectiveness of intensified versus conventional multifactorial intervention in type 2 diabetes: results and projections from the Steno‐2 study. Diabetes Care 2008;31(8):1510‐5. [MEDLINE: ] [DOI] [PMC free article] [PubMed] [Google Scholar]
- Gaede P, Vedel P, Larsen N, Jensen G, Parving HH, Pedersen O. The STENO‐2 study: intensified multifactorial intervention reduces the risk of cardiovascular disease in patients with type 2 diabetes and microalbuminuria [abstract no: F‐FC031]. Journal of the American Society of Nephrology 2002;13(September, Program & Abstracts):72a. [CENTRAL: CN‐00445410] [Google Scholar]
- Gaede P, Vedel P, Larsen N, Jensen G, Parving HH, Pedersen O. The Steno‐2 study: intensified multifactorial intervention reduces the risk of cardiovascular disease in patients with type 2 diabetes and microalbuminuria [abstract no: 181]. 38th Annual Meeting of the European Association for the Study of Diabetes (EASD); 2002 Sept 1‐5; Budapest, Hungary. 2002.
- Gaede P, Vedel P, Larsen N, Jensen GV, Parving HH, Pedersen O. Multifactorial intervention and cardiovascular disease in patients with type 2 diabetes. New England Journal of Medicine 2003;348(5):383‐93. [MEDLINE: ] [DOI] [PubMed] [Google Scholar]
- Gaede P, Vedel P, Obel J, Parving HH, Pedersen O. Intensive multifactorial intervention in NIDDM patients with persistent microalbuminuria [abstract]. Journal of the American Society of Nephrology 1996;7(9):1357. [CENTRAL: CN‐00445411] [Google Scholar]
- Gaede P, Vedel P, Parving HH, Pedersen O. Intensified multifactorial intervention in patients with type 2 diabetes mellitus and microalbuminuria: the Steno type 2 randomised study. Lancet 1999;353(9153):617‐22. [MEDLINE: ] [DOI] [PubMed] [Google Scholar]
- Gaede PH, Jepsen PV, Parving HH, Pedersen OB. Intensified multifactorial intervention in patients with type 2 diabetes mellitus and microalbuminuria: the Steno‐2 study [Intensiveret multifaktoriel intervention hos patienter med type 2‐diabetes mellitus og mikroalbuminuri: Steno‐2‐studiet]. Ugeskrift for Laeger 1999;161(30):4277‐85. [MEDLINE: ] [PubMed] [Google Scholar]
STENO Study 1982 {published data only}
- Effect of 6 months of strict metabolic control on eye and kidney function in insulin‐dependent diabetics with background retinopathy. Steno Study Group. Lancet 1982;1(8264):121‐4. [MEDLINE: ] [PubMed] [Google Scholar]
UKPDS Study 1991 {published data only}
- Intensive blood‐glucose control with sulphonylureas or insulin compared with conventional treatment and risk of complications in patients with type 2 diabetes (UKPDS 33). UK Prospective Diabetes Study (UKPDS) Group.[Erratum appears in Lancet 1999 Aug;354(9178):602]. Lancet 1998;352(9131):837‐53. [MEDLINE: ] [PubMed] [Google Scholar]
- UK Prospective Diabetes Study (UKPDS). VIII. Study design, progress and performance. Diabetologia 1991;34(12):877‐90. [MEDLINE: ] [PubMed] [Google Scholar]
- Turner R, Cull C, Holman R. United Kingdom Prospective Diabetes Study 17: a 9‐year update of a randomized, controlled trial on the effect of improved metabolic control on complications in non‐insulin‐dependent diabetes mellitus. Annals of Internal Medicine 1996;124(1 pt 2):136‐45. [MEDLINE: ] [DOI] [PubMed] [Google Scholar]
VA‐CSDM Study 1992 {published data only}
- Abraira C, Colwell J, Nuttall F, Sawin CT, Henderson W, Comstock JP, et al. Cardiovascular events and correlates in the Veterans Affairs Diabetes Feasibility Trial. Veterans Affairs Cooperative Study on Glycemic Control and Complications in Type II Diabetes. Archives of Internal Medicine 1997;157(2):181‐8. [MEDLINE: ] [PubMed] [Google Scholar]
- Abraira C, Colwell JA, Nuttall FQ, Sawin CT, Nagel NJ, Comstock JP, et al. Veterans Affairs Cooperative Study on glycemic control and complications in type II diabetes (VA CSDM). Results of the feasibility trial. Veterans Affairs Cooperative Study in Type II Diabetes. Diabetes Care 1995;18(8):1113‐23. [MEDLINE: ] [DOI] [PubMed] [Google Scholar]
- Abraira C, Emanuele N, Colwell J, Henderson W, Comstock J, Levin S, et al. Glycemic control and complications in type II diabetes. Design of a feasibility trial. VA CS Group (CSDM). Diabetes Care 1992;15(11):1560‐71. [MEDLINE: ] [DOI] [PubMed] [Google Scholar]
- Abraira C, Henderson WG, Colwell JA, Nuttall FQ, Comstock JP, Emanuele NV, et al. Response to intensive therapy steps and to glipizide dose in combination with insulin in type 2 diabetes. VA feasibility study on glycemic control and complications (VA CSDM). Diabetes Care 1998;21(4):574‐9. [MEDLINE: ] [DOI] [PubMed] [Google Scholar]
- Abraira C, McGuire DK. Intensive insulin therapy in patients with type 2 diabetes: implications of the Veterans affairs (VA CSDM) feasibility trial. American Heart Journal 1999;138(5 Pt 1):S360‐5. [MEDLINE: ] [DOI] [PubMed] [Google Scholar]
- Agrawal L, Emanuele NV, Abraira C, Henderson WG, Levin SR, Sawin CT, et al. Ethnic differences in the glycemic response to exogenous insulin treatment in the Veterans Affairs Cooperative Study in Type 2 Diabetes Mellitus (VA CSDM). Diabetes Care 1998;21(4):510‐5. [MEDLINE: ] [DOI] [PubMed] [Google Scholar]
- Azad N, Emanuele NV, Abraira C, Henderson WG, Colwell J, Levin SR, et al. The effects of intensive glycemic control on neuropathy in the VA cooperative study on type II diabetes mellitus (VA CSDM). Journal of Diabetes & its Complications 1999;13(5‐6):307‐13. [MEDLINE: ] [DOI] [PubMed] [Google Scholar]
- Emanuele N, Azad N, Abraira C, Henderson W, Colwell J, Levin S, et al. Effect of intensive glycemic control on fibrinogen, lipids, and lipoproteins: Veterans Affairs Cooperative Study in Type II Diabetes Mellitus. Archives of Internal Medicine 1998;158(22):2485‐90. [MEDLINE: ] [DOI] [PubMed] [Google Scholar]
- Emanuele N, Klein R, Abraira C, Colwell J, Comstock J, Henderson WG, et al. Evaluations of retinopathy in the VA Cooperative Study on Glycemic Control and Complications in Type II Diabetes (VA CSDM). A feasibility study. Diabetes Care 1996;19(12):1375‐81. [MEDLINE: ] [DOI] [PubMed] [Google Scholar]
- Levin SR, Coburn JW, Abraira C, Henderson WG, Colwell JA, Emanuele NV, et al. Effect of intensive glycemic control on microalbuminuria in type 2 diabetes. Veterans Affairs Cooperative Study on Glycemic Control and Complications in Type 2 Diabetes Feasibility Trial Investigators. Diabetes Care 2000;23(10):1478‐85. [MEDLINE: ] [DOI] [PubMed] [Google Scholar]
- Pitale S, Kernan‐Schroeder D, Emanuele N, Sawin C, Sacks J, Abraira C, et al. Health‐related quality of life in the VA Feasibility Study on glycemic control and complications in type 2 diabetes mellitus. Journal of Diabetes & its Complications 2005;19(4):207‐11. [MEDLINE: ] [DOI] [PubMed] [Google Scholar]
- Pitale SU, Abraira C, Emanuele NV, McCarren M, Henderson WG, Pacold I, et al. Two years of intensive glycemic control and left ventricular function in the Veterans Affairs Cooperative Study in Type 2 Diabetes Mellitus (VA CSDM). Diabetes Care 2000;23(9):1316‐20. [MEDLINE: ] [DOI] [PubMed] [Google Scholar]
VADT Study 2003 {published data only}
- Abraira C, Duckworth W, McCarren M, Emanuele N, Arca D, Reda D, et al. Design of the cooperative study on glycemic control and complications in diabetes mellitus type 2: Veterans Affairs Diabetes Trial. Journal of Diabetes & its Complications 2003;17(6):314‐22. [MEDLINE: ] [DOI] [PubMed] [Google Scholar]
- Abraira C, Duckworth WC, Moritz T, VADT Group. Glycaemic separation and risk factor control in the Veterans Affairs Diabetes Trial: an interim report. Diabetes, Obesity & Metabolism 2009;11(2):150‐6. [MEDLINE: ] [DOI] [PubMed] [Google Scholar]
- Agrawal L, Azad N, Emanuele NV, Bahn GD, Kaufman DG, Moritz TE, et al. Observation on renal outcomes in the Veterans Affairs Diabetes Trial. Diabetes Care 2011;34(9):2090‐4. [MEDLINE: ] [DOI] [PMC free article] [PubMed] [Google Scholar]
- Alele JD, Luttrell LM, Hollis BW, Luttrell DK, Hunt KJ, VADT Study Group. Relationship between vitamin D status and incidence of vascular events in the Veterans Affairs Diabetes Trial. Atherosclerosis 2013;228(2):502‐7. [MEDLINE: ] [DOI] [PubMed] [Google Scholar]
- Anderson RJ, Bahn GD, Emanuele NV, Marks JB, Duckworth WC, VADT Study Group. Blood pressure and pulse pressure effects on renal outcomes in the Veterans Affairs Diabetes Trial (VADT). Diabetes Care 2014;37(10):2782‐8. [MEDLINE: ] [DOI] [PMC free article] [PubMed] [Google Scholar]
- Anderson RJ, Bahn GD, Moritz TE, Kaufman D, Abraira C, Duckworth W, et al. Blood pressure and cardiovascular disease risk in the Veterans Affairs Diabetes Trial. Diabetes Care 2011;34(1):34‐8. [MEDLINE: ] [DOI] [PMC free article] [PubMed] [Google Scholar]
- Azad N, Agrawal L, Emanuele NV, Klein R, Bahn GD, McCarren M, et al. Association of PAI‐1 and fibrinogen with diabetic retinopathy in the Veterans Affairs Diabetes Trial (VADT). Diabetes Care 2014;37(2):501‐6. [MEDLINE: ] [DOI] [PMC free article] [PubMed] [Google Scholar]
- Azad N, Agrawal L, Emanuele NV, Klein R, Bahn GD, Reaven P, et al. Association of blood glucose control and pancreatic reserve with diabetic retinopathy in the Veterans Affairs Diabetes Trial (VADT). Diabetologia 2014;57(6):1124‐31. [MEDLINE: ] [DOI] [PubMed] [Google Scholar]
- Azar M, Lyons TJ, Alaupovic P, Stoner JA, Quiroga C, Kaufman DG, et al. Apolipoprotein‐defined and NMR lipoprotein subclasses in the veterans affairs diabetes trial. Journal of Diabetes & its Complications 2013;27(6):627‐32. [MEDLINE: ] [DOI] [PubMed] [Google Scholar]
- Duckworth W, Abraira C, Moritz T, Reda D, Emanuele N, Reaven P, et al. Glucose control and vascular complications in veterans with type 2 diabetes.[Erratum appears in N Engl J Med. 2009 Sep 3;361(10):1028], [Erratum appears in N Engl J Med. 2009 Sep 3;361(10):1024‐5; PMID: 19726779]. New England Journal of Medicine 2009;360(2):129‐39. [MEDLINE: ] [DOI] [PubMed] [Google Scholar]
- Duckworth WC, Abraira C, Moritz TE, Davis SN, Emanuele N, Goldman S, et al. The duration of diabetes affects the response to intensive glucose control in type 2 subjects: the VA Diabetes Trial. Journal of Diabetes & its Complications 2011;25(6):355‐61. [MEDLINE: ] [DOI] [PubMed] [Google Scholar]
- Duckworth WC, McCarren M, Abraira C, VA Diabetes Trial. Glucose control and cardiovascular complications: the VA Diabetes Trial. Diabetes Care 2001;24(5):942‐5. [MEDLINE: ] [DOI] [PubMed] [Google Scholar]
- Duckworth WC, McCarren M, Abraira C, VADT Investigators. Control of cardiovascular risk factors in the Veterans Affairs Diabetes Trial in advanced type 2 diabetes. Endocrine Practice 2006;12 Suppl 1:85‐8. [MEDLINE: ] [DOI] [PubMed] [Google Scholar]
- Emanuele N, Klein R, Moritz T, Davis MD, Glander K, Anderson R, et al. Comparison of dilated fundus examinations with seven‐field stereo fundus photographs in the Veterans Affairs Diabetes Trial. Journal of Diabetes & its Complications 2009;23(5):323‐9. [MEDLINE: ] [DOI] [PubMed] [Google Scholar]
- Emanuele N, Moritz T, Klein R, Davis MD, Glander K, Khanna A, et al. Ethnicity, race, and clinically significant macular edema in the Veterans Affairs Diabetes Trial (VADT). Diabetes Research & Clinical Practice 2009;86(2):104‐10. [MEDLINE: ] [DOI] [PubMed] [Google Scholar]
- Emanuele N, Sacks J, Klein R, Reda D, Anderson R, Duckworth W, et al. Ethnicity, race, and baseline retinopathy correlates in the veterans affairs diabetes trial. Diabetes Care 2005;28(8):1954‐8. [MEDLINE: ] [DOI] [PubMed] [Google Scholar]
- Hayward RA, Reaven PD, Wiitala WL, Bahn GD, Reda DJ, Ge L, et al. Follow‐up of glycemic control and cardiovascular outcomes in type 2 diabetes.[Erratum appears in N Engl J Med. 2015 Jul 9;373(2):198; PMID: 26154808]. New England Journal of Medicine 2015;372(23):2197‐206. [MEDLINE: ] [DOI] [PubMed] [Google Scholar]
- Jenkins AJ, Fu D, Azar M, Stoner JA, Kaufman DG, Zhang S, et al. Clinical correlates of serum pigment epithelium‐derived factor in type 2 diabetes patients. Journal of Diabetes & its Complications 2014;28(3):353‐9. [MEDLINE: ] [DOI] [PMC free article] [PubMed] [Google Scholar]
- Kirkman MS, McCarren M, Shah J, Duckworth W, Abraira C, VADT Study Group. The association between metabolic control and prevalent macrovascular disease in Type 2 diabetes: the VA Cooperative Study in diabetes. Journal of Diabetes & its Complications 2006;20(2):75‐80. [MEDLINE: ] [DOI] [PubMed] [Google Scholar]
- Koska J, Saremi A, Bahn G, Yamashita S, Reaven PD, Veterans Affairs Diabetes Trial Investigators. The effect of intensive glucose lowering on lipoprotein particle profiles and inflammatory markers in the Veterans Affairs Diabetes Trial (VADT). Diabetes Care 2013;36(8):2408‐14. [MEDLINE: ] [DOI] [PMC free article] [PubMed] [Google Scholar]
- Lopes‐Virella MF, Hunt KJ, Baker NL, Virella G, Moritz T, VADT Investigators. The levels of MDA‐LDL in circulating immune complexes predict myocardial infarction in the VADT study. Atherosclerosis 2012;224(2):526‐31. [MEDLINE: ] [DOI] [PMC free article] [PubMed] [Google Scholar]
- Meyers CD, McCarren M, Wong ND, Abraira C, Duckworth WC, Kashyap ML, et al. Baseline achievement of lipid goals and usage of lipid medications in patients with diabetes mellitus (from the Veterans Affairs Diabetes Trial). American Journal of Cardiology 2006;98(1):63‐5. [MEDLINE: ] [DOI] [PubMed] [Google Scholar]
- Moritz T, Duckworth W, Abraira C. Veterans Affairs diabetes trial‐‐corrections.[Erratum for N Engl J Med. 2009 Jan 8;360(2):129‐39; PMID: 19092145]. New England Journal of Medicine 2009;361(10):1024‐5. [MEDLINE: ] [DOI] [PubMed] [Google Scholar]
- Reaven PD, Emanuele N, Moritz T, Klein R, Davis M, Glander K, et al. Proliferative diabetic retinopathy in type 2 diabetes is related to coronary artery calcium in the Veterans Affairs Diabetes Trial (VADT). Diabetes Care 2008;31(5):952‐7. [MEDLINE: ] [DOI] [PubMed] [Google Scholar]
- Reaven PD, Moritz TE, Schwenke DC, Anderson RJ, Criqui M, Detrano R, et al. Intensive glucose‐lowering therapy reduces cardiovascular disease events in veterans affairs diabetes trial participants with lower calcified coronary atherosclerosis. Diabetes 2009;58(11):2642‐8. [MEDLINE: ] [DOI] [PMC free article] [PubMed] [Google Scholar]
- Saremi A, Anderson RJ, Luo P, Moritz TE, Schwenke DC, Allison M, et al. Association between IL‐6 and the extent of coronary atherosclerosis in the veterans affairs diabetes trial (VADT). Atherosclerosis 2009;203(2):610‐4. [MEDLINE: ] [DOI] [PMC free article] [PubMed] [Google Scholar]
- Saremi A, Bahn G, Reaven PD, VADT Investigators. Progression of vascular calcification is increased with statin use in the Veterans Affairs Diabetes Trial (VADT). Diabetes Care 2012;35(11):2390‐2. [MEDLINE: ] [DOI] [PMC free article] [PubMed] [Google Scholar]
- Saremi A, Moritz TE, Anderson RJ, Abraira C, Duckworth WC, Reaven PD, et al. Rates and determinants of coronary and abdominal aortic artery calcium progression in the Veterans Affairs Diabetes Trial (VADT). Diabetes Care 2010;33(12):2642‐7. [MEDLINE: ] [DOI] [PMC free article] [PubMed] [Google Scholar]
- Saremi A, Schwenke DC, Bahn G, Ge L, Emanuele N, Reaven PD, et al. The effect of intensive glucose lowering therapy among major racial/ethnic groups in the Veterans Affairs Diabetes Trial. Metabolism: Clinical & Experimental 2015;64(2):218‐25. [MEDLINE: ] [DOI] [PMC free article] [PubMed] [Google Scholar]
- Zimering MB, Anderson RJ, Ge L, Moritz TE, Investigators for the VADT. Increased plasma basic fibroblast growth factor is associated with coronary heart disease in adult type 2 diabetes mellitus. Metabolism: Clinical & Experimental 2011;60(2):284‐91. [MEDLINE: ] [DOI] [PubMed] [Google Scholar]
- Zimering MB, Anderson RJ, Luo P, Moritz TE, Investigators for the Veterans Affairs Diabetes Trial. Plasma basic fibroblast growth factor is correlated with plasminogen activator inhibitor‐1 concentration in adults from the Veterans Affairs Diabetes Trial. Metabolism: Clinical & Experimental 2008;57(11):1563‐9. [MEDLINE: ] [DOI] [PubMed] [Google Scholar]
- Zimering MB, Anderson RJ, Moritz TE, Ge L, Investigators for the VADT. Endothelial cell inhibitory autoantibodies are associated with laser photocoagulation in adults from the Veterans Affairs Diabetes Trial. Metabolism: Clinical & Experimental 2009;58(6):882‐7. [MEDLINE: ] [DOI] [PubMed] [Google Scholar]
- Zimering MB, Anderson RJ, Moritz TE, Ge L, Investigators for the VADT. Low plasma basic fibroblast growth factor is associated with laser photocoagulation treatment in adult type 2 diabetes mellitus from the Veterans Affairs Diabetes Trial. Metabolism: Clinical & Experimental 2009;58(3):393‐400. [MEDLINE: ] [DOI] [PubMed] [Google Scholar]
- Zimering MB, Pan Z. Autoantibodies in type 2 diabetes induce stress fiber formation and apoptosis in endothelial cells. Journal of Clinical Endocrinology & Metabolism 2009;94(6):2171‐7. [MEDLINE: ] [DOI] [PubMed] [Google Scholar]
References to studies excluded from this review
Christiansen 1987 {published data only}
- Christiansen JS, Ingerslev J, Bernvil SS, Christensen CK, Hermansen K, Schmitz A. Near normoglycemia for 1 year has no effect on platelet reactivity, factor VIII, and von Willebrand factor in insulin‐dependent diabetes mellitus: a controlled trial. Journal of Diabetic Complications 1987;1(3):100‐6. [MEDLINE: ] [DOI] [PubMed] [Google Scholar]
Holman 1983 {published data only}
- Holman RR, Dornan TL, Mayon‐White V, Howard‐Williams J, Orde‐Peckar C, Jenkins L, et al. Prevention of deterioration of renal and sensory‐nerve function by more intensive management of insulin‐dependent diabetic patients. A two‐year randomised prospective study. Lancet 1983;1(8318):204‐8. [MEDLINE: ] [DOI] [PubMed] [Google Scholar]
Kawamori 1991 {published data only}
- Kawamori R, Kamado K, Kamada T. Recent progress in the treatment of diabetic nephropathy: importance of strict glycemic control on the regression of diabetic nephropathy. Journal of Diabetic Complications 1991;5(2‐3):88‐90. [MEDLINE: ] [DOI] [PubMed] [Google Scholar]
Wiseman 1985 {published data only}
- Wiseman MJ, Saunders AJ, Keen H, Viberti G. Effect of blood glucose control on increased glomerular filtration rate and kidney size in insulin‐dependent diabetes. New England Journal of Medicine 1985;312(10):617‐21. [MEDLINE: ] [DOI] [PubMed] [Google Scholar]
Additional references
CDC 2011
- Centers for Disease Control and Prevention. National diabetes fact sheet: national estimates and general information on diabetes and prediabetes in the United States, 2011. Atlanta, GA: U.S. Department of Health and Human Services, Centers for Disease Control and Prevention. www.cdc.gov/diabetes/pubs/pdf/ndfs_2011.pdf (accessed 8 April 2017).
Desouza 2003
- Desouza C, Salazar H, Cheong B, Murgo J, Fonseca V. Association of hypoglycemia and cardiac ischemia: a study based on continuous monitoring. Diabetes Care 2003;26(5):1485‐9. [MEDLINE: ] [DOI] [PubMed] [Google Scholar]
Duckworth 2009
- Duckworth W, Abraira C, Moritz T, Reda D, Emanuele N, Reaven PD, et al. Glucose control and vascular complications in veterans with type 2 diabetes.[Erratum appears in N Engl J Med. 2009 Sep 3;361(10):1028], [Erratum appears in N Engl J Med. 2009 Sep 3;361(10):1024‐5; PMID: 19726779]. New England Journal of Medicine 2009;360(2):129‐39. [MEDLINE: ] [DOI] [PubMed] [Google Scholar]
Finne 2005
- Finne P, Reunanen A, Stenman S, Groop PH, Grönhagen‐Riska C. Incidence of end‐stage renal disease in patients with type 1 diabetes. JAMA 2005;294(14):1782‐7. [MEDLINE: ] [DOI] [PubMed] [Google Scholar]
Gerstain 2008
- Action to Control Cardiovascular Risk in Diabetes Study Group, Gerstein HC, Miller ME, Byington RP, Goff DC Jr, Bigger JT, et al. Effects of intensive glucose lowering in type 2 diabetes. New England Journal of Medicine 2008;358(24):2545‐59. [MEDLINE: ] [DOI] [PMC free article] [PubMed] [Google Scholar]
GRADE 2008
- Guyatt GH, Oxman AD, Vist GE, Kunz R, Falck‐Ytter Y, Alonso‐Coello P, et al. GRADE: an emerging consensus on rating quality of evidence and strength of recommendations. BMJ 2008;336(7650):924‐6. [MEDLINE: ] [DOI] [PMC free article] [PubMed] [Google Scholar]
Guyatt 2011
- Guyatt G, Oxman AD, Akl EA, Kunz R, Vist G, Brozek J, et al. GRADE guidelines: 1. Introduction‐GRADE evidence profiles and summary of findings tables. Journal of Clinical Epidemiology 2011;64(4):383‐94. [MEDLINE: ] [DOI] [PubMed] [Google Scholar]
Hemmingsen 2011
- Hemmingsen B, Lund SS, Gluud C, Vaag A, Almdal T, Hemmingsen C, et al. Intensive glycaemic control for patients with type 2 diabetes: systematic review with meta‐analysis and trial sequential analysis of randomised clinical trials. BMJ 2011;343:d6898. [MEDLINE: ] [DOI] [PMC free article] [PubMed] [Google Scholar]
Higgins 2003
- Higgins JP, Thompson SG, Deeks JJ, Altman DG. Measuring inconsistency in meta‐analyses. BMJ 2003;327(7414):557‐60. [MEDLINE: ] [DOI] [PMC free article] [PubMed] [Google Scholar]
Higgins 2011
- Higgins JPT, Green S (editors). Cochrane Handbook for Systematic Reviews of Interventions Version 5.1.0 [updated March 2011]. The Cochrane Collaboration, 2011. Available from www.cochrane‐handbook.org.
IDF 2015
- International Diabetes Federation. IDF Diabetes atlas (7th edition), 2015. www.diabetesatlas.org/ (accessed 8 April 2017).
Ismail 2010
- Ismail‐Beigi F, Craven T, Banerji MA, Basile J, Calles J, Cohen RM, et al. Effect of intensive treatment of hyperglycaemia on microvascular outcomes in type 2 diabetes: an analysis of the ACCORD randomised trial.[Erratum appears in Lancet. 2010 Oct 30;376(9751):1466]. Lancet 2010;376(9739):419‐30. [MEDLINE: ] [DOI] [PMC free article] [PubMed] [Google Scholar]
Krolewski 1995
- Krolewski AS, Laffel LM, Krolewski M, Quinn M, Warram JH. Glycosylated hemoglobin and the risk of microalbuminuria in patients with insulin‐dependent diabetes mellitus. New England Journal of Medicine 1995;332(19):1251‐5. [MEDLINE: ] [DOI] [PubMed] [Google Scholar]
Moritz 2009
- Moritz T, Duckworth W, Abraira C. Veterans affairs diabetes trial ‐ corrections.[Erratum for N Engl J Med. 2009 Jan 8;360(2):129‐39; PMID: 19092145]. New England Journal of Medicine 2009;361(10):1024–5. [MEDLINE: ] [DOI] [PubMed] [Google Scholar]
Murray 2012
- Murray CJ, Vos T, Lozano R, Naghavi M, Flaxman AD, Michaud C, et al. Disability‐adjusted life years(DALYs) for 291 diseases and injuries in 21 regions, 1990‐2010: a systematic analysis for the Global Burden of Disease Study 2010.[Erratum appears in Lancet. 2013 Feb 23;381(9867):628 Note: AlMazroa, Mohammad A [added]; Memish, Ziad A [added]]. Lancet 2012;380(9859):2197‐223. [MEDLINE: ] [DOI] [PubMed] [Google Scholar]
Patel 2008
- ADVANCE Collaborative Group, Patel A, MacMahon S, Chalmers J, Neal B, Billot L, et al. Intensive blood glucose control and vascular outcomes in patients with type 2 diabetes. New England Journal of Medicine 2008;358(24):2560‐72. [MEDLINE: ] [DOI] [PubMed] [Google Scholar]
Paterson 1998
- Paterson BL, Thorne S, Dewis M. Adapting to and managing diabetes. Image ‐ the Journal of Nursing Scholarship 1998;30(1):57‐62. [MEDLINE: ] [DOI] [PubMed] [Google Scholar]
Pavkov 2006
- Pavkov ME, Bennett PH, Knowler WC, Krakoff J, Sievers ML, Nelson RG. Effect of youth‐onset type 2 diabetes mellitus on incidence of end‐stage renal disease and mortality in young and middle‐aged Pima Indians. JAMA 2006;26(296):421‐6. [MEDLINE: ] [DOI] [PubMed] [Google Scholar]
Ritz 1999
- Ritz E, Orth SR. Nephropathy in patients with type 2 diabetes mellitus. New England Journal of Medicine 1999;341(15):1127‐33. [MEDLINE: ] [DOI] [PubMed] [Google Scholar]
Schünemann 2011a
- Schünemann HJ, Oxman AD, Higgins JP, Vist GE, Glasziou P, Guyatt GH. Chapter 11: Presenting results and 'Summary of findings' tables. In: Higgins JP, Green S (editors). Cochrane Handbook for Systematic Reviews of Interventions Version 5.1.0 [updated March 2011]. The Cochrane Collaboration, 2011. Available from www.cochrane‐handbook.org.
Schünemann 2011b
- Schünemann HJ, Oxman AD, Higgins JP, Deeks JJ, Glasziou P, Guyatt GH. Chapter 12: Interpreting results and drawing conclusions. In: Higgins JP, Green S (editors). Cochrane Handbook for Systematic Reviews of Interventions Version 5.1.0 [updated March 2011]. The Cochrane Collaboration, 2011. Available from www.cochrane‐handbook.org.
UKPDS 1998
- UK Prospective Diabetes Study Group. Intensive blood‐glucose control with sulphonylureas or insulin compared with conventional treatment and risk of complications in patients with type 2 diabetes (UKPDS 33). UK Prospective Diabetes Study (UKPDS) Group.[Erratum appears in Lancet 1999 Aug 14;354(9178):602]. Lancet 1998;352(9131):837‐53. [MEDLINE: ] [PubMed] [Google Scholar]
USRDS 2011
- US Renal Data System. USRDS 2011 Annual Data Report: Atlas of End‐Stage Renal Disease in the United States. National Institute of Health, National Institute of Diabetes and Digestive and Kidney Diseases. 2011. www.usrds.org/atlas11.aspx (accessed 8 April 2017).
USRDS 2013
- US Renal Data System. 2013 atlas of CKD and ESRD. www.usrds.org/atlas13.aspx (accessed 8 April 2017).
Wild 2004
- Wild S, Roglic G, Green A, Sicree R, King H. Global prevalence of diabetes: estimates for the year 2000 and projections for 2030. Diabetes Care 2004;27(5):1047‐53. [MEDLINE: ] [DOI] [PubMed] [Google Scholar]
References to other published versions of this review
De Cosmo 2012
- Cosmo S, Pacilli A, Lamacchia O, Cignarelli M, Fioretto P, Vecchio M, et al. Glucose targets for preventing diabetic kidney disease and its progression. Cochrane Database of Systematic Reviews 2012, Issue 10. [DOI: 10.1002/14651858.CD010137] [DOI] [PMC free article] [PubMed] [Google Scholar]