Abstract
Enhancers are important regulatory elements that can control gene activity across vast genetic distances. However, the underlying nature of this regulation remains obscured because it has been difficult to observe in living cells. Here, we visualize the spatial organization and transcriptional output of the key pluripotency regulator Sox2 and its essential enhancer Sox2 Control Region (SCR) in living embryonic stem cells (ESCs). We find that Sox2 and SCR show no evidence of enhanced spatial proximity and that spatial dynamics of this pair is limited over tens of minutes. Sox2 transcription occurs in short, intermittent bursts in ESCs and, intriguingly, we find this activity demonstrates no association with enhancer proximity, suggesting that direct enhancer-promoter contacts do not drive contemporaneous Sox2 transcription. Our study establishes a framework for interrogation of enhancer function in living cells and supports an unexpected mechanism for enhancer control of Sox2 expression that uncouples transcription from enhancer proximity.
Research organism: Mouse
Introduction
Chromosomes are packaged and organized non-randomly within the mammalian nucleus. Emerging evidence suggests that 3D genome topology plays a fundamental role in genome control, including the regulation of gene expression programs (Bickmore, 2013; Krijger and de Laat, 2016; Schwarzer and Spitz, 2014). Within the nucleus, each chromosome occupies discrete chromosomal territories (Cremer et al., 2006). These territories are further structured into distinct compartments that separate active and repressive chromatin (Lieberman-Aiden et al., 2009; Sexton et al., 2012). At finer scales, chromosomes are partitioned into largely-invariant, sub-megabase sized topologically-associated domains (TADs), which break up the linear genome into interactive neighborhoods (Dixon et al., 2012; Nora et al., 2012). Chromosomal contacts are disfavored across TAD boundaries. Thus, most cell-type specific contacts occur within TAD boundaries, and disruption of TAD architecture leads to dysregulation of gene expression (Dowen et al., 2014; Gröschel et al., 2014; Guo et al., 2015; Lupiáñez et al., 2015; Narendra et al., 2015; Nora et al., 2017).
Within this 3D framework, gene expression programs are established by non-coding regulatory enhancer elements. First discovered within a metazoan genome over three decades ago (Banerji et al., 1983), it is now predicted that greater than 300,000 enhancers are encoded in the human genome (ENCODE Project Consortium, 2012; Zhu et al., 2013). Enhancers demonstrate unique epigenetic markings, enriched for H3K4me1 and H3K27ac (Creyghton et al., 2010; Heintzman et al., 2007; Rada-Iglesias et al., 2011), and are highly accessible, as demonstrated by elevated DNase sensitivity and transposition susceptibility (Boyle et al., 2008; Buenrostro et al., 2013; Thurman et al., 2012). These features facilitate transcription factor occupancy, enrichment of co-activators such as p300 and Mediator, and transcription of non-coding enhancer RNAs (eRNAs), all of which play important roles in modulation of target gene expression (Kim et al., 2015; Long et al., 2016). Importantly, enhancer activity is highly specific across cell types (Heintzman et al., 2009; ENCODE Project Consortium, 2012; Zhu et al., 2013) and modulated during cellular differentiation (Blum et al., 2012; Buecker et al., 2014; Huang et al., 2016; Wamstad et al., 2012), and this activity correlates with nearby gene expression. Thus, enhancers are fundamental to achieving gene expression programs that orchestrate embryonic development and drive disease pathogenesis. Understanding the mechanism by which enhancers influence target genes is crucial to decode gene regulation.
The textbook model proposes that enhancers influence target gene promoters through protein-protein complexes and physical interaction mediated by a DNA loop (Alberts et al., 2014). Experimental support for this model comes primarily from numerous chromosome conformation capture (3C)-based studies that have identified enriched contacts between enhancer and promoter elements (Jin et al., 2013; Li et al., 2012; Rao et al., 2014; Sanyal et al., 2012; Weintraub et al., 2017) and recent observations that driving contacts between an enhancer-promoter pair is sufficient to augment gene expression (Bartman et al., 2016; Deng et al., 2012; Deng et al., 2014; Morgan et al., 2017). However, other observations fit this model poorly. For example, sonic hedgehog (Shh) enhancers that drive expression in the brain move further, rather than closer, to the Shh gene when activated (Benabdallah et al., 2017). Furthermore, in Drosophila, coupled reporter genes regulated by a shared enhancer nevertheless show coordinated transcriptional bursting, suggesting either that an enhancer can contact multiple genes at once or that contact can be decoupled from transcription (Fukaya et al., 2016; Lim et al., 2018). Super enhancers -- clusters of enhancers that are highly enriched for coactivators like Mediator and BRD4 (Lovén et al., 2013; Whyte et al., 2013) -- have been proposed to activate transcription through nucleation of activator droplets rather than stepwise assembly of transcription complexes (Hnisz et al., 2017), providing a possible mechanism for enhancer action at a distance, and recent imaging has provided support for this idea (Cho et al., 2018; Sabari et al., 2018). Thus, how distal elements communicate with and regulate gene promoters in living cells remains an open question.
Live-cell imaging represents a powerful approach to dissect chromatin architecture and gene regulation in the context of single cells to address these questions (Chen et al., 2013; Chen et al., 2018; Germier et al., 2017; Gu et al., 2018; Lucas et al., 2014). However, interrogation of both enhancer-gene spatial organization and real-time transcriptional activity of the regulated gene has not yet been realized in living mammalian cells. Here, we investigate the dynamic 3D organization and transcriptional activity of the Sox2 gene and its distal enhancer Sox2 Control Region (SCR) in mouse embryonic stem cells (ESCs) using live-cell microscopy.
We find that the Sox2 promoter and SCR demonstrate similar spatial characteristics to non-regulatory regions in ESCs, while differentiation of ESCs leads to significant compaction throughout the Sox2 region. Time-lapse microscopy revealed that individual loci explore only a fraction of their potential spatial range during the ~25 min imaging window, driving high cell-to-cell variability in Sox2 locus conformation and Sox2/SCR encounters. Incorporation of an MS2 transcriptional reporter into the Sox2 gene demonstrated that transcription occurs in intermittent bursts in ESCs but, surprisingly, showed no correlation with spatial proximity between the enhancer-promoter pair. Together, our findings establish the spatial and transcriptional characteristics of an essential pluripotency gene and suggest an unconventional mechanism for enhancer control of Sox2 expression that uncouples transcription from enhancer proximity.
Results
Engineering the endogenous Sox2 locus to visualize locus organization in living Embryonic Stem Cells
To visualize discrete loci within the mammalian genome, we turned to the well-established genetic labeling method of incorporating repetitive arrays of exogenous operator sequences, an approach that has been extensively used to visualize chromosomal loci (Belmont and Straight, 1998; Lucas et al., 2014; Marshall et al., 1997; Masui et al., 2011; Michaelis et al., 1997; Robinett et al., 1996; Roukos et al., 2013). To independently visualize two regions of interest, we utilized the tetO/TetR system to visualize one chromosomal location. For the other chromosomal location, because of the reported issues using lacO/lacI in ESCs (Lucas et al., 2014; Masui et al., 2011), we developed a new tool based on the cuO/CymR pair. This is a repressor system from the bacteria Pseudomonas putida that is involved in cumate metabolism and has been previously used as a tool for inducible gene expression (Mullick et al., 2006). We opted to target these arrays to the mouse genome using a two-step genetic engineering strategy with bacteriophage integrases for two reasons (Figure 1A, see Supplementary file 1 for protocol). First, repetitive sequences can be unstable during vector construction, making it advantageous to use generic targeting vectors portable between genomic loci. Second, we worried the repetitive arrays might recombine during genomic targeting using homologous recombination. To target the tetO/TetR and cuO/CymR labels to specific loci within the mouse genome, we first placed attP landing sites for the PhiC31 (Raymond and Soriano, 2007; Thyagarajan et al., 2001) and Bxb1 (Xu et al., 2013) integrase systems using CRISPR/Cas9 homology directed repair. We then integrated generic PhiC31 or Bxb1 targeting vectors bearing either the tetO array (224 repeats) or cuO array (144 repeats), respectively, at the corresponding landing sites through transient expression of the PhiC31 and Bxb1 integrases. This strategy was both modular in design and portable between genomic loci. To target two regions on the same chromosome, we used 129/Cast F1 hybrid ESCs, derived from crossing the 129 mouse strain to the divergent subspecies Mus musculus castaneus. This allowed us to limit editing to the 129 allele by using genetic polymorphisms between the two parental genomes to design allele-specific CRISPR guide RNAs.
Figure 1. The Sox2 Locus As a Model for Visualization of Enhancer-Promoter Regulation in Mouse Embryonic Stem Cells.
(A) To visualize chromosome loci in living cells, we have used tetO/TetR and cuO/CymR genetic labels. Our pipeline for insertion of these labels into the mouse genome is shown. First, CRISPR-Cas9 is used to place an attP integrase landing site. Second, a targeting plasmid bearing the compatible attB sequence, the tetO or cuO array, and a selection cassette is introduced along the integrase (Int) to mediate site-specific integration. The selection cassette can then be subsequently removed by Cre/Flp recombinase. (B) The Sox2 locus in mouse ESCs. Genomic browser tracks of epigenomic and expression data demonstrate high levels of histone acetylation, RNA polymerase II, and transcription factor (OCT4, SOX2, NANOG, CTCF) and cohesin (RAD21) occupancy at Sox2 and the distal Sox2 Control Region enhancer (tan boxes). Data from 4C and HiC experiments demonstrate chromosomal contacts at the Sox2 locus. For 4C data, read density indicates contact frequency with a fixed position near the Sox2 promoter (red triangle). Y-axis for browser tracks is reads per million. For HiC, all pairwise contact frequencies are shown using a heatmap. The intensity of each pixel represents the normalized number of contacts detected between a pair of loci. The maximum intensity is indicated in red square. At bottom, locations of the cuO- and tetO-arrays for the three cell lines utilized for this study. Sox2-8CcuO/+; Sox2-117TtetO/+ (Sox2-SCR) ESCs were used to track Sox2/SCR location. Two control lines, Sox2-43TtetO/+; Sox2-164TcuO/+ (Control-Control) and Sox2-117TtetO/+; Sox2-242TcuO/+ (SCR-Control) were analyzed for comparison. H3K27ac, RNA polymerase II (RNAP), and RNAseq data from GSE47949 (Wamstad et al., 2012); DNase data from GSE51336 (Vierstra et al., 2014); SOX2, OCT4, NANOG, CTCF data from GSE11431 (Chen et al., 2008b), and RAD21 data from GSE90994 (Hansen et al., 2017); 4C data from GSE72539 (de Wit et al., 2015); and HiChIP data from GSE96107 (Bonev et al., 2017).

Figure 1—figure supplement 1. Characterization of Modified Embryonic Stem Cell Lines.

Figure 1—figure supplement 2. Sox2 Expression Characterization for Modified Embryonic Stem Cell Lines.

Figure 1—figure supplement 3. Sox2-SCR Contacts Are Maintained in Modified Embryonic Stem Cell Lines.

We chose the murine Sox2 locus as our genetic model. Sox2 encodes a high-mobility group (HMG) DNA-binding transcription factor with important roles in embryonic development (Kamachi and Kondoh, 2013; Lefebvre et al., 2007; Sarkar and Hochedlinger, 2013), embryonic and adult neural progenitors (Pevny and Nicolis, 2010), and the progression of many forms of cancer (Weina and Utikal, 2014; Wuebben and Rizzino, 2017). Sox2 also functions as an essential regulator of pluripotency, where it cooperates with other transcriptional regulators to maintain the pluripotency transcriptional program and keep embryonic stem cells in the undifferentiated state (Chen et al., 2008a; Young, 2011). Sox2 resides in an isolated neighborhood on chromosome 3, as the sole protein-coding gene in a ~ 1.6 Mb region. Numerous regulatory elements that modulate Sox2 expression have been identified in this neighborhood across amniotes (Okamoto et al., 2015; Tomioka et al., 2002; Uchikawa et al., 2003; Zappone et al., 2000). However, Sox2 expression in mouse ESCs is controlled by a single, strong distal enhancer called the Sox2 Control Region (Li et al., 2014; Zhou et al., 2014), which is robustly enriched with H3K27ac, DNase hypersensitivity, RNA Polymerase II (RNAP), CTCF, the cohesion subunit RAD21, and transcription factor occupancy (herein referred to as SCR, Figure 1B). Genetic ablation of SCR in ESCs leads to loss of Sox2 expression in cis. Moreover, SCR maintains Sox2 expression levels in the context of compound deletion of alternative Sox2 enhancers, suggesting SCR is sufficient for Sox2 regulation in ESCs (Zhou et al., 2014). Publicly available circularized chromosome conformation capture (4C) and HiC datasets reveal enriched contacts between SCR and the Sox2 promoter region, suggesting that these enhancer-promoter interactions may play an important role in SCR function (Figure 1B).
We generated three distinct modified cell lines in 129/Cast F1 hybrid ESCs (Figure 1B, bottom) First, we labeled the Sox2 promoter region and SCR by integrating the cuO array 8 kb centromeric to the Sox2 TSS (Sox2-8C) and the tetO array approximately 5 kb telomeric to the SCR boundary (i.e. 117 kb telomeric to Sox2 TSS, Sox2-117T). We refer to this pair as Sox2-SCR. Secondly, we created two control ESC lines: one with two arbitrary loci labeled with cuO and tetO (Sox2-43TtetO/+; Sox2-164TcuO/+ or Control-Control) and a second where we labeled SCR along with a non-specific telomeric locus (Sox2-117TtetO/+; Sox2-242TcuO/+ or SCR-Control). In both cases, the genetic distance between labels was similar to that of Sox2-SCR. Both control pairs show low contact propensity in chromosome conformation capture data (Figure 1B). We verified the correct placement of the cuO and tetO labels for each locus using PCR with primers that span the unique recombination arms generated after plasmid integration (Figure 1—figure supplement 1, Supplementary file 2,3). We detected a similar Sox2 expression ratio (129/Cast) using an allele-specific qPCR assay for modified cell lines compared to the parental ESCs, suggesting Sox2 regulation is intact despite genetic alteration of the locus (Analysis of Variance, p=0.215, Figure 1—figure supplement 2). Furthermore, we found insertion of the cuO and tetO arrays within the Sox2 locus did not disrupt Sox2-SCR contacts on the modified allele (Figure 1—figure supplement 3).
Visualization of the Sox2 region in ESCs reveals minimal evidence for Sox2/SCR Interactions
We were first interested in measuring the 3D distance between Sox2 and the SCR enhancer in living ESCs. To this end, we stably coexpressed CymR-GFP and TetR-tdTomato (TetR-tdTom) fusion proteins in Sox2-SCR ESCs using ePiggyBac transposon-based gene delivery (Lacoste et al., 2009). This allowed for visualization of both the cuO and tetO arrays within the nucleus using live-cell fluorescence confocal microscopy. We confirmed that coexpression of CymR-GFP and TetR-tdTom did not significantly alter Sox2 expression from the modified 129 allele by qPCR (Figure 1—figure supplement 2) and did not alter Sox2-SCR contacts by 4C (Figure 1—figure supplement 3). 3D time series of proliferating ESCs showed the majority of cells demonstrated a single, bright focus of CymR-GFP and TetR-tdTom in the ESC nucleus in close proximity. Many of these foci revealed the presence of two juxtaposed sister chromatids (Video 1). Because the overlapping signal from adjacent, identical arrays would degrade the resolution of our localization, we excluded these loci from our analysis and focused on cells demonstrating single, diffraction-limited spots for cuO and tetO, likely representing cells in the G1/early S phase of the cell cycle.
Video 1. Visualization of Sister Chromatids at Sox2 Locus.
Maximum-intensity Z projection of 3D confocal Z-stacks of cuO/CymR-GFP (left) and tetO/TetR-tdTom (middle) labeling the Sox2 promoter region and SCR, respectively demonstrate two clear spots for the SCR label, suggesting cells in S/G2. These cells were excluded from analysis. Scale bar is 1 µm.
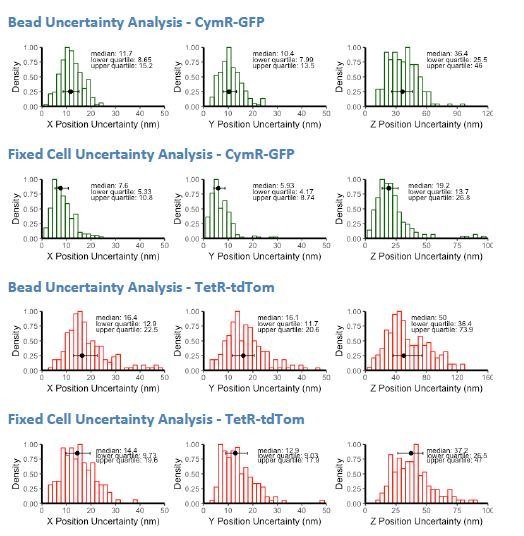
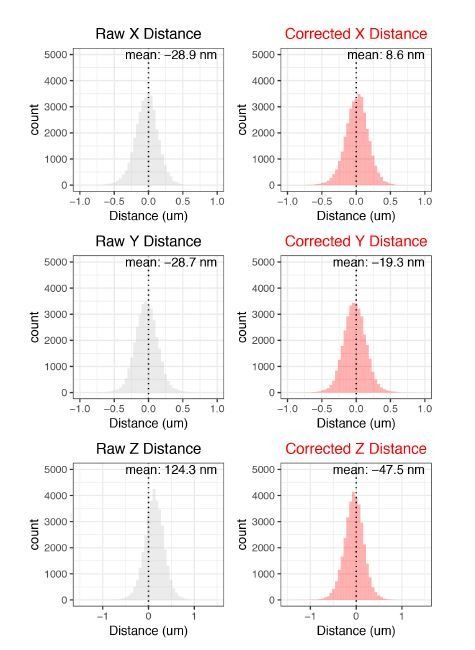
To investigate the distribution of Sox2/SCR distances, we determined the 3D position of cuO and tetO for each locus, assembled 3D tracks, and calculated 3D separation distances between the labels across time (Figure 2A, Supplementary file 4). 84% and 62% of our assembled tracks span the full time series (>75 frames) for cuO and tetO, respectively (Figure 2—figure supplement 1). By localization of fluorescent beads at a comparable signal-to-noise ratio, we estimate our localization precision in the X, Y, and Z dimensions to be 12 nm, 10 nm, and 36 nm, respectively, for cuO/CymR and 16 nm, 16 nm, 50 nm for tetO/TetR (Figure 2—figure supplement 2). Using fixed cells as an alternative method to estimate cuO/tetO localization precision supported precision of at least this great. These precision estimates translate to an uncertainty in measured 3D distance between cuO/CymR and tetO/TetR of between 40–50 nm (Figure 2—figure supplement 3). This localization uncertainty degrades the accuracy of very small distance measurements; distances below 55 nm are dominated by the noise component (i.e. >50% error, Figure 2—figure supplement 3). Thus, our experiments are likely to inaccurately describe the 3D separate distance of structures below this value.
Figure 2. Visualization of the Sox2 Region in ESCs Reveals Minimal Evidence for Sox2/SCR Interactions.
(A) Top, confocal Z slices of CymR-GFP and TetR-tdTom in Sox2-SCR ESCs, labeling the Sox2 promoter and SCR region with bright puncta, respectively. Middle, 3D surface rendering of the ESC nucleus shown above. A single fluorescence channel was rendered white and transparent to outline the nucleus, and GFP and tdTom surfaces were rendered with high threshold to highlight the cuO and tetO arrays, respectively. Bottom, tracking data is rendered for the nucleus shown above. Inset shows example of calculated 3D separation distance between the two labels. Scale bar is 1 µm. (B) Normalized histogram of 3D separation distance for Sox2-SCR ESCs demonstrates a single peak (Hartigan’s Dip Test for multimodality, p=1). Schematic for an hypothetical looping enhancer-promoter pair is shown as an inset, with two peaks. Tan box indicates regime where distance measurement error is expected to be greater than 50%. (C) Cumulative density of 3D separation distance for Sox2-SCR versus control comparisons. Mean distance for each sample shown on bottom right. (D) Mean 3D separation distance per cell for each label pair. Population means and standard deviations are shown for each sample. Mann-Whitney, *p<0.05, **p<0.01, ***p<0.001.

Figure 2—figure supplement 1. Tracking Lengths for tetO and cuO Spots Across Cell Lines.

Figure 2—figure supplement 2. Estimate of Localization Precision for cuO and tetO.

Figure 2—figure supplement 3. Impact of Localization Precision on 3D Distance Measurements.

Importantly, the cuO and tetO labels are located kilobases away from the Sox2 promoter and SCR. Hence, these labels imperfectly report on the true locations of the Sox2 promoter and SCR and may be influenced by other confounding factors, such as the degree of local chromatin compaction. Other potential sources of error include position blurring caused by locus movement during the 30 ms exposure and possible non-diffraction limited behavior of the cuO/tetO arrays. Due to these factors, we expect greater uncertainty regarding how measured distances between cuO/tetO translate to the underlying positions of Sox2/SCR than is predicted solely by our localization precision3C data demonstrate enriched contacts between Sox2 and SCR (Beagan et al., 2017; Bonev et al., 2017; de Wit et al., 2015; Kieffer-Kwon et al., 2013; Mumbach et al., 2016; Phillips-Cremins et al., 2013; Zhou et al., 2014), supporting the possibility of a looped locus configuration with Sox2 and SCR juxtaposed in 3D space. A mixture of looped and unlooped configurations across the population might be expected to produce a multimodal distance distribution with short and large distance peaks representing looped and unlooped states, respectively, as was recently observed for an enhancer system in Drosophila (Chen et al., 2018). We visualized the measured distances between cuO and tetO in the Sox2-SCR configuration as a histogram. This analysis revealed a unimodal distribution with positive skew (Hartigan’s Dip Test for multimodality, p=1). On average, Sox2/SCR labels are separated by a few hundred nanometers in the ESC nucleus (mean = 339 nm, Figure 2B). Infrequently, we observed the Sox2 region adopt an extended conformation, leading to considerable Sox2/SCR separation distance (2.1% of measurements > 750 nm, 0.35% of measurements > 1 µm).
One possible interpretation of a unimodal distance distribution is that the Sox2/SCR pair exists predominantly in an interacting state. To investigate this possibility, we repeated this analysis with our two control locus pairs. We found that, while one control pair (Control-Control) did show increased separation distance as compared to Sox2/SCR, our other control set (SCR-Control), consisting of the SCR paired with a non-specific partner, showed a similar distribution to Sox2/SCR (Figure 2C). Indeed, no significant differences between Sox2-SCR and SCR –Control were found when comparing the mean distance per cell, while Control-Control demonstrated significantly increased distances (Figure 2D). Reinspection of chromosomal contact maps revealed evidence for a topological boundary, potentially established by the SCR element, separating the two labeled regions in the Control-Control configuration (Figure 1A), which could account for the elevated 3D distances measured for Control-Control, as has been observed for genomic loci separated by TAD boundaries (Dixon et al., 2012; Nora et al., 2012). These results suggest that SCR does not show greater proximity to the Sox2 gene than to a non-specific control.
To further exclude the possibility that our measurements reflected a constitutive interaction state, we sought to estimate the distance profile for a static Sox2/SCR interaction. To this end, we used CRISPR/Cas9 to delete a ~ 111 kb fragment between the cuO and tetO labels in the Sox2-SCR configuration, leaving a 14 kb tether between the labels (Figure 1—figure supplement 1). This is similar in length to the effective tether (~17 kb) between labels expected during a direct interaction between the Sox2 TSS and the center of the SCR. Visualization of this label configuration in living ESCs demonstrated a significant shift to more proximal distance values (Figure 2C,D). These results are consistent with our expectation that a direct Sox2/SCR interaction would be confined shorter 3D distances than those observed for the Sox2-SCR pair and validate our experimental capacity to measure these differences. Taken together, these data demonstrate no unique spatial characteristics for the Sox2-SCR pair in ESCs. While these observations could suggest very infrequent interaction events, they also may allude to fundamental differences between spatial proximity and the features captured by proximity ligation using 3C approaches (see DISCUSSION).
Differentiation of ESCs to diverse lineages correlates with Sox2 locus compaction
We next differentiated our modified cell lines in order to determine how Sox2 locus organization is altered upon cellular differentiation (Figure 3A). To this end, we derived neural precursor cells (NPCs), a cell-type that maintains Sox2 expression despite inactivation of the SCR and reduced Sox2/SCR contacts by chromosome conformation capture carbon copy (5C) (Figure 3B) (Beagan et al., 2017). We validated that our NPC lines expressed NPC marker genes and demonstrated their ability to differentiate into both neurons and astrocytes (Figure 3—figure supplement 1). As an additional comparison, we differentiated our ESC lines into FLK1+/PDGFRα+ mesodermal precursors (MES), a cell type which downregulates Sox2 expression and inactivates the SCR element (Figure 3B). Interestingly, we observed that all label pairs embedded in the Sox2 locus showed greater proximity in differentiated cells compared to ESCs (Figure 3C). These changes were significant when comparing mean distances per cell between label pairs in NPCs or MES with ESCs (Figure 3D). These data suggest the entire Sox2 locus adopts a more compact conformation upon ESC differentiation, regardless of transcriptional status of Sox2.
Figure 3. Sox2 Locus Compacts upon ESC Differentiation.
(A) ESCs were differentiated into neural progenitor cells (NPCs), which maintain expression of Sox2 but inactivate the SCR, and cardiogenic mesodermal precursors (MES), which inactivate both Sox2 and the SCR. (B) Browser tracks of H3K27ac and RNA-seq data from ESCs, NPCs, and MES demonstrate the activation status of Sox2 and SCR in each cell type. Y-axis is 0–5 reads per million for H3K27ac data and 0–10 reads per million for RNA-seq data. (C) Cumulative density of 3D separation distance for Sox2-SCR and two control pairs for NPCs (left) and MES (right). ESC data are shown for comparison as solid lines on each graph and reproduced from Figure 2C. Tan box indicates regime where distance measurement error is expected to be greater than 50%. (D) Mean 3D separation distance per cell for each label pair, organized by cell type. Statistical analysis is for each matched pair-wise comparison between cell types. All p-values are below reported value. Mann-Whitney (**p<0.01, ***p<0.001). H3K27ac data from GSE47949 (Wamstad et al., 2012) and GSE24164 (Creyghton et al., 2010). RNAseq data from GSE47949 and GSE44067 (Zhang et al., 2013).

Figure 3—figure supplement 1. Characterization of ESC-derived Neural Progenitor Cell Lines.

Figure 3—figure supplement 2. SCR Inactivation Does Not Drive Locus Compaction Upon Differentiation.

To explore if compaction of the Sox2 locus conformation might be driven by inactivation of the SCR element (which occurs in both NPCs and MES) or could be driven by other factors related to cellular differentiation, we generated a heterozygous genetic deletion of the SCR element on the 129 allele in ESCs using CRISPR/Cas9 (Figure 1—figure supplement 1, Figure 3—figure supplement 2). These cells show no signs of differentiation and maintained naive ESC morphology, consistent with previous studies (Zhou et al., 2014). Moreover, SCR deletion led to reduction of Sox2 expression from the cis allele to undetectable levels by qPCR (Figure 1—figure supplement 2). Live-cell visualization of the cuO and tetO labels in these cells demonstrated a slight shift in 3D distances towards greater proximity; however, this shift was small compared to that seen after differentiation to NPCs or MES (Figure 3—figure supplement 2). Hierarchical clustering analysis of the similarity between distance histograms revealed that SCR-deleted ESCs were most similar to other ESC lines (Figure 3—figure supplement 2). These observations suggest that Sox2 locus organization is significantly altered with ESC differentiation but largely robust to changes in Sox2 or SCR activity.
Slow Sox2 locus conformation dynamics lead to limited exploration and variable enhancer encounters
We next investigated the dynamics of Sox2 spatial organization and focused our analysis of the ESC state. While all three label pairs showed comparable distance profiles across the cell population, we observed striking variation in locus organization between individual cells (Figure 4A,B, Video 2). We observed label pairs in prolonged compact or extended conformations as well as gradual or sharp transitions between the two (Figure 4A). However, few label pairs explored their entire range – the distance spread observed across our cell population -- during our imaging window (~25 min), demonstrating that Sox2 locus conformation dynamics are slow over tens of minutes.
Figure 4. Slow Sox2 Locus Conformation Dynamics Lead to Limited Exploration and Variable Encounters.
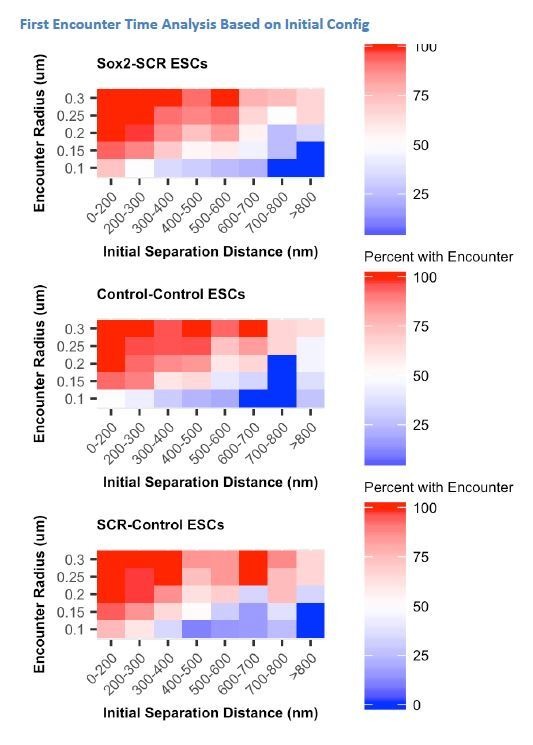
(A) Maximum-intensity projection images (top) centered on the Sox2 locus and associated 3D distance measurements (bottom) highlight distinct conformations and dynamics of the Sox2 locus across cells. Scale bar is 1 µm. (B) 3D separation distance measurements for individual cells for Sox2-SCR, Control-Control, and SCR-Control highlight the heterogeneity of Sox2 locus organization across the cell population. The three cells depicted in A are boxed. (C) Cartoon description of autocorrelation analysis. Distance measurement between two time points are correlated using population statistics, revealing the time scale over which local measurements diverge from the population mean. A cell with low autocorrelation will randomly fluctuate around the population mean, leading the autocorrelation function to quickly decay to zero. A cell with high autocorrelation will deviate substantially from the expected value, only slowly relaxing back to the population mean. In this case, the autocorrelation function will stay significantly above zero for large lag times. (D) Autocorrelation function for Sox2-SCR, Control-Control, and SCR-Control pairs demonstrates significant autocorrelation at large lag times, indicating significant memory in 3D conformation across a 20 min window. The plotted values are mean ± 95% CI. E) Percent of cells with an encounter between tetO and cuO labels shown as a function of the initial separation distance measured for the cell. Likelihood of an encounter depends on the initial conformation of the locus across all label pairs and encounter thresholds.

Figure 4—figure supplement 1. Dynamics Statistics for Each Sox2 Locus Pair in ESCs.

Video 2. Variability in Sox2 Locus Organization Across Cells.
Maximum-intensity Z projection of 3D confocal Z-stacks of cuO/CymR (green) and tetO/TetR (magenta) labeling the Sox2 promoter region and SCR, respectively for three individual cells highlighted in Figure 3. The distance range explored by Cell1 and Cell2 is limited, while Cell3 shows large, abrupt changes in distance. Scale bar is 1 µm.
To better understand this phenomenon, we investigated the dynamic properties of our Sox2-SCR label pair, as well as both control pairs. Both relative step sizes (defined as the 3D displacement of the cuO label between frames if the tetO location is fixed) and the change in 3D separation distance between frames were significant (e.g.180 nm and 79 nm, respectively, for the Sox2-SCR pair, 20 s per frame, Figure 4—figure supplement 1). We also computed the autocorrelation function. The autocorrelation function describes the correlation between measurements separated by various lag times and can be utilized to quantify memory or inertia in single cell quantities (e.g. protein levels) compared to the population average (Sigal et al., 2006) (Figure 4C). Autocorrelation values near one are expected between closely spaced measurements, decaying towards zero for larger lag times. An autocorrelation coefficient of zero indicates that the underlying process has randomized during the time lag between the relevant measurements. Computation of the autocorrelation function for each label pair revealed a monotonic decay with increasing lag times (Figure 4D). We observe an initial rapid reduction in autocorrelation in the small time lag regime, driven by a period of effective local exploration. As our probes begin to oversample the local environment (1–2 mins), the autocorrelation decay slows, reflecting the constraint on locus diffusion within the nuclear environment. Interestingly, at long time lags (>10 mins), the autocorrelation function for both control pairs appears to flatten to a slope of zero, suggesting that conformational memory for some loci may be quite long-lived. These data suggest oversampling of the local environment by individual loci within the Sox2 region and are consistent with current physical models of chromatin (Dekker and Mirny, 2016) and the viscoelastic nature of the nucleoplasm (Lucas et al., 2014).
An important implication of this behavior of chromatin is that encounters between loci are highly dependent on the initial configuration of the genomic region (Figure 4E). This can be seen by investigating the proportion of cells where the cuO and tetO labels have at least one encounter (defined by a separation distance below a proximity threshold). For instance, while 73% of Sox2-SCR pairs that start within 200 nm of each other are observed to have at least one encounter below 100 nm over the 25 min imaging window, this drops to 18% for pairs that start greater than 600 nm away. This trend is observed across label pairs and is robust to threshold value (Figure 4E). Such behavior could have important consequences for gene regulation by enhancer-promoter interactions. Given the observed inertia in locus conformation, enhancer proximity, and therefore the capacity for direct enhancer-promoter contact, is likely to be highly variable across time within a cell and between cells within a population.
Visualization of Sox2 transcriptional bursts in living ESCs
We next explored the temporal relation between 3D organization of the Sox2 locus and transcription. To this end, we utilized the well-established MS2 reporter system to directly visualize nascent transcription in single living ESCs (Bertrand et al., 1998). Using CRISPR/Cas9 genome engineering, we replaced the endogenous 129 Sox2 allele with a modified version that includes a P2A-puromycin resistance gene fusion and 24 MS2 stem loops inserted into the 3’ UTR of the Sox2 gene (Figure 5—figure supplement 1). We generated this MS2 reporter allele in our Sox2-SCR labeled cell line to generate Sox2-8CcuO/+, Sox2-117TtetO/+, Sox2MS2/WT ESCs (or simply Sox2-MS2 ESCs). Transcription levels derived from the Sox2-MS2 reporter allele were 35% of those from the untargeted 129 allele (Figure 1—figure supplement 2), potentially due to reduced stability of transcripts labeled with MS2 stem loops (Ochiai et al., 2014). Western blotting of Sox2-MS2 lysate revealed a SOX2 doublet as expected, suggesting proper expression of both wild-type SOX2 and the SOX-P2A fusion (Figure 5—figure supplement 1).
We first characterized the transcriptional activity of Sox2-MS2 reporter allele. We co-expressed a tandem-dimer of the MS2 coat protein fused with 2 copies of tagRFP-T (tdMS2cp-tagRFP-Tx2), TetR fused with 2 copies of GFP (TetR-GFPx2), and CymR fused with 2 copies of Halo tag (CymR-Halox2) in Sox2-MS2 ESCs. These ESCs enabled simultaneous visualization of the labels adjacent to the Sox2 promoter and SCR, as well as nascent Sox2 transcription in living ESCs when imaged in the presence of the Halo-tag ligand JF646 (Grimm et al., 2015) (Figure 5A). Time-lapse confocal microscopy revealed bright flashes of MS2cp signal in the ESC nucleus, which occurred in spatial proximity to the cuO and tetO labels, and were similar to the MS2 transcriptional bursts observed elsewhere (Bothma et al., 2014; Chubb et al., 2006; Lionnet et al., 2011; Martin et al., 2013; Ochiai et al., 2014). These results suggested the Sox2 MS2 reporter allele enables visualization of Sox2 transcription.
Figure 5. Visualizing Sox2 Expression in Single Living ESCs Reveals Intermittent Bursts of Transcription.
(A) Sox2 locus with cuO-labeled Sox2 promoter and tetO-labeled SCR was further modified to introduce an MS2 transcriptional reporter cassette into the Sox2 gene. Transcription of Sox2 leads to visible spot at the Sox2 gene due to binding and clustering of MS2 coat protein to the MS2 hairpin sequence. (B) Maximum-intensity projection images centered on the Sox2 promoter (cuO) show intermittent bursts of MS2 signal, which are quantified on the right. Scale bar is 1 µm. (C) Single cell trajectories of Sox2 transcriptional bursts as representatively shown in B. (D) Aligned Sox2 transcriptional bursts. Randomly selected Sox2 bursts are shown as color traces (n = 50). Black line is mean MS2 signal for all annotated bursts. (E) Percent time Sox2 transcriptional bursting for various experimental conditions. Bars are mean ± standard error of ≥3 independent experiments. Sox2MS2/+ indicates cell line harbors the Sox2-MS2 reporter allele. SCRdel/+ indicates presence of an SCR deletion in cis with the Sox2-MS2 reporter. DRB indicates treatment with the transcriptional inhibitor 5,6-Dichloro-1-β-D-ribofuranosylbenzimidazole (DRB).

Figure 5—figure supplement 1. Generation and Characterization of Sox2-MS2 Transcriptional Reporter ESCs.

Using our pipeline, we identified a total of 603 individual bursts across 1,208 cells (Figure 5B, Supplementary files 5,6, Video 3). We found Sox2 transcriptional activity to be sporadic both between cells and within individual cells across time (Figure 5C). Nearly two-thirds (66.1%) of nuclei lacked detectable Sox2 transcription during our 30 min imaging window, with the majority of remaining cells demonstrating transcriptional activity in less than 20% of frames (29.3%, Figure 5—figure supplement 1). However, we did observe rare cells that demonstrated robust transcriptional activity in greater than half the observed frames (0.25% of cells, Video 4). We also found substantial variability in the intensity of transcriptional bursts and their duration (Figure 5D). As a population, we found Sox2-MS2 ESCs spent 4% of their time with a detectable MS2 burst (Figure 5E). Thus, our live-cell measurements of Sox2transcription suggest short, intermittent transcriptional activity in ESCs.
Video 3. Identification of Sox2 Transcriptional Bursts in mESCs.
Maximum-intensity Z projection of 3D confocal Z-stacks of a tandem dimer of MS2 coat protein fused with two copies of tagRFP-T. The dashed yellow box highlights the ROI used for burst detection in our automated analysis pipeline, centered on the location of the Sox2 promoter (cuO/CymR location, not shown). Detected bursts are highlighted by red circles centered on the burst location, with color intensity indicating burst intensity. Scale bar is 1 µm.
Video 4. High Transcriptional Output from Sox2 Locus.
Maximum-intensity Z projection of 3D confocal Z-stacks of a tandem dimer of MS2 coat protein fused with two copies of tagRFP-T demonstrate a period of high transcriptional activity for the highlighted Sox2 gene. The dashed yellow box highlights the ROI used for burst detection in our automated analysis pipeline, centered on the location of the Sox2 promoter (cuO/CymR location, not shown). Detected bursts are highlighted by red circles centered on the burst location, with color intensity indicating burst intensity. Scale bar is 1 µm.
To ensure that our MS2 analysis identified bona fide transcriptional activity, we repeated our analysis in a number of control contexts. First, we measured bursting frequency in ESCs that expressed the MS2 coat protein but lacked the Sox2-MS2 reporter allele(Sox2-8CcuO/+, Sox2-117TtetO/+, Sox2WT/WT). Second, we measured bursting frequency in Sox2-MS2 ESCs that harbored an SCR deletion in cis (Sox2-8CcuO/+, Sox2-117TtetO/+, Sox2MS/WT, SCRdel/+). Third, we measured bursting frequency in Sox2-MS2 ESCs that were treated with the transcriptional inhibitor 5,6-Dichloro-1-β-D-ribofuranosylbenzimidazole (DRB). In each case, we observed a significant drop in Sox2 burst frequency (Figure 5E). Taken together, these data demonstrate our ability to accurately identify Sox2 transcriptional events using our MS2 reporter cell line.
Sox2 transcription is not associated with SCR proximity
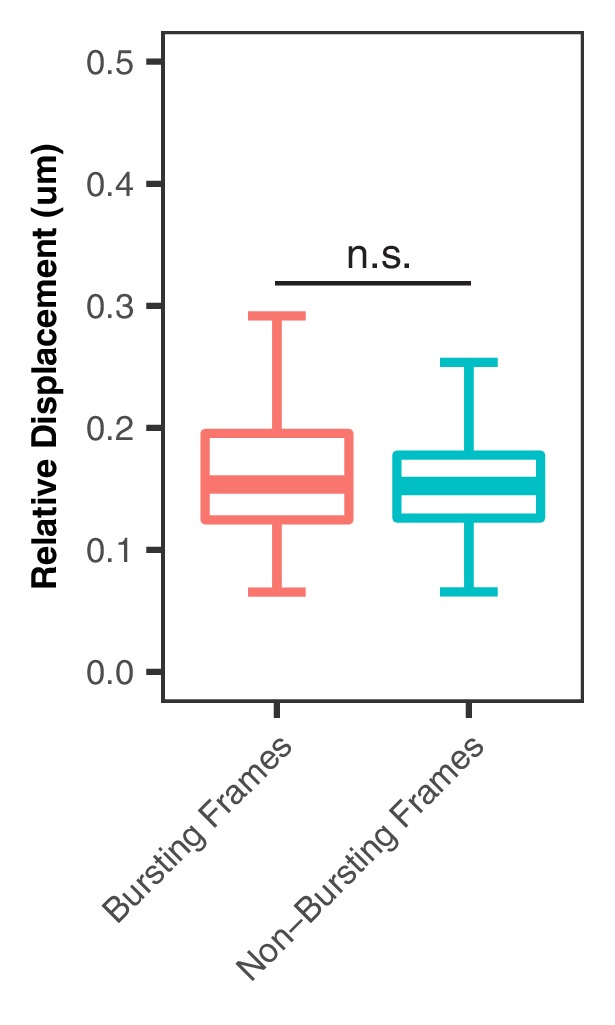
Assuming SCR regulates Sox2 transcription via the conventional enhancer looping model, we would expect Sox2 transcriptional activity to occur during interactions or periods of Sox2/SCR proximity (Figure 6A), given that Sox2 depends of SCR for its ESC expression. To investigate this prediction, we restricted our analysis to nuclei with single, diffraction-limited spots for the cuO and tetO labels in our Sox2-MS2 ESC dataset. We calculated 3D distances between the cuO/tetO and compared single cell distance traces with matched MS2 signal traces. We identified some transcriptionally active cells that showed prolonged proximity of the Sox2/SCR labels. However, we also observed cells which showed robust transcriptional bursting despite a prolonged extended conformation of the Sox2 region, driving Sox2/SCR distance above the population average for the duration of our 30 min imaging window (Figure 6B, Video 5). We binned time points according to the measured distance between Sox2 and SCR and calculated the percent time spent bursting for each bin and found that all bins showed similar transcriptional activity (Figure 6C). Furthermore, segregating time points into bursting and non-bursting frames for each cell demonstrated no significant differences between the two groups (Figure 6D, Mann-Whitney, p=0.68).
Figure 6. Sox2 Transcription Is Not Associated with SCR Proximity.
(A) Schematic illustrating the expected relation between Sox2/SCR distance and MS2 transcription for a looping enhancer model. (B) Maximum-intensity projection images centered on the Sox2 promoter (cuO) show transcriptional activity without correlation to Sox2/SCR distance changes. The measured distance and MS2 signal are shown at bottom. The mean separation distance across the cell population is shown as a dotted red line. Scale bar is 1 µm. (C) Percent time with Sox2 transcriptional burst as a function of Sox2/SCR distance. Weighted mean + SE for seven experiments are shown. Weights were determined based on the proportion of frames in each bin contributed by individual experiments. (D) Mean separation distance per cell, separated into bursting and non-bursting frames. (Mann-Whitney, p=0.68). (E) Mean separation distance across a 25 min window for all transcriptional bursts (black) or randomly select time points (red), aligned according the burst initiation frame. Values plotted are mean ± 95% CI. (F) Single cell trajectories of Sox2 transcriptional bursts ranked by number of bursting frames per cell. At right, matched mean separation distances for each cell shown at left. Spearman’s correlation coefficient for each is shown. (G) Mean separation distance per cell for transcribing and non-transcribing cells. (Mann-Whitney, p=0.15). (H) Potential models of SCR regulation of Sox2 that would uncouple Sox2/SCR proximity from transcriptional activity. Above, SCR leads to long-lived activation of the Sox2 promoter that can persist long after Sox2/SCR contact is disassembled. Below, SCR nucleates a large hub of activator proteins that can modify the Sox2 promoter environment despite large distances between Sox2 and SCR.

Figure 6—figure supplement 1. Relative Displacement between Frames for Bursting and Non-Burst Time Points.
Video 5. Sox2 Transcriptional Bursts in the Absence of SCR Proximity.
Maximum-intensity Z projection of 3D confocal Z-stacks of cuO/CymR (green) and tetO/TetR (magenta) labeling the Sox2 promoter region and SCR, respectively (left), and MS2 coat protein highlighting Sox2 transcriptional activity (right). We detect clear Sox2 transcriptional bursts despite no colocalization of the Sox2/SCR labels. Scale bar is 1 µm.
We next considered the possibility that Sox2/SCR proximity might precede transcriptional bursting by a characteristic time. This might be expected if there are characteristic delays for transcription complex assembly or to allow for elongation to the 3’ MS2 sequence (based on an estimated elongation rate of 30–100 nt/sec [Fuchs et al., 2014], it would require ~ 0.5–2 min for polymerase to reach the 3’ end of the MS2 array). We identified the initiation point for all bursts in our dataset and considered a 25 min window centered at each burst initiation event. Alignment and meta-analysis of these bursts showed little change in Sox2/SCR distance across the time window. To determine if Sox2/SCR distance significantly deviated from expected values across transcriptional bursts, we compared aligned bursts to a randomly shuffled control dataset and found no significant differences between the burst-centered and random-centered analysis (Figure 6E, Supplementary file 7). This analysis suggests Sox2/SCR proximity and Sox2 transcription is not separated by a characteristic lag within the time frame considered.
Finally, given the high degree of cell-to-cell variability in Sox2 locus organization, we investigated whether cells with greater average Sox2-SCR proximity, which would enable more frequent Sox2/SCR encounters, demonstrated higher transcriptional activity. We rank ordered cells based on cumulative transcriptional activity (i.e. number of transcriptionally active frames) and compared mean Sox2/SCR distance per cell (Figure 6F). As expected, non-transcribing cells showed no correlation between order and distance, given the ordering within this group was essentially random (Spearman’s ρ = −0.01). However, transcribing cells also showed no correlation between transcriptional activity and distance (Spearman’s ρ = 0.06). As a group, transcribing cells demonstrated no significant difference in mean Sox2/SCR separation distance compared to non-transcribing cells (Figure 6G, Mann-Whitney, p=0.15). These data suggest little relation between the 3D conformation of Sox2 relative to the SCR enhancer and its transcriptional output. Thus, our data indicate SCR is unlikely to directly activate Sox2 transcription through contact with its promoter.
Discussion
We have investigated the dynamic 3D organization and underlying transcriptional activity of the established enhancer-gene pair Sox2 and SCR. Interestingly, we observe few unique spatial characteristics for Sox2/SCR in ESCs; observed distance distributions and their spatial dynamics for SCR and the Sox2 promoter region are similar to those observed between SCR and an equally-spaced non-specific region. In contrast, 3C-based assays have identified enriched contacts between Sox2/SCR as compared to the surrounding neighborhood. We note that these results need not be incompatible. Proximity ligation (3C) and separation distance (microscopy) are distinct measures of chromatin structure with unique biases, assumptions, and limitations, and thus provide snapshots of chromatin architecture that may differ (Dekker, 2016; Fudenberg and Imakaev, 2017; Giorgetti and Heard, 2016). 3C-based assays often utilize millions of cells and so may capture rare conformations in the cell population; these rare conformations would have minimal impact on overall distance distributions constructed using microscopy. Moreover, it remains unclear what spatial proximity is required to enable ligation events during 3C, and this property may differ for distinct genomic regions. Indeed, enrichment of Sox2/SCR contacts in 3C assays may reflect only subtle differences in very proximal conformations (e.g. < 50 nm), conformations unlikely to be accurately represented by our microscopy measurements due to technical limitations in localization precision and uncertainty. Alternatively, large macromolecular bridges or hubs may enable crosslinking and ligation over larger distances that need not demonstrate pronounced spatial proximity, as recently demonstrated (Quinodoz et al., 2018). Moreover, chromatin composition and accessibility are likely to influence key features for 3C and microscopy experiments, such as crosslinkability, distances permissive for proximity ligation, and the scaling of spatial distances with genomic distance. All of these sources of uncertainty raise questions regarding how features from 3C and microscopy translate between assays and to the underlying chromatin structure. While a comprehensive picture of Sox2 locus organization remains out of view, our study provides guidance as to what structures are unlikely. For instance, the absence of enhanced proximity between the Sox2 and SCR pair suggests a prolonged, proximal conformation established by stable, direct pairing of the Sox2 promoter with SCR is unlikely to be the predominant structure in ESCs.
Surprisingly, we also observe no association between Sox2/SCR proximity and Sox2 transcription in real time. Indeed, we detect no correlation between transcriptional activity and instantaneous Sox2/SCR distances, no reduction in Sox2/SCR distances prior to transcriptional bursts, and no tendency for transcriptionally active cells to display reduced Sox2/SCR distance. It is important to note that we cannot exclude the importance of direct Sox2/SCR contacts in Sox2 activation. If these events lead to a complex, multi-step activation process with stochastic delays between steps, it is plausible that enhancer-promoter contact and transcriptional output could be temporally decoupled and demonstrate the poor correlation between Sox2/SCR proximity and transcriptional activity that we observe. Furthermore, SCR contacts could be important for long-lived activation of the Sox2 promoter, which could persist after disassembly of these interactions (Figure 6H, top). This mechanism might be achieved through delivery of durable factors (e.g. chromatin modifiers) to the Sox2 promoter during contact, and might explain why disruption of DNA loops genome-wide through acute RAD21 degradation leads to only modest changes in nascent transcription after 6 hr (Rao et al., 2017).
The Sox2 locus displays distinct behavior from an enhancer reporter recently used to explore the regulatory logic of the even-skipped (eve) enhancers in Drosophila embryos. In this study, the authors integrated an enhancer reporter ~ 142 kb upstream of eve locus and promoted pairing between the two loci by including an ectopic insulator sequence, which pairs with a similar sequence embedded near the eve enhancers. In this system, the authors observe both bimodality in distance measurements as well as clear correlation between enhancer-reporter proximity and reporter transcription. While it is not yet clear why these systems behave so differently, we note the considerable differences in the 3D distances we report for Sox2 (339 nm for Sox2/SCR) and those reported for the even-skipped reporter (709 nm for unpaired and 353 nm for paired). It seems plausible that the more extended conformation of the Drosophila chromosome necessitates pairing in order to bring the eve enhancer sufficiently close the reporter, particularly for enhancers evolved to function within 10 kb of their target gene. Our analysis suggests that most Sox2/SCR loci reside within this distance range, perhaps lowering the importance of locus conformation for SCR function. Indeed, SCR transcriptional control does demonstrate proximity dependence on some scale, as SCR ablation is not compensated for by a normal copy located on the homologous chromosome (Li et al., 2014; Zhou et al., 2014). In other contexts, such as during olfactory receptor gene choice or transvection in Drosophila, regulation can occur over very large distances in cis (~80 Mb) or in trans, and transcriptional activity may be more closely tied to pairing events that promote spatial proximity, as recently demonstrated for the latter (Horta et al., 2018; Lim et al., 2018; Markenscoff-Papadimitriou et al., 2014). Hence, genomic interactions and other features of genome topology may differ in importance depending of the spatial distances navigated by enhancer-gene pairs.
Our observations also open the possibility that direct contacts between Sox2 and SCR are dispensable for SCR function. Numerous mechanisms for long-range communication between enhancers and promoters have been proposed (Bulger and Groudine, 2010). For example, SCR may play a critical role in the nucleation and spreading of important epigenetic activators and chromatin accessibility, establishing a permissive environment of Sox2 transcription. An intriguing mechanism for action at a distance comes from recent observations that super-enhancers are capable of nucleating large (>300 nm), phase-separated condensates of coactivators, chromatin regulators, and transcription complexes (Cho et al., 2018; Sabari et al., 2018). SCR is a bona fide super-enhancer in ESCs (Whyte et al., 2013). Thus, SCR may deliver activation factors over hundreds of nanometers through inclusion of the Sox2 promoter into an activator hub or condensate (Figure 6H, bottom). Such a mechanism would present a number of challenges for achieving precise transcriptional control, most notably how SCR selectivity for Sox2 activation is achieved. Nevertheless, future studies that couple visualization of the Sox2 locus with that of important molecular components of transcriptional activation are likely to be essential in decoding how the SCR element achieves tight expression control of this essential pluripotency gene.
Materials and methods
Key resources table.
| Reagent type (species) or resource |
Designation | Source or reference | Identifiers | Additional information |
|---|---|---|---|---|
| Cell line (M. musculus) |
129/Cast F1 ESCs | PMID: 9298902 | ||
| Cell line (M. musculus) |
E14 ESCs | PMID: 3821905 | RRID:CVCL_C320 | |
| Cell line (M. musculus) |
Sox2-SCR ESCs | this paper | 129/Cast F1 ESCs with cuO array inserted 8 kb centromeric to Sox2 TSS and tetO array inserted 117 kb telomeric to Sox2 TSS on the 129 allele |
|
| Cell line (M. musculus) |
Sox2-SCR ESCs; CymR-GFP; TetR-tdTom |
this paper | 129/Cast F1 ESCs with cuO array inserted 8 kb centromeric to Sox2 TSS and tetO array inserted 117 kb telomeric to Sox2 TSS on the 129 allele. Cells stably express ePiggyBac vectors epB-UbC-CymRV5 -nls-GFP-DEx2 and epB- CAG-TetRFlag-nls-tdTom-DEx4 |
|
| Cell line (M. musculus) |
Control-Control ESCs | this paper | 129/Cast F1 ESCs with tetO array inserted 43 kb telomeric to Sox2 TSS and cuO array inserted 164 kb telomeric to Sox2 TSS on the 129 allele |
|
| Cell line (M. musculus) |
Control-Control ESCs | this paper | 129/Cast F1 ESCs with tetO array inserted 43 kb telomeric to Sox2 TSS and cuO array inserted 164 kb telomeric to Sox2 TSS on the 129 allele. Cells stably express ePiggyBac vectors epB-UbC-CymRV5-nls-GFP-DEx2 and epB-CAG-TetRFlag-nls- tdTom-DEx4 |
|
| Cell line (M. musculus) |
SCR-Control ESCs | this paper | 129/Cast F1 ESCs with tetO array inserted 117 kb telomeric to Sox2 TSS and cuO array inserted 242 kb telomeric to Sox2 TSS on the 129 allele |
|
| Cell line (M. musculus) |
SCR-Control ESCs | this paper | 129/Cast F1 ESCs with tetO array inserted 117 kb telomeric to Sox2 TSS and cuO array inserted 242 kb telomeric to Sox2 TSS on the 129 allele. Cells stably express ePiggyBac vectors epB-UbC-CymRV5-nls-GFP-DEx2 and epB-CAG-TetRFlag-nls-td Tom-DEx4 |
|
| Cell line (M. musculus) |
SCR deletion ESCs | this paper | 129/Cast F1 ESCs with cuO array inserted 8 kb centromeric to Sox2 TSS and tetO array inserted 117 kb telomeric to Sox2 TSS on the 129 allele. SCR deletion (104 kb-112kb from Sox2 TSS) is present on 129 allele |
|
| Cell line (M. musculus) |
SCR deletion ESCs | this paper | 129/Cast F1 ESCs with cuO array inserted 8 kb centromeric to Sox2 TSS and tetO array inserted 117 kb telomeric to Sox2 TSS on the 129 allele. SCR deletion (104 kb-112kb from Sox2 TSS) is present on 129 allele. Cells stably express ePiggyBac vectors epB-UbC-CymRV5-nls-GFP-DEx2 and epB-CAG-TetRFlag-nls -tdTom-DEx4 |
|
| Cell line (M. musculus) |
Sox2-MS2 ESCs | this paper | 129/Cast F1 ESCs with cuO array inserted 8 kb centromeric to Sox2 TSS and tetO array inserted 117 kb telomeric to Sox2 TSS on the 129 allele. 129 Sox2 allele has been replaced with Sox2-P2A- puro-24xMS2. |
|
| Cell line (M. musculus) |
Sox2-MS2 ESCs | this paper | 129/Cast F1 ESCs with cuO array inserted 8 kb centromeric to Sox2 TSS and tetO array inserted 117 kb telomeric to Sox2 TSS on the 129 allele. 129 Sox2 allele has been replaced with Sox2-P2A-puro-24xMS2. Cells stably express ePiggyBac vectors epB-UbC-CymRV5- nls-Halox2-DEx4, epB-CAG- TetRFlag-nls-GFPx2, and epB-UbC-tdMS2cp-tagRFP-Tx2 |
|
| Cell line (M. musculus) |
Sox2-MS2; SCR deletion ESCs |
this paper | 129/Cast F1 ESCs with cuO array inserted 8 kb centromeric to Sox2 TSS and tetO array inserted 117 kb telomeric to Sox2 TSS on the 129 allele. 129 Sox2 allele has been replaced with Sox2-P2A-puro-24xMS2. SCR deletion (104 kb-112kb from Sox2 TSS) is present on 129 allele |
|
| Cell line (M. musculus) |
Sox2-MS2; SCR deletion ESCs |
this paper | 129/Cast F1 ESCs with cuO array inserted 8 kb centromeric to Sox2 TSS and tetO array inserted 117 kb telomeric to Sox2 TSS on the 129 allele. 129 Sox2 allele has been replaced with Sox2-P2A- puro-24xMS2. SCR deletion (104 kb-112kb from Sox2 TSS) is present on 129 allele. Cells stably express ePiggyBac vectors epB-UbC -CymRV5-nls-Halox2-DEx4, epB-CAG-TetRFlag-nls-GFPx2, and epB-UbC-tdMS2cp- tagRFP-Tx2 |
|
| Cell line (M. musculus) |
Sox2-del-SCR ESCs | this paper | 129/Cast F1 ESCs with cuO array inserted 8 kb centromeric to Sox2 TSS and tetO array inserted 117 kb telomeric to Sox2 TSS on the 129 allele. Large deletion (1 kb-112kb from Sox2 TSS) is present on 129 allele. All genetic distances based on reference genome. |
|
| Cell line (M. musculus) |
Sox2-del-SCR ESCs | this paper | 129/Cast F1 ESCs with cuO array inserted 8 kb centromeric to Sox2 TSS and tetO array inserted 117 kb telomeric to Sox2 TSS on the 129 allele. Large deletion (1 kb-112kb from Sox2 TSS) is present on 129 allele. All genetic distances based on reference genome. Cells stably express ePiggyBac vectors epB-UbC-CymRV5 -nls-GFP-DEx2 and epB-CAG -TetRFlag-nls-tdTom-DEx4. |
|
| Cell line (M. musculus) |
Sox2-SCR NPCs | this paper | Neural progenitor cells derived from Sox2-SCR ESCs. Cells stably express ePiggyBac vectors epB-UbC -CymRV5-nls-GFP-DEx2 and epB-CAG-TetRFlag-nls -tdTom-DEx4. |
|
| Cell line (M. musculus) |
Sox2-SCR NPCs | this paper | Neural progenitor cells derived from Sox2-SCR ESCs |
|
| Cell line (M. musculus) |
Control-Control NPCs | this paper | Neural progenitor cells derived from Control-Control ESCs. Cells stably express ePiggyBac vectors epB-UbC-CymRV5-nls-GFP-DEx2 and epB-CAG-TetRFlag- nls-tdTom-DEx4. |
|
| Cell line (M. musculus) |
SCR-Control NPCs | this paper | Neural progenitor cells derived from SCR-Control ESCs |
|
| Cell line (M. musculus) |
SCR-Control NPCs | this paper | Neural progenitor cells derived from SCR-Control ESCs. epB-UbC-CymRV5 -nls-GFP-DEx2 and epB-CAG-TetRFlag-nls-td Tom-DEx4. |
|
| Antibody | rat monoclonal PE-conjugated anti-PDGFRα |
Thermo Fisher | 12-1401-81; RRID:AB_657615 |
Flow 1:400 |
| Antibody | mouse monoclonal anti-SOX2 |
Santa Cruz | sc-365823; RRID:AB_10842165 |
WB 1:1000, IF 1:100 |
| Antibody | rabbit polyclonal anti-PAX6 |
Biolegend | 901301; RRID:AB_2565003 |
IF 1:100 |
| Antibody | mouse monoclonal anti-TUBB3 |
Biolegend | 801201; RRID:AB_2313773 |
IF 1:100 |
| Antibody | mouse monoclonal anti-GFAP |
Sigma | G3893; RRID:AB_477010 |
IF 1:400 |
| Antibody | rabbit polyclonal anti-βactin |
Abcam | ab8227; RRID:AB_2305186 |
WB 1:2000 |
| Antibody | anti-Flk1 biotin | PMID: 17084363 | Hybridoma clone D218 Flow 1:100 |
|
| Recombinant DNA reagent |
pCAGGS-Bxb1o-nlsFlag | this paper | Addgene: 119901 | Expresses Bxb1 integrase in mammalian cells |
| Recombinant DNA reagent |
pDEST-tetOx224 _PhiC31attB_loxP- PGKpuro-loxP |
this paper | Addgene: 119902 | PhiC31 integration plasmid for tetO array with Neo selection cassette |
| Recombinant DNA reagent |
pDEST-cuOx144 _Bxb1attB_loxP- PGKpuro-loxP |
this paper | Addgene: 119903 | Bxb1 integration plasmid for cuO array with Puro selection cassette |
| Recombinant DNA reagent |
pDEST-tetOx224 _PhiC31attB_FRT- EF1a-GFP-FRT |
this paper | Addgene: 119904 | PhiC31 integration plasmid for tetO array with GFP expression cassette |
| Recombinant DNA reagent |
pDEST-cuOx144_ Bxb1attB_loxP- EF1a-tagRFP-T-loxP |
this paper | Addgene: 119905 | Bxb1 integration plasmid for cuO array with RFP expression cassette |
| Recombinant DNA reagent |
epB-UbC_CymRV5 -nls-GFP-DEx2 |
this paper | Addgene: 119906 | ePiggyBac mammalian expression plasmid for CymR-GFP fusion |
| Recombinant DNA reagent |
epB-UbC_CymRV5 -nls-Halox2_DEx4 |
this paper | Addgene: 119907 | ePiggyBac mammalian expression plasmid for CymR-Halo fusion |
| Recombinant DNA reagent |
epB-UbC_tdMS2cp -tagRFP-Tx2 |
this paper | Addgene: 119908 | ePiggyBac mammalian expression plasmid for tandem dimer MS2cp-tagRFP-T fusion |
| Recombinant DNA reagent |
epB_CAG_TetRFlag- nls-tdTom-DEx4 |
this paper | Addgene: 119909 | ePiggyBac mammalian expression plasmid for TetR-tdTom fusion |
| Recombinant DNA reagent |
epB_CAG_TetRFlag-nls_GFPx2_DEx2 | this paper | Addgene: 119910 | ePiggyBac mammalian expression plasmid for TetR-GFP fusion |
| Recombinant DNA reagent |
ePiggyBac-Transposase | this paper | Addgene: 119911 | Mammalian expression plasmid for the ePiggy Bac transposes |
| Recombinant DNA reagent |
pKS_Sox2-P2A-puro- 24xMS_targeting_ vector_NoPAM |
this paper | Targeting vector for generating Sox2-MS2 allele |
|
| Recombinant DNA reagent |
pX330-Sox2_3' UTR_gRNA |
this paper | Cas9/sgRNA expression vector with gRNA that targets the Sox2 3' UTR |
|
| Recombinant DNA reagent |
pX330-Sox2- 8C_gRNA |
this paper | Cas9/sgRNA expression vector with gRNA that targets 8 kb centromeric to Sox2 TSS |
|
| Recombinant DNA reagent |
pX330-Sox2- 43T_gRNA |
this paper | Cas9/sgRNA expression vector with gRNA that targets 43 kb telomeric to Sox2 TSS |
|
| Recombinant DNA reagent |
pX330-Sox2- 117T_gRNA |
this paper | Cas9/sgRNA expression vector with gRNA that targets 117 kb telomeric to Sox2 TSS |
|
| Recombinant DNA reagent |
pX330-Sox2- 164T_gRNA |
this paper | Cas9/sgRNA expression vector with gRNA that targets 164 kb telomeric to Sox2 TSS |
|
| Recombinant DNA reagent |
pX330-Sox2- 104T_gRNA |
this paper | Cas9/sgRNA expression vector with gRNA that targets 104 kb telomeric to Sox2 TSS |
|
| Recombinant DNA reagent |
pX330-Sox2- 112T_gRNA |
this paper | Cas9/sgRNA expression vector with gRNA that targets 112 kb telomeric to Sox2 TSS |
|
| Recombinant DNA reagent |
pX330-Sox2- 242T_gRNA |
this paper | Cas9/sgRNA expression vector with gRNA that targets 242 kb telomeric to Sox2 TSS |
|
| Sequence-based reagent |
Sox2 qPCR Forward Primer |
this paper | 5'-CTACGCGCACATGAACGG-3' | |
| Sequence-based reagent |
Sox2 qPCR Reverse Primer |
this paper | 5'-CGAGCTGGTCATGGAGTTGT-3' | |
| Sequence-based reagent |
Sox2 qPCR 129 allele Probe |
this paper | 5'-/56-FAM/CAACCGATG /ZEN/CACCGCTACGA/ 3IABkFQ/−3' |
|
| Sequence-based reagent |
Sox2 qPCR Cast allele Probe |
this paper | 5'-/56-FAM/CAGCCGATG /ZEN/CACCGATACGA/ 3IABkFQ/−3' |
|
| Sequence-based reagent |
Tbp qPCR Forward Primer |
this paper | 5'-ACACTCAGTTACAGGTGGCA-3' | |
| Sequence-based reagent |
Tbp qPCR Reverse Primer |
this paper | 5'-AGTAGTGCTGCAGGGTGATT-3' | |
| Sequence-based reagent |
Tbp qPCR Pan allele Probe |
this paper | 5'-/56-FAM/ACACTGTGT/ ZEN/GTCCTACTGCA/3IABkFQ/−3' |
|
| Sequence-based reagent |
Genotyping PCR Primers |
this paper | see Supplementary file 1 | |
| Sequence-based reagent |
CRISPR guide sequences |
this paper | see Supplementary file 2 | |
| Peptide, recombinant protein |
Leukemia inhibitory factor (Lif) |
Peprotech | 250–02 | |
| Peptide, recombinant protein |
APC-Streptavidin | BD-Biosciences | 554067; RRID:AB_10050396 |
Flow 1:200 |
| Peptide, recombinant protein |
Insulin | Sigma | I6634 | |
| Peptide, recombinant protein |
Epidermal growth factor (EGF) |
Peprotech | 315–09 | |
| Peptide, recombinant protein |
Fibroblast growth factor basic (Fgfb) |
R and D Systems | 233-FB | |
| Peptide, recombinant protein |
Natural mouse laminin | Thermo Fisher | 23017015 | |
| Peptide, recombinant protein |
Bone morphogenetic protein 4 (BMP4) |
R and D Systems | 314 BP | |
| Peptide, recombinant protein |
Vascular endothelial growth factor (VEGF) |
R and D Systems | 293-VE | |
| Peptide, recombinant protein |
Activin A | R and D Systems | 338-AC | |
| peptide, recombinant protein |
Fibroblast growth factor 10 (Fgf10) |
R and D Systems | 345-FG | |
| Peptide, recombinant protein |
Laminin-511 | iWaichem | N-892011 | |
| Chemical compound, drug |
Prolong Live Antifade Reagent |
Thermo Fisher | P36975 | |
| Chemical compound, drug |
ascorbic acid | Sigma | A45-44 | |
| Chemical compound, drug |
1-thioglycerol | Sigma | M6145 | |
| Chemical compound, drug |
PD03259010 | Selleckchem | S1036 | |
| Chemical compound, drug |
CHIR99021 | Selleckchem | S2924 | |
| Chemical compound, drug |
5,6-Dichlorobenzimidazole 1-β-D-ribofuranoside |
Sigma | D1916 | |
| Chemical compound, drug |
JF646 | PMID: 28869757 | ||
| Software, algorithm |
MS2Reporter AnalysisPipeline_knn Model.py |
this paper | Python scripts can be accessed on github (Alexander, 2018; copy archived at https://github.com/elifesciences-publications/2018_eLife_Alexander_et_al) |
|
| Other | Tetraspeck fluorescent beads |
Thermo Fisher | T7279 | |
| Commerical assay, kit |
KAPA Library Quantification Kit |
Roche | KK4854 | |
| Commerical assay, kit |
SPRIselect | Beckman Coulter | B23319 |
ESC Culture
129/CastEiJ F1 hybrid mouse embryonic stem cells were maintained in 2i + Lif media, composed of a 1:1 mixture of DMEM/F12 (Thermo Fisher Waltham, MA, #11320–033) and Neurobasal (Thermo Fisher #21103–049) supplemented with N2 supplement (Thermo Fisher #17502–048), B27 with retinoid acid (Thermo Fisher #17504–044), 0.05% BSA (Thermo Fisher #15260–037), 2 mM GlutaMax (Thermo Fisher #35050–061), 150 µM 1-thioglycerol (Sigma St. Louis, MO, M6145), 1 µM PD03259010 (Selleckchem Houston, TX, #1036), 3 µM CHIR99021 (Selleckchem #S2924) and 106 U/L leukemia inhibitory factor (Peprotech Rocky Hill, NJ, #250–02). Media was changed daily and cells were passaged every 2 days.129/CastEiJ ESCs were genetically verified by PCR amplification and Sanger sequencing of regions within the Sox2 locus to identify predicted SNPs between the parental genomes. These cells tested negatively for mycoplasma using MycoAlert Detect Kit (Lonza Basal, Switzerland #LT07-318).
ESC genome modification
For insertion of PhiC31 and Bxb1 attP sequences, 150,000 cells were electroporated with 1 µM of single-stranded oligonucleotide donor containing the attP sequence and 400 ng of the sgRNA/Cas9 dual expression plasmid pX330 (a gift from Feng Zhang, Addgene Plasmid #42230) using the Neon Transfection System (Thermo Fisher). Neon settings for the electroporation were as follows: 1400V, 10 ms pulse width, three pulses. Electroporated ESCs were given 3 days to recover, followed by seeding approximately 5000 cells on a 10 cm dish for clone isolation (see Clone Isolation).
For integration of the tetO and cuO array, 150,000 cells were electroporated with 300 ng each of (1) a tetOx224 repeat plasmid bearing a PhiC31 attB sequence and a FRT-flanked neomycin resistance cassette, (2) a cuOx144 repeat plasmid bearing a Bxb1 attB sequence and a floxed puromycin or blasticidin resistance cassette, (3) an expression plasmid for the PhiC31 integrase (a gift from Philippe Soriano, Addgene Plasmid #13795), and (4) an expression plasmid for the Bxb1 integrase using the Neon Transfection System. Electroporated ESCs were allowed to recover for 3 days, followed by 7 days of drug selection using 500 µg/mL G418 and either 1 µg/mL puromycin or 8 µg/mL blasticidin in antibiotic-free media. After drug selection, cells were electroporated again with 400 ng each of Cre and Flpo expression plasmids to remove the resistance cassettes. 3 days after electroporation, approximately 5000 cells were seeded on a 10 cm plate for clone isolation (see Clone Isolation).
For targeting of the MS2 reporter construct into the endogenous Sox2 allele, we generated a targeting plasmid that inserted a P2A sequence followed by the puromycin resistance gene upstream of the endogenous Sox2 stop codon with 1 kb homolog arms on either side. We next mutated the PAM sequence for our sgRNA in the 3’ homology arm by site-directed mutagenesis. 24 repeats of the MS2 hairpin sequence were inserted into an EcoRI restriction site located just 3’ of the puromycin stop codon. 150,000 cells were electroporated with 400 ng of targeting plasmid and 400 ng of pX330 expressing the appropriate sgRNA. Electroporated ESCs were given 3 days to recover, followed by 5 days of puromycin selection. Approximately 5000 cells were subsequently seeded on a 10 cm dish for clone isolation (see Clone Isolation). A positive clone was identified by PCR. DNA sequencing confirmed no mutations in the Sox2-P2A-puror cassette and identified a single bp deletion in the 3’ UTR of the non-targeted CastEiJ allele due to residual targeting of a non-canonical NAG PAM.
For deletion of the Sox2 Control Region or the Sox2-1-112T fragment, 150,000 cells were electroporated with 400 ng each of pX330 expressing sgRNAs targeting genomic regions centromeric and telomeric to the deletion fragment. 3 days after electroporation, approximately 5000 cells were seeded on a 10 cm plate for clone isolation (see Clone Isolation).
ESC clone isolation
After 5–6 days of growth at low density (~5000 cells per 10 cm dish), individual colonies were picked and transferred to a 96-well plate. Briefly, colonies were aspirated and transferred to a well with trypsin, followed by quenching and dissociation with 2i + Lif + 5% FBS. Once the 96-well plate had grown to confluency, we split the clones into 2 identical 96-well plates. One plate was frozen at −80°C by resuspending the clones in 80% FBS/20% DMSO freezing media. The second plate was used for DNA extraction. All wells were washed once with PBS and subsequently lysed overnight at 55°C in a humidified chamber with 50 µL lysis buffer (10 mM Tris-HCl, pH 8.3, 50 mM KCl, 1.5 mM MgCl2, 0.45% NP40, 0.45% Tween 20, 100 µg/mL Proteinase K). Genomic DNA was concentrated by ethanol precipitation and resuspended in 100 µL of double distilled water. 1 µL of suspension was used for subsequent PCR screening reactions using GoTaq Master Mix (Promega Madison, WI, #M7123).
Stable expression of fluorescent transgenes
To generate stable lines expressing CymR, TetR, and MS2cp fluorescent protein fusions, 150,000 cells were electroporated with 400 ng of an ePiggyBac Transposase expression plasmid (a gift from Ali Brivanlou) and 50 ng of expression plasmid bearing PiggyBac terminal repeats. 7 days after electroporation, fluorescent cells were resuspended in fluorescence-activated cell sorting (FACS) buffer (5% FBS in PBS) and purified via FACS using a FACSAria II (BD). To enrich cells expressing the CymR-Halox2 fusion protein, ESCs were incubated in 100 nM of Janeila Fluor 646 (a gift from Luke Lavis) for 30 min at room temperature, washed once in FACS Buffer, incubated for 30 min at room temperature in FACS Buffer, washed again, and sorted using a FACSAria II.
Isolation of Neural Progenitor Cells from ESCs
ESCs were passaged onto gelatinized 6 wells at 50,000–100,000 cells. The following day, these cultures were switched to N2B27 media (1:1 composition of DMEM/F12 and Neurobasal, N2 supplement, B27 with retinoic acid, 0.05% BSA, 2 mM GlutaMax, 150 µM 1-thioglycerol, 25 µg/mL insulin (Sigma #I6634)). After 4 days, we dissociated the cultures and seeded 1 million cells in an ungelatinized 10 cm dish in N2B27 with 10 ng/mL FGF basic (R and D Systems Minneapolis, MN, #233-FB) and 10 ng/mL EGF (Peprotech #315–09) to form neurospheres. After 3–4 days of outgrowth, neurospheres were collected by gentle centrifugation (180xg, 3 min) and plated onto a pre-gelatinized six well. Neural progenitor cell (NPCs) lines were established by passaging (4–6 passages). For maintainance of NPCs, cells were cultured on wells pre-treated with poly-D-lysine and 4 µg/mL natural mouse laminin (Thermo Fisher #23017015) in N2B27 with 10 ng/mL FGF basic and 10 ng/mL EGF and passaged every 4–5 days.
Differentiation of NPCs to neurons and astrocytes
To differentiate NPCs to astrocytes, 30,000 cells were plated onto coverglass within a 24 well pre-treated with poly-D-lysine and laminin. The following day, cells were switched to N2B27 with 10 ng/mL BMP4 (R and D Systems #314 BP) and allowed to differentiate for 12 days.
To differentiate NPCs to neurons, 30,000 cells were plated onto coverglass within a 24 well pre-treated with poly-D-lysine and laminin. The following day, cells were switched to N2B27 with 10 ng/mL FGF basic and allowed to differentiate for 6 days. Cells were then switched to N2B27 without additional factors and grown for 6 days.
Differentiation of cardiogenic mesodermal precursors from ESCs
ESCs were dissociated and seeded to form embryoid bodies at 1 million cells per dish in SFD media (3:1 composition of IMDM (Thermo Fisher #12440–053) and Ham’s F12 (Thermo Fisher #11765–054), N2 supplement, B27 without retinoic acid (Thermo Fisher #12587–010), 0.05% BSA, 2 mM GlutaMax, 50 µg/mL ascorbic acid (Sigma #A-4544), 450 µM 1-thioglycerol). After 2 days, EBs were dissociated and reaggregated at 1 million cells per dish in SFD media with 5 ng/mL VEGF (R and D Systems #293-VE), 5 ng/mL Activin A (R and D Systems #338-AC), and 0.75 ng/mL BMP4 to induce cardiogenic mesoderm. 40 hr after induction, cells were dissociated and stained for Flk1 and PDGFRα. Briefly, cells were washed four times in FACS Buffer, followed by incubation for 30 min with a biotinylated anti-FLK-1 antibody (Hybridoma Clone D218, 1:100). Cells were then washed three times with FACS Buffer and incubated with a PE-conjugated anti-PDGFRα (Thermo Fisher #12-1401-81, 1:400) and APC-Streptavidin (BD Biosciences Franklin Lakes, NJ, #554067, 1:200) for 30 min at room temperature. Cells were then washed two times with FACS Buffer and sorted for FLK1+/PDGFRα+ cells.
Immunofluorescence
NPCs or differentiated astrocytes/neurons on coverglass were fixed for 10 min at room temperature with 4% paraformaldehyde in PBS. After fixing, the coverglass were washed twice with PBS, permeabilized in PBS with 0.5% Triton X-100 for 10 min, and washed once in PBS with 0.1% Triton. Cells were then blocked for 1 hr at room temperature in PBS/0.1% Triton/4% goat serum. After blocking, coverglass were incubated in primary antibody in PBS/0.1% Triton/4% goat serum overnight at 4°C in a humidified chamber. Coverglass were subsequently washed three times with PBS/0.1% Triton and incubated in secondary antibody in PBS/0.1% Triton/4% goat serum at room temperature for 1 hr. After secondary incubation, coverglass were washed three times with PBS/0.1% Triton, stained with DAPI in PBS (1 µg/mL), and mounted on a slide for imaging in mounting medium (1x PBS, pH7.4, 90% glycerol, 5 mg/mL propyl gallate). Antibodies used were anti-SOX2 (Santa Cruz Biotechnology Dallas, TX, #sc-365823, Lot# K1414), anti-PAX6 (Biolegend San Diego, CA, #901301, Lot# B235967), anti-TUBB3 (Biolegend #801201, Lot# B199846), and anti-GFAP (Sigma #G3893, Lot# 105M4784V).
Western blotting
3 million cells were collected, washed once with PBS, and lysed in 4x Laemmli Buffer. Cell lysate was passed through a 30 gauge needle twenty times to shear the genomic DNA and the lysate was cleared by centrifugation at 13,000 RPM for 10 min at 4°C. Subsequently, lysate was supplemented with 100 mM DTT and boiled at 95°C for 10 min. 200,000 cells of protein lysate were loaded onto a Bis-Tris 4–12% polyacrylamide gel (ThermoFisher #NW04120BOX) and electrophoresis was carried out using the Bolt system (ThermoFisher). Protein was transferred to a PVDF membrane. Membranes were blocked for 1 hr at room temperature with 4% milk PBS Tween (PBST). Membrane was subsequently incubated in primary antibody overnight in 4% milk PBST at 4°C. Membranes were then washed four times 15 min at room temperature in PBST and incubated in secondary antibody in 4% milk PBST for 1 hr at room temperature. After secondary incubation, membranes were washed four times 15 min at room temperature in PBST, incubated in SuperSignal chemiluminescence HRP substrate (ThermoFisher #34075), and visualized by film exposure. Antibodies used were anti-SOX2 (Santa Cruz #sc-365823, Lot# K1414) and anti-β-actin (Abcam Cambridge, UK, ab8227, Lot# GR92448-1).
Quantitative PCR
RNA was extracted from 500,000 to 1,000,000 million cells using TRIzol and 200 ng of RNA was reversed transcribed using the QuantiTect Reverse Transcription kit (Qiagen Hilden, Germany). Quantitative PCR was performed on 8 ng cDNA in technical triplicates using TaqMan Gene Expression Master Mix (ThermoFisher #4369016) on a 790HT Fast Real-Time PCR System (ThermoFisher). The primer and probe sets used are as follows:
Sox2 Forward primer – 5’CTACGCGCACATGAACGG3’,
Sox2 Reverse primer – 5’CGAGCTGGTCATGGAGTTGT3’,
Sox2 129 allele probe –/56-FAM/CAACCGATG/ZEN/CACCGCTACGA/3IABkFQ/,
Sox2 CastEiJ allele probe –/56-FAM/CAGCCGATG/ZEN/CACCGATACGA/3IABkFQ/, Tbp Forward primer – 5’ACACTCAGTTACAGGTGGCA3’,
Tbp Reverse primer – 5’AGTAGTGCTGCAGGGTGATT3’,
Tbp probe -/56-FAM/ACACTGTGT/ZEN/GTCCTACTGCA/3IABkFQ.
56-FAM = Fluorescein
ZEN = internal quencher (IDT)
3IABkFQ = 3’ Iowa Black quencher
Circular chromosome conformation capture (4C) Sequencing
4C using the Sox2 promoter as a bait region was prepared as previously described (van de Werken et al., 2012). Primers used for 4C amplification are as follows:
Sox2 promoter Forward primer - CAAGCAGAAGACGGCATACGAGATACXXXXXXGTGACTGGAGTTCAGACGTGTGCTCTTCCGATCTGAATTAGGGGTTGAGGACAC
Sox2 promoter Reverse primer – AATGATACGGCGACCACCGAGATCTACACTCTTTCCCTACACGACGCTCTTCCGATCTAGAGGGTAATTTTAGCCGATC
where XXXXXX stands for a barcode sequence and sequence complementary to the viewpoint fragment containing the Sox2 promoter is underlined.
Single cell suspensions of mouse embryonic stem cells were cross-linked with 1% formaldehyde in PBS for 10 min at room temperature. Nuclei were isolated in lysis buffer (10 mM Tris-HCl pH8.0, 10 mM NaCl, 0.2% Igepal CA630, 1X protease inhibitor),and cross-linked chromatin was digested with DpnII (0.4 U/µL, 100U total) overnight at 37°C. This was followed by proximity ligation with 2000 units of T4 DNA Ligase (NEB, #M0202, 2 U/µL) for 4 hr at room temperature. After ligation, samples were treated with 1 mg/mL Proteinase K, 10% SDS for 30 min at 55°C, followed by reverse crosslinking through addition of 5M NaCl and heating to 65°C overnight. Circularized DNA was then linearized by subsequent digestion with 50 units of NlaIII (0.1 U/µL) overnight at 37°C. Typically, 200 ng of the resulting 4C template was used for the subsequent PCR reaction. The 4C template was PCR amplified for 30 cycles and 3–4 reactions were pooled together. Primers were designed such that the single-end read would sequence the primer binding site of the bait region and read into the target region of interest. The primers were designed to include Illumina adaptor sequences as well as barcodes derived from Illumina’s TruSeq adaptors, which allowed for multiplexing of 4C-seq reactions. The PCR products were then purified using dual SPRI bead selection (Beckman Coulter, Indianapolis, IN Cat# B23319) to get template between 120–1000 bp according to the manufacturer’s instructions. The concentrations of each 4C library were calculated using the KAPA qPCR system (Roche Basal, Switzerland Cat# KK4854) and comparison to a standard curve. The libraries were then combined and sequenced on a HiSeq 4000 (Illumina San Diego, CA) with single-end 50 bp reads.
For generating near-cis plots, 4C reads were first trimmed using cutadapt (Martin, 2011, RRID:SCR_011841) to remove the reading primer sequences, then mapped to the mm9 genome using bwa (Li and Durbin, 2009, RRID:SCR_010910). Mapped reads were filtered for valid 4C fragments, normalized to reads per million, and visualized at the Sox2 genomic locus using Basic4CSeq (Walter et al., 2014, RRID:SCR_002836).
For allele-specific read assignments, 4C reads were trimmed using cutadapt. Reads were then mapped to a modified mm9 genome using bowtie2 (Langmead and Salzberg, 2012) with default settings, where base positions annotated as heterozygous in the F123 129/CastEiJ hybrid cell line were masked. Reads mapping within the SCR (mm9 genomic coordinates chr3: 34653927–34660927) were then assigned to the 129 or Cast allele using SNPsplit.
Live-Cell microscopy
We imaged all experiments on a Nikon Ti-E microscope and the following setup for live, spinning disk confocal microscopy: Yokogawa CSU-22 spinning disk, 150 mW Coherent OBIS 488 nm laser, 100 mW Coherent OBIS 561 nm laser, 100 mW Coherent OBIS 640 nm laser, a Yokogawa 405/491/561/640 dichroic, zET405/488/561/635 m quad pass emission filter, Piezo Z-drive, Okolab enclosure allowing for heating to 37°C, humidity control, and CO2 control, and a Plan Apo VC 100x/1.4 oil immersion objective. Image acquisition utilized either a Photometric Evolve Delta EMCCD or an Andor iXon Ultra EMCCD camera. Pixel size using this set up was 91 nm.
ESCs were plated one day prior to imaging on a 8-chambered coverglass (VWR Radnor, PA, #155409) pretreated for at least 2 hr with 3.1 µg/mL Laminin-511 (iWaichem Tokyo, Japan #N-892011) at 120,000 cells per chamber. Just prior to imaging, 2i + Lif media was pre-mixed with 50 µg/mL ascorbic acid and a 1:100 dilution of Prolong Live Antifade Reagent (ThermoFisher P36975). If the cells to be imaged also expressed CymRHalox2, 100 nM of JF646 was also added to the media. After a one hour incubation, we added this media to the ESCs to be imaged. When indicated, ESC media was supplemented with 75 µM DRB (Sigma D1916) and incubated for 1 hr prior to image acquisition.
NPCs were plated at least 8 hr prior to imaging on a 8-chambered coverglass pre-treated with poly-D-lysine and laminin at 120,000 cells per chamber. Prior to imaging, N2B27 with FGF basic and EGF was pre-mixed with 50 µg/mL ascorbic acid and a 1:100 dilution of Prolong Live Antifade Reagent. After a one hour incubation, we added this media to the NPCs to be imaged.
Cardiogenic mesodermal cells enriched by FACS for FLK1 and PDGFRα were plated on 8-chambered coverglass precoated with 0.1% gelatin in StemPro-34 (Thermo Fisher #10639–011) supplemented with 2 mM GlutaMax, 50 µg/mL ascorbic acid, 5 ng/mL VEGF, 10 ng/mL FGF basic, and 25 ng/mL FGF10 (R and D Systems #345-FG) and cultured for 24 hr. Just prior to imaging, StemPro-34 media (with the additives listed above) was supplemented with a 1:100 dilution of Prolong Live Antifade Reagent, incubated for one hour, and subsequently added to the cultures for imaging.
For imaging experiments using CymRGFP and TetRtdTom, we captured green and red images by toggling the 488 nm and 561 nm lasers with a zET405/488/561/635 m multi-band pass emission filter in place, respectively. All colors were collected per plane prior to moving to next the plane (i.e. Z1-C1, Z1-C2, Z2-C1, Z2-C2, etc.) Z-planes were spaced 300 nm apart and exposure times were 30 ms. Each z-stack was composed of 21–28 slices and spaced 20 s apart. A single z-stack using this protocol required approximately 1.6 s for completion. Examples of raw and denoised data stacks used for analysis can be found at doi: 10.5281/zenodo.2658814; https://zenodo.org/record/2658814#.XNDLAhNKjyw.
For imaging experiments using CymRHalox2-JF646, TetRGFPx2, abd tdMS2cp-tagRFP-Tx2, we imaged the green and far red channels as above except the the 488 nm and 640 nm lasers were used. After completion of the initial z-stack, a second z-stack was constructed at identical z-positions using the 561 nm laser and a ET525/50 m emission filter to capture tdMS2cp-tagRFP-Tx2 fluorescence. This eliminated bleed-through signal from the JF646 dye during 561 nm excitation allowed by the quad pass emission filter. Exposure times for this second z-stack were 50 ms.
All images were acquired using μManager (Edelstein et al., 2010, RRID:SCR_016865). Imaging data for each condition is composed of a minimum of three imaging sessions, except for cardiogenic mesodermal cultures, in which duplicate differentiations were performed.
Image processing
Images were background subtracted using a dark image, converted to 32-bit, and denoised using NDSafir (Carlton et al., 2010; Kervrann and Boulanger, 2006) with the following settings: ndsafir_priism input_image denoised_image -4d = zt -noise=”poisson’ -iter = 4 -p = 1 -sampling=-1 -adapt = 10 -island = 4 usetmp.
Denoised images were reverted back to 16-bit, fluorescence bleach corrected using exponential fitting and despeckled to remove high-frequency noise using ImageJ (Schindelin et al., 2012; Schneider et al., 2012, RRID:SCR_003070).
Image analysis
Tracking loci
Maximum Z-projections of 3D time series were manually analyzed to identify cuO/CymR and tetO/TetR spots in nuclei and annotate individual loci as doublets (likely two sister chromatids) or singlets. Loci that showed any frames with doublet spots for either channel were not included in downstream analysis. For each Sox2 locus with well-behaved singlets, an ROI was drawn that included the locus location throughout the timecourse (or if the locus became untrackable due to leaving the field of view, the duration of its visibility). In some cases (e.g. NPCs), multiple ROIs were needed to track a single loci because of large-scale movements of the cell nucleus. In these cases, location data were merged together after tracking. For each locus, the 3D location for the cuO/CymR spot and the tetO/TetR spot was tracked within the delimited ROI using TrackMate (Tinevez et al., 2017) and its Laplacian of Gaussian spot detector with a sparse LAP tracker. The following additional settings were used:
DO_SUBPIXEL_LOCALIZATION = true
RADIUS = 2.5 pixels
THRESHOLD = 0
DO_MEDIAN_FILTERING = false
ALLOW_TRACK_SPLITTING = false
ALLOW_TRACK_MERGING = false
LINKING_MAX_DISTANCE = 20 pixels for ESCs, MES/40 pixels for NPCs
GAP_CLOSING_MAX_DISTANCE = 30 pixels for ESCs, MES/60 pixels for NPCs
MAX_FRAME_GAP = 3 frames
LINKING_FEATURE_PENALTIES = (QUALITY: 1.0, POSITION_Z: 0.8)
GAP_CLOSING_FEATURE_PENALTIES = (QUALITY: 1.0, POSITION_Z: 0.8)
TRACK_FILTER = TRACK_DURATION: 10
A Spot Quality Filter was also applied to result in detection of 20% more spots than the number of frames in the time course. This threshold was found to minimize spurious spot detection while also minimizing the loss of bona-fide cuO/tetO localization. In the case where solely the location of the Sox2 promoter was of interest (i.e. for identifying and quantitating Sox2 transcriptional bursts across all cells), cuO/CymR-Halox2 spots were tracked as above except ALLOW_TRACK_MERGING was set to true. This facilitated recording a single track when the Sox2 locus showed two sister chromatids.
TrackMate tracks for each spot were manually inspected, and if multiple tracks existed (due to gaps in the tracking), these were merged through manual curation. Spot positions converted to physical distances using a 0.091 µm pixel size and a 0.3 µm z-step.
Correction for chromatic aberration
We corrected for chromatic aberration by collecting a single z-stack of TetraSpeck fluorescent beads (ThermoFisher #T7279) embedded in 2% agrose using the 488 nm, 561 nm, and 640 nm laser. Exposure time for was 50 ms. Positions of the beads were determined using TrackMate and its Laplacian of Gaussian spot detector with the following additional settings:
DO_SUBPIXEL_LOCALIZATION = true
RADIUS = 2.5 pixels
THRESHOLD = 0
DO_MEDIAN_FILTERING = false
SPOT_FILTER = QUALITY: 100
Differences between the position of each bead in the green and red as well as green and far-red channel were determined. Based on these data, we calculated linear models for chromatic aberration correction in X, Y, and Z based on position within the field of view. The following corrections were applied to the green channel when being compared to red:
The following corrections were applied to the green channel when being compared to far-red:
Localization precision estimation
Tetraspeck (Thermo Fisher T7279) multicolor fluorescent beads were embedded in 2% agarose and a one hundred frame Z-stack time series was constructed at various laser intensities. The max spot intensity as well as the mean and standard deviation of the nuclear background was estimated from ten nuclei for both cuO/CymR and tetO/TetR using our raw time-lapse data. Bead time series were modified to add background noise using ImageJ to approximate the nuclear background and then denoised as described above. 9–15 beads that showed signal within one standard deviation of that observed for either the cuO/CymR or tetO/TetR spots were tracked using TrackMate and the following additional settings:
DO_SUBPIXEL_LOCALIZATION = true
RADIUS = 2.5 pixels
THRESHOLD = 0
DO_MEDIAN_FILTERING = false
A spot filter for spot quality was set manually to only include the top 100 detected spots. The standard deviation of position of each bead was computed in the X, Y, and Z dimensions using a five frame sliding window to generate a distribution of estimated uncertainties.
As an addition measure of localization precision, Sox2-SCR ESCs expressing CymR-GFP and TetR-tdTom were cultured on coverglass as described for live-cell imaging above. Prior to imaging, the growth medium was removed and cells were fixed using 4% PFA in PBS for 5 min at room temperature. Cells were washed once with PBS and imaged in PBS. Two color z-stacks were captured at 72 time points using settings that were identical to live-cell microscopy except that there was no time delay between frames. These images were then processed identically to that used for live-cell microscopy. Spots from 10 to 14 Sox2 loci were tracked across the time course using TrackMate and the following settings:
DO_SUBPIXEL_LOCALIZATION = true
RADIUS = 2.5 pixels
THRESHOLD = 0
DO_MEDIAN_FILTERING = false
A spot filter for spot quality was set manually to only include the top 72 detected spots. As with the fluorescent beads, the standard deviation of position for both the cuO and tetO label was computed in the X, Y, and Z dimensions using a five frame sliding window to generate a distribution of estimated uncertainties.
Simulation of 3D distance measurement bias and uncertainty
To estimate the measurement bias of distance measurements, 1000 X, Y, and Z positions were sampled from normal distributions with standard deviations equal to the median values of our localization precision estimates (X = 12 nm, Y = 10 nm, Z = 36 nm for cuO and X = 16 nm, Y = 16 nm, Z = 50 nm for tetO). The means of these distributions were fixed a 0 for cuO and varied over a range for tetO to simulate a range of separation distances. True distance was calculated as the Euclidean distance between points located at the center of the cuO and tetO distributions. Simulated measured distance was taken as the mean of the sampled Euclidean distances.
To estimate the uncertainty of distance measurements, we repeated the analysis above except the number of sampled positions was increased to 50,000. Simulated distance uncertainty was taken as the interquartile range of the simulated measured distances.
Euclidean distance
1D, 2D, and 3D euclidean distances were calculated using the formula:
where and represent the cuO/CymR and tetO/TetR spot, respectively, and the number of dimensions.
Relative displacement
The relative position of spot1 (CymRGFP) with respect to spot2 (TetRtTom) for the th dimension was calculated as follows:
The relative displacement was then calculated as the change is the relative position of spot 1.
where is the current frame and is the number of dimensions.
Autocorrelaton analysis
Autocorrelation values were calculated according to the formula
where represents distance at time , is the time lag, and are the average and variance of 3D distance measured across the cell population, and is the expected (i.e. average) value. Confidence intervals were computed by bootstrapping and recalculating across 1000 simulations to estimate 95% confidence.
Distribution distances and clustering
The distance between 3D distance probability distributions from two cell lines or cell types was computed using earth mover’s distance (EMD). Briefly, the earth mover’s distance is the minimum cost to convert one probability distribution to the other over a defined region. We calculated pairwise EMD for each 3D probability distribution using the R package earthmovdist. Complete-linkage hierachical clustering was then performed to generate a dendrogram.
MS2 signal identification and quantification
3D time-lapse images of tdMS2cp-tagRFP-Tx2 were converted into 2D images by maximum Z projection. For each Sox2 locus considered for analysis, a 20 × 20 pixel region centered on the XY tracking position of the cuO/CymR spot, reflecting the position of the Sox2 promoter region, was analyzed for each frame. If tracking information was missing for a given frame, the position coordinates from the nearest frame were used. This 20 × 20 region was used for parameter estimation for 2D Gaussian fitting using the equation:
where (Gaussian height), (location of Gaussian peak), (Gaussian variance), and (offset) are all estimated parameters. Initial estimate of the offset was defined as the median pixel value in the ROI, was estimated as the maximum pixel value minus the estimated offset, and were estimated as 1, and was estimated as the location of the brightest pixel in the ROI. These initial estimates were used attempt a Gaussian fit on a 10x10 pixel region centered on the estimated Gaussian position. We constrained the potential Gaussian fit to have a minimum height of 10% above background fluorescence, a fit position of no more than 3 pixels from the estimated position, and a width of no more than 4. Successful Gaussian fits were filtered for likelihood to reflect true MS2 signal using a k-nearest neighbor model trained on manually classified data and 4 parameters of the fit (, , , and an value). Furthermore, frames were also required to have at least one neighboring frame (± 3 frames) also demonstrate MS2 signal, eliminating high frequency noise. Time points which passed these filter steps were assigned a relative MS2 Signal based on:
were the normalization factor was the median pixel value for the 20 × 20 pixel ROI across all timepoints. For time points that did not pass filter, MS2 signal was taken as the median value of the 20 × 20 ROI for the current frame normalized as above.
Sox2 burst classification
Sox2 burst initiation events were classified as frames positive for MS2 signal (see above) that lack MS2 positive classifications for the preceding three frames. All frames spanning the burst initiation and the last positive MS2 classification prior to the next burst initiation were labeled as one burst event.
Aligned Sox2 burst analysis
To align our MS2 data across all Sox2 bursts, a defined window was sampled for each burst centered on the burst initiation event. We subsequently generated a randomly sampled control comparison for this analysis by randomly shuffling the frames labeled as burst initiation events and repeating the analysis. Mean distances or MS2 signal were then calculated based on relative frame compared to the burst initiation event. Confidence intervals were computed by bootstrapping and recalculating the mean value for each relative frame across 1000 simulations to estimate 95% confidence.
Browser tracks
Unless wiggle files were available as part of the accession, sequencing read archives (SRA) were downloaded from NCBI and reads were aligned to the mm9 mouse genome using Bowtie (Langmead et al., 2009, RRID:SCR_005476) as part of the Galaxy platform (Afgan et al., 2018, RRID:SCR_006281). Sequences were extended by 200 bp and allocated into 25 bp bins to generate wiggle files. HiC data were visualized using JuiceBox (Durand et al., 2016). Browser tracks were visualized on the UCSC Genome browser (Kent et al., 2002, RRID:SCR_005780).
Acknowledgements
We thank Elphege Nora, Geoffrey Fudenberg, Brian Black, and members of the Lomvardas and Weiner labs for helpful discussion; Elphege Nora, Benoit Bruneau, and Kirstin Meyer for a critical reading of the manuscript; Lena Bengtsson for experimental help and technical assistance; and Edith Heard, Patrick Devine, Feng Zhang, Elphege Nora, Michele Calos, Robert Singer, Philippe Soriano, Barbara Panning, Ali Brivanlou and Luke Lavis for helpful reagents. This work was supported by an American Heart Association Postdoctoral Fellowship (#16POST309100006, JMA); NIH Grants R21EB022787 (ODW), R35GM118167 (ODW), R01DC013560 (SL), T32GM007175 (MS), R21HG010065 (YS), UM1HG009402 (YS), and R21EB021453 (BH); and the WM Keck Foundation Medical Research Grant (BH). BH is a Chan Zuckerberg Biohub Investigator.
Funding Statement
The funders had no role in study design, data collection and interpretation, or the decision to submit the work for publication.
Contributor Information
Orion D Weiner, Email: orion.weiner@ucsf.edu.
Robert H Singer, Albert Einstein College of Medicine, United States.
Kevin Struhl, Harvard Medical School, United States.
Funding Information
This paper was supported by the following grants:
American Heart Association 16POST309100006 to Jeffrey M Alexander.
National Institute of General Medical Sciences R35GM118167 to Orion D. Weiner.
National Institute on Deafness and Other Communication Disorders R01DC013560 to Stavros Lomvardas.
National Institute of Biomedical Imaging and Bioengineering R21EB022787 to Orion D. Weiner.
National Institute of Biomedical Imaging and Bioengineering R21EB021453 to Bo Huang.
W. M. Keck Foundation Medical Research Grant to Bo Huang.
National Human Genome Research Institute R21HG010065 to Yin Shen.
National Human Genome Research Institute UM1HG009402 to Yin Shen.
National Institute of General Medical Sciences T32GM007175 to Michael Song.
Additional information
Competing interests
No competing interests declared.
Author contributions
Conceptualization, Data curation, Formal analysis, Investigation, Visualization, Methodology, Writing—original draft, Writing—review and editing.
Software, Methodology, Writing—review and editing.
Formal analysis, Visualization, Writing—review and editing.
Investigation, Writing—review and editing.
Formal analysis, Investigation, Visualization, Writing—review and editing.
Conceptualization, Supervision, Funding acquisition, Writing—review and editing.
Supervision, Writing—review and editing.
Supervision, Funding acquisition, Writing—review and editing.
Conceptualization, Supervision, Funding acquisition, Writing—review and editing.
Additional files
Protocols for targeting the cuO and/or tetO array(s) into genomic regions of interest in mouse ESCs.
List of PCR primer sequences and expected amplicon size used in the study. Brief description of the purpose of each primer pair is included.
List of 20 bp sequences homologous to the mouse 129 genome designed into CRISPR/Cas9 sgRNAs. Targeted genomic location (mm9 coordinates), genome strand, and brief description of purpose for sgRNA is included.
All data used in the study for cuO/CymR and tetO/TetR localization. C1 refers to Channel 1 (cuO/CymR). C2 refers to Channel2 (tetO/TetR). For examples of raw and denoised data files that were used for this analysis, see doi: 10.5281/zenodo.2658814; https://zenodo.org/record/2658814#.XNDLAhNKjyw. Columns are as follows:
Cell_Line– label used to identify cell line
Batch– unique microscopy session identifier
C1_T_Step-sec– step size between frames
Locus_ID– unique identifier for each Sox2 locus
C1_TrackID– track identifier from TrackMate
C1_Track_Length– track length from TrackMate
C1_SpotID– spot identifier from TrackMate
C1_X_Value_pixel – X position in pixels for C1 spot
C1_Y_Value_pixel – Y position in pixels for C1 spot
C1_Z_Value_slice – Z position in slices for C1 spot
C1_T_Value_frame – frame of measurement
C1_X_Value_um – X position in microns for C1 spot
C1_Y_Value_um – Y position in microns for C1 spot
C1_Z_Value_um – Z position in microns for C1 spot
C1_T_Value_sec – time point in seconds for measurement
C2_TrackID– track identifier from TrackMate
C2_Track_Length– track length from TrackMate
C2_SpotID– spot identifier from TrackMate
C2_X_Value_pixel – X position in pixels for C2 spot
C2_Y_Value_pixel – Y position in pixels for C2 spot
C2_Z_Value_slice – Z position in slices for C2 spot
C2_T_Value_frame – imaging frame
C2_X_Value_um – X position in microns for C2 spot
C2_Y_Value_um – Y position in microns for C2 spot
C2_Z_Value_um – Z position in microns for C2 spot
C2_T_Value_sec – time point in seconds
X_Distance_um– X distance between C1 and C2 labels
Y_Distance_um– Y distance between C1 and C2 labels
Z_Distance_um– Z distance between C1 and C2 labels
XY_Distance_um– XY distance between C1 and C2 labels
XYZ_Distance_um–XYZ distance between C1 and C2 labels,
C1_Corrected_X_Value_um – X position in microns for C1 spot after correcting for chromatic aberration,
C1_Corrected Y_Value_um–Y positfion in microns for C1 spot after correcting for chromatic aberration
C1_Corrected Z_Value_um–Z position in microns for C1 spot after correcting for chromatic aberration
Corrected_X_Distance_um–X distance after correcting for chromatic aberration
Corrected_Y_Distance_um – Y distance after correcting for chromatic aberration
Corrected_Z_Distance_um – Z distance after correcting for chromatic aberration
Corrected_XY_Distance_um – XY distance after correcting for chromatic aberration
Corrected_XYZ_Distance_um – XYZ distance after correcting for chromatic aberration
Relative_C1_Corrected_X_Value_um–X position of C1 label relative to the position of C2 in microns
Relative_C1_Corrected_Y_Value_um–Y position of C1 label relative to the position of C2 in microns
Relative_C1_Corrected_Z_Value_um–Z position of C1 label relative to the position of C2 in microns
Relative_XY_Displacement_um–Relative XY distance traveled by the C1 label between adjacent frames
Relative_XYZ_Displacement_um–Relative XYZ distance traveled by the C1 label between adjacent frames
Relative_XY_Angle_radians–Relative angle between two successive displacements for the C1 label in the XY plane
All data used in transcriptional analysis of Sox2 locus. Columns are as follows:
Cell_Line– label used to identify cell line
Locus_ID– unique identifier for each Sox2 locus
Gauss_Filter– whether the MS2 Gaussian fit passed the knn filter step
Noise_Filter–whether the MS2 Gaussian fit passed a high frequency noise filter step
Pass_Filter–whether the MS2 signal for the given frame was classified as transcriptional signal. Required both Gauss_Filter = TRUE and Noise_Filter = TRUE
Gaussian_Height_Threshold–minimum relative height above background allowed for Gaussian fit
Gaussian_Width_Threshold–maximum Gaussian variance allowed for Gaussian fit
Background–Offset calculated from Gaussian fit. If no Gaussian fit was found, set to median pixel intensity of ROI
Gaussian Height–Amplitude calculated from Gaussian fit. If no Gaussian fit was found, set to 0
Gaussian_Volume–Volume under fitted Gaussian. If no Gaussian fit was found, set to 0
Local_Median–Median pixel intensity of ROI
Norm_MS2_Signal–Relative height of MS2 gaussian normalized to background. For frames that did not pass filter, local median value was used in pace of gaussian height. See MATERIALS and METHODS for more details.
R_Squared–Coefficient of determination between 2D gaussian fit and experimental data
T_Value_frame– imaging frame
X_Value_pixel– X position in pixels for C2 spot (cuO/CymR)
X_Location– X position of peak of fit Gaussian
X_Sigma– X dimension variance of fit Gaussian
Y_Value_pixel– Y position in pixels for C2 spot (cuO/CymR)
Y_Location– Y position of peak of fit Gaussian
Y_Sigma– Y dimension variance of fit Gaussian
Z_Value_slice– Z position in slices for C2 spot (cuO/CymR)
Batch– unique microscopy session identifier.
Data used to compare transcriptional activity of Sox2 locus to 3D distances between Sox2 and SCR. C1 refers to Channel 1 (tetO/TetR). C2 refers to Channel2 (cuO/CymR). Columns are as in Supplementary files 3 and 4 with one additional column: Active_Transcribing– Whether the locus demonstrated any MS2 signal that passed filter during imaging session.
Summary statistics and associated Mann-Whitney p-values for pairwise comparisons between burst centered and random centered distances.
Data availability
All microscopy localization data utilized in this study are included as supplementary files. Example raw confocal stacks and denoised confocal stacks from Batch65 imaging available on Zenodo. Tracking data for cuO and tetO from these images can be found in Supplementary file 4. Details of microscopy acquisition in Materials and Methods. Sequencing data have been deposited in GEO under accession code GSE127901 and SRA under accession code PRJNA523665.Python scripts can be accessed on GitHub at https://github.com/JMAlexander/2018_eLife_Alexander_et_al (copy archived at https://github.com/elifesciences-publications/2018_eLife_Alexander_et_al).
The following datasets were generated:
Alexander JM, Guan J, Li B, Maliskova L, Song M, Shen Y, Huang B, Lomvardas S, Weiner OD. 2019. 4C on Sox2 Locus with tetO/cuO Modifications. NCBI Gene Expression Omnibus. GSE127901
Alexander JM, Guan J, Li B, Maliskova L, Song M, Shen Y, Huang B, Lomvardas S, Weiner OD. 2019. Live-Cell Imaging Reveals Enhancer-dependent Sox2 Transcription in the Absence of Enhancer Proximity. Zenodo.
The following previously published datasets were used:
Wamstad JA, Alexander JM, Truty RM, Shrikumar A, Li F, Ellertson KE, Ding H, Wylie JN, Pico AR, Capra JA, Erwin G, Kattman SJ, Keller GM, Srivastava D, Levine SS, Pollard KS, Holloway AK, Boyer LA, Bruneau BG. 2013. ChIP-seq analysis of histone modifications and RNA polymerase II at 4 stages of directed cardiac differentiation of mouse embryonic stem cells. NCBI Gene Expression Omnibus. GSE47949
Vierstra J, Rynes E, Sandstrom R, Thurman RE, Zhang M, Canfield T, Sabo PJ, Byron R, Hansen RS, Johnson AK, Vong S, Lee K, Bates D, Neri F, Diegel M, Giste E, Haugen E, Dunn D, Humbert R, Wilken MS, Josefowicz S, Samstein R, Chang K, Levassuer D, Disteche C, De Bruijn M, Rey TA, Skoultchi A, Rudensky A, Orkin SH, Papayannopoulou T, Treuting P, Selleri L, Kaul R, Bender MA, Groudine M, Stamatoyannopoulos JA. 2014. Mouse regulatory DNA landscapes reveal global principles of cis-regulatory evolution. NCBI Gene Expression Omnibus. GSE51336
Chen X, Xu H, Yuan P, Fang F, Huss M, Vega VB, Wong E, Orlov YL, Zhang W, Jiang J, Loh YH, Yeo HC, Yeo ZX, Narang V, Govindarajan KR, Leong B, Shahab A, Ruan Y, Bourque G, Sung WK, Clarke ND, Wei CL, Ng HH. 2008. Mapping of transcription factor binding sites in mouse embryonic stem cells. NCBI Gene Expression Omnibus. GSE11431
de Wit E, Vos ES, Holwerda SJ, Valdes-Quezada C, Verstegen MJ, Teunissen H, Splinter E, Wijchers PJ, Krijger PH, de Laat W. 2015. CTCF binding polarity determines chromatin looping. NCBI Gene Expression Omnibus. GSE72539
Bonev B, Mendelson Cohen N, Szabo Q, Fritsch L, Papadopoulos G, Lubling Y, Xu X, Lv X, Hugnot J, Tanay A, Cavalli G. 2017. Multi-scale 3D genome rewiring during mouse neural development. NCBI Gene Expression Omnibus. GSE96107
Creyghton MP, Cheng AW, Welstead GG, Kooistra T, Carey BW, Steine EJ, Hanna J, Lodato MA, Frampton GM, Sharp PA, Boyer LA, Young RA, Jaenisch R. 2010. ChIP-Seq of chromatin marks at distal enhancers in Mouse Embryonic Stem Cells and adult tissues. NCBI Gene Expression Omnibus. GSE24164
Zhang Y, Wong CH, Bimbaum RY, Li G, Favaro R, Ngan CY, Lim J, Tai E, Poh HM, Wong E, Mulawadi FH, Sung WK, Nicolis S, Ahituv N, Ruan Y, Wei CL. 2013. Chromatin connectivity maps reveal dynamic promoter-enhancer long-range associations. NCBI Gene Expression Omnibus. GSE44067
Hansen AS, Pustova I, Cattolico C, Tjian R, Darzacq X. 2017. CTCF and cohesion regulate chromatin loop stability with distinct dynamics. NCBI Gene Expression Omnibus. GSE90994
References
- Afgan E, Baker D, Batut B, van den Beek M, Bouvier D, Cech M, Chilton J, Clements D, Coraor N, Grüning BA, Guerler A, Hillman-Jackson J, Hiltemann S, Jalili V, Rasche H, Soranzo N, Goecks J, Taylor J, Nekrutenko A, Blankenberg D. The Galaxy platform for accessible, reproducible and collaborative biomedical analyses: 2018 update. Nucleic Acids Research. 2018;46:W537–W544. doi: 10.1093/nar/gky379. [DOI] [PMC free article] [PubMed] [Google Scholar]
- Alberts B, Johnson AD, Lewis J, Morgan D, Raff M, Roberts K, Walter P. Molecular Biology of the Cell. W. W. Norton & Company; 2014. [Google Scholar]
- Alexander JM. Alexander_et_al_2018. f8a68bcGitHub. 2018 https://github.com/JMAlexander/2018_eLife_Alexander_et_al
- Banerji J, Olson L, Schaffner W. A lymphocyte-specific cellular enhancer is located downstream of the joining region in immunoglobulin heavy chain genes. Cell. 1983;33:729–740. doi: 10.1016/0092-8674(83)90015-6. [DOI] [PubMed] [Google Scholar]
- Bartman CR, Hsu SC, Hsiung CC, Raj A, Blobel GA. Enhancer Regulation of Transcriptional Bursting Parameters Revealed by Forced Chromatin Looping. Molecular Cell. 2016;62:237–247. doi: 10.1016/j.molcel.2016.03.007. [DOI] [PMC free article] [PubMed] [Google Scholar]
- Beagan JA, Duong MT, Titus KR, Zhou L, Cao Z, Ma J, Lachanski CV, Gillis DR, Phillips-Cremins JE. YY1 and CTCF orchestrate a 3D chromatin looping switch during early neural lineage commitment. Genome Research. 2017;27:1139–1152. doi: 10.1101/gr.215160.116. [DOI] [PMC free article] [PubMed] [Google Scholar]
- Belmont AS, Straight AF. In vivo visualization of chromosomes using lac operator-repressor binding. Trends in Cell Biology. 1998;8:121–124. doi: 10.1016/S0962-8924(97)01211-7. [DOI] [PubMed] [Google Scholar]
- Benabdallah NS, Williamson I, Illingworth RS, Boyle S, Grimes GR, Therizols P, Bickmore WA. PARP mediated chromatin unfolding is coupled to long-range enhancer activation. bioRxiv. 2017 doi: 10.1101/155325. [DOI]
- Bertrand E, Chartrand P, Schaefer M, Shenoy SM, Singer RH, Long RM. Localization of ASH1 mRNA particles in living yeast. Molecular Cell. 1998;2:437–445. doi: 10.1016/S1097-2765(00)80143-4. [DOI] [PubMed] [Google Scholar]
- Bickmore WA. The spatial organization of the human genome. Annual Review of Genomics and Human Genetics. 2013;14:67–84. doi: 10.1146/annurev-genom-091212-153515. [DOI] [PubMed] [Google Scholar]
- Blum R, Vethantham V, Bowman C, Rudnicki M, Dynlacht BD. Genome-wide identification of enhancers in skeletal muscle: the role of MyoD1. Genes & Development. 2012;26:2763–2779. doi: 10.1101/gad.200113.112. [DOI] [PMC free article] [PubMed] [Google Scholar]
- Bonev B, Mendelson Cohen N, Szabo Q, Fritsch L, Papadopoulos GL, Lubling Y, Xu X, Lv X, Hugnot JP, Tanay A, Cavalli G. Multiscale 3D Genome Rewiring during Mouse Neural Development. Cell. 2017;171:557–572. doi: 10.1016/j.cell.2017.09.043. [DOI] [PMC free article] [PubMed] [Google Scholar]
- Bothma JP, Garcia HG, Esposito E, Schlissel G, Gregor T, Levine M. Dynamic regulation of eve stripe 2 expression reveals transcriptional bursts in living Drosophila embryos. PNAS. 2014;111:10598–10603. doi: 10.1073/pnas.1410022111. [DOI] [PMC free article] [PubMed] [Google Scholar]
- Boyle AP, Davis S, Shulha HP, Meltzer P, Margulies EH, Weng Z, Furey TS, Crawford GE. High-resolution mapping and characterization of open chromatin across the genome. Cell. 2008;132:311–322. doi: 10.1016/j.cell.2007.12.014. [DOI] [PMC free article] [PubMed] [Google Scholar]
- Buecker C, Srinivasan R, Wu Z, Calo E, Acampora D, Faial T, Simeone A, Tan M, Swigut T, Wysocka J. Reorganization of enhancer patterns in transition from naive to primed pluripotency. Cell Stem Cell. 2014;14:838–853. doi: 10.1016/j.stem.2014.04.003. [DOI] [PMC free article] [PubMed] [Google Scholar]
- Buenrostro JD, Giresi PG, Zaba LC, Chang HY, Greenleaf WJ. Transposition of native chromatin for fast and sensitive epigenomic profiling of open chromatin, DNA-binding proteins and nucleosome position. Nature Methods. 2013;10:1213–1218. doi: 10.1038/nmeth.2688. [DOI] [PMC free article] [PubMed] [Google Scholar]
- Bulger M, Groudine M. Enhancers: the abundance and function of regulatory sequences beyond promoters. Developmental Biology. 2010;339:250–257. doi: 10.1016/j.ydbio.2009.11.035. [DOI] [PMC free article] [PubMed] [Google Scholar]
- Carlton PM, Boulanger J, Kervrann C, Sibarita JB, Salamero J, Gordon-Messer S, Bressan D, Haber JE, Haase S, Shao L, Winoto L, Matsuda A, Kner P, Uzawa S, Gustafsson M, Kam Z, Agard DA, Sedat JW. Fast live simultaneous multiwavelength four-dimensional optical microscopy. PNAS. 2010;107:16016–16022. doi: 10.1073/pnas.1004037107. [DOI] [PMC free article] [PubMed] [Google Scholar]
- Chen X, Vega VB, Ng HH. Transcriptional regulatory networks in embryonic stem cells. Cold Spring Harbor Symposia on Quantitative Biology. 2008a;73:203–209. doi: 10.1101/sqb.2008.73.026. [DOI] [PubMed] [Google Scholar]
- Chen X, Xu H, Yuan P, Fang F, Huss M, Vega VB, Wong E, Orlov YL, Zhang W, Jiang J, Loh YH, Yeo HC, Yeo ZX, Narang V, Govindarajan KR, Leong B, Shahab A, Ruan Y, Bourque G, Sung WK, Clarke ND, Wei CL, Ng HH. Integration of external signaling pathways with the core transcriptional network in embryonic stem cells. Cell. 2008b;133:1106–1117. doi: 10.1016/j.cell.2008.04.043. [DOI] [PubMed] [Google Scholar]
- Chen B, Gilbert LA, Cimini BA, Schnitzbauer J, Zhang W, Li GW, Park J, Blackburn EH, Weissman JS, Qi LS, Huang B. Dynamic imaging of genomic loci in living human cells by an optimized CRISPR/Cas system. Cell. 2013;155:1479–1491. doi: 10.1016/j.cell.2013.12.001. [DOI] [PMC free article] [PubMed] [Google Scholar]
- Chen H, Levo M, Barinov L, Fujioka M, Jaynes JB, Gregor T. Dynamic interplay between enhancer–promoter topology and gene activity. Nature Genetics. 2018;290:1–13. doi: 10.1038/s41588-018-0175-z. [DOI] [PMC free article] [PubMed] [Google Scholar]
- Cho WK, Spille JH, Hecht M, Lee C, Li C, Grube V, Cisse II. Mediator and RNA polymerase II clusters associate in transcription-dependent condensates. Science. 2018;361:412–415. doi: 10.1126/science.aar4199. [DOI] [PMC free article] [PubMed] [Google Scholar]
- Chubb JR, Trcek T, Shenoy SM, Singer RH. Transcriptional pulsing of a developmental gene. Current Biology. 2006;16:1018–1025. doi: 10.1016/j.cub.2006.03.092. [DOI] [PMC free article] [PubMed] [Google Scholar]
- Cremer T, Cremer M, Dietzel S, Müller S, Solovei I, Fakan S. Chromosome territories--a functional nuclear landscape. Current Opinion in Cell Biology. 2006;18:307–316. doi: 10.1016/j.ceb.2006.04.007. [DOI] [PubMed] [Google Scholar]
- Creyghton MP, Cheng AW, Welstead GG, Kooistra T, Carey BW, Steine EJ, Hanna J, Lodato MA, Frampton GM, Sharp PA, Boyer LA, Young RA, Jaenisch R. Histone H3K27ac separates active from poised enhancers and predicts developmental state. PNAS. 2010;107:21931–21936. doi: 10.1073/pnas.1016071107. [DOI] [PMC free article] [PubMed] [Google Scholar]
- de Wit E, Vos ES, Holwerda SJ, Valdes-Quezada C, Verstegen MJ, Teunissen H, Splinter E, Wijchers PJ, Krijger PH, de Laat W. CTCF Binding Polarity Determines Chromatin Looping. Molecular Cell. 2015;60:676–684. doi: 10.1016/j.molcel.2015.09.023. [DOI] [PubMed] [Google Scholar]
- Dekker J. Mapping the 3D genome: Aiming for consilience. Nature Reviews Molecular Cell Biology. 2016;17:741–742. doi: 10.1038/nrm.2016.151. [DOI] [PubMed] [Google Scholar]
- Dekker J, Mirny L. The 3D Genome as Moderator of Chromosomal Communication. Cell. 2016;164:1110–1121. doi: 10.1016/j.cell.2016.02.007. [DOI] [PMC free article] [PubMed] [Google Scholar]
- Deng W, Lee J, Wang H, Miller J, Reik A, Gregory PD, Dean A, Blobel GA. Controlling long-range genomic interactions at a native locus by targeted tethering of a looping factor. Cell. 2012;149:1233–1244. doi: 10.1016/j.cell.2012.03.051. [DOI] [PMC free article] [PubMed] [Google Scholar]
- Deng W, Rupon JW, Krivega I, Breda L, Motta I, Jahn KS, Reik A, Gregory PD, Rivella S, Dean A, Blobel GA. Reactivation of developmentally silenced globin genes by forced chromatin looping. Cell. 2014;158:849–860. doi: 10.1016/j.cell.2014.05.050. [DOI] [PMC free article] [PubMed] [Google Scholar]
- Dixon JR, Selvaraj S, Yue F, Kim A, Li Y, Shen Y, Hu M, Liu JS, Ren B. Topological domains in mammalian genomes identified by analysis of chromatin interactions. Nature. 2012;485:376–380. doi: 10.1038/nature11082. [DOI] [PMC free article] [PubMed] [Google Scholar]
- Dowen JM, Fan ZP, Hnisz D, Ren G, Abraham BJ, Zhang LN, Weintraub AS, Schujiers J, Lee TI, Zhao K, Young RA. Control of cell identity genes occurs in insulated neighborhoods in mammalian chromosomes. Cell. 2014;159:374–387. doi: 10.1016/j.cell.2014.09.030. [DOI] [PMC free article] [PubMed] [Google Scholar]
- Durand NC, Robinson JT, Shamim MS, Machol I, Mesirov JP, Lander ES, Aiden EL. Juicebox Provides a Visualization System for Hi-C Contact Maps with Unlimited Zoom. Cell Systems. 2016;3:99–101. doi: 10.1016/j.cels.2015.07.012. [DOI] [PMC free article] [PubMed] [Google Scholar]
- Edelstein A, Amodaj N, Hoover K, Vale R, Stuurman N. Computer control of microscopes using µmanager. Current Protocols in Molecular Biology. 2010;Chapter 14 doi: 10.1002/0471142727.mb1420s92. [DOI] [PMC free article] [PubMed] [Google Scholar]
- ENCODE Project Consortium An integrated encyclopedia of DNA elements in the human genome. Nature. 2012;489:57–74. doi: 10.1038/nature11247. [DOI] [PMC free article] [PubMed] [Google Scholar]
- Fuchs G, Voichek Y, Benjamin S, Gilad S, Amit I, Oren M. 4sUDRB-seq: measuring genomewide transcriptional elongation rates and initiation frequencies within cells. Genome Biology. 2014;15:R69. doi: 10.1186/gb-2014-15-5-r69. [DOI] [PMC free article] [PubMed] [Google Scholar]
- Fudenberg G, Imakaev M. FISH-ing for captured contacts: towards reconciling FISH and 3C. Nature Methods. 2017;14:673–678. doi: 10.1038/nmeth.4329. [DOI] [PMC free article] [PubMed] [Google Scholar]
- Fukaya T, Lim B, Levine M. Enhancer Control of Transcriptional Bursting. Cell. 2016;166:358–368. doi: 10.1016/j.cell.2016.05.025. [DOI] [PMC free article] [PubMed] [Google Scholar]
- Germier T, Kocanova S, Walther N, Bancaud A, Shaban HA, Sellou H, Politi AZ, Ellenberg J, Gallardo F, Bystricky K. Real-Time Imaging of a Single Gene Reveals Transcription-Initiated Local Confinement. Biophysical Journal. 2017;113:1383–1394. doi: 10.1016/j.bpj.2017.08.014. [DOI] [PMC free article] [PubMed] [Google Scholar]
- Giorgetti L, Heard E. Closing the loop: 3C versus DNA FISH. Genome Biology. 2016;17:1–9. doi: 10.1186/s13059-016-1081-2. [DOI] [PMC free article] [PubMed] [Google Scholar]
- Grimm JB, English BP, Chen J, Slaughter JP, Zhang Z, Revyakin A, Patel R, Macklin JJ, Normanno D, Singer RH, Lionnet T, Lavis LD. A general method to improve fluorophores for live-cell and single-molecule microscopy. Nature Methods. 2015;12:244–250. doi: 10.1038/nmeth.3256. [DOI] [PMC free article] [PubMed] [Google Scholar]
- Gröschel S, Sanders MA, Hoogenboezem R, de Wit E, Bouwman BAM, Erpelinck C, van der Velden VHJ, Havermans M, Avellino R, van Lom K, Rombouts EJ, van Duin M, Döhner K, Beverloo HB, Bradner JE, Döhner H, Löwenberg B, Valk PJM, Bindels EMJ, de Laat W, Delwel R. A single oncogenic enhancer rearrangement causes concomitant EVI1 and GATA2 deregulation in leukemia. Cell. 2014;157:369–381. doi: 10.1016/j.cell.2014.02.019. [DOI] [PubMed] [Google Scholar]
- Gu B, Swigut T, Spencley A, Bauer MR, Chung M, Meyer T, Wysocka J. Transcription-coupled changes in nuclear mobility of mammalian cis-regulatory elements. Science. 2018;359:1050–1055. doi: 10.1126/science.aao3136. [DOI] [PMC free article] [PubMed] [Google Scholar]
- Guo Y, Xu Q, Canzio D, Shou J, Li J, Gorkin DU, Jung I, Wu H, Zhai Y, Tang Y, Lu Y, Wu Y, Jia Z, Li W, Zhang MQ, Ren B, Krainer AR, Maniatis T, Wu Q. CRISPR Inversion of CTCF Sites Alters Genome Topology and Enhancer/Promoter Function. Cell. 2015;162:900–910. doi: 10.1016/j.cell.2015.07.038. [DOI] [PMC free article] [PubMed] [Google Scholar]
- Hansen AS, Pustova I, Cattoglio C, Tjian R, Darzacq X. CTCF and cohesin regulate chromatin loop stability with distinct dynamics. eLife. 2017;6:e25776. doi: 10.7554/eLife.25776. [DOI] [PMC free article] [PubMed] [Google Scholar]
- Heintzman ND, Stuart RK, Hon G, Fu Y, Ching CW, Hawkins RD, Barrera LO, Van Calcar S, Qu C, Ching KA, Wang W, Weng Z, Green RD, Crawford GE, Ren B. Distinct and predictive chromatin signatures of transcriptional promoters and enhancers in the human genome. Nature Genetics. 2007;39:311–318. doi: 10.1038/ng1966. [DOI] [PubMed] [Google Scholar]
- Heintzman ND, Hon GC, Hawkins RD, Kheradpour P, Stark A, Harp LF, Ye Z, Lee LK, Stuart RK, Ching CW, Ching KA, Antosiewicz-Bourget JE, Liu H, Zhang X, Green RD, Lobanenkov VV, Stewart R, Thomson JA, Crawford GE, Kellis M, Ren B. Histone modifications at human enhancers reflect global cell-type-specific gene expression. Nature. 2009;459:108–112. doi: 10.1038/nature07829. [DOI] [PMC free article] [PubMed] [Google Scholar]
- Hnisz D, Shrinivas K, Young RA, Chakraborty AK, Sharp PA. A Phase Separation Model for Transcriptional Control. Cell. 2017;169:13–23. doi: 10.1016/j.cell.2017.02.007. [DOI] [PMC free article] [PubMed] [Google Scholar]
- Horta A, Monahan K, Bashkirova L, Lomvardas S. Cell type-specific interchromosomal interactions as a mechanism for transcriptional diversity. bioRxiv. 2018 doi: 10.1101/287532. [DOI]
- Huang J, Liu X, Li D, Shao Z, Cao H, Zhang Y, Trompouki E, Bowman TV, Zon LI, Yuan GC, Orkin SH, Xu J. Dynamic Control of Enhancer Repertoires Drives Lineage and Stage-Specific Transcription during Hematopoiesis. Developmental Cell. 2016;36:9–23. doi: 10.1016/j.devcel.2015.12.014. [DOI] [PMC free article] [PubMed] [Google Scholar]
- Jin F, Li Y, Dixon JR, Selvaraj S, Ye Z, Lee AY, Yen CA, Schmitt AD, Espinoza CA, Ren B. A high-resolution map of the three-dimensional chromatin interactome in human cells. Nature. 2013;503:290–294. doi: 10.1038/nature12644. [DOI] [PMC free article] [PubMed] [Google Scholar]
- Kamachi Y, Kondoh H. Sox proteins: regulators of cell fate specification and differentiation. Development. 2013;140:4129–4144. doi: 10.1242/dev.091793. [DOI] [PubMed] [Google Scholar]
- Kent WJ, Sugnet CW, Furey TS, Roskin KM, Pringle TH, Zahler AM, Haussler D. The human genome browser at UCSC. Genome Research. 2002;12:996–1006. doi: 10.1101/gr.229102. [DOI] [PMC free article] [PubMed] [Google Scholar]
- Kervrann C, Boulanger J. Optimal spatial adaptation for patch-based image denoising. IEEE Transactions on Image Processing. 2006;15:2866–2878. doi: 10.1109/TIP.2006.877529. [DOI] [PubMed] [Google Scholar]
- Kieffer-Kwon KR, Tang Z, Mathe E, Qian J, Sung MH, Li G, Resch W, Baek S, Pruett N, Grøntved L, Vian L, Nelson S, Zare H, Hakim O, Reyon D, Yamane A, Nakahashi H, Kovalchuk AL, Zou J, Joung JK, Sartorelli V, Wei CL, Ruan X, Hager GL, Ruan Y, Casellas R. Interactome maps of mouse gene regulatory domains reveal basic principles of transcriptional regulation. Cell. 2013;155:1507–1520. doi: 10.1016/j.cell.2013.11.039. [DOI] [PMC free article] [PubMed] [Google Scholar]
- Kim TK, Hemberg M, Gray JM. Enhancer RNAs: a class of long noncoding RNAs synthesized at enhancers. Cold Spring Harbor Perspectives in Biology. 2015;7:a018622. doi: 10.1101/cshperspect.a018622. [DOI] [PMC free article] [PubMed] [Google Scholar]
- Krijger PH, de Laat W. Regulation of disease-associated gene expression in the 3D genome. Nature Reviews Molecular Cell Biology. 2016;17:771–782. doi: 10.1038/nrm.2016.138. [DOI] [PubMed] [Google Scholar]
- Lacoste A, Berenshteyn F, Brivanlou AH. An efficient and reversible transposable system for gene delivery and lineage-specific differentiation in human embryonic stem cells. Cell Stem Cell. 2009;5:332–342. doi: 10.1016/j.stem.2009.07.011. [DOI] [PubMed] [Google Scholar]
- Langmead B, Trapnell C, Pop M, Salzberg SL. Ultrafast and memory-efficient alignment of short DNA sequences to the human genome. Genome Biology. 2009;10:R25. doi: 10.1186/gb-2009-10-3-r25. [DOI] [PMC free article] [PubMed] [Google Scholar]
- Langmead B, Salzberg SL. Fast gapped-read alignment with Bowtie 2. Nature Methods. 2012;9:357–359. doi: 10.1038/nmeth.1923. [DOI] [PMC free article] [PubMed] [Google Scholar]
- Lefebvre V, Dumitriu B, Penzo-Méndez A, Han Y, Pallavi B. Control of cell fate and differentiation by Sry-related high-mobility-group box (Sox) transcription factors. The International Journal of Biochemistry & Cell Biology. 2007;39:2195–2214. doi: 10.1016/j.biocel.2007.05.019. [DOI] [PMC free article] [PubMed] [Google Scholar]
- Li G, Ruan X, Auerbach RK, Sandhu KS, Zheng M, Wang P, Poh HM, Goh Y, Lim J, Zhang J, Sim HS, Peh SQ, Mulawadi FH, Ong CT, Orlov YL, Hong S, Zhang Z, Landt S, Raha D, Euskirchen G, Wei CL, Ge W, Wang H, Davis C, Fisher-Aylor KI, Mortazavi A, Gerstein M, Gingeras T, Wold B, Sun Y, Fullwood MJ, Cheung E, Liu E, Sung WK, Snyder M, Ruan Y. Extensive promoter-centered chromatin interactions provide a topological basis for transcription regulation. Cell. 2012;148:84–98. doi: 10.1016/j.cell.2011.12.014. [DOI] [PMC free article] [PubMed] [Google Scholar]
- Li Y, Rivera CM, Ishii H, Jin F, Selvaraj S, Lee AY, Dixon JR, Ren B. CRISPR reveals a distal super-enhancer required for Sox2 expression in mouse embryonic stem cells. PLOS ONE. 2014;9:e114485. doi: 10.1371/journal.pone.0114485. [DOI] [PMC free article] [PubMed] [Google Scholar]
- Li H, Durbin R. Fast and accurate short read alignment with Burrows-Wheeler transform. Bioinformatics. 2009;25:1754–1760. doi: 10.1093/bioinformatics/btp324. [DOI] [PMC free article] [PubMed] [Google Scholar]
- Lieberman-Aiden E, van Berkum NL, Williams L, Imakaev M, Ragoczy T, Telling A, Amit I, Lajoie BR, Sabo PJ, Dorschner MO, Sandstrom R, Bernstein B, Bender MA, Groudine M, Gnirke A, Stamatoyannopoulos J, Mirny LA, Lander ES, Dekker J. Comprehensive mapping of long-range interactions reveals folding principles of the human genome. Science. 2009;326:289–293. doi: 10.1126/science.1181369. [DOI] [PMC free article] [PubMed] [Google Scholar]
- Lim B, Heist T, Levine M, Fukaya T. Visualization of Transvection in Living Drosophila Embryos. Molecular Cell. 2018;70:287–296. doi: 10.1016/j.molcel.2018.02.029. [DOI] [PMC free article] [PubMed] [Google Scholar]
- Lionnet T, Czaplinski K, Darzacq X, Shav-Tal Y, Wells AL, Chao JA, Park HY, de Turris V, Lopez-Jones M, Singer RH. A transgenic mouse for in vivo detection of endogenous labeled mRNA. Nature Methods. 2011;8:165–170. doi: 10.1038/nmeth.1551. [DOI] [PMC free article] [PubMed] [Google Scholar]
- Long HK, Prescott SL, Wysocka J. Ever-Changing Landscapes: Transcriptional Enhancers in Development and Evolution. Cell. 2016;167:1170–1187. doi: 10.1016/j.cell.2016.09.018. [DOI] [PMC free article] [PubMed] [Google Scholar]
- Lovén J, Hoke HA, Lin CY, Lau A, Orlando DA, Vakoc CR, Bradner JE, Lee TI, Young RA. Selective inhibition of tumor oncogenes by disruption of super-enhancers. Cell. 2013;153:320–334. doi: 10.1016/j.cell.2013.03.036. [DOI] [PMC free article] [PubMed] [Google Scholar]
- Lucas JS, Zhang Y, Dudko OK, Murre C. 3D trajectories adopted by coding and regulatory DNA elements: first-passage times for genomic interactions. Cell. 2014;158:339–352. doi: 10.1016/j.cell.2014.05.036. [DOI] [PMC free article] [PubMed] [Google Scholar]
- Lupiáñez DG, Kraft K, Heinrich V, Krawitz P, Brancati F, Klopocki E, Horn D, Kayserili H, Opitz JM, Laxova R, Santos-Simarro F, Gilbert-Dussardier B, Wittler L, Borschiwer M, Haas SA, Osterwalder M, Franke M, Timmermann B, Hecht J, Spielmann M, Visel A, Mundlos S. Disruptions of topological chromatin domains cause pathogenic rewiring of gene-enhancer interactions. Cell. 2015;161:1012–1025. doi: 10.1016/j.cell.2015.04.004. [DOI] [PMC free article] [PubMed] [Google Scholar]
- Markenscoff-Papadimitriou E, Allen WE, Colquitt BM, Goh T, Murphy KK, Monahan K, Mosley CP, Ahituv N, Lomvardas S. Enhancer interaction networks as a means for singular olfactory receptor expression. Cell. 2014;159:543–557. doi: 10.1016/j.cell.2014.09.033. [DOI] [PMC free article] [PubMed] [Google Scholar]
- Marshall WF, Straight A, Marko JF, Swedlow J, Dernburg A, Belmont A, Murray AW, Agard DA, Sedat JW. Interphase chromosomes undergo constrained diffusional motion in living cells. Current Biology. 1997;7:930–939. doi: 10.1016/S0960-9822(06)00412-X. [DOI] [PubMed] [Google Scholar]
- Martin M. Cutadapt removes adapter sequences from high-throughput sequencing reads. EMBnet.journal. 2011;17:10–12. doi: 10.14806/ej.17.1.200. [DOI] [Google Scholar]
- Martin RM, Rino J, Carvalho C, Kirchhausen T, Carmo-Fonseca M. Live-cell visualization of pre-mRNA splicing with single-molecule sensitivity. Cell Reports. 2013;4:1144–1155. doi: 10.1016/j.celrep.2013.08.013. [DOI] [PMC free article] [PubMed] [Google Scholar]
- Masui O, Bonnet I, Le Baccon P, Brito I, Pollex T, Murphy N, Hupé P, Barillot E, Belmont AS, Heard E. Live-cell chromosome dynamics and outcome of X chromosome pairing events during ES cell differentiation. Cell. 2011;145:447–458. doi: 10.1016/j.cell.2011.03.032. [DOI] [PMC free article] [PubMed] [Google Scholar]
- Michaelis C, Ciosk R, Nasmyth K. Cohesins: chromosomal proteins that prevent premature separation of sister chromatids. Cell. 1997;91:35–45. doi: 10.1016/S0092-8674(01)80007-6. [DOI] [PubMed] [Google Scholar]
- Morgan SL, Mariano NC, Bermudez A, Arruda NL, Wu F, Luo Y, Shankar G, Jia L, Chen H, Hu JF, Hoffman AR, Huang CC, Pitteri SJ, Wang KC. Manipulation of nuclear architecture through CRISPR-mediated chromosomal looping. Nature Communications. 2017;8:15993–15999. doi: 10.1038/ncomms15993. [DOI] [PMC free article] [PubMed] [Google Scholar]
- Mullick A, Xu Y, Warren R, Koutroumanis M, Guilbault C, Broussau S, Malenfant F, Bourget L, Lamoureux L, Lo R, Caron AW, Pilotte A, Massie B. The cumate gene-switch: a system for regulated expression in mammalian cells. BMC Biotechnology. 2006;6:43. doi: 10.1186/1472-6750-6-43. [DOI] [PMC free article] [PubMed] [Google Scholar]
- Mumbach MR, Rubin AJ, Flynn RA, Dai C, Khavari PA, Greenleaf WJ, Chang HY. HiChIP: efficient and sensitive analysis of protein-directed genome architecture. Nature Methods. 2016;13:919–922. doi: 10.1038/nmeth.3999. [DOI] [PMC free article] [PubMed] [Google Scholar]
- Narendra V, Rocha PP, An D, Raviram R, Skok JA, Mazzoni EO, Reinberg D. CTCF establishes discrete functional chromatin domains at the Hox clusters during differentiation. Science. 2015;347:1017–1021. doi: 10.1126/science.1262088. [DOI] [PMC free article] [PubMed] [Google Scholar]
- Nora EP, Lajoie BR, Schulz EG, Giorgetti L, Okamoto I, Servant N, Piolot T, van Berkum NL, Meisig J, Sedat J, Gribnau J, Barillot E, Blüthgen N, Dekker J, Heard E. Spatial partitioning of the regulatory landscape of the X-inactivation centre. Nature. 2012;485:381–385. doi: 10.1038/nature11049. [DOI] [PMC free article] [PubMed] [Google Scholar]
- Nora EP, Goloborodko A, Valton AL, Gibcus JH, Uebersohn A, Abdennur N, Dekker J, Mirny LA, Bruneau BG. Targeted Degradation of CTCF Decouples Local Insulation of Chromosome Domains from Genomic Compartmentalization. Cell. 2017;169:930–944. doi: 10.1016/j.cell.2017.05.004. [DOI] [PMC free article] [PubMed] [Google Scholar]
- Ochiai H, Sugawara T, Sakuma T, Yamamoto T. Stochastic promoter activation affects Nanog expression variability in mouse embryonic stem cells. Scientific Reports. 2014;4:7125. doi: 10.1038/srep07125. [DOI] [PMC free article] [PubMed] [Google Scholar]
- Okamoto R, Uchikawa M, Kondoh H. Sixteen additional enhancers associated with the chicken Sox2 locus outside the central 50-kb region. Development, Growth & Differentiation. 2015;57:24–39. doi: 10.1111/dgd.12185. [DOI] [PubMed] [Google Scholar]
- Pevny LH, Nicolis SK. Sox2 roles in neural stem cells. The International Journal of Biochemistry & Cell Biology. 2010;42:421–424. doi: 10.1016/j.biocel.2009.08.018. [DOI] [PubMed] [Google Scholar]
- Phillips-Cremins JE, Sauria ME, Sanyal A, Gerasimova TI, Lajoie BR, Bell JS, Ong CT, Hookway TA, Guo C, Sun Y, Bland MJ, Wagstaff W, Dalton S, McDevitt TC, Sen R, Dekker J, Taylor J, Corces VG. Architectural protein subclasses shape 3D organization of genomes during lineage commitment. Cell. 2013;153:1281–1295. doi: 10.1016/j.cell.2013.04.053. [DOI] [PMC free article] [PubMed] [Google Scholar]
- Quinodoz SA, Ollikainen N, Tabak B, Palla A, Schmidt JM, Detmar E, Lai MM, Shishkin AA, Bhat P, Takei Y, Trinh V, Aznauryan E, Russell P, Cheng C, Jovanovic M, Chow A, Cai L, McDonel P, Garber M, Guttman M. Higher-Order Inter-chromosomal Hubs Shape 3D Genome Organization in the Nucleus. Cell. 2018;174:744–757. doi: 10.1016/j.cell.2018.05.024. [DOI] [PMC free article] [PubMed] [Google Scholar]
- Rada-Iglesias A, Bajpai R, Swigut T, Brugmann SA, Flynn RA, Wysocka J. A unique chromatin signature uncovers early developmental enhancers in humans. Nature. 2011;470 doi: 10.1038/nature09692. [DOI] [PMC free article] [PubMed] [Google Scholar]
- Rao SS, Huntley MH, Durand NC, Stamenova EK, Bochkov ID, Robinson JT, Sanborn AL, Machol I, Omer AD, Lander ES, Aiden EL. A 3D map of the human genome at kilobase resolution reveals principles of chromatin looping. Cell. 2014;159:1665–1680. doi: 10.1016/j.cell.2014.11.021. [DOI] [PMC free article] [PubMed] [Google Scholar]
- Rao SSP, Huang SC, Glenn St Hilaire B, Engreitz JM, Perez EM, Kieffer-Kwon KR, Sanborn AL, Johnstone SE, Bascom GD, Bochkov ID, Huang X, Shamim MS, Shin J, Turner D, Ye Z, Omer AD, Robinson JT, Schlick T, Bernstein BE, Casellas R, Lander ES, Aiden EL. Cohesin Loss Eliminates All Loop Domains. Cell. 2017;171:305–320. doi: 10.1016/j.cell.2017.09.026. [DOI] [PMC free article] [PubMed] [Google Scholar]
- Raymond CS, Soriano P. High-efficiency FLP and PhiC31 site-specific recombination in mammalian cells. PLOS ONE. 2007;2:e162. doi: 10.1371/journal.pone.0000162. [DOI] [PMC free article] [PubMed] [Google Scholar]
- Robinett CC, Straight A, Li G, Willhelm C, Sudlow G, Murray A, Belmont AS. In vivo localization of DNA sequences and visualization of large-scale chromatin organization using lac operator/repressor recognition. The Journal of Cell Biology. 1996;135:1685–1700. doi: 10.1083/jcb.135.6.1685. [DOI] [PMC free article] [PubMed] [Google Scholar]
- Roukos V, Voss TC, Schmidt CK, Lee S, Wangsa D, Misteli T. Spatial dynamics of chromosome translocations in living cells. Science. 2013;341:660–664. doi: 10.1126/science.1237150. [DOI] [PMC free article] [PubMed] [Google Scholar]
- Sabari BR, Dall'Agnese A, Boija A, Klein IA, Coffey EL, Shrinivas K, Abraham BJ, Hannett NM, Zamudio AV, Manteiga JC, Li CH, Guo YE, Day DS, Schuijers J, Vasile E, Malik S, Hnisz D, Lee TI, Cisse II, Roeder RG, Sharp PA, Chakraborty AK, Young RA. Coactivator condensation at super-enhancers links phase separation and gene control. Science. 2018;361:eaar3958. doi: 10.1126/science.aar3958. [DOI] [PMC free article] [PubMed] [Google Scholar]
- Sanyal A, Lajoie BR, Jain G, Dekker J. The long-range interaction landscape of gene promoters. Nature. 2012;489:109–113. doi: 10.1038/nature11279. [DOI] [PMC free article] [PubMed] [Google Scholar]
- Sarkar A, Hochedlinger K. The sox family of transcription factors: versatile regulators of stem and progenitor cell fate. Cell Stem Cell. 2013;12:15–30. doi: 10.1016/j.stem.2012.12.007. [DOI] [PMC free article] [PubMed] [Google Scholar]
- Schindelin J, Arganda-Carreras I, Frise E, Kaynig V, Longair M, Pietzsch T, Preibisch S, Rueden C, Saalfeld S, Schmid B, Tinevez JY, White DJ, Hartenstein V, Eliceiri K, Tomancak P, Cardona A. Fiji: an open-source platform for biological-image analysis. Nature Methods. 2012;9:676–682. doi: 10.1038/nmeth.2019. [DOI] [PMC free article] [PubMed] [Google Scholar]
- Schneider CA, Rasband WS, Eliceiri KW. NIH Image to ImageJ: 25 years of image analysis. Nature Methods. 2012;9:671–675. doi: 10.1038/nmeth.2089. [DOI] [PMC free article] [PubMed] [Google Scholar]
- Schwarzer W, Spitz F. The architecture of gene expression: integrating dispersed cis-regulatory modules into coherent regulatory domains. Current Opinion in Genetics & Development. 2014;27:74–82. doi: 10.1016/j.gde.2014.03.014. [DOI] [PubMed] [Google Scholar]
- Sexton T, Yaffe E, Kenigsberg E, Bantignies F, Leblanc B, Hoichman M, Parrinello H, Tanay A, Cavalli G. Three-dimensional folding and functional organization principles of the Drosophila genome. Cell. 2012;148:458–472. doi: 10.1016/j.cell.2012.01.010. [DOI] [PubMed] [Google Scholar]
- Sigal A, Milo R, Cohen A, Geva-Zatorsky N, Klein Y, Liron Y, Rosenfeld N, Danon T, Perzov N, Alon U. Variability and memory of protein levels in human cells. Nature. 2006;444:643–646. doi: 10.1038/nature05316. [DOI] [PubMed] [Google Scholar]
- Thurman RE, Rynes E, Humbert R, Vierstra J, Maurano MT, Haugen E, Sheffield NC, Stergachis AB, Wang H, Vernot B, Garg K, John S, Sandstrom R, Bates D, Boatman L, Canfield TK, Diegel M, Dunn D, Ebersol AK, Frum T, Giste E, Johnson AK, Johnson EM, Kutyavin T, Lajoie B, Lee BK, Lee K, London D, Lotakis D, Neph S, Neri F, Nguyen ED, Qu H, Reynolds AP, Roach V, Safi A, Sanchez ME, Sanyal A, Shafer A, Simon JM, Song L, Vong S, Weaver M, Yan Y, Zhang Z, Zhang Z, Lenhard B, Tewari M, Dorschner MO, Hansen RS, Navas PA, Stamatoyannopoulos G, Iyer VR, Lieb JD, Sunyaev SR, Akey JM, Sabo PJ, Kaul R, Furey TS, Dekker J, Crawford GE, Stamatoyannopoulos JA. The accessible chromatin landscape of the human genome. Nature. 2012;489:75–82. doi: 10.1038/nature11232. [DOI] [PMC free article] [PubMed] [Google Scholar]
- Thyagarajan B, Olivares EC, Hollis RP, Ginsburg DS, Calos MP. Site-specific genomic integration in mammalian cells mediated by phage phiC31 integrase. Molecular and Cellular Biology. 2001;21:3926–3934. doi: 10.1128/MCB.21.12.3926-3934.2001. [DOI] [PMC free article] [PubMed] [Google Scholar]
- Tinevez JY, Perry N, Schindelin J, Hoopes GM, Reynolds GD, Laplantine E, Bednarek SY, Shorte SL, Eliceiri KW. TrackMate: An open and extensible platform for single-particle tracking. Methods. 2017;115:80–90. doi: 10.1016/j.ymeth.2016.09.016. [DOI] [PubMed] [Google Scholar]
- Tomioka M, Nishimoto M, Miyagi S, Katayanagi T, Fukui N, Niwa H, Muramatsu M, Okuda A. Identification of Sox-2 regulatory region which is under the control of Oct-3/4-Sox-2 complex. Nucleic Acids Research. 2002;30:3202–3213. doi: 10.1093/nar/gkf435. [DOI] [PMC free article] [PubMed] [Google Scholar]
- Uchikawa M, Ishida Y, Takemoto T, Kamachi Y, Kondoh H. Functional analysis of chicken Sox2 enhancers highlights an array of diverse regulatory elements that are conserved in mammals. Developmental Cell. 2003;4:509–519. doi: 10.1016/S1534-5807(03)00088-1. [DOI] [PubMed] [Google Scholar]
- van de Werken HJ, Landan G, Holwerda SJ, Hoichman M, Klous P, Chachik R, Splinter E, Valdes-Quezada C, Oz Y, Bouwman BA, Verstegen MJ, de Wit E, Tanay A, de Laat W. Robust 4C-seq data analysis to screen for regulatory DNA interactions. Nature Methods. 2012;9:969–972. doi: 10.1038/nmeth.2173. [DOI] [PubMed] [Google Scholar]
- Vierstra J, Rynes E, Sandstrom R, Zhang M, Canfield T, Hansen RS, Stehling-Sun S, Sabo PJ, Byron R, Humbert R, Thurman RE, Johnson AK, Vong S, Lee K, Bates D, Neri F, Diegel M, Giste E, Haugen E, Dunn D, Wilken MS, Josefowicz S, Samstein R, Chang KH, Eichler EE, De Bruijn M, Reh TA, Skoultchi A, Rudensky A, Orkin SH, Papayannopoulou T, Treuting PM, Selleri L, Kaul R, Groudine M, Bender MA, Stamatoyannopoulos JA. Mouse regulatory DNA landscapes reveal global principles of cis-regulatory evolution. Science. 2014;346:1007–1012. doi: 10.1126/science.1246426. [DOI] [PMC free article] [PubMed] [Google Scholar]
- Walter C, Schuetzmann D, Rosenbauer F, Dugas M. Basic4Cseq: an R/Bioconductor package for analyzing 4C-seq data. Bioinformatics. 2014;30:3268–3269. doi: 10.1093/bioinformatics/btu497. [DOI] [PubMed] [Google Scholar]
- Wamstad JA, Alexander JM, Truty RM, Shrikumar A, Li F, Eilertson KE, Ding H, Wylie JN, Pico AR, Capra JA, Erwin G, Kattman SJ, Keller GM, Srivastava D, Levine SS, Pollard KS, Holloway AK, Boyer LA, Bruneau BG. Dynamic and coordinated epigenetic regulation of developmental transitions in the cardiac lineage. Cell. 2012;151:206–220. doi: 10.1016/j.cell.2012.07.035. [DOI] [PMC free article] [PubMed] [Google Scholar]
- Weina K, Utikal J. SOX2 and cancer: current research and its implications in the clinic. Clinical and Translational Medicine. 2014;3:19. doi: 10.1186/2001-1326-3-19. [DOI] [PMC free article] [PubMed] [Google Scholar]
- Weintraub AS, Li CH, Zamudio AV, Sigova AA, Hannett NM, Day DS, Abraham BJ, Cohen MA, Nabet B, Buckley DL, Guo YE, Hnisz D, Jaenisch R, Bradner JE, Gray NS, Young RA. YY1 Is a Structural Regulator of Enhancer-Promoter Loops. Cell. 2017;171:1573–1588. doi: 10.1016/j.cell.2017.11.008. [DOI] [PMC free article] [PubMed] [Google Scholar]
- Whyte WA, Orlando DA, Hnisz D, Abraham BJ, Lin CY, Kagey MH, Rahl PB, Lee TI, Young RA. Master transcription factors and mediator establish super-enhancers at key cell identity genes. Cell. 2013;153:307–319. doi: 10.1016/j.cell.2013.03.035. [DOI] [PMC free article] [PubMed] [Google Scholar]
- Wuebben EL, Rizzino A. The dark side of SOX2: cancer - a comprehensive overview. Oncotarget. 2017;8:44917–44943. doi: 10.18632/oncotarget.16570. [DOI] [PMC free article] [PubMed] [Google Scholar]
- Xu Z, Thomas L, Davies B, Chalmers R, Smith M, Brown W. Accuracy and efficiency define Bxb1 integrase as the best of fifteen candidate serine recombinases for the integration of DNA into the human genome. BMC Biotechnology. 2013;13:87. doi: 10.1186/1472-6750-13-87. [DOI] [PMC free article] [PubMed] [Google Scholar]
- Young RA. Control of the embryonic stem cell state. Cell. 2011;144:940–954. doi: 10.1016/j.cell.2011.01.032. [DOI] [PMC free article] [PubMed] [Google Scholar]
- Zappone MV, Galli R, Catena R, Meani N, De Biasi S, Mattei E, Tiveron C, Vescovi AL, Lovell-Badge R, Ottolenghi S, Nicolis SK. Sox2 regulatory sequences direct expression of a (beta)-geo transgene to telencephalic neural stem cells and precursors of the mouse embryo, revealing regionalization of gene expression in CNS stem cells. Development. 2000;127:2367–2382. doi: 10.1242/dev.127.11.2367. [DOI] [PubMed] [Google Scholar]
- Zhang Y, Wong CH, Birnbaum RY, Li G, Favaro R, Ngan CY, Lim J, Tai E, Poh HM, Wong E, Mulawadi FH, Sung WK, Nicolis S, Ahituv N, Ruan Y, Wei CL. Chromatin connectivity maps reveal dynamic promoter-enhancer long-range associations. Nature. 2013;504:306–310. doi: 10.1038/nature12716. [DOI] [PMC free article] [PubMed] [Google Scholar]
- Zhou HY, Katsman Y, Dhaliwal NK, Davidson S, Macpherson NN, Sakthidevi M, Collura F, Mitchell JA. A Sox2 distal enhancer cluster regulates embryonic stem cell differentiation potential. Genes & Development. 2014;28:2699–2711. doi: 10.1101/gad.248526.114. [DOI] [PMC free article] [PubMed] [Google Scholar]
- Zhu J, Adli M, Zou JY, Verstappen G, Coyne M, Zhang X, Durham T, Miri M, Deshpande V, De Jager PL, Bennett DA, Houmard JA, Muoio DM, Onder TT, Camahort R, Cowan CA, Meissner A, Epstein CB, Shoresh N, Bernstein BE. Genome-wide chromatin state transitions associated with developmental and environmental cues. Cell. 2013;152:642–654. doi: 10.1016/j.cell.2012.12.033. [DOI] [PMC free article] [PubMed] [Google Scholar]