

Abstract
The modulation of ion channel proteins by cellular redox potential has emerged recently as a significant determinant of channel function. We have investigated the influence of sulfhydryl redox reagents on human brain Ca2+-activated K+channels (hslo) expressed in both human embryonic kidney 293 cells and Xenopus oocytes using macropatch and single-channel analysis. Intracellular application of the reducing agent dithiothreitol (DTT): (1) shifts the voltage of half-maximal channel activation (V0.5) ≈18 mV to more negative potentials without affecting the maximal conductance or the slope of the voltage dependence; (2) slows by ≈10-fold a time-dependent right-shift in V0.5 values (“run-down”); (3) speeds macroscopic current activation kinetics by ≈33%; and (4) increases the single-channel open probability without affecting the unitary conductance. In contrast to DTT treatment, oxidation with hydrogen peroxide shifts macropatchV0.5 values to more positive potentials, increases the rate of channel run-down, and decreases the single-channel open probability. KCa channels cloned fromDrosophila differ from hslo channels in that they show very little run-down and are not modulated by the addition of DTT. These data indicate that hsloCa2+-activated K+ channels may be modulated by changes in the cellular redox potential as well as by the transmembrane voltage and the cytoplasmic Ca2+concentration.
Keywords: calcium-activated potassium channel, hslo, dslo, HEK293 cells, redox, reduction, oxidation, dithiothreitol, hydrogen peroxide, cysteine, disulfide
Large conductance Ca2+-activated K+(KCa) channels are widely distributed in brain and are often concentrated in neuronal cell bodies and nerve terminals (Knaus et al., 1996). The activation of these channels has at least two functional consequences (for review, see Latorre et al., 1989; McManus, 1991; Sah, 1996). First, channel opening caused by either transient elevations in Ca2+ or membrane depolarization can change the shape and duration of action potentials as well as the amplitude and time course of afterhyperpolarizations. Such changes can result in novel neuronal firing patterns (Lancaster and Nicoll, 1987;Zhang and McBain, 1995). A second proposed role of KCachannels, particularly relevant at presynaptic nerve terminals, is to modulate presynaptic Ca2+ influx and hence neurotransmitter secretion. KCa channels are often associated with voltage-activated Ca2+ channels and can limit the amount of Ca2+ entering cells by acting as feedback inhibitors of these channels. Such inhibition can lead to a decrease in neurotransmitter release or neuropeptide secretion (Robitaille and Charlton, 1992; Bielefeldt and Jackson, 1993;Gola and Crest, 1993; Robitaille et al., 1993; Wisgirda and Dryer, 1994).
The function of many ion channels, including KCa channels, can be modulated by a wide variety of intracellular and extracellular factors that confers tremendous flexibility on neuronal excitability (Levitan, 1994). Although regulatory mechanisms such as protein phosphorylation have been studied in detail for many years, modulation of ion channels by the cellular redox potential has emerged only recently as a significant determinant of channel function (Ruppersberg et al., 1991; Chiamvimonvat et al., 1995; Stephens et al., 1996). Redox modulation of ion channels may be a mechanism by which retrograde messengers such as nitric oxide (NO) alter channel activity. More generally, it may also provide a link whereby changes in the metabolic properties of a neuron can lead to changes in its electrical properties. The most detailed characterization of this form of modulation has been performed using native (Aizenman et al., 1989;Lazarewicz et al., 1989; Tang and Aizenman, 1993) and cloned (Kohr et al., 1994) NMDA receptors. Sullivan et al. (1994) localized two extracellular cysteine residues in the NR1 subunit that were required for the dithiothreitol (DTT)-induced potentiation of currents through NMDA receptors.
Our investigation into the redox modulation of KCa channels was prompted by the large number of cysteine residues located within an extensive, presumably cytoplasmic, domain unique to these channels. Additional impetus was provided by the observation that several channel properties change when KCa channels are moved from the relatively reduced cellular environment to the more oxidized cell-free patch-clamp recording configuration. A description of the redox modulation of KCa channels can now be rigorously addressed because of the cloning of Ca2+-activated K+ channels from Drosophila(dslo) (Atkinson et al., 1991; Adelman et al., 1992), mouse (mslo) (Butler et al., 1993), and human (hslo) (Dworetzky et al., 1994; Pallanck and Ganetzky, 1994; Tseng-Crank et al., 1994). We have used cloned hslo and dslochannels expressed in a mammalian cell line and in Xenopus laevis oocytes to investigate the redox modulation of Ca2+-activated K+ channels.
MATERIALS AND METHODS
Stable transfection of human embryonic kidney (HEK293) cells. HEK293 cells were chosen as an expression system because they contain no appreciable endogenous KCa currents (see Fig. 4). They were obtained from ATCC (Rockville, MD) and maintained in modified Eagle’s medium (MEM, Life Technologies, Grand Island, NY) supplemented with 10% heat-inactivated horse serum (Life Technologies) in a humidified 5% CO2 incubator at 37°C. Cells were subcultured weekly by treatment with trypsin-EDTA (Life Technologies). The hslo (hbr5 splice variant) and dslo(A1/C2/E1/G3/I0 splice variant) α-subunit constructs were subcloned into the mammalian expression vector pcDNAIII (Invitrogen, San Diego, CA). These constructs have been shown previously to give rise to KCa channels, as demonstrated by their large single-channel conductance, Ca2+ dependence, ionic selectivity, and iberiotoxin sensitivity (Adelman et al., 1992; Tseng-Crank et al., 1994).
Fig. 4.

Comparison of hslo-hbr5 channel properties expressed in HEK293 cells and Xenopusoocytes. A, Representative current families from inside-out patches excised from either HEK293 cells (left) or oocytes (right) and evoked by voltage pulses from either −80 to +70 mV (100 μmCa2+ solutions) or −60 to +90 mV (1 μm Ca2+ solutions) in 10 mV increments. Control cells show no significant KCa currents in either expression system. Raw currents were low-pass filtered at 5 kHz, leak-subtracted, compensated for series resistance, and digitized at 10 kHz. B, The mean macroscopic conductance curves corresponding to hslo currents expressed in either HEK293 cells (open symbols) or oocytes (solid symbols) with an intracellular Ca2+ of 1 μm (squares) or 100 μm(circles). The voltages of half-maximal activation (V0.5) of currents expressed in oocytes or HEK293 cells were not significantly different.
To create stable cell lines, HEK293 cells were transfected using LipofectAmine (Life Technologies) lipofection as follows (Critz et al., 1993). HEK293 cells were grown to 70–80% confluency, washed, and incubated for 5 hr at 37°C in a 5% CO2 incubator with a solution containing 1 μg of the pcDNAIII-channel construct, 9 μl of the LipofectAmine reagent, and serum-free Opti-MEM medium (Life Technologies). DMEM containing 20% horse serum was then added to each culture dish, and incubation continued for another 18–24 hr. At this time, the medium was replaced with MEM containing 10% horse serum, and incubation continued for an additional 48 hr. Parallel transfections of a plasmid containing a lacZ reporter gene indicated that transfection efficiencies were 50–70%. To select transfectants, cells were passed (1:10) into 60 mm Corning dishes (Corning, NY) and allowed to attach firmly overnight. The medium was then exchanged with MEM containing 400 μg/ml G418 Geneticin (Life Technologies); only cells transfected with pcDNAIII, which contains theneor gene, were protected from the aminoglycoside. After 7–10 d, surviving cells were assayed for functional KCa channel expression by patch-clamp analysis. For subsequent recordings, cells were plated weekly on coverslips coated with 0.5 μg/ml poly-d-lysine (Boehringer Mannheim, Indianapolis, IN). Stock cultures were maintained in MEM containing 10% horse serum and 200 μg/ml G418.
Expression in Xenopus oocytes. Human hbr5-hslo α-subunits were expressed in defolliculatedXenopus laevis oocytes as detailed previously (DiChiara and Reinhart, 1995). In brief, linearized plasmid DNA was transcribed using the Ambion MEGAscript kit (Austin, TX) in the presence of the cap analog m7G(5′)ppp(5′)G. Frogs were anesthetized by submersion in 0.15% tricaine methanosulphonate for 20 min. Stage V–VI oocytes were removed surgically and incubated for 2–3 hr in Ca2+-free frog-86 medium (86 mm NaCl, 1.5 mm KCl, 2 mm MgCl2, 10 mm HEPES, 50 μg/ml gentamycin, pH 7.6) containing 1.5 mg/ml collagenase (170 U/mg; Life Technologies) to remove follicle cells. The oocytes were stored in frog-92 medium (92 mm NaCl, 1.5 mm KCl, 1.2 mm CaCl2, 2 mmMgCl2, 10 mm HEPES, 50 μg/ml gentamycin, pH 7.6) and kept at 17°C for 24 hr before RNA injection. Each oocyte was injected with 40 nl of cRNA diluted to 100 ng/μl for macroscopic current experiments and to 5–10 ng/μl for single-channel experiments. Immediately before experiments, the vitelline membrane was removed manually with fine forceps. Oocytes were maintained at 17°C in frog-92 medium that was changed daily.
Electrophysiology. The expression of KCacurrents in HEK293 cells was assayed using the standard gigaohm seal patch-clamp method in the cell-attached, excised inside-out, and outside-out configurations. Patch pipettes were fabricated from Corning 7052 borosilicate glass (Warner, Hamden, CT) and fire-polished to resistances of 1–3 MΩ for macropatch recordings and 5–10 MΩ for single-channel recordings. For single-channel recording, electrodes were coated with SYLGARD (Dow Corning, Midland, MI) to reduce capacitive currents. Single-channel and macropatch currents were amplified using an Axopatch 200 amplifier (Axon Instruments, Foster City, CA), low-pass filtered at 2–5 kHz, digitized by an Axon AD/DA (TL-1) converter, and digitized at 4–25 kHz. The higher sampling rates were used in the presence of high Ca2+concentrations (e.g., 10 kHz for 100 μmCa2+ solutions) because of the channel’s faster activation kinetics at these concentrations (DiChiara and Reinhart, 1995). For examination of tail currents (Figs.1E,F), we used minimal filtering (50 kHz) and the maximum sampling frequency (83.3 kHz or 12 μs/point) allowable by the amplifier and AD/DA converter circuitry. Capacitance and series resistance compensation was performed using the built-in amplifier circuitry. Seventy to 80% of series resistance (<2 MΩ) can be compensated in this manner, resulting in a maximal voltage error of <5 mV. Patches expressing macroscopic currents of >7 nA (at +70 mV) were discarded to minimize voltage errors attributable to series resistance. Series and seal resistances were examined after every 10 voltage families and did not change significantly during the duration of the experiments. Ohmic leak currents were subtracted from macropatch currents using amplifier circuitry; they were, however, of insignificant size compared with ionic currents. Pipette potentials were nulled immediately before seal formation and monitored during recording. Grounding was achieved via an agarose bridge to avoid junction potential shifts caused by solution changes.
Fig. 1.

Time-dependent changes in hsloKCa channel properties after patch excision. The hbr5 splice variant of the human brain hslo channel was stably expressed in HEK293 cells. I–V curves (−80 to +70 mV in 10 mV increments from a holding potential of −80 mV with 1 sec between pulses) were recorded from macropatches every 30 sec. Values for voltages of half-maximal activation (V0.5), the slope of the voltage dependence (mV/e-fold change in open probability), and maximal patch conductance (Gmax) were derived from Boltzmann fits to macroscopic conductance (G–V) curves calculated from these I–V data. Raw currents were low-pass filtered at 5 kHz, leak-subtracted, compensated for series resistance, and digitized at 10 kHz. Solutions contained symmetrical 150 mmK+-gluconate. A, Inside-out macropatch currents recorded 10 and 35 min after patch excision.B, Plot of macroscopic conductance versus membrane voltage for the currents depicted in A, at 10 min (solid circles) and 35 min (open circles). Lines are optimized fits to the Boltzmann equation. C, The time dependence of shifts inV0.5 values after patch excision into solutions containing either 1 μm Ca2+(open squares) or 100 μmCa2+ (open circles).D, The time dependence of shifts inGmax (solid circles) and the slope of the voltage dependence (open circles) after patch excision. E, V0.5values derived from cell-attached recordings. Steady-state outward currents (open circles) were evoked as described inA, whereas peak tail currents (solid circles) were evoked by a repolarization to −100 mV after voltage pulses from −10 mV to +190 mV from a holding potential of −10 mV. F, Gmax (solid circles) and slope values (open circles) from steady-state currents recorded in cell-attached mode.
The intracellular (bath) solution for both oocyte and HEK293 experiments consisted of 150 mmK+-gluconate, 2 mm KCl, and 5 mm MOPS, adjusted to pH 7.35 with KOH and sterile-filtered into acetic acid-rinsed bottles. The appropriate amount of CaCl2 was added (14.7 mg/l for the 100 μmCa2+ solution and 0.147 mg/l for the 1 μm Ca2+ solution). The extracellular (electrode) solution was 150 mmK+-gluconate, 2 mm KCl, 1 mmEGTA, and 5 mm MOPS, adjusted to pH 7.35 with KOH and sterile-filtered. Recording solutions were prepared with the purest salts available, containing <0.0005% Ba2+ (in the CaCl2) and <0.001% Ca2+ (in the K-gluconate) (Fluka, Ronkonkoma, NY) to minimize channel block by divalent cations (Diaz et al., 1996; Rothberg et al., 1996). Although the reported Kd of the channel for Ba2+ is 0.36 mm at 0 mV (Diaz et al., 1996), we believe that Ba2+ contamination does not significantly affect our results, because the addition of a Ba2+ chelator (20 μm of 18-crown-6 ether) does not lead to a significant increase in peak outward currents under our conditions (data not shown). Occasionally, a time-dependent blockage of current was seen at voltages >+50 mV, and these current values were not used for analysis. Solutions were both calibrated using a Ca2+-sensitive electrode (Orion, Boston, MA) and tested for reproducibility by verifying that the voltages of half-maximal activation (V0.5) did not differ by >5 mV between batches. Because the K-gluconate solution contains a maximal Ca2+ contamination of ∼1 μm, the appropriate amount of Ca2Cl2 was added to our solutions to bring them to a nominal 1 μm Ca2+ based on the Ca2+ electrode measurements. Seal-formation was performed in these solutions; during experiments, solutions containing the redox reagent were used. Solution osmolarity was set at 260–280 mOsm. Bath solutions were exchanged using solenoid valves controlling a gravity-flow perfusion system, at a solution perfusion rate of ≈2 ml/min. The small volume recording chamber was perfused continually during experiments to prevent artifacts caused by evaporation or between-solution leakage. All solutions were equilibrated to room temperature (22°–25°C) before use.
The time dependence of the redox effects was determined by recordingI–V curves every 30 sec over 30–90 min. From a holding potential of −80 mV, the voltage family used for excised patch recordings was −80 to +70 mV in 10 mV increments with 1 sec between pulses; for cell-attached recordings, the holding potential was −10 mV with pulses from −10 to +190 mV in 10 mV increments. Raw current families were acquired as single voltage sweeps, without any averaging. Examination of tail current reversal potentials indicated that accumulation of K+ in the pipette during voltage pulses was not significant. V0.5 values followed the same time course and the same patterns of modulation when measured using either tail currents or steady-state currents.
Data analysis. Data acquisition and analysis were facilitated by the use of a number of software programs. These included pClamp 6.03 (Axon Instruments), TRANSIT (written by Dr. A. M. J. Van Dongen, Duke University, Durham, NC), Origin 4.1 (MicroCal, Northampton, MA), and various custom Visual Basic analysis programs. Macropatch current-activation curve-fitting was performed using the pCLAMP Chebyshev algorithm and SSE minimization. Time-dependent current “inactivation,” most likely attributable to either Ba2+ (Diaz et al., 1996) or Ca2+block (Vergara and Latorre, 1983) at depolarized potentials or to sojourns into a low-activity gating mode (Rothberg et al., 1996), was not included in the curve-fitting. Normalized conductance (G/Gmax) curves were constructed by first plotting the I–Vrelationship for each macropatch (measuring the average current between two time points at steady state) and using the measured reversal potential (Vrev) to calculate the conductance for each test potential. The V0.5value, slope of the voltage dependence (mV/e-fold change in open probability), and maximal patch conductance (Gmax) were derived from first-power Boltzmann function fits to these data.
Single-channel records were idealized using either the 50% amplitude threshold criterion or the TRANSIT slope-based algorithm that is a more sensitive detector of fast transitions (Van Dongen, 1996). Open probability and dwell time plots were calculated by averaging either 50 or 200 consecutive events, using custom software. To confirm that a membrane patch contained only a single channel, it was held at depolarized voltages and exposed to high [Ca2+], conditions under which the channel open probability is close to 1. Data are expressed as means ± SEM for the number of independent experiments indicated. A different HEK cell or oocyte was used in each experiment.
RESULTS
Time-dependent behavior of hslo channels
A common feature of hsloCa2+-activated K+ channels is a decline of current at the midpoint of the voltage–activation curve after patch excision. To characterize this time-dependent behavior, often referred to as channel “run-down,” recombinanthslo Ca2+-activated K+channels cloned from human brain (Tseng-Crank et al., 1994) were stably expressed in the HEK293 cell line. Inside-out patches were excised from these cells, and current families were recorded in bath solutions containing symmetrical 150 mmK+-gluconate and 100 μmCa2+. From a holding potential of −80 mV, currents were elicited by voltage pulses from −80 to +70 mV in 10 mV increments. Inspection of the raw currents in Figure1A shows that over the course of 30 min, steady-state and kinetic parameters change despite an identical family of voltage pulses. Figure 1B shows the voltage–activation curve derived from the experiment shown in A. At 10 min after patch excision (solid circles), theV0.5 is −26.5 mV, the slope is 12.1 mV/e-fold change in Po, and the maximal conductance is 73.4 nS. At 35 min after excision (open circles), the V0.5 is shifted to +6.2 mV, the slope is 17.2 mV/e-fold change in Po, and the maximal conductance is 68.3 nS.
Figure 1C demonstrates the averaged time course of these variables for 32 individual HEK cells. Linear regression of the data indicates that steady-state V0.5 values shift to more positive potentials over time at a mean rate of 1.4 ± 0.1 mV/min in 100 μm Ca2+ (open circles) and 1.2 ± 0.05 mV/min in 1 μmCa2+ (open squares). In contrast, the slope of the voltage dependence does not change significantly (0.05 ± 0.004 mV/e-fold change inPo/min) (Fig. 1D,open circles), and the Gmax declines slightly at a rate of 0.11 ± 0.02 nS/min (Fig.1D, solid circles; n = 32). Only the 100 μm Ca2+ data are shown for clarity. Although most patches reflect these means, ∼10% (3 of 32) show almost no change over a period of 30 min. This variability may reflect differing initial redox states of individual HEK293 cells. In addition, for ∼5 min immediately on patch excision, most patches show a faster rate of current decline (∼4 mV/min shift in V0.5) and a decrease in maximal patch conductance (data not shown). The cause of this different initial rate is unknown, but a concurrent decline in Gmaxsuggests that a subset of channels in the patch cease to function.
To determine whether the cause of this time-dependent behavior is the consequence of the channels’ removal from the intracellular environment, a gigaohm seal was formed on the surface of HEK293 cells. Because of the low concentration of Ca2+ inside HEK293 cells, it was necessary to elicit currents using longer (250 msec) voltage steps to more depolarized voltages. Currents were evoked by voltage pulses from −10 to +190 mV (in 20 mV increments) from a holding potential of −10 mV. Figure 1E demonstrates that the steady-state V0.5 (Fig.1E, open circles),Gmax (Fig. 1F, solid circles), and slope values (Fig. 1F, open circles) show little change during recordings of up to 60 min under these conditions (13 of 15 cells).
Because outward currents may be attenuated because of time-dependent Ba2+ (Diaz et al., 1996) or Ca2+(Vergara and Latorre, 1983) block or because of a Ca2+-induced low-activity gating mode (Rothberg et al., 1996), steady-state V0.5 values derived from currents may be inaccurate at depolarized voltages. Therefore, we also examined peak tail current amplitudes during on-cell recordings by repolarizing to −100 mV after voltage pulses from −10 to +190 mV (in 20 mV increments) from a holding potential of −10 mV; this allows us to measure V0.5 values up to +200 mV and record maximal patch conductances. In addition, to resolve the fast tail currents accurately, we applied minimal filtering (50 kHz) and used high sampling rates (83.3 kHz). The mean V0.5values are plotted in Figure 1E (solid circles). Although the instantaneous tail currentV0.5 of 139.8 ± 8.7 mV (n= 9 cells) differs significantly from the steady-stateV0.5 of 94.5 ± 5.9 mV (n = 15 cells), neither measure reveals any time-dependent changes in average channel function during cell-attached recordings.
Effects of the reducing agent DTT
To identify the property of the intracellular environment that is responsible for the stability of channel function during cell-attached recordings, we examined the effect of the redox environment onhslo channels. To generate reducing conditions, we used DTT, an agent with a very low redox potential comparable with the NAD+/NADH redox couple (Karlin and Bartels, 1966). Figure 2A shows recordings from inside-out macropatches from stably transfected HEK293 cells before (top; t = 5 min), during (middle;t = 23 min), and after (bottom;t = 38 min) intracellular (bath) application of DTT (1 mm) in the continual presence of 100 μmCa2+. The corresponding voltage–activation curves for these currents are shown in Figure 2B. For these data, the V0.5 is −17.6 mV (att = 5 min; open squares), −36.5 (att = 23 min; open circles), and −21.7 mV (att = 38 min; solid squares); the slope of the voltage dependence is 15.2 (at t = 5), 13.1 (att = 23), and 14.8 (at t = 38) mV/e-fold change in Po; and the maximal conductance is 59.2 nS (at t = 5), 61.4 nS (at t = 23), and 59.6 nS (at t = 38). Averaging the data from eight cells confirms that DTT causesV0.5 values to shift an average of 18.3 ± 1.8 mV to more negative potentials (Fig. 2C) without affecting the slope of the voltage dependence (Fig.2D, solid circles) or macroscopic conductance (Fig. 2D, open circles). The time course of this potentiation can be fit with a single exponential having a mean time constant of 7.5 ± 0.6 min. In addition, reduction of hslo channels by DTT consistently slows the rate of channel run-down more than 10-fold, from an average of 1.5 ± 0.1 to 0.11 ± 0.06 mV/min (n = 13 cells). In most patches, run-down is abolished completely during DTT perfusion. Identical experiments were conducted with outside-out instead of inside-out patches; in these experiments, extracellular DTT application also has a similar magnitude effect that occurs at a similar rate (n = 4 cells; data not shown).
Fig. 2.

DTT potentiates hslo currents and prevents channel run-down. A, Current–voltage curves (−80 to +70 in 10 mV increments) were recorded from inside-out macropatches excised from HEK293 cells stably transfected withhslo-hbr5. The data shown were obtained before (top), during (middle), and after (bottom) intracellular (bath) application of the reducing agent DTT (1 mm). B, The voltage–activation curves for the currents depicted inA, before (open squares), during (open circles), and after (solid squares) DTT treatment. C, The average time dependence ofV0.5 values from eight cells after patch excision (t = 0), the addition of 1 mmDTT (t = 5 min), and the washout of DTT (t = 25 min). D, The average time dependence of shifts in Gmax (open circles) and the slope of the voltage dependence (solid circles) before, during, and after the application of DTT.
The modification of hslo activation kinetics by DTT
Our previous work with hsloCa2+-activated K+ channels demonstrated that the activation kinetics of hslomacroscopic currents are much more sensitive to changes in intracellular Ca2+ than to changes in membrane voltage (DiChiara and Reinhart, 1995). Therefore, a large effect of DTT on current activation would provide evidence that the channel’s Ca2+ affinity, rather than its voltage dependence, is being modified by redox reagents. To examine these possibilities, inside-out macropatches were excised from HEK293 cells, and currents were recorded using the pulse protocol described for Figure 1. The currents were fit with the sum of two exponentials as described in Materials and Methods. Figure 3A shows scaled current traces from a representative experiment in 100 μmCa2+, with only the +40 mV record shown for illustration. Figure 3B illustrates that first,hslo currents activate more slowly as a function of time; the time constants derived from these fits increase at a rate of 0.5 ± 0.03 msec/min. Second, intracellular application of DTT halts this run-down of activation and increases the kinetics by an average of 32.7 ± 4.2% (n = 8) to nearly the activation rates measured before DTT treatment. The fractional areas under these exponential fits reveal that the relative contribution of the slow time constant predominates (≈75% of the total) and, additionally, show a tendency to increase its proportion (by 8–10%) over the fast with time (data not shown). DTT application stabilizes the proportions of the time constants.
Fig. 3.
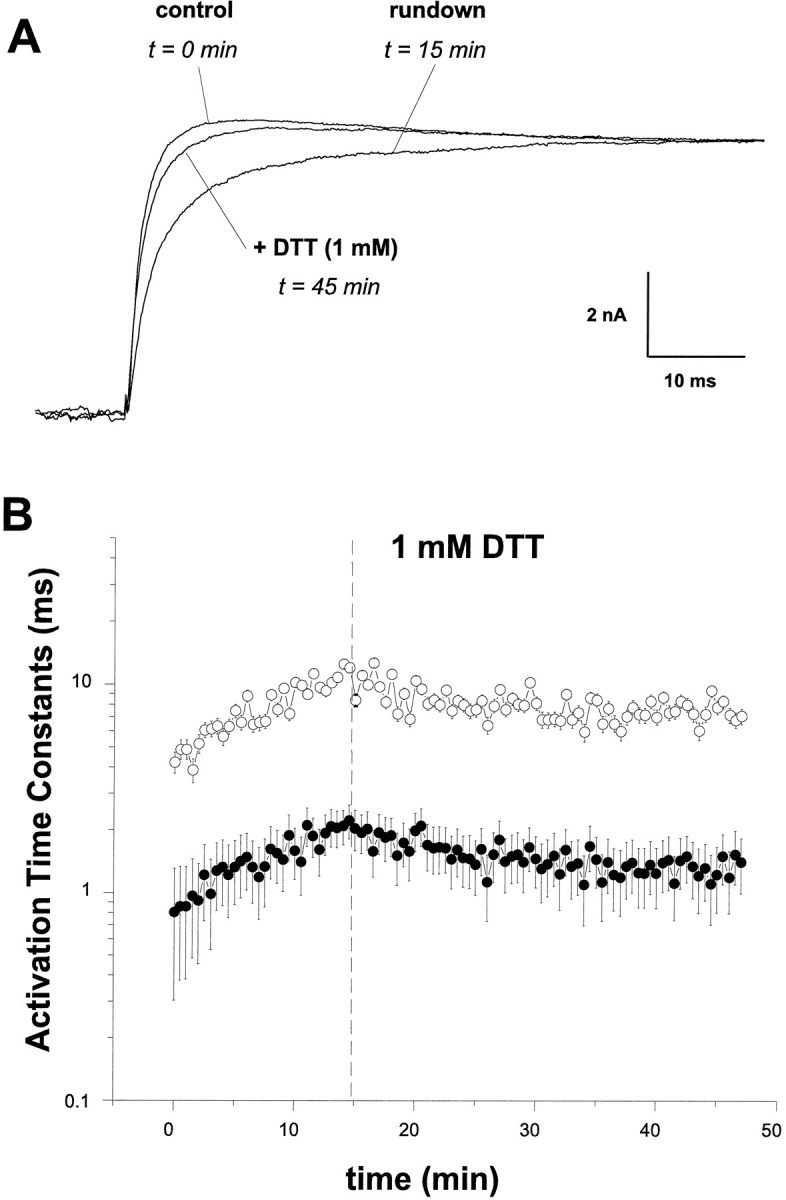
DTT modulates hslo activation kinetics. Inside-out macropatches were excised fromhslo-HEK293 cells as in Figure 1. Currents elicited by a +40 mV voltage pulse from a holding potential of −80 mV were fit with the sum of two exponentials. A, Representative current records immediately after patch excision (control), 15 min later (run-down), and 30 min after the addition of 1 mm DTT (+ DTT).B, The time constants of activation derived from these fits for the fast (solid circles) and slow (open circles) kinetic components.
DTT increases single-channel open probability
To determine whether the observed effect of DTT on macroscopic currents is attributable to changes in the number of channels, their unitary conductances, or some aspect of their gating or permeation, we examined inside-out patches containing only one or severalhslo KCa channels. Because thehslo-HEK293 stable cell line does not express less than several hundred channels per patch, we used the Xenopus laevis oocyte expression system to examine single hslochannel behavior. This necessitated that we confirm that the Ca2+ sensitivity and voltage dependence ofhslo channels were similar in both expression systems. Thus, oocytes were injected with hslo (hbr5) cRNA (100 ng/μl), currents were recorded 24 hr later, and the data were compared withhslo channels expressed in HEK293 cells. Figure4A shows typical raw hslocurrents expressed in HEK293 cells (left) andXenopus oocytes (right) at either 100 μm (top) or 1 μm(middle) Ca2+. From a holding potential of −80 mV, currents were evoked by voltage pulses from −80 to +70 mV in 10 mV increments for 100 μm Ca2+solutions and from −60 to +90 mV in 10 mV increments for 1 μm Ca2+ solutions. Neither wild-type HEK293 cells nor uninjected oocytes show detectable KCacurrents (bottom), although oocytes do contain low numbers of endogenous large-conductance KCa channels that are present in ∼5% of all membrane patches (Krause et al., 1996). Figure4B shows that the steady-state macroscopic conductance at a range of voltages is not significantly different whenhslo channels are expressed in either HEK293 cells or oocytes; mean V0.5 values in oocytes are −28.7 ± 2.4 mV in 100 μm Ca2+and +34.8 ± 6.8 mV in 1 μm Ca2+(n = 7 oocytes), whereas in HEK293 cells, the values are −30.5 ± 1.9 mV in 100 μmCa2+ and +35.6 ± 4.7 mV in 1 μmCa2+ (n = 7 cells). These data indicate that the Ca2+ sensitivity ofhslo channels is similar in both HEK293 cells andXenopus oocytes.
To characterize the effects of reducing and oxidizing reagents on single hslo channels, we injected Xenopus oocytes with cRNA encoding the hbr5 splice variant of hslo at 5–10 ng/μl. Figure 5A depicts an experiment in which an inside-out patch containing a single channel was bathed in a solution containing 100 μm free Ca2+and was voltage-clamped at +20 mV. Figure 5B depicts the entire 30 min recording from this experiment, showing a spontaneous decline in channel open probability (Po) over ≈3 min. In this plot, each vertical line represents the averagedPo for 50 consecutive open and closed events. Slow changes in open probability are sometimes observed during such recordings (Silberberg et al., 1996), but thesePo variations are always less than the decline seen in Figure 5B or the increase seen after DTT treatment (Fig. 6B). The meanPo before the transition is 0.87 ± 0.09 and 0.21 ± 0.13 afterward (n = 8). Figure5C plots the time course of mean dwell times in the open state (open circles) and closed state (solid circles) from the same channel depicted in Figure 5, Aand B. Each data point is the average dwell time of 200 consecutive open or closed events, respectively; this experiment contained a total of >420,000 events. Even though the multiple open and closed states that exist are averaged in this analysis (seeDiChiara and Reinhart, 1995), it is clear that the decline inPo corresponds to both a decrease in mean open time intervals and a concomitant increase in mean closed durations.
Fig. 5.
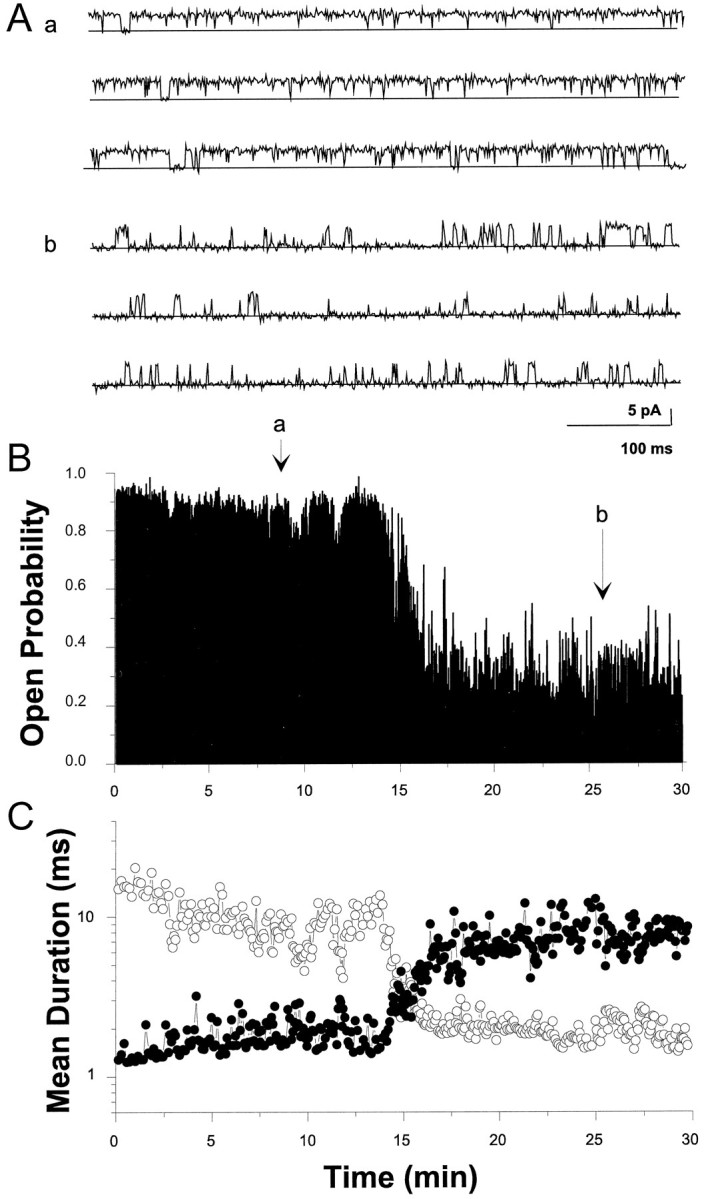
Changes in single hslo channel properties after membrane patch excision. cRNA encodinghslo (10 ng/μl) was injected in Xenopusoocytes, and excised inside-out patches were examined for channel activity 24 hr later. Patches containing single hslochannels were voltage-clamped at +20 mV and assayed in symmetrical 150 mm K+-gluconate solutions containing 100 μm intracellular Ca2+. Currents were filtered at 2 kHz and digitized at 5 kHz. A, Representative single-channel recording ∼8 min (a) and 26 min after excision (b). The closed state of the channel is indicated by the solid line.B, A continuous 30 min recording showing the time course of open probability changes after patch excision. Each vertical data line in the plot represents the averagePo for 50 consecutive transitions.a and b denote times at which single-channel transitions shown in A were recorded.C, The time course of changes in mean dwell times in the open state (open circles) and closed state (solid circles) for the same channel depicted in A andB. Each data point represents the average dwell time for 200 consecutive gating events.
Fig. 6.
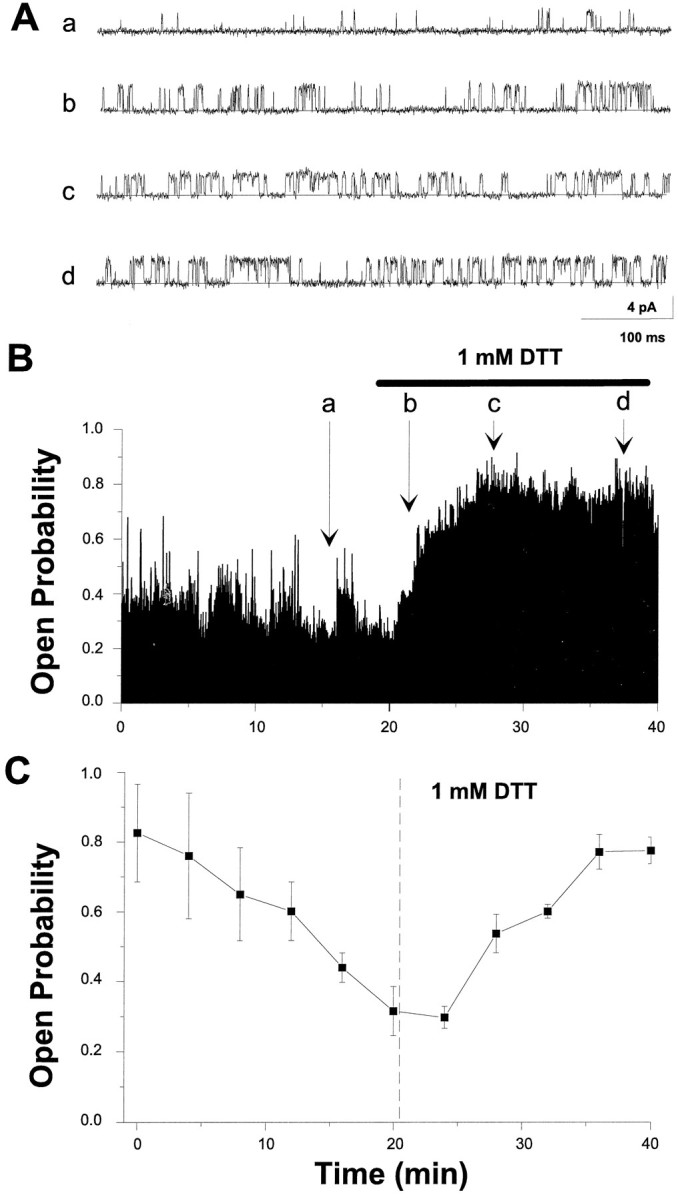
DTT increases the open probability of singlehslo channels. A, Raw current traces from a single hslo channel expressed inXenopus oocytes, voltage-clamped at +20 mV, and bathed in symmetrical 150 mm K+-gluconate solutions containing 100 μm free Ca2+. Currents were filtered at 2 kHz and digitized at 10 kHz. The closed state of the channel is depicted by solid lines.B, The time course of open probability changes after the application of 1 mm DTT (horizontal line). The letters denote times at which single-channel transitions shown in A were recorded. Eachvertical data line in the plot represents the averagePo for 50 consecutive transitions.C, The average open probability after patch excision and the addition of 1 mm DTT (t = 21 min;dashed vertical line) for five experiments.
A similar set of single-channel experiments was performed to examine the effects of DTT on open probability. In Figure 6B, it can be seen that the intracellular application of DTT (1 mm) rescues an already run-down channel to near its basal open probability. Raw current traces from the regions indicated are shown in Figure 6A. The average of five complete experiments (Fig. 6C) indicates that the meanPo before DTT application (at pointa) is 0.29 ± 0.11 and 23 min afterward (at pointd) is 0.75 ± 0.12 (n = 5 cells). The DTT effect on single hslo channels approximates the time course of the DTT effect observed with macroscopic currents (compare with Fig. 2C). In these and the previous experiments, the number of channels in a patch did not change in 10 of 13 experiments; in the remainder, 1 or 2 channels stopped functioning within the first minute after patch excision, a process unaffected by DTT application.I–V curves showed no changes in single-channel slope conductance or unitary amplitudes after DTT treatment (data not shown).
Effects of hydrogen peroxide on hslo
If the underlying cause of the DTT potentiation of hslocurrents is attributable to their effects as reducing agents, then oxidizing agents should have the opposite effect, i.e., current downmodulation. To examine this possibility, we applied 0.3% hydrogen peroxide (H2O2) to the intracellular surface of inside-out macropatches from hslo-HEK cells as described previously. Figure 7A shows that when the patch is preincubated with DTT for 20 min, bath perfusion of H2O2 results in a reversal of the DTT potentiation and a continuation of channel run-down, as reflected in a right shift of steady-state V0.5 values (n = 4). In three of four cells, subsequent DTT treatment did not result in changes toV0.5; only a cessation of run-down was observed. In the remaining experiment, DTT treatment at this point caused a 5.3 mV shift to more negative potentials (data not shown); however, this information is obscured in the average. Figure7B demonstrates that oxidation of hslo channels with hydrogen peroxide without previous treatment with DTT also increases the rate of channel run-down from 1.6 ± 0.06 mV/min to 2.9 ± 0.03 mV/min (n = 5). A representative experiment with a single channel expressed in Xenopusoocytes is shown in Figure 7C. The channels were expressed and recorded in the same manner as described in Figure 5. The data show that the single-channel open probability is decreased by application of H2O2 on a time scale similar to that seen during normal run-down of the channel (Fig. 5A). Similar results were observed in four additional experiments.
Fig. 7.
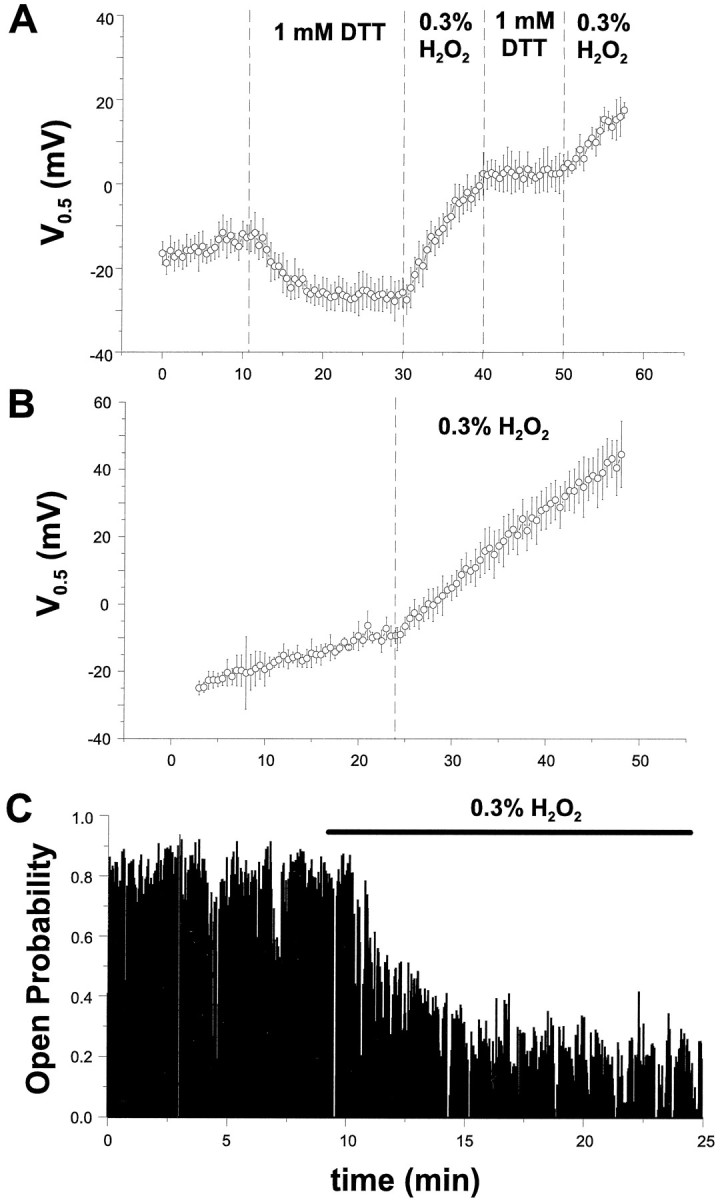
The effect of hydrogen peroxide (H2O2) on hslo currents.A, H2O2 (0.3%) was applied to the intracellular surface of inside-out patches expressinghslo currents excised from HEK293 cells. Membrane patches were preincubated with 1 mm DTT for 20 min in the presence of 100 μm Ca2+, followed by bath perfusion of H2O2 for 10 min. The observed shift of V0.5 values induced by reducing and oxidizing agents could be repeated several times in the same patch.B, Oxidation of hslo currents with hydrogen peroxide increases the rate of run-down after patch excision.C, Time dependence of changes in the single-channel open probability after the application of H2O2(dashed vertical line). Hslo channels were expressed in Xenopus oocytes as described in Figure5 and held at +20 mV during the experiment. Each vertical data line in the plot represents the averagePo for 50 consecutive transitions.
Drosophila (dslo) channels are not modulated by DTT
A HEK293 cell line stably expressing the Drosophila dslo channel (the A1/C2/E1/G3/I0 splice variant) (Adelman et al., 1992) was created to compare its modulation by redox reagents with that of hslo channels. dslo currents recorded from inside-out HEK293 cell patches demonstrate indistinguishable properties as currents recorded from cRNA-injected oocytes (DiChiara and Reinhart, 1995). In addition, they retain the same functional differences withhslo currents, i.e., slower and less voltage-dependent activation kinetics and more positive V0.5values at a given Ca2+ concentration (compare Figs.8A and 2A). However, Figure 8B shows that at a given Ca2+ concentration (100 μm in this case), V0.5 values shift to more positive potentials only slightly as a function of time; the mean rate of run-down is ∼10-fold less than the hslo rate, 0.15 ± 0.08 mV/min (n = 11 cells), with a number of membrane patches showing no run-down at all. Macroscopic conductance (Fig.8C, solid circles) and slope (Fig. 8C,open circles) values were unchanged during this time. Additionally, reduction by DTT (5 mm) had no effect on the steady-state currents (n = 5; Fig.8B) or the kinetics of activation (data not shown).
Fig. 8.

dslo KCa channels are not modulated by redox reagents. Currents were elicited from a HEK293 cell line stably expressing Drosophila dslo channels (splice variant A1/C2/E1/G3/I0) (Adelman et al., 1992) as described in Figure 1.A, Current families evoked by command voltage steps ranging from −80 mV to +70 mV from a holding potential of −80 mV.B, The time dependence of dslo V0.5 changes after patch excision, the addition of 5 mm DTT (t = 25 min), and the washout of this agent (t = 45 min). C, The time dependence of macroscopic conductance values (solid circles) and the slope of the voltage dependence (open circles) after excision and DTT treatment.
DISCUSSION
By examining the effects of a direct application of reducing and oxidizing reagents to the intracellular surface of cloned Ca2+-activated K+ channels, we have shown that the function of these channels can be modulated by changes in their redox environment. The reducing agent DTT enhances and stabilizes the activity of KCa channels, whereas the oxidizing agent H2O2 leads to a decrease in KCa channel open probability over time.
Time-dependent run-down of channel activity is a common feature of ion channel recording (Strupp et al., 1992; Schlief et al., 1996), and a number of different mechanisms appear to underlie this phenomenon for individual channel types. We have demonstrated that the run-down ofhslo channels seen in excised patches is largely a response to the oxidative environment resulting from patch excision. By continuously monitoring the voltage of half-maximal activation, the macroscopic conductance, and the slope of the voltage dependence, we have shown that the shift in V0.5 values over time (Fig. 1) starts immediately at excision of the membrane patch and corresponds to the average of many single channels undergoing large, step-like changes in channel open probability (Fig. 5). Although we have demonstrated that there is no Ca2+ dependence of run-down over a 100-fold concentration range (1–100 μm), we cannot rule out the possibility that run-down is slowed at nanomolar Ca2+ conditions.
These data are consistent with the formation of disulfide bonds in thehslo protein after removal of the patch from the cell. The channel’s cysteines are usually exposed to the relatively reduced state in the interior of a cell, but after patch excision, some of these residues may be slowly oxidized. An alternative possibility is that a redox-sensitive process endogenous to HEK cells may indirectly mask or enhance the consequences of run-down, which is itself not sensitive to the redox potential. Such a process may involve undefined accessory proteins, or it may result from an indirect alteration of Ca2+ binding to the channel. For example, because it is known that cysteine residues have a high affinity for some divalent cations, redox reagents may be perturbing hslo’s Ca2+-binding site(s) in an allosteric manner. Indeed, Serre et al. (1995) have observed an effect of redox reagents on the cooperativity of nucleotide binding in cGMP channels. A relationship between the redox environment and Ca2+binding may have been revealed by observing large effects of redox reagents on hslo activation kinetics, because previous data have shown that KCa channel activation kinetics are strongly dependent on intracellular Ca2+concentration (Markwardt and Isenberg, 1992; DiChiara and Reinhart, 1995). However, the ≈33% change in hslo activation kinetics measured in response to DTT (Fig. 3) is not of a significant magnitude to allow us to differentiate between an effect of these agents on the channel’s voltage-sensing apparatus or on Ca2+ activation.
Although our results do not allow us to rule out indirect redox effects mediated by endogenous accessory proteins, several lines of evidence argue for direct redox effects on the channel protein. First, the overexpression of these channels (>500 channels per patch) in heterologous systems such as HEK cells argues against a concomitant increase in expression of an associated endogenous molecule. Second, the lack of a redox effect on dslo channels requires the existence of an endogenous factor that differentially modulates two very similar proteins. Although the mammalian KCa channel β-subunit is an example of a protein that does modulatehslo but not dslo (Meera et al., 1996; Wallner et al., 1996), the more parsimonious explanation is that dslodoes not contain cysteines in the necessary number or position for the direct redox modulation seen in hslo. A comparison of protein sequences reveals that there are nine cysteine residues that are not conserved between the two channels.
The hslo (hbr5) protein contains 27 cysteine residues, 24 of which occur on presumed intracellular or transmembrane domains, largely concentrated in the large C-terminal “tail” region unique to these channels. However, hslo channels recorded in outside-out patches also exhibit DTT modulation (data not shown). This result, combined with the observation that DTT can cross membranes, precludes us from clearly differentiating between intracellular and extracellular sites of action. The formation of disulfide bridges requires an oxidative environment, and thus they are not usually found in intracellular domains of proteins that exist in the cell’s reductive environment. Indeed, mutagenesis of the NMDA receptor has localized a redox modulatory site to an extracellular domain (Aizenman et al., 1989), and the use of membrane-impermeant redox reagents has shown that extracellular cysteine residues in cardiac Ca2+ and Na+ channels are redox-sensitive (Chiamvimonvat et al., 1995). However, there is precedent for an intracellular locus of action; by using membrane-impermeant oxidizing reagents such as thimerosal, cytoplasmic redox sites in KATP channels that decrease open probability and alter ATP sensitivity have been characterized (Islam et al., 1993; Coetzee et al., 1995).
One major endogenous redox factor that may control KCachannel function in intact cells is glutathione, present in millimolar concentrations in brain (Slivka et al., 1987; Philbert et al., 1991). The majority of this glutathione is located within cells and is in the reduced (GSH) form; during periods of oxidative stress, GSH is converted to the oxidized form (GSSG) to prevent damage from oxygen free radicals (Sucher and Lipton, 1991). Endogenous production of NO during normal synaptic function may also alter the cellular redox potential and thus modulate KCa channel function. NO has been shown to regulate ion channel activity both by a direct mechanism, i.e., S-nitrosylation/oxidation of cysteine residues in the channel (Lei et al., 1992; Bolotina et al., 1994; Campbell et al., 1996) and by indirectly activating cGMP-dependent and protein kinase G signaling pathways (Schmidt et al., 1993; Campbell et al., 1996). Little is known, however, about the nature and regulation of enzymes responsible for the maintenance of the overall thiol/disulfide balance in cells (Ziegler, 1985).
Ion channels respond to redox reagents in diverse ways. For example, an oxidative environment causes the closure of NMDAR, KATP, and hslo KCa channels, but it opens some Ca2+ channels and removes inactivation in Kv1.4 channels (Stephens et al., 1996). This diversity of redox effects may be attributable to the reactivity of the sulfhydryl groups of cysteine residues; they may be alkylated, acylated, arylated, and oxidized to form some combination of sulfenic, sulfinic, or sulfonic compounds with varying stability. These adducts may contribute in complex ways to the covalent modification of redox modulatory sites (Dalton et al., 1993).
The rates of redox modulation are also heterogeneous in different ion channel types. Some reports indicate that formation of disulfide bridges can occur on a millisecond time scale (Ruppersberg et al., 1991), whereas the maximal effect of DTT on hslo and NMDAR currents requires up to 20 min. Our data indicate that the time course of the redox effects on macroscopic hslo currents may correspond to single channels undergoing more rapid modulation occurring at different times during the recording. The spontaneous transition from high to low Po seen in hslochannel records during channel run-down (Fig. 5A) and the time course of the increase in Po measured after DTT treatment (Fig. 6C) indicate that either multiple sites are being modulated or that subsequent to a fast modification of one residue, there are slow conformational changes leading to a change in current flow. Additionally, the lack of a DTT effect after H2O2 treatment (Fig. 7A) may indicate that reversal of the H2O2 effect is slower than reduction because of different downstream conformational changes.
In summary, our data show that the function of hslo but notdslo KCa channels can be modulated by fluctuations in the cytoplasmic redox ratio. Cellular redox potential thus may act as a signaling pathway serving to link metabolic status or the concentration of retrograde messengers to the electrical activity of neurons.
Footnotes
This work was supported by National Institutes of Health Grant NS31253 to P.H.R. and predoctoral National Research Service Award MH10930-F31 to T.J.D. We thank Felicitas Schmalz and Todd Scherer for assistance with subcloning, Jeff Krause for RNA transcription, and Drs. Donald C. Lo and Antonius M. J. VanDongen for critical reviews of this manuscript. We also thank Dr. John Adelman for generously providing thedslo clone.
Correspondence should be addressed to Dr. Peter H. Reinhart, Department of Neurobiology, Duke University Medical Center, P.O. Box 3209, Durham, NC 27710.
REFERENCES
- 1.Adelman J, Shen KZ, Kavanaugh MP, Warren RA, Wu YN, Lagrutta A, Bond CT, North RA. Calcium-activated potassium channels expressed from cloned complimentary DNAs. Neuron. 1992;9:209–216. doi: 10.1016/0896-6273(92)90160-f. [DOI] [PubMed] [Google Scholar]
- 2.Aizenman E, Lipton SA, Loring RH. Selective modulation of NMDA responses by reduction and oxidation. Neuron. 1989;2:1257–1263. doi: 10.1016/0896-6273(89)90310-3. [DOI] [PubMed] [Google Scholar]
- 3.Atkinson NS, Robertson GA, Ganetzky B. A component of calcium-activated potassium channels encoded by the Drosophila slo locus. Science. 1991;253:551–555. doi: 10.1126/science.1857984. [DOI] [PubMed] [Google Scholar]
- 4.Bielefeldt K, Jackson MB. A calcium-activated potassium channel causes frequency-dependent action potential failures in a mammalian nerve terminal. J Neurophysiol. 1993;458:41–67. doi: 10.1152/jn.1993.70.1.284. [DOI] [PubMed] [Google Scholar]
- 5.Bolotina VM, Najibi S, Palacino JJ, Pagano PJ, Cohen RA. Nitric oxide directly activated calcium-dependent potassium channels in vascular smooth muscle. Nature. 1994;368:850–853. doi: 10.1038/368850a0. [DOI] [PubMed] [Google Scholar]
- 6.Butler A, Tsunoda S, McCobb DP, Wei A, Salkoff L. mSLO, a complex mouse gene encoding “maxi” calcium-activated potassium channels. Science. 1993;261:221–224. doi: 10.1126/science.7687074. [DOI] [PubMed] [Google Scholar]
- 7.Campbell DL, Stamler JS, Strauss HC. Redox modulation of L-type calcium channels in ferret ventricular myocytes. J Gen Physiol. 1996;108:277–293. doi: 10.1085/jgp.108.4.277. [DOI] [PMC free article] [PubMed] [Google Scholar]
- 8.Chiamvimonvat N, O’Rourke B, Kamp TJ, Kallen RG, Hoffmann F, Flockerzi V, Marban E. Functional consequences of sulfhydryl modification in the pore-forming subunits of cardiovascular Ca2+ and Na+ channels. Circ Res. 1995;76:325–334. doi: 10.1161/01.res.76.3.325. [DOI] [PubMed] [Google Scholar]
- 9.Coetzee WA, Nakamura TY, Faivre JF. Effects of thiol-modifying agents on KATP channels in guinea pig ventricular cells. Am J Physiol. 1995;269:H1625–H1633. doi: 10.1152/ajpheart.1995.269.5.H1625. [DOI] [PubMed] [Google Scholar]
- 10.Critz SD, Wible BA, Lopez HS, Brown AM. Stable expression and regulation of a rat brain K+ channel. J Neurochem. 1993;60:1175–1178. doi: 10.1111/j.1471-4159.1993.tb03273.x. [DOI] [PubMed] [Google Scholar]
- 11.Dalton LA, McIntyre JO, Fleischer S. Effect of selective thiol-group derivatization on enzyme kinetics of (R)-3-hydroxybutryate dehydrogenase. Biochem J. 1993;296:563–569. doi: 10.1042/bj2960563. [DOI] [PMC free article] [PubMed] [Google Scholar]
- 12.Diaz F, Wallner M, Stefani E, Toro L, Latorre R. Interaction of internal Ba2+ with a cloned Ca2+-activated K+ (hslo) channel from smooth muscle. J Gen Physiol. 1996;107:399–407. doi: 10.1085/jgp.107.3.399. [DOI] [PMC free article] [PubMed] [Google Scholar]
- 13.DiChiara TJ, Reinhart PH. Distinct effects of Ca2+ and voltage on the activation and deactivation of cloned Ca2+-activated K+ channels. J Physiol (Lond) 1995;489:403–418. doi: 10.1113/jphysiol.1995.sp021061. [DOI] [PMC free article] [PubMed] [Google Scholar]
- 14.DiChiara TJ, Reinhart PH. Regulation of hslo Ca2+-activated K+ channels by redox reagents. Soc Neurosci Abstr. 1996;142:10. doi: 10.1523/JNEUROSCI.17-13-04942.1997. [DOI] [PMC free article] [PubMed] [Google Scholar]
- 15.Dworetzky SI, Trojnacki JT, Gribkoff VK. Cloning and expression of a human large-conductance calcium activated potassium channel. Mol Brain Res. 1994;27:189–193. doi: 10.1016/0169-328x(94)90203-8. [DOI] [PubMed] [Google Scholar]
- 16.Gola M, Crest M. Colocalization of active KCa channels and Ca2+ channels within Ca2+ domains in Helix neurons. Neuron. 1993;10:689–699. doi: 10.1016/0896-6273(93)90170-v. [DOI] [PubMed] [Google Scholar]
- 17.Islam MS, Berggren PO, Larsson O. Sulfhydryl oxidation induces rapid and reversible closure of the ATP-regulated K+ channel in the pancreatic β cell. FEBS Lett. 1993;319:128–132. doi: 10.1016/0014-5793(93)80051-u. [DOI] [PubMed] [Google Scholar]
- 18.Karlin A, Bartels E. Effects of blocking sulfhydryl groups and of reducing disulfide bonds on the acetylcholine-activated permeability system of the electroplax. Biochim Biophys Acta. 1966;126:513–524. doi: 10.1016/0926-6585(66)90010-0. [DOI] [PubMed] [Google Scholar]
- 19.Kohr G, Eckardt S, Luddens H, Monyer H, Seeburg PH. NMDA receptor channels: subunit-specific potentiation by reducing agents. Neuron. 1994;12:1031–1040. doi: 10.1016/0896-6273(94)90311-5. [DOI] [PubMed] [Google Scholar]
- 20.Knaus HG, Schwarzer C, Koch ROA, Eberhart A, Kaczorowski GJ, Glossmann H, Wunder F, Pongs O, Garcia ML, Sperk S. Distribution of high-conductance Ca2+-activated K+ channels in rat brain: targeting to axons and nerve terminals. J Neurosci. 1996;16:955–963. doi: 10.1523/JNEUROSCI.16-03-00955.1996. [DOI] [PMC free article] [PubMed] [Google Scholar]
- 21.Krause JD, Foster CD, Reinhart PH. Xenopus laevis oocytes contain endogenous large-conductance Ca2+-activated K+ channels. Neuropharmacology. 1996;35:1017–1022. doi: 10.1016/0028-3908(96)00134-7. [DOI] [PubMed] [Google Scholar]
- 22.Lancaster B, Nicoll RA. Properties of two calcium-activated hyperpolarizations in rat hippocampal neurons. J Physiol (Lond) 1987;389:187–203. doi: 10.1113/jphysiol.1987.sp016653. [DOI] [PMC free article] [PubMed] [Google Scholar]
- 23.Latorre R, Oberhauser A, Labarca P, Alvarez O. Varieties of calcium-activated potassium channels. Annu Rev Physiol. 1989;51:385–399. doi: 10.1146/annurev.ph.51.030189.002125. [DOI] [PubMed] [Google Scholar]
- 24.Lazarewicz JW, Wroblewski JT, Palmer ME, Costa E. Reduction of disulfide bonds activates NMDA-sensitive glutamate receptors in primary cultures of cerebellar granule cells. Neurosci Res Commun. 1989;4:91–97. [Google Scholar]
- 25.Lei SZ, Pan ZH, Aggarwal SK, Chen HSV, Hartman J, Sucher NJ, Lipton SA. Effect of nitric oxide on the redox modulatory site of the NMDA receptor-channel complex. Neuron. 1992;8:1087–1099. doi: 10.1016/0896-6273(92)90130-6. [DOI] [PubMed] [Google Scholar]
- 26.Levitan IB. Modulation of ion channels by protein phosphorylation and dephosphorylation. Annu Rev Physiol. 1994;56:193–212. doi: 10.1146/annurev.ph.56.030194.001205. [DOI] [PubMed] [Google Scholar]
- 27.Markwardt F, Isenberg G. Gating of maxi K+ channels studied by Ca2+ concentration jumps in excised inside-out patches (myocytes from guinea pig urinary bladder). J Gen Physiol. 1992;99:841–862. doi: 10.1085/jgp.99.6.841. [DOI] [PMC free article] [PubMed] [Google Scholar]
- 28.McManus OB. Ca2+-activated K+ channels: regulation by calcium. J Bioenerg Biomembr. 1991;23:537–560. doi: 10.1007/BF00785810. [DOI] [PubMed] [Google Scholar]
- 29.Meera P, Wallner M, Jiang Z, Toro L. A calcium switch for the functional coupling between alpha (hslo) and beta subunits (KV,Ca-beta) of maxi K channels. FEBS Lett. 1996;382:84–88. doi: 10.1016/0014-5793(96)00151-2. [DOI] [PubMed] [Google Scholar]
- 30.Pallanck L, Ganetzky B. Cloning and characterization of human and mouse homologs of the Drosophila calcium-activated potassium channel gene, slowpoke. Hum Mol Genet. 1994;3:1239–1243. doi: 10.1093/hmg/3.8.1239. [DOI] [PubMed] [Google Scholar]
- 31.Philbert MA, Beiswanger CM, Waters DK, Reuhl KR, Lowndes HE. Cellular and regional distribution of reduced glutathione in the nervous system of the rat: histochemical localization by mercury orange and o-phthaldialdehyde-induced histofluorescence. Toxicol Appl Pharmacol. 1991;107:215–227. doi: 10.1016/0041-008x(91)90204-r. [DOI] [PubMed] [Google Scholar]
- 32.Robitaille R, Charlton MP. Presynaptic calcium signals and transmitter release are modulated by calcium-activated potassium channels. J Neurosci. 1992;12:297–305. doi: 10.1523/JNEUROSCI.12-01-00297.1992. [DOI] [PMC free article] [PubMed] [Google Scholar]
- 33.Robitaille R, Garcia ML, Kaczorowski GJ, Charlton MP. Functional co-localization of calcium and calcium-gated potassium channels in control of transmitter release. Neuron. 1993;11:645–655. doi: 10.1016/0896-6273(93)90076-4. [DOI] [PubMed] [Google Scholar]
- 34.Rothberg BS, Bello RA, Song L, Magleby KL. High Ca2+ concentrations induce a low activity mode and reveal Ca2+-independent long shut intervals in BK channels from rat muscle. J Physiol (Lond) 1996;493:673–689. doi: 10.1113/jphysiol.1996.sp021414. [DOI] [PMC free article] [PubMed] [Google Scholar]
- 35.Ruppersberg JP, Stocker M, Pongs O, Heinemann SH, Frank R, Konen M. Regulation of fast inactivation of cloned mammalian IK(A) channels by cysteine oxidation. Nature. 1991;352:711–714. doi: 10.1038/352711a0. [DOI] [PubMed] [Google Scholar]
- 36.Sah P. Ca2+-activated K+ currents in neurones: types, physiological roles and modulation. Trends Neurosci. 1996;4:150–154. doi: 10.1016/s0166-2236(96)80026-9. [DOI] [PubMed] [Google Scholar]
- 37.Schlief T, Schonherr R, Heinemann SH. Modification of C-type inactivating Shaker channels by chloramine-T. Pflügers Arch. 1996;431:483–493. doi: 10.1007/BF02191894. [DOI] [PubMed] [Google Scholar]
- 38.Schmidt HHHW, Lohman SM, Walter U. The nitric oxide and cGMP signal transduction system: regulation and mechanism of action. Biochim Biophys Acta. 1993;1178:153–178. doi: 10.1016/0167-4889(93)90006-b. [DOI] [PubMed] [Google Scholar]
- 39.Serre V, Ildefonse M, Bennett N. Effects of cysteine modification on the activity of the cGMP-gated channel from retinal rods. J Membr Biol. 1995;146:145–162. doi: 10.1007/BF00238005. [DOI] [PubMed] [Google Scholar]
- 40.Silberberg SD, Lagrutta A, Adelman JP, Magleby KL. Wanderlust kinetics and variable Ca2+-sensitivity of Drosophila, a large conductance Ca2+-activated K+ channel, expressed in oocytes. Biophys J. 1996;70:2640–2651. doi: 10.1016/S0006-3495(96)79833-8. [DOI] [PMC free article] [PubMed] [Google Scholar]
- 41.Slivka A, Spina MB, Cohen G. Reduced and oxidized glutathione in human and monkey brain. Neurosci Lett. 1987;74:112–118. doi: 10.1016/0304-3940(87)90061-9. [DOI] [PubMed] [Google Scholar]
- 42.Stephens GJ, Owen DG, Robertson B. Cysteine-modifying reagents alter the gating of the rat cloned potassium channel Kv1.4. Pflügers Arch. 1996;431:435–442. doi: 10.1007/BF02207283. [DOI] [PubMed] [Google Scholar]
- 43.Strupp M, Quasthoff S, Mitrovic N, Grafe P. Glutathione accelerates sodium channel inactivation in excised rat axonal membrane patches. Pflügers Arch. 1992;421:283–285. doi: 10.1007/BF00374840. [DOI] [PubMed] [Google Scholar]
- 44.Sucher NJ, Lipton SA. Redox modulatory site of the NMDA receptor-channel complex: regulation by oxidized glutathione. J Neurosci Res. 1991;30:582–591. doi: 10.1002/jnr.490300316. [DOI] [PubMed] [Google Scholar]
- 45.Sullivan JM, Traynelis SF, Chen HSV, Escobar W, Heinemann SF, Lipton SA. Identification of two cysteine residues that are required for redox modulation of the NMDA subtype of glutamate receptor. Neuron. 1994;13:929–936. doi: 10.1016/0896-6273(94)90258-5. [DOI] [PubMed] [Google Scholar]
- 46.Tang LH, Aizenman E. The modulation of N-methyl-d-aspartate receptors by redox and alkylating reagents in rat cortical neurones in vitro. J Physiol (Lond) 1993;465:303–323. doi: 10.1113/jphysiol.1993.sp019678. [DOI] [PMC free article] [PubMed] [Google Scholar]
- 47.Tseng-Crank J, Foster CD, Krause JD, Mertz R, Godinot N, DiChiara TJ, Reinhart PH. Cloning, expression, and distribution of functionally distinct Ca2+-activated K+ channel isoforms from human brain. Neuron. 1994;13:1315–1330. doi: 10.1016/0896-6273(94)90418-9. [DOI] [PubMed] [Google Scholar]
- 48.Van Dongen AMJ. A new algorithm for idealizing single ion channel data containing multiple unknown conductance levels. Biophys J. 1996;70:1303–1315. doi: 10.1016/S0006-3495(96)79687-X. [DOI] [PMC free article] [PubMed] [Google Scholar]
- 49.Vergara C, Latorre R. Kinetics of Ca2+-activated K+ channels from rabbit muscle incorporated into planar bilayers. Evidence for a Ca2+ and Ba2+ blockade. J Gen Physiol. 1983;82:543–68. doi: 10.1085/jgp.82.4.543. [DOI] [PMC free article] [PubMed] [Google Scholar]
- 50.Wallner M, Meera P, Toro L. Determinant for β-subunit regulation in high-conductance voltage-activated and Ca2+-sensitive K+ channels: an additional transmembrane region at the N-terminus. Proc Natl Acad Sci USA. 1996;93:14922–14927. doi: 10.1073/pnas.93.25.14922. [DOI] [PMC free article] [PubMed] [Google Scholar]
- 51.Wisgirda ME, Dryer SE. Functional dependence of Ca2+-activated K+ channels on L- and N-type Ca2+ channels: differences between chicken sympathetic and parasympathetic neurons suggest different regulatory mechanisms. Proc Natl Acad Sci USA. 1994;91:2858–2862. doi: 10.1073/pnas.91.7.2858. [DOI] [PMC free article] [PubMed] [Google Scholar]
- 52.Zhang L, McBain CJ. Potassium conductances underlying repolarization and after-hyperpolarization in rat CA1 hippocampal interneurones. J Physiol (Lond) 1995;488:661–672. doi: 10.1113/jphysiol.1995.sp020998. [DOI] [PMC free article] [PubMed] [Google Scholar]
- 53.Ziegler DM. Role of reversible oxidation-reduction of enzyme thiols-disulfides in metabolic regulation. Annu Rev Biochem. 1985;54:305–329. doi: 10.1146/annurev.bi.54.070185.001513. [DOI] [PubMed] [Google Scholar]