

Abstract
Although the Masson pine moth, Dendrolimus punctatus, is one of the most destructive forest pest insects and is an endemic condition in China, we still do not fully understand the patterns of how its distribution range varies in response to Quaternary climatic oscillations. Here, we sequenced one maternally inherited mitochondrial gene (COI) and biparentally inherited nuclear data (ITS1 and ITS2) among 23 natural populations across the entire range of the species in China. A total of 51 mitotypes and 38 ribotypes were separately obtained using mtDNA and ITS1 data. Furthermore, significant phylogeographical structure (N ST > G ST, p < 0.01) were detected. The spatial distribution of mitotypes implied that two distinct groups existed in the species: one in the southwest distribution, including 10 locations, and the other located in the northeast region of China. It is suggested, therefore, that each group was derived from ancestors that occupied different isolated refugia during previous periods, possibly last glacial maximum. Mismatch distribution and Bayesian population dynamics analysis suggested the population size underwent sudden expansion, which is consistent with the results of ecological niche modeling. As a typical phytophagous insect, the history of population expansion was in accordance with the host plants, providing abundant food resources and habitat. Intraspecific success rate of barcoding identification was lower than interspecific ones, indicating a level of difficulty in barcoding individuals from different populations. However, it still provides an early insight into the pattern of genetic diversity within a species.
OPEN RESEARCH BADGES

This article has been awarded an Open Data and Open Materials. All materials and data are publicly accessible via the Open Science Framework at https://doi.org/10.5061/dryad.2df87g2. Learn more about the Open Practices badges from the Center for Open Science: https://osf.io/tvyxz/wiki.
Keywords: Dendrolimus punctatus, DNA barcode, phylogeography, population expansion, quaternary climate oscillation
1. INTRODUCTION
It has been widely accepted that the distribution and genetic structure of current organism have been greatly affected by environmental factors and their historical processes (Hewitt, 2000). The oscillations of Quaternary climate changes played critical roles in multiple contraction–expansion processes, which have greatly shaped current geographical distributions and genetic differentiations of many species in temperate zones of East Asian (Hickerson et al., 2010; Qiu, Fu, & Comes, 2011). However, compared with the numerous studies focused in the Qinghai‐Tibet Plateau and Mts. Hengduan (Lei, Qu, Song, Alström, & Fjeldså, 2015; Liu et al., 2016; Wang et al., 2018), such investigations have just started in the subtropical regions of China. During the Last Glacial Maximum (LGM) period, the climate of this region became much cooler and dryer, which drove the southward migration of the warm‐temperate evergreen forests as far as c.24°N (Harrison, Yu, Takahara, & Prentice, 2001; Qiu et al., 2011). Moreover, the vast continental hilly areas in the subtropical China provided potential refugia for temperate deciduous forests and boreal conifer trees (Jiang et al., 2016; Lei et al., 2015).
Previous research implied that much of the genetic variety of phytophagous insects was motivated by the diverging specialization processes onto different host plants (Peterson & Denno, 1998). More detailed studies based on population‐level variations of host plants implied that the diversification of host could have an influence on the differentiation of insects (Friberg, Schwind, & Roark, 2014; Friberg, Schwind, & Thompson, 2016; Matsubayashi, Ohshima, & Nosil, 2010; Singer, Ng, & Moore, 1991). Dendrolimus punctatus (Walker, 1985) distributed in subtropical China was adopted in our study to identify whether the genetic differentiation of host plants, caused by climate changes during the ice age, affects genetic variation of their predators, the phytophagous insects. Dendrolimus species (Lepidoptera: Lasiocampidae) are one of the most serious phytophagous pests worldwide and caused extensive forest damage (Dai et al., 2012; Zhao, Wu, Lv, Chen, & Lin, 1999; Zhang, Wang, Tan, & Li, 2003; Zhang, Li, Chen, & Zhang, 2004) (Figure 1). Dendrolimus punctatus is endemic to southern Asia and, in recent years, has become the most serious and economically damaging insect pest in the south China forests. Pinus massoniana, which is a typical warm‐temperate evergreen coniferous in south mainland China, is the main host plant of D. punctatus (Cai, 1995; Hou, 1987). Based on a phylogeographic analysis, P. massoniana experienced a recent expansion of its smaller populations during the Quaternary period (Ge et al., 2012). The increasing population density, which increased rapidly after a few generations, posed a great threat to forestry production. Consequently, great efforts were devoted to keep the size of population at a relatively low and stable level. Notably, low‐density populations are difficult to detect in the field, which makes it extremely arduous to collect samples.
Figure 1.

Photograph of Dendrolimus punctatus (Walker, 1985) (by Dr. Chong‐Hui Yang)
Here, we examined the genetic variation across the distribution areas of D. punctatus with the barcode fragment of the COI gene as well as two nuclear loci: ribosomal first internal transcribed spacer (rDNA ITS1) and second spacer (rDNA ITS2). Two different inherited molecular markers were included in this study: mtDNA marker (COI) represented maternal inheritance; the ITS fragments represented the biparental inheritance. In addition, these three molecular markers shared barcoding sequences well and proved to be excellent methods to help explain the interspecific relationship among the sibling species of D. punctatus (Dai et al., 2012). Nevertheless, although DNA barcoding has been widely used as a concept to facilitate biological identifications at the species level (Hebert, Cywinska, Ball, & deWaard, 2003), there has been limited use related to lower categories such as subspecies and populations (Huemer & Hebert, 2011; Valade et al., 2009). These lower categories, defined by evidence of geographical, morphological, and ecological criteria, can be potential or cryptic species (DeSalle, 2006). It would be particularly desirable to test whether these widely accepted interspecific barcodes could also be adopted as population identification. Although the typical DNA barcoding was not sufficient to identify geographical clusters within species (Hajibabaei, Singer, Hebert, & Hickey, 2007), the limited geographical isolation was observed between different regions (Rach, DeSalle, Sarkar, Schierwater, & Hadrys, 2008; Zhao et al., 1999). The success rate of barcoding at lower categories largely depends on the phylogeographic structure of the taxon (Zhang et al., 2003). Factors such as the geographic distribution of the populations, time and degree of isolation, effective population sizes, and particularly gene flow showed fundamental effects. Therefore, our present work seeks to address the following points:
to investigate the phylogeographical structure of the masson pine pest;
to test whether the demographic history of this moth corresponds to the “contraction‐expansion” mode similar to its host plant;
to explore the potential availability of population identification using the DNA barcode.
2. MATERIALS AND METHODS
2.1. Specimen sampling
The specimens of D. punctatus were collected as larvae, which were gathered with tweezers during the day. The larvae of D. punctatus displayed an aggregated distribution pattern. Hence, one larva of pine caterpillar was collected every 5 m. The sampling scheme, including a total of 236 specimens from 23 localities, covered the major geographic distribution of this species (Figure 2; Table 1). The specimens were collected in the natural forests. In order to preserve DNA sequence integrity, the larvae collected in natural forests were immediately placed in 95% ethanol and ultimately stored at 4°C. Voucher specimens were deposited at the Capital Normal University, Beijing, China.
Figure 2.

A map of the sampling sites and the geographic distribution of Dendrolimus punctatus mtDNA haplotypes. Pie charts show the proportion of mitotypes within each population, and colors represent different lineages. The numbers beside the circles represent population numbers listed in Table 1
Table 1.
Locations of populations of Dendrolimus punctatus sampled, sample sizes (N), frequencies of mtDNA haplotypes per population, and estimates of haplotype diversity (h), and nucleotide diversity (π) for mitotypes
| Pop. | Abbr. | Locality | Lat. (N) | Long. (E) | N | Nh | Haplotypes nos. | S | h (SD) | π in ‰ |
|---|---|---|---|---|---|---|---|---|---|---|
| 1 | GXLC | Luchuan, Guangxi | 22.19 | 110.16 | 6 | 4 | H6 (2). H11 (2). H13(1). H18 (1) | 2 | 0.867(0.129) | 1.93 |
| 2 | GXNN | Naning, Guangxi | 22.49 | 108.21 | 12 | 4 | H14(8). H15 (2). H16 (1). H17 (1) | 3 | 0.561(0.154) | 1.62 |
| 3 | GDDQ | Deqing, Guangdong | 23.15 | 111.77 | 8 | 5 | H 11(3). H22(2). H23 (1). H24 (1). H25 (1) | 3 | 0.857(0.108) | 2.37 |
| 4 | YNWS | Wenshan, Yunnan | 23.22 | 104.15 | 6 | 4 | H1 (1). H2 (3). H3 (1). H4 (1) | 5 | 0.8(0.172) | 3.51 |
| 5 | GXBS | Baise, Guangxi | 23.53 | 106.37 | 10 | 3 | H46 (1). H47 (5). H48(4) | 8 | 0.644(0.101) | 6.2 |
| 6 | GDXN | Xingning, Guangdong | 24.15 | 115.73 | 4 | 2 | H2(2). H7(2) | 1 | 0.667(0.204) | 1.13 |
| 7 | YNSL | Shilin, Yunnan | 24.45 | 103.16 | 6 | 2 | H2 (4). H41 (2) | 3 | 0.533(0.172) | 3.4 |
| 8 | FJSH | Shanghang, Fujian | 25.02 | 116.25 | 9 | 3 | H38 (5). H39 (1). H40 (3) | 2 | 0.639(0.126) | 1.23 |
| 9 | GZXY | Xingyi, Guizhou | 25.05 | 104.54 | 5 | 3 | H 6(1). H19 (3). H20 (1) | 12 | 0.7(0.218) | 8.16 |
| 10 | FJWP | Wuping, Fujian | 25.10 | 116.10 | 11 | 6 | H11 (3). H18 (2). H22 (3). H35 (1). H36 (1). H37 (1) | 4 | 0.873(0.071) | 2.7 |
| 11 | GXQZ | Quanzhou, Guangxi | 25.55 | 111.04 | 20 | 8 | H5 (1). H6 (2). H8 (8). H9 (2). H10 (1). H11 (4). H12 (1). H13 (1) | 7 | 0.811(0.071) | 4.87 |
| 12 | YNYR | Yongren, Yunnan | 26.03 | 101.40 | 12 | 4 | H4 (3). H5 (1). H6 (7). H7 (1) | 3 | 0.636(0.128) | 1.49 |
| 13 | GZGY | Guiyang, Guizhou | 26.38 | 106.37 | 8 | 4 | H5 (1). H6 (3). H18 (1). H19 (3) | 11 | 0.786(0.113) | 102 |
| 14 | GZHZ | Hezhang, Guizhou | 27.07 | 104.43 | 7 | 3 | H6 (3). H11 (3). H21 (1) | 3 | 0.714(0.127) | 1.94 |
| 15 | JXYC | Yichun, Jiangxi | 27.47 | 114.23 | 12 | 5 | H5 (1). H6 (1). H22 (4). H23 (4). H45 (2) | 5 | 0.803(0.078) | 3.27 |
| 16 | JXGA | Gaoan, Jiangxi | 28.25 | 115.22 | 11 | 6 | H2(4). H3(1). H41(2). H42(2). H43(1). H44(1) | 5 | 0.855(0.085) | 3.83 |
| 17 | ZJJS | Jiangshan, Zhejiang | 28.44 | 118.37 | 10 | 4 | H27(3). H28(2). H29(4). H30(1). | 6 | 0.778(0.091) | 4.72 |
| 18 | ZJQX | Quxian, Zhejiang | 29.03 | 119.11 | 11 | 4 | H1(1). H2(6). H3(3). H26(1) | 3 | 0.673(0.123) | 1.48 |
| 19 | ZJLX | Lanxi, Zhejiang | 29.12 | 119.28 | 9 | 6 | H11(2). H18(1). H31(3). H32(1). H33(1). H34(1) | 8 | 0.889(0.091) | 6.8 |
| 20 | SCLX | Luxian, Sichuan | 29.15 | 105.38 | 4 | 1 | H2(4) | 0 | 0 | 0 |
| 21 | SCHY | Huaying, Sichuan | 30.38 | 106.77 | 8 | 5 | H6(3). H9(1). H22(2). H23(1). H37(1) | 5 | 0.857(0.108) | 3.46 |
| 22 | AHQS | Qianshan, Anhui | 30.57 | 116.34 | 12 | 3 | H2(10). H3(1). H46(1) | 2 | 0.318(0.164) | 0.57 |
| 23 | HBCD | Chengde, Hebei | 40.59 | 118.53 | 35 | 3 | H49(15). H50(8). H51(12) | 2 | 0.666(0.032) | 1.65 |
Voucher specimens are deposited in the Herbarium of Capital Normal University (CNU).
2.2. DNA extraction, PCR amplification, and sequencing
DNA samples were isolated from the legs of adult individuals using DNeasy Blood and Tissue kit (Biomed) following the manufacturer's protocol. Sequences of mitochondrial gene COI and nuclear ITS were amplified using rTaq (Takara). The same PCR primers and amplification reaction of Dai et al. (2012) were used in our study. The amplification products were subjected to electrophoresis in a 2% (w/v) agarose gel in TAE buffer (0.04 M Tris–acetate, 0.001 M EDTA) to check whether the amplification reactions were successful. Then, the amplification products were used for sequencing, which was performed with an ABI3130 sequencer at Biomed Biotechnology Co., Ltd. All sequences have been deposited in GenBank (accession numbers: KF366914–KF367149 for COI, KF367150–KF367271 for ITS1, and KF367272–KF367452 for ITS2), and the COI barcodes were also submitted to the BOLD system (accession numbers: GBGL14669–GBGL14904).
2.3. Phylogenetic analysis and network reconstruction
The raw DNA sequences were all checked manually and aligned with software MUSCLE (Edgar, 2004). Aligned COI sequences were translated into amino acid sequences using the MEGA program (Kumar, Tamura, & Nei, 2004). The phylogenetic relationships within D. punctatus were reconstructed using maximum likelihood (ML) inference and Bayesian inference (BI). Two specimens from species Dendrolimus superans (Butler, 1877) were used as outgroups. The best‐fit model of nucleotide substitution was selected from 88 models using the Akaike information criterion (AIC) with jModelTest 2 (Darriba, Taboada, Doallo, & Posada, 2012). The ML analysis was conducted using the program RAxML v.7.0.4 with 1,000 bootstraps conducted (Alexandros, 2006). The GTR+G model was used for all genes. The Bayesian analysis was performed using MrBayes v3.1.2 (Ronquist & Huelsenbeck, 2003). The MCMC analysis was run for 10,000,000 generations, following a burn‐in series of 1,000 generations. Haplotype networks for COI sequence and each ITS dataset were constructed to better visualize the reticular relationships of D. punctatus. The median‐joining (MJ) haplotype networks were constructed to draw an unrooted network with Network 5 (Fluxus Technology Ltd.) based on COI gene, as well as ITS1 and ITS2.
2.4. Population genetic analysis
All analyses were executed separately for the COI gene and the ITS fragments. We used DnaSP 5.10 (Librado & Rozas, 2009) to assess population genetic diversity, including the number of sequences (N), number of haplotypes (Nh), haplotype diversity (h), and nucleotide diversity (π). The program PERMUT (available at www.pierroton.inra.fr/genetics/labo/Software/) was applied to estimate the average gene diversity within a population (H S), total gene diversity (H T), and between‐population divergence (G ST, N ST) with 1,000 permutations tests.
Analysis of molecular variance (AMOVA), the average values of population differentiation (F ST), and Mantel test were all calculated to detect the population structure with Arlequin V3.5 software (Excoffier & Lischer, 2010). The significance was tested using 10,000 permutations. The spatial genetic pattern was examined by spatial analysis of molecular variance (SAMOVA) using SAMOVA V1.0 (Dupanloup, Schneider, & Excoffier, 2002).
2.5. Demographic history analysis
To evaluate the population history of D. punctatus, we calculated Tajima's D (1989) and Fu's Fs (1997) neutrality test statistics based on the mitochondrial DNA dataset and calculated the significance with 10,000 simulations (Rogers & Harpending, 1992; Schneider & Excoffier, 1999). Mismatch distribution analysis was also conducted to detect the population expansion of the D. punctatus with Arlequin V3.5 software (Excoffier & Lischer, 2010); moreover, 1,000 parametric bootstrap replicates were used to test the suitability of observed mismatch distributions to the theoretical distribution under a sudden expansion model (Rogers & Harpending, 1992). When a prominent expansion event was identified, the parameter value for the mode of the mismatch distribution (τ) was applied to estimate time since expansion (in generations) using the equation t = τ/2u (Rogers, 1995). In this study, u was calculated as u = μ × k × g, where μ represents the number of substitutions per site per year (s s−1 y−1), k represents the average DNA sequence length, and g represents the generation time in years.
Bayesian skyline plots (BSPs) implemented in BEAST v2.0 were also used to evaluate the timing of the population expansion (Bouckaert et al., 2014). For both COI and ITS fragments, the program was run with three independent runs steps (30 million simulations), and we discarded the burn‐in of the first 20% steps. The evolutionary models using AIC were selected for COI (GTR) and ITS1 (TVMef+I) using jModeltest2 (Darriba et al., 2012). The proposed conventional mutation rates for insect mitochondrial COI gene 2.3% per million years were used to estimate coalescent time (Brower, 1994). After multiple runs, similar results and convergence to stationarity were reached with effective sample size (ESS) of at least 400. The Bayesian skyline plot (BSP) was constructed for each data set using the program TreeAnnotator included in BEAST v 2.0 (Bouckaert et al., 2014).
2.6. Ecological niche modeling
The ecological niche model was a useful approach to visualize the population demographic history of D. punctatus during the Quaternary, especially LGM. Climatic data from much earlier glaciation could not be obtained; hence, we used present and LGM climatic data. If the distribution pattern of D. punctatus was related to historical climatic changes, the distribution range would be expected to have obvious contracted during the LGM period (Carstens & Richards, 2007).
A total of 107 occurrence records were collected for niche modeling analysis, including 23 records from the specimens in this study and records from published documents. Bioclimatic variables were downloaded from the WordClim website (V1.4; http://www.worldclim.org/). We compared the suitable habitats and potential distributions of D. punctatus in two periods: the present day and the LGM. The environmental layer of the present and LGM were built at a resolution of 2.5 min, and the LGM dataset was based on the Community Climate System Model (CCSM). A distribution was generated using 15 climatic variables from the WorldClim database (all bioclimatic variables except for BIO7, 8, 17, and 18) for the current climate, with an estimate based on other distribution localities that were collected (Hijmans, Cameron, Parra, Jones, & Jarvis, 2005). The ecological niche model was constructed using the maximum entropy machine learning algorithm implemented in MAXENT (V3.3.3k; Phillips, Anderson, & Schapire, 2006), which proved to perform well compared with other methods, especially those with relatively smaller sample sizes. Analysis with default program settings (cumulative output, convergence threshold (1 of iterations (500)) was executed in ten replicates with default settings; 70% of the sites were set to train the model, and 30% of the sites were set to test the model predictions. Model performance was evaluated by both the area under the curve (AUC) of the receiver operating characteristic (ROC) plot and the binary omission rate over ten replicate runs. Area under the curve is a composite measure of model performance, which can equally weigh the omission error and commission error, and has an index of suitability between 0 and 1. The value of AUC that is >0.5 indicates the predicted results of the model are better than those predicted stochastically, and an AUC > 0.9 usually indicates excellent predictive power (Ye, Zhu, Chen, Zhang, & Bu, 2014).
2.7. Populations identifying with distance‐based barcoding methods
The distance between intraspecific variation (the DNA barcoding gap) is considered an important criterion in DNA barcoding. To explore the feasibility of populations that identify within D. punctatus, DNA barcoding gap analysis was performed based on distance‐ and character‐based methods (Dai et al., 2012). The “best close match” (BCM) (Meier, Shiyang, Vaidya, & Ng, 2006) and the minimum distance (MD) (Zhang et al., 2012) are two distance‐based methods that proved to be effective in species identification in DNA barcoding studies. To examine whether the correct local populations could be identified with these methods, we therefore performed the two protocols with “single‐sequence‐omission” or “leave‐one‐out” simulations. Here, we removed one sequence at a time and used it as a query, with all other sequences remaining as the reference database. We performed 500 random replications for each dataset. Moreover, several species of Dendrolimus, D. superans, D. kikuchii, and D. houi were chosen for interspecific level identification. We fully investigated success rates of barcoding identification at both interspecific and intraspecific levels with each single barcode, with their corresponding 95% confidence intervals (CIs) computed using equation (20) from Zhang et al. (2012). The BCM and MD were performed following the protocol of the program TaxonDNA and package MD (Meier et al., 2006; Zhang et al., 2012).
3. RESULTS
3.1. Genetic variation analyses
A total of 45 polymorphic sites were detected in the COI dataset, which contained 43 parsimony informative sites. These polymorphic sites defined 51 unique haplotypes (H1–H51) from the 236 sampled individuals of D. punctatus, 18 of which were found in single individuals. A quarter of haplotypes (15 of 51) were unique to single populations, while others were shared (Table 1). H2 was the most abundant haplotype shared by 33 individuals, mainly distributed in the southwest region of China, followed by H6, which also occurring in six populations. Overall nucleotide diversity was π = 0.0075 and varied across populations (ranging from 0.0011 to 0.0082). Within all populations, GZXY (see population abbreviation in Table1) had the highest π value (Table 1). Haplotype diversity was h = 0.952 (ranging from 0.000 to 0.889) at the species level, and ZJLX (see population abbreviation in Table1) had the highest h value (Table 1). Within‐population gene diversity (H S) was much lower than total gene diversity (H T) (0.694 and 0.942, respectively, Table 2).
Table 2.
Estimate of nucleotide diversity (Pi), haplotype diversity (Hd), total gene diversity (H T), average gene diversity within populations (H S), interpopulation differentiation (G ST), and the number of substitution types (N ST) (mean + SE in parentheses) as indicators of mtDNA haplotypes and ITS ribotypes diversity
| Pi | Hd | H T | H S | G ST | N ST | |
|---|---|---|---|---|---|---|
| Mitochondrial DNA | ||||||
| Dendrolimus punctatus | 0.00751 | 0.952 | 0.947 (±0.0204) | 0.692 (±0.0424) | 0.269 (±0.0383) | 0.580 (±0.0486)** |
| South Region | 0.00858 | 0.912 | 0.916 (±0.0465) | 0.580 (±0.1001) | 0.367 (±0.0945) | 0.587 (±0.0829)* |
| Southeast Region | 0.00643 | 0.942 | 0.960 (±0.0203) | 0.743 (±0.0440) | 0.226 (±0.0415) | 0.527 (±0.0597)** |
| Internal Transcribed Spacer 1 (ITS1) | ||||||
| Dendrolimus punctatus | 0.00838 | 0.773 | 0.743 (±0.0649) | 0.595 (±0.0596) | 0.199 (±0.0635) | 0.373 (±0.0783)** |
| South Region | 0.00853 | 0.900 | 0.550 (±0.0808) | 0.547 (±0.0933) | 0.006 (±0.0447) | 0.086 (±0.0382)** |
| Southeast Region | 0.00688 | 0.630 | 0.916 (±0.0308) | 0.735 (±0.0638) | 0.197 (±0.0756) | 0.457 (±0.0960)** |
| Internal Transcribed Spacer 2 (ITS2) | ||||||
| Dendrolimus punctatus | 0.00277 | 0.818 | 0.840 (±0.0350) | 0.587 (±0.0496) | 0.301 (±0.0633) | 0.331 (±0.0763)NS |
| South Region | 0.00284 | 0.822 | 0.882 (±0.0453) | 0.517 (±0.0915) | 0.414 (±0.1015) | 0.440 (±0.1027)NS |
| Southeast Region | 0.00268 | 0.795 | 0.801 (±0.0526) | 0.666 (±0.0571) | 0.169 (±0.0775) | 0.165 (±0.0789)NS |
Abbreviation: NS, not significant.
p < 0.05, significant.
N ST is significantly different from G ST (p < 0.01).
p > 0.05, not significant.
The length of aligned ITS1 sequences was 670 bp including 69 polymorphic sites. Thirty‐eight different ITS1 haplotypes (ribotypes1) were recovered (R1–R38), two of which occurred in single populations separately. Meanwhile, the other haplotypes were shared by more than two populations. The most widespread ribotypes1 was R26 occupied by 19 populations. Ribotype1 diversity was estimated to be h = 0.773 at the species level, ranging from 0.000 to 1.000 in different populations. At the species level, nucleotide diversity was 0.008 (p = 0.022), but it varied across populations, ranging from 0.000 to 0.0189, with the GDXN (see population abbreviation in Table1) population having the highest nucleotide diversity. Similar results were detected in the ITS2 sequences dataset including 22 polymorphic sites in 181 individuals. A total of 29 different ITS2 haplotypes (ribotypes2) were defined (N1–N29). Overall nucleotide diversity was 0.0028, and haplotype diversity was 0.818 (ranging from 0.167 to 1.000). N15 was the most popular ribotypes2, which was found in 16 populations of the southern region. Similar results were detected comparing with the mitochondrial dataset. Within‐population gene diversity (H S) was lower than total gene diversity (H T) (0.156 and 0.879, respectively; Table 2); however, only two populations harbored single ribotype for the ITS1 dataset, and only one population for ITS2 sequences.
3.2. Phylogenetic relationships and lineages divergence
Phylogenetic analyses were performed using the ML and BI methods. The GTR+G model was selected by COI and ITS datasets. Based on the analysis of mitochondrial sequences, the topology of phylogenetic trees based on two methods were similar (Figure 3a). The haplotypes of D. punctatus were split into several discrete clades. The monophyly of D. punctatus was well supported. These 51 haplotypes were clustered into three multiple haplotype clades (Clades I, II, and III) and two monotypic clades (Clades IV and V) (Figure 3a). The haplotype network (Figure 3b) displayed a more detailed relationship among 51 haplotypes. The populations located in the southwest region harbored four haplotype clusters, and only two populations possessed single haplotype clusters. The haplotypes nested in Clades I and II were mostly found in the eastern part of China (Figure 2).
Figure 3.

Phylogenetic relationships obtained by analysis of mtDNA haplotypes. (a) ML tree with numbers above the branches indicating bootstrap values greater than 50% for ML analysis. (b) NETWORK‐derived genealogical relationship. The sizes of the circles in the network are proportional to the observed frequencies of the haplotypes. The small black bars represent mutation steps, and the gray dots represent missing haplotype. For both subfigures, different colors represent different haplotype clusters
For the ITS1 dataset, the topological structure of the phylogenetic trees, reconstructed by two methods, were similar (Figure 4a). All 38 ribotypes were divided into two clades, in which there were 23 ribotypes1 formed a well‐support clade (Clade I). The ribotype1 network (Figure 4b) reflected similar relationships with more details, and the obvious star‐like structure network was generally interpreted as a sign that the population underwent population expansion. R26 has the highest haplotype frequency (19 of 23). Results based on ITS2 fragment analysis agreed with ITS1. However, due to the relatively few polymorphic sites, the distinct topological structure was not detected based on both ML and BI phylogenetic trees (Figure 5a). Future MJ network tests showed that N15 was in the center position, which is in line with the wide distribution of N15 in 18 out of 23 populations (Figure 5b).
Figure 4.

Phylogenetic relationships obtained by analysis of ITS1 ribotypes. (a) ML tree with numbers above the branches indicating bootstrap values greater than 50%. (b) NETWORK‐derived genealogical relationship
Figure 5.

Phylogenetic relationships obtained by analysis of ITS2 ribotypes. (a) ML tree with numbers above the branches indicating bootstrap values greater than 50%. (b) NETWORK‐derived genealogical relationship
3.3. Population structure analysis
Significant genetic differentiation was identified in D. punctatus samples based on both mitochondrial and nuclear sequences (Table 1). Further examinations using permutation tests showed a prominent higher value of N ST than G ST (p < 0.01), indicating a strong phylogeographic structure in D. punctatus. The Spatial AMOVA (SAMOVA) method represents a useful method to define partitions of sampling sites that are maximally differentiated from each other without any priori assumption of population structure. However, the analysis did not clearly reveal one single group of maximally differentiated populations, as F CT values increased progressively with increasing values of K (F CT values ranged from 0.217 to 0.344 for COI, from 0.313 to 0.447 for ITS1, and from 0.193 to 0.499 for ITS2); however, the first level of divergence (K = 2) revealed a well‐defined group including those populations from the east region of China with a high frequency of mitochondrial haplotype Clade I, which were differentiated from the remaining populations. The composition of the groups detected by SAMOVA that had increasingly larger values of K mainly corresponded to the geographical distribution of haplotypes (Figure 2). Consistent results of two distinguished groups were confirmed by ITS1 sequence analyses. Thus, we divided the 23 populations collected into two geographic groups: one for the eastern of China, and the other for the southwest of China. Pairwise F ST was all significant (p < 0.01) in 1,000 permutation tests between two geographic regions: 0.393 for COI, 0.363 for ITS1, and 0.523 for ITS2, respectively. This suggested high genetic differentiation between these two geographic groups.
3.4. Demographic history of D. punctatus
As previously mentioned, a star‐like structure in a network analysis is generally interpreted as a sign of population expansion/rapid growth (Rogers & Harpending, 1992). The haplotype network results indicated historical population expansion in the masson pine moth history. This finding was further supported by the mismatch distribution analysis. Based on COI, ITS1, ITS2, or combined ITS datasets, the null hypothesis that showed sudden population expansion historically existed could not be rejected (p = 0.427 for COI; p = 0.049 for ITS1; p = 0.409 for ITS2; p = 0.752 for the combined ITS1 and ITS2; Figure 6). However, the raggedness indices and observed variance (SSD) were not significantly different from the expectation that suggested strong and wide range gene flow occurred in the population demographic history. In addition, Tajima's D and Fu's Fs were also significantly negative (Table 3), which indicated that the population of D. punctatus underwent rapid expansion. The estimated time of this expansion was 0.232 Mya (Table 3). The population expansion of haplotype Clade I and Clade II were also detected based on mismatch distribution analysis, as well as the Bayesian population dynamic analysis (Table 3). The results obtained from the Bayesian population dynamic analysis for all individuals are shown in Figure 7, which indicates that the population experienced conspicuous expansion, in addition to one obvious bottleneck that occurred about 0.02 Mya. For the ITS loci, recent population expansion was inferred at 0.025 Mya (ITS1) and 0.17 Mya (ITS2) (Figure 7).
Figure 6.

Mismatch distribution analysis based on (a) COI, (b) ITS1, (c) ITS2, and (d) the combination of ITS1 and ITS2
Table 3.
Values for τ, SSD, and RAG (with probability p values) from mismatch analysis of mitotype variation, values for Tajima's D and Fu's F S (with p values)
| Groups | Mismatch distribution | Neutrality tests | ||||||
|---|---|---|---|---|---|---|---|---|
| τ(t) | t1–t2 (Mya) | SSD (p value) | RAG (p value) | Tajima'D (p value) | Fu's F S (p value) | |||
| Dendrolimus punctatus | 4.826 | 0.232–0.358 | 0.003 (0.493) | 0.006 (0.665) | −0.180 (0.561) | −17.827 (0.001)** | ||
| Western region | 2.351 | – | 0.014 (0.381) | 0.024 (0.538) | 0.686 (0.789) | −4.083 (0.100)NS | ||
| Eastern region | 5.078 | 0.244–0.375 | 0.004 (0.346) | 0.015 (0.572) | −0.476 (0.739) | −25.080 (0.000)** | ||
| Clade I | 3.262 | 0.157–0.242 | 0.001 (0.907) | 0.012 (0.962) | −0.281 (0.459) | −6.351 (0.024)* | ||
| Clade II | 1.117 | 0.057–0.083 | 0.004 (0.537) | 0.062 (0.117) | 0.203 (0.108) | −6.620 (0.001)** | ||
| Clade III | 1.839 | – | 0.006 (0.712) | 0.051 (0.151) | 1.123 (0.217) | −1.619 (0.076)NS | ||
| Clade V | 0.286 | – | 0.0004 (0.214) | 0.265 (0.345) | −1.006 (0.201) | −0.095 (0.369)NS | ||
Related value of Clade IV was not calculated due to insufficient individuals (2 sequences).
Abbreviations: g, estimate of population exponential growth rate; NS, not significant; RAG, the Harpending's raggedness index; SSD, sum of squared deviations; t1, time in million years derived from 0.0115 s s−1 y−1; t2, time in million years derived from 0.0177 × 10⁻⁶ s s−1 y−1; τ, time in number of generations elapsed since a sudden expansion episode.
p < 0.05.
p < 0.01.
p > 0.05.
Figure 7.
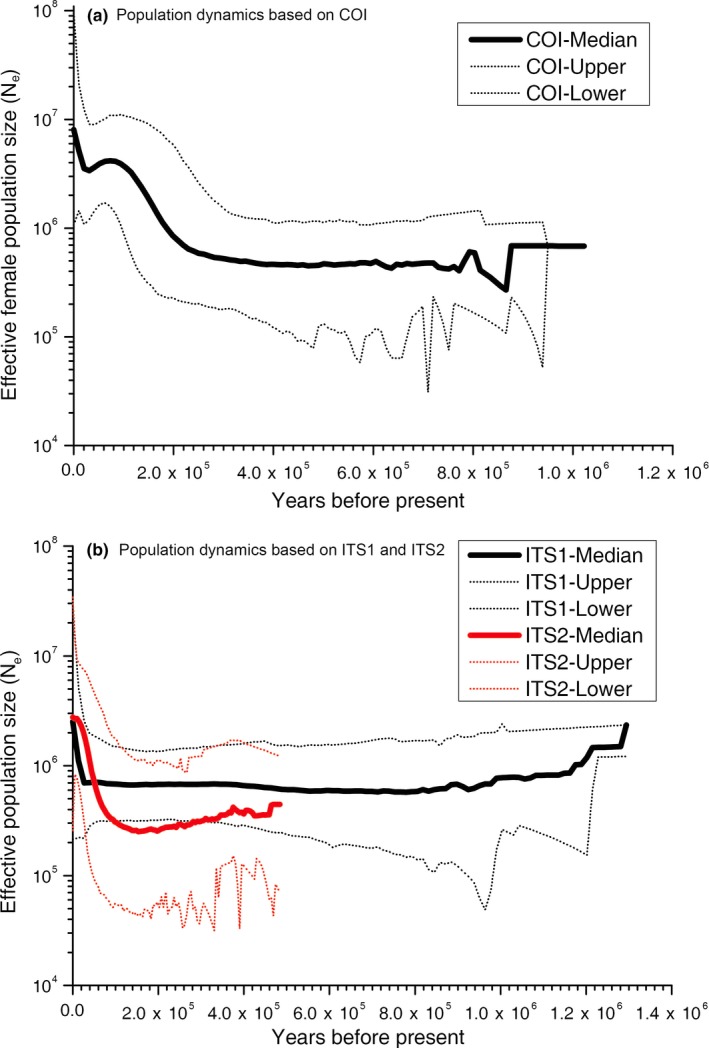
Population dynamic analysis of Dendrolimus punctatus Bayesian skyline plots for (a) COI gene and (b) ITS loci
3.5. Species distribution modeling
For this study, ecological niche modeling was used to explore the relationships between genetic diversity and possible glacial refugia. A species distribution model for D. punctatus was built and the average AUC value was 0.917, which is considered to correspond to a useful predictive model. Under the present climatic conditions, the model revealed high climatic habitat suitability for D. punctatus across the south region of China. For the predicted suitable distribution, there was a significant difference between the present and LGM periods. The distribution area was contracted to the southern and southeast parts of China in LGM; therefore, the two lineages were isolated in the glacial periods (Figure 8). Interestingly, the results also revealed that the southern and southwest regions in China may have served as feasible refugia during the maximum of the Pleistocene glaciations. These findings further support the conclusions drawn by population demographic history analysis.
Figure 8.

Ecological niche modeling for Dendrolimus punctatus during the present day (a) and the LGM (b). Different colors correspond to different fitting indices with low in red and high in green
3.6. DNA barcoding in population identification
In general, a large DNA barcoding gap makes species/population discrimination possible and simple. Conversely, small or negative DNA barcoding gaps blur species/population boundaries and hamper species/population assignation in DNA barcoding. The COI barcode showed an average between‐population K2P distance of 0.013, which was about 1.78 times larger than the mean within‐population distance. However, no positive DNA barcoding gap for the COI barcode (Figure 9a) was detected, indicating the difficulty of distinguishing subpopulations of this species. Both ITS1 and ITS2 genes presented slightly larger between‐population genetic variation (0.0085 for ITS1; 0.0029 for ITS2) compared with genetic variation within population (0.0077 for ITS1; 0.0018 for ITS2). The former was roughly 1.1 (1.1038) and 1.6 (1.6111) times larger than the latter. Similarly, there were no positive barcoding gaps or a blurred discriminations among subpopulations with ITS1 and ITS2 (Figure 9c and e).
Figure 9.

Interspecific and intraspecific DNA barcoding success rates of Dendrolimus punctatus and related species. (a) Intraspecific barcoding gap analysis based on COI gene. Blue and red histograms represent distributions of between‐ and within‐population genetic variations (K2P distance), respectively, with red fitted normal distribution curve each. (b) Interspecific and intraspecific barcoding success rates based on COI barcode with MD and BCM methods; (c) Intraspecific barcoding gap analysis based on ITS1 gene; (d) Interspecific and intraspecific barcoding success rates based on ITS1 with MD and BCM methods. (e) Intraspecific barcoding gap analysis based on ITS2 gene; (f) Interspecific and intraspecific barcoding success rates based on ITS2 with MD and BCM methods
Significant differences in success rates between interspecific and intraspecific barcoding identification were detected with MD and BCM methods (Figure 9b, d, and f). Intraspecific success rates were significantly smaller than interspecific ones. For instance, based on the COI gene, mean intraspecific success rate was 51.20% with a 95% confidence interval (CI) of 46.83%–55.55% (MD), 35.40% (95% CI: 31.33%–39.68%) (BCM), while corresponding interspecific success rates achieved values of 97.40% (95% CI: 95.60%–98.47%) and 96.60% (95% CI: 94.62%–97.87%), respectively (Figure 9b). Significantly smaller success rates were detected for nuclear markers ITS1 and ITS2, which obtained a low success rate of 25.20% (95%CI: 21.59%–29.18%) and 13.20% (95%CI: 10.51%–16.44%), respectively. The MD method (Figure 9d and f) reflected the difficulties in local population DNA barcoding.
4. DISCUSSION
4.1. Genetic diversity and population structure in D. punctatus
Our survey of mtDNA variation of D. punctatus detected several phylogeographical groups within this hazardous insect across the south region of China. This finding suggests that in the past, the distribution of this species was fragmented into several isolated refugia, where the genetic divergence of mtDNA took place. However, due to the relative limited informative sites, no significant phylogeographical pattern was revealed for ITS2 dataset.
The mtDNA diversity was relatively high (H T = 0.947) in D. punctatus, which might reflect a longer evolutionary history and the wide distribution of this species. However, the AMOVA analysis based on COI dataset revealed genetic differentiation among all 23 populations and most variation was from within populations (47.75%), followed by variation among groups (28.74%) (Table 4). Consequently, most of the species’ diversity was due to population divergence in which distinct phylogeographical structure signals were detected (N ST = 0.580 > G ST = 0.269, p < 0.01).
Table 4.
Analysis of molecular variance (AMOVA) conducted on mtDNA haplotypes variation and ITS ribotypes for within and among populations of Dendrophilus punctatu
| Source of variation | df | Mitochondrial DNA | ITS1 | ITS2 | |||||||||||
|---|---|---|---|---|---|---|---|---|---|---|---|---|---|---|---|
| SS | VC | PV (%) | Fixation index | df | SS | VC | PV (%) | Fixation index | df | SS | VC | PV (%) | Fixation index | ||
| Among regions | 1 | 254.823 | 1.019 | 28.74 | F SC = 0.565** | 1 | 136.149 | 1.269 | 30.31 | F SC = 0.282** | 1 | 89.804 | 0.548 | 27.34 | F SC = 0.486** |
| Among populations | 21 | 220.384 | 0.956 | 23.51 | F ST = 0.554** | 21 | 126.465 | 1.238 | 25.97 | F ST = 0.363** | 21 | 107.660 | 0.656 | 37.02 | F ST = 0.524** |
| Within populations | 213 | 386.187 | 1.782 | 47.75 | F CT = 0.217* | 99 | 201.902 | 1.645 | 43.72 | F CT = 0.313* | 158 | 105.724 | 0.599 | 35.64 | F CT = 0.193NS |
| Total | 235 | 861.394 | 3.757 | 121 | 464.516 | 4.152 | 180 | 303.188 | 1.803 | ||||||
Abbreviations: df, degrees of freedom; F CT, correlation within groups relative to total.; F SC, correlation within populations relative to group; F ST, correlation within populations relative to total; NS, not significant; PV, percentage of variation; SS, sum of squares; VC, variance components.
p < 0.05, significant.
N ST is significantly different from G ST (p < 0.01).
p > 0.05, not significant.
Further tests carried out with ITS1 were corroborated with our COI findings, and distinct phylogeographic signals (N ST > G ST, p < 0.01) were found in entire distribution regions, including western and eastern regions. A relatively low value of total diversity was recorded for ITS dataset in D. punctatus (ITS1: H T = 0.743, ITS2: H T = 0.840), which was lower than the mitochondrial dataset, largely due to reduced genetic divergence (ITS1: G ST = 0.199, N ST = 0.373; ITS2: G ST = 0.331, N ST = 0.301), as within‐population diversity was also decreased compared with mtDNA (H S = 0.595 for ITS1 and H S = 0.587 for ITS2). The primary cause of this discrepancy is due to the different modes of inheritance, maternal for mtDNA and biparental for ITS. The latter method leads to higher levels of gene flow. Compared with the protein‐coding COI region, the noncoding ITS marker was more sensitive at detecting gene flow among interbreeding populations. Similar inconsistencies were shared in many other Lepidopteran insets, for example, Biston suppressaria (Cheng, Jiang, Xue, et al., 2016; Cheng, Jiang, Yang, et al. 2016), Apocheima cinerarius (Liu et al., 2016), Biston panterinaria (Cheng, Jiang, Xue, et al., 2016; Cheng, Jiang, Yang, et al., 2016), and Hyles euphorbiae (Mende & Hundsdoerfer, 2013).
The AMOVA analysis of the mtDNA data revealed that within‐population variation was greater than among‐region variation. Nevertheless, D. punctatus is split into two major genetic lineages based on the analysis of mtDNA and ITS1 (F CT = 0.127 and 0.313, separately) (Table 4). This phenomenon could be explained as repeated population expansion and contraction caused by climate oscillations during the ice age, which resulted in lineage differentiation and limited gene flow. Physical barriers and ecological climate factors usually played a key role in obstructing gene flow among populations (Fjeldså, Bowie, & Rahbek, 2012). Although subtropical China has never been covered by extensive ice sheets during the ice age, iterative alternation of glacial and interglacial periods particularly caused distribution changes of both plants and animals (Liu, 1988; Qiu et al., 2011). Continuous and intensive tectonic activities had already begun in subtropical China during the Miocene and Pliocene (Webb & Bartlein, 1992), which made a great effort in shaping the distribution and differentiation of local organism. The northeast–southwest trending mountain ridges in subtropical China, such as Mt Wu, Mt Xuefeng, and Mt Wuyi, acted as barriers against the inflow of cold air from the northwest and maintained warm moist air coming from the Pacific, resulting in a humid climate in the eastern region and relative arid environment in the southwest. Moreover, the Qinghai‐Tibetan Plateau (QTP) and Mt Hengduan obstructed the dampness from the Indian Ocean, which further exacerbated the drought in this region. Mt Xuefeng also acted as a protective barrier against different climate environments on the eastern edge of the Yungui Plateau (YGP) (Holt et al., 2013). Restricted gene flow between the northwestern and eastern lineages was likely to be affected by these ridges. These mountains were important faunal dividing criterions in subtropical China. Similar geographical separations have been reported in many pervious researches, including the Leucodioptron canorum (Li et al., 2009), Squalidus argentatus (Yang et al., 2012), and Microvelia horvathi (Ye et al., 2014).
Meanwhile, present limited gene flow between southwest and east regions was also caused by the decreased ability of long‐distance dispersal by D. punctatus (Hou, 1987). As a typical phytophagous insect with intermediate mobility, D. punctatus exhibited a steep genetic decline with distance. The populations around the distributional center tended to have higher levels of genetic variations than the peripheral ones (Table 1; Figure 2). High genetic diversity in the center of the range of distribution reflected that the gene flow was strong among closely situated populations, which apparently was due to its ability to disperse in nearby areas. Geographic barriers such as Mt Wu, Mt Xuefeng, and Yungui Plateau (YGP) weakened the population diffusion and gene flow of D. punctatus, especially between the southwest and east regions.
4.2. Pleistocene range expansion and potential refugia of D. punctatus
High polymorphism detected in the D. punctatus with mtDNA and ITS may reflect the wide distribution of this forest pest in southern China, with large and relatively stable population sizes. This was compared with other pine pests distributed in Europe (e.g., Dendrolimus sibiricus, Dendrolimus pini, and Dendrolimus sibiricus), which experienced drastic reduction in population size due to the coverage of ice sheet during the Quaternary (Kononov et al., 2016; Mikkola & Ståhls, 2008).
Both our phylogenetic and network analyses showed that D. punctatus have experienced population expansion in subtropical China. According to mismatch distribution and Bayesian population dynamic analysis based on the mtDNA dataset, the population expansion started at ca. 0.23 Mya. Cui et al. (2011) reported a detailed partition criterion of Quaternary glaciations in China and concluded that six major glaciations occurred since Wangkun Glaciation (0.7–0.5 Mya). The expansion of D. punctatus initiated at the interglacial period of Guxiang Glaciation (Penultimate Glaciation) (also known as MIS7). During the interglacial periods of Penultimate Glaciation, populations could be effectively preserved in the mountainous areas of southern China. In addition, D. punctatus is one of the most serious and economically damaging insect pests, which have the genetic characteristics of population outbreak initiated by high temperature and drought (Zhang et al., 2004). The interglacial periods provide feasible climate conditions for the population outbreak and allow the maintenance of relatively large population sizes, thus retaining high genetic diversity. Interestingly, the event of demographic bottlenecks was detected based on the Bayesian skyline plot analysis of mtDNA dataset. This sudden population shrink occurred at ca. 0.02 Mya, which belong to the LGM period.
Dendrolimus punctatus is a typical phytophagous insect, in which its patterns of populational distribution and dynamics have significant correlation not only with the meteorological factors but also its host plants. Although the main host plant of D. punctatus is the masson pine, P. massoniana and its caterpillars have been reported to feed on other conifers, such as Pinus thunbergii, Pinus kwangtungensis, and Pinus taeda (Cai, 1995; Hou, 1987). The extensive hilly areas of subtropical China (especially between 22°N and 34°N) provide advantages to harbor temperate deciduous forests and coniferous (Yu et al., 2000). Many researchers have argued that lots of local plant species experienced long‐term fragmentation and refugial survival, such as Cathaya argyrophylla (Pinaceae) and Eurycorymbus cavaleriei (Sapindaceae), and several postulating separate refugia (such as Mts Dayao, East Yungui Plateau, and Mts Nanling) in subtropical China (Qiu et al., 2011; Wang, Gao, Kang, Lowe, & Huang, 2009). In addition, clear phylogeographic histories of P. kwangtungensis (Pinaceae), a closely related species of the host plant P. massoniana, were demonstrated among group F ST differentiation, suggesting that Yungui Plateau and the Mts Nanling were a major refugium (Tian, López‐Pujol, Wang, Ge, & Zhang, 2010). Furthermore, more recent studies have confirmed that P. massoniana also existed in multiple glacial refugia fostering populations with high genetic diversity (Ge et al., 2012; Zhou et al., 2010). The high genetic variation of D. punctatus in the southwest region is an alternative explanation for the retention of ancestral polymorphisms. A similar genetic divergence pattern was also detected in our study. The populations form Yungui plateau (GZXY and GZHZ, see population abbreviation in Table1) and Mts Guangzhou Province (FJSH, see population abbreviation in Table1) harbored haplotypes from separate haplotype clusters, suggesting a shared semblable refugia with its host plants.
Temperate evergreen forest, such as P. massoniana, recolonized the hilly regions of south China because of the increasing temperature since the Holocene (Harrison et al., 2001). Increased number of host plants provided great opportunity for sustaining population expansion of D. punctatus. In our study, a noteworthy trend revealed higher diversity in the southern region than in the east and north regions, reflecting a common scenario of postglacial, northward recolonization. Two stages of population growth are also well consistent with the last interglacial high sea level (MIS5, 0.13–0.07 Mya) and postglacial‐Holocene warm climate (0.018–0 Mya). The warm climate and high sea level influenced interglacial continental vegetation distribution.
The extinction of the populations in the northern parts of China, caused by migration to the south during the glacial maximum, might have survived in separate refugia. Our survey of mtDNA variation throughout the geographical distribution of D. punctatus suggests that several isolated refugia were existed where mtDNA divergence occurred. In addition, population dynamic analysis indicated that the D. punctatus species experienced population expansion, and an obvious northward recolonization was detected. The haplotype distribution of the present investigation seems further to indicate that the common fixture of the same haplotype among the disjunct populations was mainly caused by the founder effect during the population recolonization in this region. The highest latitude population (pop 23, HBCD, see population abbreviation in Table1) has relatively low genetic divergence even though much more individuals were used, which indicates the founder effect may be an important factor that influences genetic differentiation of D. punctatus.
4.3. Applicability of DNA barcoding at population level
To assign unknown individuals to certain populations within a species or to identify population from DNA sequences is not a new approach (Lou & Golding, 2010). Here, we present a study in which we systematically investigated the population structure and dynamic of D. punctatus with a variety of DNA barcoding methods, based on both commonly used COI gene, and two alternatives genes, ITS1 and ITS2. The intraspecific success rate of barcoding identification was found to be significantly lower than the interspecific ones, indicating the difficulty in barcoding populations (Figure 9). For the COI gene, among 23 populations of D. punctatus, only one single local population (pop23, HBCD) formed a monophyletic clade (Figure 3). Moreover, compared with the COI gene, less population structure was also found for ITS genes on the phylogenetic trees (Figure 4, 5). The results may not be surprising since the coalescence time is generally shorter than the time of different species to their most common ancestor (TMCA), therefore, no large enough variation or mutations accumulated during this relatively short time period. Furthermore, The AMOVA analysis of the mtDNA data suggested that strong gene flow existed in the D. punctatus populations, which also impaired the success rate of population assignments and resulted in no positive barcoding gaps being detected (Figure 9).
Despite the fact that the sequence information collected from DNA barcoding was not sufficient to solve population‐level questions, it reflected genetic diversity among different population (Bazin, Glémin, & Galtier, 2006; Moritz & Cicero, 2004). It should be noted, however, that DNA barcoding markers have the valuable potential to investigate the historical population dynamics of D. punctatus. It would be interesting to investigate further the applicability of barcoding information in the study of genetic diversity of other species.
5. CONCLUSION
We investigated the population structure and dynamics of D. punctatus based on the genetic variation of mtDNA as well as nuclear markers. A history of postglacial recolonization of the populations and multiple refugia during the ice age of the Quaternary was inferred. Many previous phylogeographic studies have paid close attention to the effects of very large mountainous systems such as the Mts Hengduan and Mts Qinling, but less attention was paid to the effect of the smaller mountain regions in the subtropical regions of China. The findings of this study proved that several potential refugia and geographic barriers existed in these hilly areas. These results provide a phylogeographical hypothesis for further testing; however, given the small sample size and limited molecular markers, many low‐copy nuclear genes and mitochondrial genomes are required to further examine the genomic divergence within D. punctatus.
CONFLICT OF INTEREST
None declared.
AUTHOR CONTRIBUTIONS
Jing Li wrote the MS and Qian Jin performed the experiment. Jing Li and Qian Jin analyzed all the data together. Geng‐ping Zhu and Chong Jiang provided great help in ecological niche modeling analysis. Ai‐bing Zhang defined the project as the main supervisor and considered the whole analysis.
ACKNOWLEDGMENTS
This research was supported by China National Funds for Distinguished Young Scientists (Grant No. 31425023), by Natural Science Foundation of China (Grant Nos. 31601877, 31772501 and 31400191), by Beijing Municipal Natural Science Foundation (Grant No. 5172005).
Li J, Jin Q, Zhu G‐P, Jiang C, Zhang A‐B. Phylogeography of Dendrolimus punctatus (Lepidoptera: Lasiocampidae): Population differentiation and last glacial maximum survival. Ecol Evol. 2019;9:7480–7496. 10.1002/ece3.5278
DATA ACCESSIBILITY
DNA sequences: GenBank accession numbers: KF366914–KF367149 for COI, KF367150–KF367271 for ITS1, and KF367272–KF367452 for ITS2. BOLD system accession numbers: GBGL14669–GBGL14904 for COI.
REFERENCES
- Alexandros, S. (2006). RAxML‐VI‐HPC: Maximum likelihood‐based phylogenetic analyses with thousands of taxa and mixed models. Bioinformatics, 22(21), 2688–2690. [DOI] [PubMed] [Google Scholar]
- Bazin, E. , Glémin, S. , & Galtier, N. (2006). Population size does not influence mitochondrial genetic diversity in animals. Science, 312(5773), 570–572. [DOI] [PubMed] [Google Scholar]
- Bouckaert, R. , Heled, J. , Kühnert, D. , Vaughan, T. G. , Wu, C. H. , Xie, D. , … Drummond, A. J. (2014). BEAST2: A software platform for Bayesian evolutionary analysis. PLoS Computational Biology, 10(4), e1003537. [DOI] [PMC free article] [PubMed] [Google Scholar]
- Brower, A. V. Z. (1994). Rapid morphological radiation and convergence among races of the butterfly Heliconius erato inferred from patterns of mitochondrial DNA evolution. Proceedings of the National Academy of Sciences of the United States of America, 91, 6491–6495. [DOI] [PMC free article] [PubMed] [Google Scholar]
- Cai, X. M. (1995). Studies on dynamics of population of Dendrolimus punctatus . Journal of Zhejiang Forest Science and Technology, 15, 1–84. (in Chinese with English summary). [Google Scholar]
- Carstens, B. , & Richards, C. L. (2007). Integrating coalescent and ecological niche modelling in comparative phylogeography. Evolution, 61, 1439–1454. [DOI] [PubMed] [Google Scholar]
- Cheng, R. , Jiang, N. , Xue, D. , Li, X. , Ban, X. , & Han, H. X. (2016). The evolutionary history of Biston suppressaria (Guenée). (Lepidoptera: Geometridae). related to complex topography and geological history. Systematic Entomology, 41(2), 732–743. [Google Scholar]
- Cheng, R. , Jiang, N. , Yang, X. S. , Xue, D. Y. , Liu, S. X. , & Han, H. X. (2016). The influence of geological movements on the population differentiation of Biston panterinaria (Lepidoptera: Geometridae). Journal of Biogeography, 43, 691–702. [Google Scholar]
- Cui, Z. J. , Chen, Y. X. , Zhang, W. , Zhou, S. Z. , Zhao, L. P. , Zhang, M. , & Li, C. C. (2011). Research history, glacial chronology and origins of Quaternary glaciations in China. Quaternary Science, 31(5), 749–764. [Google Scholar]
- Dai, Q. Y. , Gao, Q. , Wu, C. S. , Chesters, D. , Zhu, C. D. , & Zhang, A. B. (2012). Phylogenetic reconstruction and DNA barcoding for closely related pine moth species (Dendrolimus) in China with multiple gene markers. PLoS ONE, 7, e32544. [DOI] [PMC free article] [PubMed] [Google Scholar]
- Darriba, D. , Taboada, G. L. , Doallo, R. , & Posada, D. (2012). jModelTest 2: More models, new heuristics and parallel computing. Nature Methods, 9, 772. [DOI] [PMC free article] [PubMed] [Google Scholar]
- DeSalle, R. O. B. (2006). Species discovery versus species identification in DNA barcoding efforts: Response to Rubinoff. Conservation Biology, 20(5), 1545–1547. [DOI] [PubMed] [Google Scholar]
- Dupanloup, I. , Schneider, S. , & Excoffier, L. (2002). A simulated annealing approach to define the genetic structure of populations. Molecular Ecology, 11, 2571–2581. [DOI] [PubMed] [Google Scholar]
- Edgar, R. C. (2004). Muscle: Multiple sequence alignment with high accuracy and high throughput. Nucleic Acids Research, 32, 1792–1797. [DOI] [PMC free article] [PubMed] [Google Scholar]
- Excoffier, L. , & Lischer, H. E. L. (2010). Arlequin suite ver 3.5: A new series of programs to perform population genetics analyses under Linux and Windows. Molecular Ecology Resources, 10, 564–567. [DOI] [PubMed] [Google Scholar]
- Fjeldså, J. , Bowie, R. C. K. , & Rahbek, C. (2012). The role of mountain ranges in the diversification of birds. Annual Review of Ecology, Evolution, and Systematics, 43(1), 249–265. [Google Scholar]
- Friberg, M. , Schwind, C. , & Roark, L. C. (2014). Floral scent contributes to interaction specificity in coevolving plants and their insect pollinators. Journal of Chemical Ecology, 40, 955–965. [DOI] [PubMed] [Google Scholar]
- Friberg, M. , Schwind, C. , & Thompson, J. N. (2016). Divergence in selection of host species and plant parts among populations of a phytophagous insect. Evolution and Ecology, 30, 723–737. [Google Scholar]
- Fu, Y. X. (1997). Statistical tests of neutrality of mutations against population growth, hitchhiking and background selection. Genetics, 147, 915–925. [DOI] [PMC free article] [PubMed] [Google Scholar]
- Ge, X. J. , Hsu, T. W. , Hung, K. H. , Lin, C. J. , Huang, C. C. , Huang, C. C. , … Chiang, T. Y. (2012). Inferring multiple refugia and phylogeographical patterns in Pinus massoniana based on nucleotide sequence variation and DNA fingerprinting. PLoS ONE, 7, e43717. [DOI] [PMC free article] [PubMed] [Google Scholar]
- Hajibabaei, M. , Singer, G. , Hebert, P. D. N. , & Hickey, D. (2007). DNA barcoding: How it complements taxonomy, molecular phylogenetics and population genetics. Trends in Genetics, 23, 167–172. [DOI] [PubMed] [Google Scholar]
- Harrison, S. P. , Yu, G. , Takahara, H. , & Prentice, I. C. (2001). Palaeovegetation: Diversity of temperate plants in East Asia. Nature, 413, 129–130. [DOI] [PubMed] [Google Scholar]
- Hebert, P. D. N. , Cywinska, A. , Ball, S. L. , & deWaard, J. R. (2003). Biological identifications through DNA barcodes. Proceedings of the Royal Society B: Biological Sciences, 270, 313–321. [DOI] [PMC free article] [PubMed] [Google Scholar]
- Hewitt, G. M. (2000). The genetic legacy of the Quaternary ice ages. Nature, 405, 907–913. [DOI] [PubMed] [Google Scholar]
- Hickerson, M. J. , Carstens, B. C. , Cavender‐Bares, J. , Crandall, K. A. , Graham, C. H. , Johnson, J. B. , … Yoder, A. D. (2010). Phylogeography's past, present and future: 10 years after Avise, 2000. Molecular Phylogenetics and Evolution, 54, 291–301. [DOI] [PubMed] [Google Scholar]
- Hijmans, R. J. , Cameron, S. E. , Parra, J. L. , Jones, P. G. , & Jarvis, A. (2005). Very high‐resolution interpolated climate surfaces for global land areas. International Journal of Climatology, 25, 1965–1978. [Google Scholar]
- Holt, B. G. , Lessard, J. P. , Borregaard, M. K. , Fritz, S. A. , Araújo, M. B. , Dimitrov, D. , … Rahbek, C. (2013). An update of Wallace's zoogeographic regions of the world. Science, 339, 74–78. [DOI] [PubMed] [Google Scholar]
- Hou, T. Q. (1987). Lepidoptera: Lasiocampidae and Eupterotidae in insects of the three gorge reservoir area of Yangtze river In Yang X. K. (Ed.). The pine caterpillars in China (pp. 1396–1406). Chong Qing, China: Chong Qing Press; (in Chinese). [Google Scholar]
- Huemer, P. , & Hebert, P. D. N. (2011). Cryptic diversity and morphology of high alpine Sattleria – A case study combining DNA barcodes and morphology (Lepidoptera: Gelechiidae). Zootaxa, 2981, 1–22. [Google Scholar]
- Jiang, W. B. , He, H. Y. , Li, Y. D. , Ren, M. Y. , Ma, Y. Z. , Zheng, L. L. , … Yu, W. D. (2016). Taxonomic status and molecular phylogeography of two sibling species of Polytremis (Lepidoptera: Hesperiidae). Scientific Reports, 6, 20820. [DOI] [PMC free article] [PubMed] [Google Scholar]
- Kononov, A. , Ustyantsev, K. , Wang, B. D. , Mastro, V. C. , Fet, V. , Blinov, A. , & Baranchikov, Y. (2016). Genetic diversity among eight Dendrolimus species in Eurasia (Lepidoptera: Lasiocampidae), inferred from mitochondrial COI and COII, and nuclear ITS2 markers. BMC Genetics, 17(Suppl. 3), 157–166. 10.1186/s12863-016-0463-5 [DOI] [PMC free article] [PubMed] [Google Scholar]
- Kumar, S. , Tamura, K. , & Nei, M. (2004). Mega 3: Integrated software for molecular evolutionary genetics analysis and sequence alignment. Brief Bioinformatics, 5, 150–163. [DOI] [PubMed] [Google Scholar]
- Lei, F. M. , Qu, Y. H. , Song, G. , Alström, P. , & Fjeldså, J. (2015). The potential drivers in forming avian biodiversity hotspots in the east Himalaya Mountains of southwest China. Integrative Zoology, 10, 171–181. [DOI] [PubMed] [Google Scholar]
- Li, S. H. , Yeung, C. K. , Feinstein, J. , Han, L. , Le, M. H. , Wang, C. X. , & Ding, P. (2009). Sailing through the Late Pleistocene: Unusual historical demography of an East Asian endemic, the Chinese Hwamei (Leucodioptron canorum canorum), during the last glacial period. Molecular Ecology, 18(4), 622–633. [DOI] [PubMed] [Google Scholar]
- Librado, P. , & Rozas, J. (2009). Dnasp v5: A software for comprehensive analysis of DNA polymorphism data. Bioinformatics, 25, 1451–1457. [DOI] [PubMed] [Google Scholar]
- Liu, K. B. (1988). Quaternary history of the temperate forests of China. Quaternary Science Review, 7, 1–20. [Google Scholar]
- Liu, S. X. , Jiang, N. , Xue, D. Y. , Cheng, R. , Qu, Y. H. , Li, X. X. , … Han, H. X. (2016). Evolutionary history of Apocheima cinerarius (Lepidoptera: Geometridae), a female flightless moth in northern China. Zoologica Scripta, 45(2), 160–174. [Google Scholar]
- Lou, M. , & Golding, G. B. (2010). Assigning sequences to species in the absence of large interspecific differences. Molecular Phylogenetics and Evolution, 56, 187–194. [DOI] [PubMed] [Google Scholar]
- Matsubayashi, K. W. , Ohshima, I. , & Nosil, P. (2010). Ecological speciation in phytophagous insects. Entomologia Experimentalis et Application, 134, 1–27. [Google Scholar]
- Meier, R. , Shiyang, K. , Vaidya, G. , & Ng, P. K. (2006). DNA barcoding and taxonomy in diptera: A tale of high intraspecific variability and low identification success. Systematics Biology, 55, 715–728. [DOI] [PubMed] [Google Scholar]
- Mende, M. B. , & Hundsdoerfer, A. K. (2013). Mitochondrial lineage sorting in action‐historical biogeography of the Hyles euphorbiae complex (Sphingidae, Lepidoptera), Italy. BMC Evolutionary Biology, 13(1), 83–89. [DOI] [PMC free article] [PubMed] [Google Scholar]
- Mikkola, K. , & Ståhls, G. (2008). Morphological and molecular taxonomy of Dendrolimus sibiricus Chetverikov stat. rev. and allied lappet moths (Lepidoptera: Lasiocampidae), with description of a new species. Entomologica Fennica, 19, 65–85. [Google Scholar]
- Moritz, C. , & Cicero, C. (2004). DNA barcoding: Promise and pitfalls. PLoS Biology, 2(10), e354. [DOI] [PMC free article] [PubMed] [Google Scholar]
- Peterson, M. A. , & Denno, R. F. (1998). The influence of dispersal and diet breadth on patterns of genetic isolation by distance in phytophagous insects. The American Naturalist, 152(3), 428–446. [DOI] [PubMed] [Google Scholar]
- Phillips, S. J. , Anderson, R. P. , & Schapire, R. E. (2006). Maximum entropy modeling of species geographical distributions. Ecological Modelling, 190, 231–259. [Google Scholar]
- Qiu, Y. X. , Fu, C. X. , & Comes, H. P. (2011). Plant molecular phylogeography in China and adjacent regions: Tracing the genetic imprints of Quaternary climate and environmental change in the world's most diverse temperate flora. Molecular Phylogenetics and Evolution, 59(1), 225–244. [DOI] [PubMed] [Google Scholar]
- Rach, J. , DeSalle, R. , Sarkar, I. N. , Schierwater, B. , & Hadrys, H. (2008). Character‐based DNA barcoding allows discrimination of genera, species and populations in Odonata. Proceedings of the Royal Society B: Biological Sciences, 275, 237–247. [DOI] [PMC free article] [PubMed] [Google Scholar]
- Rogers, A. R. (1995). Genetic evidence for a Pleistocene population explosion. Evolution, 49, 608–615. 10.1111/j.1558-5646.1995.tb02297.x [DOI] [PubMed] [Google Scholar]
- Rogers, A. R. , & Harpending, H. (1992). Population growth makes waves in the distribution of pairwise genetic differences. Molecular Biology and Evolution, 9, 552–569. [DOI] [PubMed] [Google Scholar]
- Ronquist, F. , & Huelsenbeck, J. P. (2003). MRBAYES 3: Bayesian phylogenetic inference under mixed models. Bioinformatics, 19, 1572–1574. [DOI] [PubMed] [Google Scholar]
- Schneider, S. , & Excoffier, L. (1999). Estimation of past demographic parameters from the distribution of pairwise differences when the mutation rates vary among sites: Application to human mitochondrial DNA. Genetics, 152, 1079–1089. [DOI] [PMC free article] [PubMed] [Google Scholar]
- Singer, M. C. , Ng, D. , & Moore, R. A. (1991). Genetic variation in oviposition preference between butterfly populations. Journal of Insect Behaviour, 4, 531–535. [Google Scholar]
- Tajima, F. (1989). Statistical method for testing the neutral mutation hypothesis by DNA polymorphism. Genetics, 123, 585–595. [DOI] [PMC free article] [PubMed] [Google Scholar]
- Tian, S. , López‐Pujol, J. , Wang, H. , Ge, S. , & Zhang, Z. Y. (2010). Molecular evidence for glacial expansion and interglacial retreat during Quaternary climatic changes in a montane temperate pine (Pinus kwangtungensis Chun ex Tsiang) in southern China. Plant Systematics and Evolution, 284, 219–229. [Google Scholar]
- Valade, R. , Kenis, M. , Hernandez‐Lopez, A. , Augustin, S. , Mena, N. M. , Magnoux, E. , … Lopez‐Vaamonde, C. (2009). Mitochondrial and microsatellite DNA markers reveal a Balkan origin for the highly invasive horse‐chestnut leaf miner Cameraria ohridella (Lepidoptera, Gracillariidae). Molecular Ecology, 18, 3458–3470. [DOI] [PubMed] [Google Scholar]
- Wang, J. , Gao, P. X. , Kang, M. , Lowe, A. J. , & Huang, H. W. (2009). Refugia within refugia: the case study of a canopy tree (Eurycorymbus cavaleriei) in subtropical China. Journal of Biogeography, 36(11), 2156–2164. [Google Scholar]
- Wang, G. D. , Zhang, B. L. , Zhou, W. W. , Li, Y. X. , Jin, J. Q. , Shao, Y. , … Che, J. (2018). Selection and environmental adaptation along a path to speciation in the Tibetan frog Nanorana parkeri . Proceedings of the National Academy of Sciences of the United States of America, 115(22), 5056–5065. [DOI] [PMC free article] [PubMed] [Google Scholar]
- Webb, I. I. I. , & Bartlein, P. J. (1992). Global changes during the last 3 million years: Climatic controls and biotic responses. Annual Review of Ecology and Systematics, 23(1), 141–173. [Google Scholar]
- Yang, J. Q. , Tang, J. Q. , Liao, T. Y. , Sun, Y. , Zhou, Z. C. , Han, C. C. , … Lin, H. D. (2012). Phylogeographical analysis on Squalidus argentatus recapitulates historical landscapes and drainage evolution on the island of Taiwan and mainland China. International Journal of Molecular Sciences, 13(2), 1405–1425. [DOI] [PMC free article] [PubMed] [Google Scholar]
- Ye, Z. , Zhu, G. P. , Chen, P. , Zhang, D. L. , & Bu, W. J. (2014). Molecular data and ecological niche modelling reveal the Pleistocene history of a semi‐aquatic bug (Microvelia douglasi douglasi) in East Asia. Molecular Ecology, 23, 3080–3096. [DOI] [PubMed] [Google Scholar]
- Yu, G. , Chen, X. , Ni, J. , Cheddadi, R. , Guiot, J. , Han, H. , … Zheng, Z. (2000). Palaeovegetation of China: A pollen databased synthesis for the mid‐Holocene and last glacial maximum. Journal of Biogeography, 27, 635–664. [Google Scholar]
- Zhang, A. B. , Li, D. M. , Chen, J. , & Zhang, Z. (2004). Geohistories of Dendrolimus punctatus (Walker) and its host plant pine genus in China. Chinese Journal of Applied Entomology, 41(2), 146–150. [Google Scholar]
- Zhang, A. B. , Wang, Z. J. , Tan, S. J. , & Li, D. M. (2003). Monitoring the masson pine moth, Dendrolimus punctatus (Walker). (Lepidoptera: Lasiocampidae) with synthetic sex pheromone‐baited traps in Qianshan County, China. Applied Entomology and Zoology, 38(2), 177–186. [Google Scholar]
- Zhang, R. , Song, G. , Qu, Y. , Alstrom, P. , Ramos, R. , Xing, X. , … Lei, F. M. (2012). Comparative phylogeography of two widespread magpies: Importance of habitat preference and breeding behavior on genetic structure in China. Molecular Phylogenetics and Evolution, 65(4), 562–572. [DOI] [PubMed] [Google Scholar]
- Zhao, Q. S. , Wu, W. B. , Lv, G. P. , Chen, T. F. , & Lin, Q. Y. (1999). Hybridization among pine moths species and its genetic rule. Scientia Silvae Sinicae, 35(4), 45–50. [Google Scholar]
- Zhou, Y. F. , Abbott, R. J. , Jiang, Z. Y. , Du, F. K. , Milne, R. I. , & Liu, J. Q. (2010). Gene flow and species delimitation: A case study of two pine species with overlapping distributions in southeast China. Evolution, 64, 2342–2352. [DOI] [PubMed] [Google Scholar]
Associated Data
This section collects any data citations, data availability statements, or supplementary materials included in this article.
Data Availability Statement
DNA sequences: GenBank accession numbers: KF366914–KF367149 for COI, KF367150–KF367271 for ITS1, and KF367272–KF367452 for ITS2. BOLD system accession numbers: GBGL14669–GBGL14904 for COI.