

Summary:
Telomere shortening is associated with stem cell decline, fibrotic disorders and premature aging through mechanisms that are incompletely understood. Here, we show that telomere shortening in livers of telomerase knockout mice leads to a p53 - dependent repression of all seven sirtuins. P53 regulates non-mitochondrial sirtuins (Sirt1, 2, 6, & 7) post-transcriptionally through microRNAs (miR-34a, 26a & 145), while the mitochondrial sirtuins (Sirt3, 4 & 5) are regulated in a peroxisome proliferator-activated receptor gamma co-activator 1 alpha/beta - dependent manner at the transcriptional level. Administration of the NAD(+) precursor nicotinamide mononucleotide maintains telomere length, dampens the DNA damage response and p53, improves mitochondrial function and, functionally, rescues liver fibrosis in a partially Sirt1-dependent manner. These studies establish sirtuins as downstream targets of dysfunctional telomeres and suggest that increasing Sirt1 activity alone or in combination with other sirtuins stabilizes telomeres and mitigates telomere-dependent disorders.
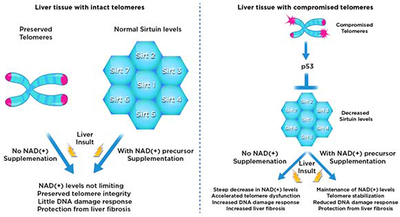
Graphical Abstract
eTOC
Telomere dysfunction is implicated in the promotion of tissue damage and fibrosis through mechanisms that are incompletely understood. Amano et al. show that telomere dysfunction in liver tissue downregulates sirtuins through p53 dependent mechanisms. Increasing NAD(+) stabilizes telomeres, dampens DNA damage response, and improves telomere-dependent fibrosis in a partially Sirt1-dependent manner.
Introduction
Telomeres, the repetitive ends of chromosomes, consist of double-stranded TTAGGG repeats that are coated with a specialized protein complex known as shelterin that plays a fundamental role in the regulation of telomere length and protection. Telomeres are maintained by a specialized reverse transcriptase, telomerase, which is repressed in the majority of human cells except in stem and progenitor cells and a small subset of other cells. Evidence for a role of telomerase and telomere length in human disease and aging comes from studies in patients with telomerase mutations and telomerase knock-out mice. Cumulatively, these studies have demonstrated that telomere shortening compromises the regenerative capacity of stem/ progenitor cells in highly proliferative tissues such as the hematopoietic system, intestine and skin. Another well-recognized pathological consequence of compromised telomeres is the increased risk of tissue fibrosis with liver and lung most commonly affected. In patients with the telomere-maintenance disorder Dyskeratosis congenita (DKC) approximately 20% and 7% develop lung and liver fibrosis respectively, although the factors that trigger and maintain fibrosis are not well understood(Armanios and Blackburn, 2012). However, following irradiation and cytotoxic treatment, DKC patients are at increased risk to develop secondary, treatment-associated complications including liver and lung fibrosis indicating that increased susceptibility to DNA damage is a risk factor for the development of fibrotic disorders. Clinical trials are underway to protect patients from long-term complications of treatment-associated DNA damage(Savage and Alter, 2009).
Liver disease is recognized to occur with higher frequency in patients with segmental telomere disorders such as aplastic anemia and bone marrow failure. Telomere shortening is also a hallmark of long standing liver disease due to acquired causes such as Hepatitis B/C viral infection or alcohol consumption, presumably as a consequence of insufficient activity of telomerase in proliferating hepatocytes. The accumulation of hepatocytes with critically short telomeres is associated with disease progression leading to liver cirrhosis, liver failure and elevated cancer risk(Hartmann et al., 2011). These human studies are experimentally supported by studies in telomerase knockout mice (TKO) with short telomeres, which are highly susceptible to liver cirrhosis after exposure to the DNA damage - inducing agent carbon-tetra chloride (CCL4)(Rudolph et al., 2000). TKO mice display increased susceptibility to DNA damage and cell death when challenged with CCL4 leading to increased tissue damage and, coupled with decreased proliferative capacity of surviving hepatocytes, to liver fibrosis(Rudolph et al., 2000). Currently, no therapies exist to prevent or treat telomere-associated liver fibrosis except for organ transplantation in patients with end-stage organ failure(Calado and Young, 2009). This lack of disease-modifying therapies is in part due to an incomplete understanding of the mechanisms that are operative downstream of dysfunctional telomeres and induce tissue compromise and, ultimately, liver failure. However, it has been demonstrated that the activation of DNA damage response pathway and its central transducer p53 promotes degenerative disorders by activating genes that induce growth arrest, apoptosis and senescence(Chin et al., 1999). This is indicated by studies in humans with liver cirrhosis in which decreased proliferation and accumulation of senescent hepatocytes is a common feature and tracks with degree of telomere dysfunction. This view is also supported by studies in mouse models where deletion of p53 curbs apoptosis/senescence and improves regenerative capacity across different tissues(Chin et al., 1999).
Recent studies have suggested a novel mechanism through which telomere dysfunction and p53 drive degenerative disorders by impacting cellular metabolism via a p53-dependent repression of peroxisome proliferator-activated receptor gamma co-activator 1 alpha/beta (PGC-1α/β), co-activators that drive mitochondrial biogenesis and function. In line with the concomitant repression of PGC-1α and PGC-1β, mitochondrial number and oxidative phosphorylation capacity is impaired in tissues with short telomeres resulting in decreased ATP synthesis, elevated ROS levels and decreased metabolic capacity including impaired gluconeogenesis(Sahin et al., 2011). Mitochondrial biogenesis and function is more severely compromised when telomere attrition is accelerated by predisposing pathological conditions such as muscular dystrophy leading to severe cardiomyopathy(Chang et al., 2016). While these reports point to the importance of dysregulated metabolism as a functionally relevant mechanism downstream of telomeres, several open questions regarding this telomere-metabolism link remain to be addressed. Importantly, the molecular mechanisms by which short telomeres regulate metabolism are yet to be fully defined as restoration PGC-1α in telomerase knockout mice with short telomeres only partially rescues the metabolic defect(Sahin et al., 2011). This partial rescue indicates the existence of other metabolic pathways that are altered by dysfunctional telomeres.
Here we investigated the role of sirtuins in telomere-dependent liver disease. Sirtuins are a class of NAD(+)-dependent enzymes that impact different cellular processes including transcriptional silencing, DNA recombination and repair, apoptosis and cellular metabolism through deacetylation and other posttranslational modifications of multiple downstream targets. Sirtuins are highly implicated in metabolic, ageing and age-related disorders. In the liver, Sirt1 has been particularly well studied among the seven sirtuins and has been shown to play an important role in diverse metabolic processes as well as implicated in the development of liver disease(Houtkooper et al., 2012). Increasing the activity of Sirt1 through overexpression or use of small molecules protects against fatty liver disease and improves insulin resistance induced by a high fat diet, while lack of Sirt1 in the liver accelerates hepatic steatosis and insulin resistance and is associated with inflammation and oxidative stress. The protective effects of Sirt1 have been suggested to be in large part due to increased mitochondrial function and biogenesis and improved metabolic function(Houtkooper et al., 2012). Another strategy to activate sirtuins is rooted in the observation that increasing NAD(+) levels can increase the activity of several sirtuins. An increase of NAD(+) has been achieved through the inhibition of major NAD(+) consuming enzymes such as PARP-1, CD38 or direct dietary supplementation with NAD(+) precursors such as nicotinamide mononucleotide (NNM) or nicotinamide riboside (NR). Increasing NAD(+) levels has been shown to protect from high fat diet-induced liver disease, insulin resistance and improve liver regeneration. The amelioration of liver disease has been linked to the improvement of mitochondrial biogenesis and function as well as activation of the mitochondrial unfolded stress response(Lagouge et al., 2006, Mouchiroud et al., 2013).
While both telomeres and sirtuins are independently implicated in aging and disease, how they are interconnected in driving disorders is not well understood, although previous studies in different model systems have demonstrated that both are tightly linked. In yeast, Sir2, the homolog of mammalian Sirt1, binds to telomeres and is required for the establishment and maintenance of silent chromatin formation at telomeres(Gottschling et al., 1990). This Sir2 – telomere interaction is dynamic as Sir2 and other Sir proteins redistribute from telomeres to other loci during yeast aging and in response to DNA damage(Guarente, 2000). The translocation of Sir2 from telomeres to DNA break sites is dependent on the DNA damage-checkpoint response(Martin et al., 1999, Mills et al., 1999). This re-localization is thought to promote DNA repair by different mechanisms including de-repression of genes involved in DNA repair and direct chromatin modifications at DNA breaks through the recruitment of repair factors(Guarente, 2000). In mice, a similar Sirt1 redistribution in response to DNA damage has been reported and thought to be important in the aging process(Oberdoerffer et al., 2008). Besides Sirt1, Sirt6 has also been shown to bind to telomeres and contribute to telomere integrity as evidenced by the accumulation of DNA damage foci at telomeres and rampant genomic instability with emergence of chromosomal end-to-end fusions after loss of Sirt6(Tennen and Chua, 2011). While these studies point to an important interplay between telomeres and sirtuins, how telomere dysfunction, in turn, impacts sirtuins, the molecular pathways that link telomeres to sirtuins and the relevance of sirtuins for telomere-dependent disease remain to be defined. Here, we find that telomere dysfunction induces the repression of all seven sirtuins in liver tissue of TKO mice, which is accompanied by hyperacetylation of many sirtuin targets including transcription factors, histones, mitochondrial proteins and metabolic enzymes. We demonstrate that the observed downregulation of sirtuins in the context of dysfunctional telomeres is p53-dependent as genetic ablation of p53 in TKO mice normalizes sirtuin expression and acetylation levels of their targets. We further demonstrate that telomere-induced sirtuin repression is functionally relevant as increasing sirtuin activity with the NAD(+) precursor NMN ameliorates telomere-dependent liver cirrhosis in a partially Sirt1- dependent manner.
Results
To assess the impact of telomere dysfunction on sirtuins we made use of mice lacking the reverse transcriptase component of telomerase, TERT. TERT knockout mice display no overt phenotype but develop multi-system premature aging when telomeres become progressively shorter in successive generations (G1 - G4). Unless otherwise stated, male G4 mice (“G4”) between 8-16 weeks of age were used in these studies. G4 mice display hallmarks of telomere dysfunction including stem cell compromise, regenerative defects in high turnover tissues, tissue atrophy, cardiomyopathy and shortened lifespan as reported previously(Sahin et al., 2011). To probe the relationship between telomere dysfunction and sirtuin expression, we determined sirtuin protein levels in liver tissue where both telomere dysfunction and sirtuin repression are implicated in organ pathology. Compared to age- and sex-matched wild type (WT) mice, all seven sirtuin members are down-regulated in G4 liver tissue (Fig. 1a; 9 mice per group analyzed; shown are 3 representatives per group; p <0.05). This sirtuin repression is dependent on the degree of telomere dysfunction as G1 and G2 mice with intermediate telomere length display attenuated Sirtuin repression compared to G4 mice (data not shown). We assessed the acetylation of Sirt1 (p53, PGC-1α, FOXO1), Sirt2 (H3K56, H4K16), Sirt3 (SOD2, majority of mitochondrial proteins), Sirt5 (succinylation of mitochondrial proteins), Sirt6 (H3K9 and H3K56) and Sirt7 (H3K18) targets. Combined immunoprecipitation-western blotting demonstrates pronounced hyperacetylation and succinylation of these sirtuin targets in G4 whole tissue lysates or lysates from isolated mitochondria (Fig. 1b and Supp. Fig. 1a and data not shown; 9 mice per group; p <0.05). Sirtuin expression in G4 mouse embryonic fibroblasts (MEFs) is also significantly reduced and several sirtuin targets (p53, FOXO1, SOD2 and CPS1) are hyperacetylated indicating that the observed repression of sirtuins upon telomere dysfunction is cell-autonomous (Supp. Fig. 1b, c; 3 different MEF cell lines were analyzed per group; p <0.05). Telomerase reintroduction in G4 mice (Fig. 1c and 1d; n= 9) and G4 MEFs (Supp. Fig. 1d, e; two independent cell lines; p <0.05) normalizes sirtuin expression and acetylation levels of sirtuin targets in liver tissue and MEFs while telomerase overexpression in WT mice and WT MEFs has no effect on sirtuin expression and acetylation levels of their targets (Supp. Fig. 1d and data not shown).
Fig. 1. Telomere dysfunction leads to sirtuin repression and hyperacetylation of sirtuin targets.

(a) Western blot demonstrates that Sirt1-7 are significantly down-regulated in G4 liver tissue (9 mice per group analyzed; shown are 3 representative mice per group); (b) IP-western blot analysis shows acetylation of targets of Sirt1 (p53, Foxo1), Sirt2 (H3K56, H4K16) Sirt3 (mitochondrial protein acetylation), Sirt5 (mitochondrial protein succinylation), Sirt6 (H3K9 and H3K56) and Sirt7 (H3K18) are increased in G4 liver tissue (shown are 3 representative results per group; a total of 9 mice per group were analyzed); (c) Western blot analysis of liver tissue from G4 mice infected with adenovirus expressing either telomerase (“Tert”) or GFP control shows that reactivation of telomerase increases sirtuin protein levels in G4 liver tissues (shown are 3 representatives per group; a total of 9 mice per group were analyzed); (d) telomerase reactivation decreases acetylation levels of Sirt targets compared to GFP-Adenovirus control group (9 mice per group were analyzed); Results are quantified by densitometry and expressed as mean ± s.e.m.; t-test was used to determine statistical significance with p <0.05 considered as significant, as indicated by (*).
To gain mechanistic insight into how telomere dysfunction leads to the down-regulation of all sirtuin members, we focused on the DNA damage response pathway and p53, which plays a pivotal role in inducing transcriptional changes, metabolic alterations and cellular regeneration upon telomere dysfunction(Sahin et al., 2011, Chin et al., 1999). We analyzed WT, p53 deficient (p53 −/−) and G4 mice either proficient or deficient for p53 (G4/p53 +/+ and G4/p53 −/−). RT-qPCR analysis of liver tissue demonstrates that telomere dysfunction leads to decreased mRNA abundance for mitochondrial sirtuins in G4/p53 +/+ mice, which is reversed when p53 is deleted in G4 mice (compare G4/p53 +/+ with G4/p53 −/− mice, Fig. 2a; n = 8 mice per group; p <0.05). In contrast to the mitochondrial sirtuins, the mRNA abundance of non-mitochondrial sirtuins is not impacted by either telomere dysfunction or p53 status in G4/p53 +/+ mice (Fig. 2a, n = 8 mice per group). At the protein level, the expression of all sirtuins is significantly increased in G4/p53 −/− compared to G4/p53 +/+ mice (Fig. 2b, 8 mice per group; p <0.05). The increase in sirtuin expression in G4/p53 −/− mice is accompanied by a decreased acetylation of sirtuin targets, including FOXO1, PGC-1α, SOD2, CPS1 and liver mitochondrial proteins (Fig. 2c, d; 6 mice per group analyzed; p <0.05).
Fig. 2. P53 regulates sirtuins in telomere dysfunctional mice.

(a) RT-qPCR analysis of sirtuin transcripts in WT, p53−/−, G4/p53 +/+ and G4/p53 −/− liver tissue demonstrates that mitochondrial sirtuins (Sirt3, 4 & 5) are repressed in G4/p53 +/+ mice and p53 deficiency in G4 mice rescues their expression (9 mice per group analyzed); (b) Western blot analysis using total liver tissue or isolated liver mitochondria shows elevated sirtuin protein expression in G4/p53 −/− mice compared to G4/p53 +/+ mice (9 mice per group were analyzed); (c) Combined IP-western blot analysis of liver tissues derived from WT, p53 −/−, G4/p53 +/+ and G4/p53 −/− mice demonstrates decreased acetylation levels of PGC-1α, FOXO1, SOD2, CPS1 in G4/p53 −/− compared to G4/p53 +/+ mice (6 mice per group were analyzed); (d) Analysis of acetylation levels of mitochondrial proteins from WT, p53 −/−, G4/p53 +/+, and G4/p53 −/− mice shows that G4/p53 −/− have decreased acetylation compared to G4/p53 +/+ mice (6 mice per group were analyzed). Results are quantified by densitometry and expressed as mean ± s.e.m.; t-test was used to determine statistical significance with p <0.05 considered as significant, as indicated by (*).
Next, we performed studies to discern the mechanisms by which p53 impacts sirtuins. RT-qPCR and western blotting analyses indicate that non-mitochondrial sirtuins are mainly regulated at the post-transcriptional level, in contrast to the transcriptional regulation of mitochondrial sirtuins (Fig. 2a, b). The posttranscriptional regulation of non-mitochondrial sirtuins by p53 is further supported by the unchanged luciferase activity using luciferase reporter constructs containing 1-2 kb promoter sequences of non-mitochondrial sirtuins in MEFs proficient or deficient for p53 (Fig. 3a), the increased luciferase activity of the 3’UTR of non-mitochondrial sirtuins in G4/p53 −/− MEFs (Fig. 3b; three independent experiments; p <0.05) and the increased polysome occupancy of non-mitochondrial sirtuin transcripts in G4/p53 −/− MEFs (Fig. 3c, two independent experiments; p <0.05). In contrast, the mitochondrial sirtuins are regulated by p53 predominantly at the transcriptional levels based on elevated mRNA transcripts in G4/p53 −/− liver tissue (Fig. 2a), increased luciferase activity using promoter sequences of mitochondrial sirtuins in G4/p53 −/− compared to G4/p53 +/+ MEFs (Fig. 3a, three independent experiments in two MEF lines per group; p <0.05), unchanged luciferase activity using 3’UTR of mitochondrial sirtuins in G4/p53 −/− MEFs (Fig. 3b, three independent experiments in two MEF cell lines per group) as well as similar polysome -enriched transcript levels in G4 MEFs with and without p53 (Fig. 3c, two independent experiments in two MEF cell lines per genotype). To determine whether proteasome-mediated degradation also plays a role in the repression of sirtuins, we treated WT and G4 MEFs with MG132, a proteasome inhibitor, which increased only Sirt7 protein abundance significantly, suggesting that the proteasome-mediated degradation pathway plays a major role in Sirt7 regulation as well (Fig. 3d; two MEF cell lines per genotype and three independent experiments; p <0.05). Together these studies demonstrate a dichotomy in the regulation of sirtuins: while the mitochondrial sirtuins are regulated at the transcriptional level, the non-mitochondrial sirtuins are predominantly regulated post-transcriptionally at the level of translation with Sirt7 and also impacted by proteasome-mediated degradation. Given that recent studies have demonstrated that p53 represses PGC1-α/β and PGC-1α regulates Sirt3 and Sirt5, we further interrogated the role of PGC-1α and PGC-1β in regulating sirtuins (Sahin et al., 2011, Kong et al., 2010). While mild (approx. 5-fold) overexpression of PGC-1α or PGC-1β is sufficient to stimulate transcription and protein abundance of mitochondrial Sirt3, 4 & 5 in MEFs, neither co-activator affects the mRNA or protein levels of non-mitochondrial sirtuins (Fig. 3e, f; p <0.05 and data not shown for PGC-1β).
Fig. 3. P53 regulates sirtuins at the transcriptional and posttranscriptional level in telomere dysfunctional mice.

(a) Luciferase assay with Sirt1-7 promoter sequences in pGL3 vector shows increased Sirt3, 4 & 5 luciferase activity in G4/p53 −/− compared to G4 /p53 +/+ MEFs (pGL3 vector and p21 promoter serve as background and positive controls); (b) Luciferase assays with Sirt1-7 3’UTR reveals increased luciferase activity in G4/p53 −/− MEFs compared to G4/p53 +/+ MEFs; (c) Polysome analyses in WT, p53 −/−, G4/p53 +/+, and G4/p53 −/− MEFs shows increased polysome occupancy of Sirt1, 2, 6, 7 transcripts in G4/p53 −/− MEFs (two independent experiments); (d) Western blot analysis of MEFs treated with proteasome inhibitor MG132 indicates that Sirt7 protein abundance is also regulated by proteasome-mediated degradation; (e) RT-qPCR analysis of WT MEFs transduced with PGC-1α - expressing adenovirus shows that PGC-1α overexpression in MEFs induces Sirt3, 4 & 5 mRNA levels; (f) Western blot analysis of MEFs overexpressing PGC-1α or GFP demonstrates that PGC-1α increases Sirt3, 4 & 5 protein abundance without affecting other sirtuins. Results are expressed as mean ± s.e.m. and are derived from three independent experiments in two MEF cell lines/genotype unless stated otherwise; t-test was used to determine statistical significance with p <0.05 considered as significant, as indicated by (*).
As non-mitochondrial sirtuins are regulated at the mRNA/translational level in a p53-dependent manner and given the role of miRNAs in these processes, we performed miRNA sequencing on G4/p53 +/+ (n= 5) and G4/p53 −/− (n= 6) liver tissue to identify p53-regulated miRNAs in the context of dysfunctional telomeres. MiRNA sequencing identified 48 differentially regulated miRNAs, 22 of which were increased (Fig. 4a showing p53-dependent up-regulated miRNAs) and 26 were repressed by p53 (Supp. Fig. 2a shows all, up- and down-regulated, p53-dependent regulated miRNAs in the context of dysfunctional telomeres). We focused on p53-activated miRNAs, many of which have been previously recognized as p53 targets, including miR-34a, 26, 29, 30, 99a and 145. We determined the expression levels of several miRNAs by qPCR and found them significantly upregulated in an independent set of G4 compared to WT control mice (Supp. Fig. 2b; 8 mice per group analyzed; p <0.05). To identify miRNAs that regulate non-mitochondrial sirtuins we used several miRNA binding prediction programs, which predicted miR-34a-5p to target Sirt1 and Sirt7, miR-26a-5p to target Sirt6, and miR-145-5p to target Sirt2 (Supp. Table 2). Using locked-nucleic acid (LNA) miRNA mimetics, we tested whether these miRNAs modulate the expression of luciferase-linked 3’UTR of each candidate sirtuin target and protein levels by western blotting. Gain-of-function studies demonstrated that miR-34a represses Sirt1 as reported previously(Yamakuchi et al., 2008) as well as Sirt7 while miR-26a and miR-145a represses Sirt6 and Sirt2 respectively (Fig. 4b–d; three independent experiments; p <0.05). Mutation of predicted miRNA binding sequence in 3’UTRs of Sirt1, 2, 6 and 7 restored luciferase activities supporting the specificity of the miRNA-sirtuin interaction (Fig. 4b–d; p <0.05). To further determine whether miR-34a, 26a, and 145a regulate sirtuins in vivo in the context of dysfunctional telomeres we used conditional miR-34a knockout mice and LNA-based miR-26a and miR-145a inhibitors delivered as liposomal nanoparticles to minimize off-target effects. Deletion of miR-34a in G4 livers increased Sirt1 and Sirt7 protein abundance (Fig. 4e, 6 mice per group; p <0.05) but did not impact RNA or protein levels of other sirtuin family members, while inhibiting miR-26a and miR-145a increased Sirt6 and Sirt2 protein abundance respectively (Fig. 4f and 4g, 6 mice per group analyzed; p <0.05). Thus, miR-34a, 26a and 145a regulate Sirt1, 2, 6 & 7 in cells and in liver tissue in the context of dysfunctional telomeres.
Fig. 4. P53 regulates miRNAs to repress Sirt1, 2, 6 and 7 in cells and in liver tissue.

(a) Heat map of differentially regulated miRNAs in G4/p53 +/+ (n = 5) and G4/p53 −/− (n = 6) liver tissue as determined by miRNA sequencing; (b-d) Luciferase assays using wild type 3’UTR and mutated predicted 3’ UTR sites of Sirt1, 2, 6 & 7 after transfection with miRNA mimetics in WT MEFs (3 independent experiments and triplicate readings); (e) Deletion of miR-34a in G4/miR-34a fl/fl mice after AAV-Cre injection increases Sirt1 and Sirt7 protein levels (6 mice per group were analyzed); (f, g) Inhibition of miR-26a or 145a in G4 liver tissue restores Sirt2 or Sirt6 respectively (6 mice per group were analyzed). Western blot results were quantified by densitometry. Results are expressed as mean ± s.e.m.; t-test was used to determine statistical significance with p <0.05 considered as significant, as indicated by (*).
Our previous studies in TERT deficient mice have shown that telomere dysfunction leads to the downregulation of mitochondrial biogenesis factors PGC-1α and PGC-1β and downstream targets NRF-1, ERRAα, Tfam and is associated with decreased mtDNA copy number, diminished electron transport complex activity and reduced ATP content in several tissues including liver indicating significant mitochondrial dysfunction(Sahin et al., 2011) without any indication of activation of the mitochondrial mitochondrial unfolded protein response (mtUPR; Supp. Fig. 3a and 3b). We therefore tested whether the NAD(+) precursor NMN rescues these mitochondrial defects. HPLC-based analysis demonstrated comparable NAD(+) levels in untreated G4 and WT liver tissue under steady state conditions, while NMN treatment elevated NAD(+) levels both in WT and G4 liver tissue (Fig. 5a; 6 mice per group analyzed; p <0.05). The increase in NAD(+) reversed hyperacetylation of several sirtuin targets including p53, FOXO1, PGC-1α, SOD2 and CPS1 in G4 liver tissue indicating elevated sirtuin activity (Fig. 5b; 6 mice per group analyzed; p <0.05 ). Of note, p53 acetylation was significantly reduced in liver tissue derived from NMN - treated G4 mice (Fig. 5b; 6 mice per group; p <0.05) and this was associated with decreased expression of direct p53 targets including p21, Bax and Gadd45a compared to untreated G4 mice (Fig 5c; 6 mice per group analyzed; p <0.05) while WT mice were not affected in line with low levels of p53 in the setting of long telomeres (Fig 5c; n= 6 mice per group). In line with diminished p53 expression upon NMN treatment key mitochondrial biogenesis factors including PGC-1α/β, ERRα and Tfam were significantly elevated and correlated with increased mtDNA copy number and complex activity I and complex IV in G4 mice while no differences were discernable in WT mice (Fig. 5d–f; 6 mice per group; p <0.05 for G4 group comparison and no statistical difference for WT group with and without NMN).
Fig. 5: Increasing NAD(+) concentration in G4 mice decreases acetylation levels of sirtuin targets and rescues metabolic changes in G4 liver tissue.

(a) HPLC analysis shows similar NAD(+) concentration in WT or G4 livers under steady state conditions and increased NAD(+) levels after NMN treatment (6 mice per group); (b) IP-western blot analyses demonstrates decreased acetylation of sirtuin targets (p53, Sod2, Cps1, Foxo1, Pgc-1α) after NMN treatment in G4 mice (6 mice per group); (c) RT-qPCR analysis of WT and G4 liver tissue demonstrates decreased expression of p53 targets (p21, Bax, Gadd45a) in G4 mice treated with NMN (6 mice per group analyzed); (d-f) NMN administration improves mitochondrial biogenesis and function as determined by (d) increased Pgc-1α, Pgc-1β, Errα and Tfam expression, (e) elevated mitochondrial DNA copy number and (f) partial rescue of complex I and IV activity (6 mice per group were analyzed). Results are expressed as mean ± s.e.m.; t-test was used to determine statistical significance with p <0.05 considered as significant, as indicated by (*).
To establish the relevance of elevated NAD(+) levels for telomere-mediated disease we tested whether NMN rescues telomere-dependent liver fibrosis, a disorder that afflicts patients with inherited telomerase mutations and with chronic liver disease. Previous studies in humans and in telomerase knockout mice have shown a marked susceptibility of liver tissue with short telomeres to DNA damage and development of cirrhosis(Rudolph et al., 2000). G4 and WT control mice were injected with the widely used fibrosis-inducing agent carbon-tetra chloride (CCl4) to determine whether increasing NAD(+) levels ameliorates liver fibrosis in G4 mice. Mice were treated with NMN for two weeks prior to CCL4 injections and continued throughout CCL4 treatment (12 injections total, two per week) for a total duration of 6 weeks. Interestingly, under CCL4 treatment, NAD(+) levels decreased in G4 more significantly than in WT mice, which was largely reversed upon NMN treatment (Fig. 6a; 6 mice per group; p <0.05). Importantly, NMN potently reduced damage and fibrosis in G4 mice as evidenced by improved liver architecture with decreased necrosis (H&E staining, Supp. Fig. 4a showing representative image; total of 12 mice per group analyzed in two independent experiments), reduced cell toxicity indicated by the blunted release of hepatocyte damage indicating enzymes (serum transaminases, ALT and AST; Supp. Fig. 4b; n= 12 per group; p <0.05), significant reduction of the expression levels of fibrosis markers (RT-qPCR analysis, Supp. Fig. 4c; n= 12 mice per group; p <0.05), diminished collagen deposition (Sirius red, Fig. 6b; n= 12 mice per group; p <0.05), blunted activation of hepatic stellate cells, the main cellular drivers of fibrosis (western blotting and immunofluorescence, Fig. 6c and Fig. 6d; n= 6 mice per group). This reduction of damage and fibrosis upon NMN treatment was reflected in an overall decreased fibrosis score (Fig. 6e; n= 12 mice per group; p <0.05). While the CCL4 studies demonstrated that, compared to WT mice, G4 mice are significantly more susceptible to DNA damage and NMN treatment improved liver fibrosis in G4 mice more significantly, it is noteworthy that NMN also ameliorated fibrosis in WT mice indicating that NMN supplementation is protective under condition of increased DNA damage, independent of telomere status (Fig. 6a–e and Supp. Fig. 4a–c). To address this issue of differential susceptibility to DNA damage as a function of telomere length we used a second, modified liver cirrhosis model that rests on the abbreviated duration of thioacetaminde (TAA) administration (4 weeks)(Newell et al., 2008). G4 or WT mice were fed for 2 weeks with NMN – enriched or (control) regular chow and were then subjected to TAA in drinking water for 4 weeks during which they were continuously fed control or NMN-enriched chow. Mice were then analyzed for liver damage and degree of fibrosis (n= 8 mice per group). This treatment regime induces limited damage in WT mice compared to G4 mice as evidenced by minimal DNA damage (γH2AX immunofluorescence, Supp. Fig. 4d), low levels of p53 and apoptotic cells and little signs of tissue necrosis in WT mice (p53 immunohistochemistry and Tunel staining, Supp. Fig 4e and data not shown; n= 8 mice per group). This treatment regime induced little fibrosis based on low accumulation of hydroxyproline levels and low fibrosis score (Supp. Fig. 4f, g; n= 8 mice per group). In contrast, G4 mice showed significant susceptibility to TAA – induced DNA damage, p53 accumulation, apoptosis and tissue necrosis (Supp. Fig. 4d, e and data not shown; n= 8 mice per group; p <0.05) and marked susceptibility to develop fibrosis as indicated by elevated hydroxyproline concentration and high fibrosis score compared to WT mice (Supp. Fig. 4f, g; n= 8 mice per group; p <0.05). Using this TAA-induced fibrosis model we found that NMN significantly improved fibrosis in G4 mice as determined by total collagen deposition as hallmark of fibrosis and fibrosis score (Supp. Fig. 4f, g; n= 8 per group; p <0.05) indicating that hepatocytes with short telomeres are significantly more prone to DNA damage and NMN has significant beneficial effects in the context of short telomeres.
Fig. 6. NMN treatment is associated with longer telomeres and reduced DNA damage response and rescues liver fibrosis in telomere dysfunctional mice.

(a) HPLC-based determination of NAD(+) levels shows that CCL4 treatment reduces NAD(+) levels while supplementation with NMN rescues NAD(+) concentrations in liver tissues (6 mice per group analyzed); (b) Decreased collagen content in WT or G4 mice treated with NMN as determined by Sirius Red staining in CCL4 –induced fibrosis; right graph shows quantification (12 mice per group analyzed); (c, d) Western blot and immunofluorescence-based analysis of smooth muscle actin (SMA) as a marker of stellate cell activation indicates decreased stellate cell activation following NMN treatment (6 mice per group were analyzed) in CCL4 –induced fibrosis; (e) Fibrosis score in CCL4 model indicates decreased fibrosis in NMN-treated WT and G4 mice (12 mice per group); (f) Representative QFISH images of telomere intensity (red signal is telomere signal; blue is DAPI stain of nuclei) in WT or G4 hepatocytes either untreated or NMN treated and subjected to TAA – induced fibrosis; right graph shows telomere length intensity indicating significantly longer telomeres in NMN-treated G4 mice (8 mice per group were analyzed; a 60-80 nuclei per mouse were analyzed in 10 different random liver sections totaling between of 560-640 in the WT and G4 groups respectively); (g, h) p53 western blot shows significant reduction of p53 levels after NMN treatment in G4 mice and (h) reduced transcript levels of p53 targets p21, Bax and Gadd45a as determined by RT-qPCR in TAA-induced fibrosis (8 mice per group); (i) Western blot analysis of tissue from either untreated or NMN-treated WT or G4 mice subjected to TAA- shows that NMN increases Sirt1 levels in G4 mice while WT mice are not affected (representative data are shown; 8 mice per group were analyzed). Results are expressed as mean ± s.e.m.; t-test was used to determine statistical significance with p <0.05 considered as significant, as indicated by (*).
To gain more mechanistic insight into how NMN protects hepatocytes with dysfunctional telomeres from damage we analyzed telomere length given that Sirt1 and Sirt6 are implicated in telomere maintenance(Palacios et al., 2010, Michishita et al., 2008). Interestingly, telomere length determination by quantitative telomere FISH (QFISH) after 4 weeks of TAA treatment showed significantly longer telomeres in NMN - treated G4 mice (treated for 6 weeks total) compared to their G4 littermate controls on regular chow (Fig. 6f; n= 8 mice per group; 560-640 nuclei from 10 random fields per group analyzed; p <0.05;). In WT mice, a trend towards longer telomeres was observed in the NMN-treated group although this did not reach statistical significance (Fig. 6f; n= 8 mice per group with 560-640 nuclei from 10 random fields analyzed per group). The longer telomeres in G4 mice treated with NMN was associated with a reduced expression of p53 and p53 targets (Fig. 6g, h; n= 8 mice per group analyzed; p<0.05) indicating a robust repression of DNA damage response by NMN in the context of short telomeres while no discernable differences were observed in WT mice (data not shown). The decreased p53 activity in G4 mice treated with NMN was associated with increased expression of Sirt1 as well as other sirtuins (Fig. 6i and Supp. Fig. 4h; n= 8 mice per group analyzed; p <0.05) while WT mice did not show any changes of sirtuin expression irrespective of NMN treatment (see Fig 6i for Sirt1 expression in WT mice with and without NMN treatment and data not shown for other sirtuins).
To further interrogate which of the sirtuins is required for the observed effects of NAD(+) on telomere length and improvement of fibrosis, we focused on Sirt1 based on its role in telomere maintenance and reduced expression is associated with liver pathologies. To test whether Sirt1 is required for NMN-induced amelioration of liver fibrosis we induced fibrosis in mice proficient or deficient for Sirt1 on the backdrop of preserved (Sirt1 fl/fl; AlbCre(+)/ Sirt fl/fl) or dysfunctional telomeres (G4/Sirt1 fl/fl ; G4/AlbCre(+)/Sirt1 fl/fl) using the previously established TAA treatment regime. The beneficial effects of NMN on liver fibrosis in G4 is significantly dependent on Sirt1 as evident by increased necrosis, elevated collagen deposition (Sirius Red staining and hydroxyproline deposition and overall increased fibrosis score in G4/Sirt1 −/− mice compared to their counterparts with preserved sirtuin expression, G4, mice indicating a (partial) requirement of Sirt1 for the beneficial NMN effects in the setting of short telomeres (Fig. 7a–c; n= 8 mice per group; p <0.05). WT and Sirt1 deficient mice with preserved telomeres were not significantly impacted by TAA and did not show any differences in degree of necrosis and fibrosis based on H&E, hydroxyproline measurement and fibrosis score (Supp. Fig. 5a, b and data not shown; n= 8 mice per group). To determine whether the effect of NMN on telomere length in G4 mice is Sirt1 dependent we analyzed telomere length and telomere integrity (telomere-induced foci) by QFISH and combined QFISH/immunofluorescence. QFISH analysis showed that NMN – treated G4 mice lacking Sirt1 had shorter telomeres and increased number of TIFs compared to their NMN-treated G4 littermate controls with intact Sirt1 indicating a partial requirement of Sirt1 for NMN-dependent telomere maintenance and integrity (Fig. 7d and Supp. Fig. 5c; n= 8 mice per group; 560-640 nuclei from 10 random fields per group analyzed; <0.05). In the context of preserved telomeres Sirt1 status did not impact telomere length nor integrity in young mice in line with previous findings(Palacios et al., 2010) (Fig. 7d and Supp. Fig. 5c n= 8 mice per group; 560-640 nuclei from 10 random fields per group analyzed; p <0.05). The observed reduction of the DNA damage response and its main transducer p53 following NMN treatment in G4 mice (Fig. 6g) was also largely Sirt1 dependent as G4 mice lacking Sirt1 did not show a reduction in p53 levels (Fig. 7e; n= 8 per group; shown are 4 representative G4/Sirt1 −/− mice with and without NMN treatment) and a nonsignificant trend towards reduced expression of p53 targets following NMN treatment (Fig. 7f; n= 8 mice per group). Furthermore, Sirt1 is also required for the improvement in mitochondrial biogenesis and function upon NMN treatment as indicated by the blunted response in the expression of the mitochondrial biogenesis factors PGC-1α/β, Tfam, ERRα, lower mtDNA copy number and lower complex I and IV activity in G4 mice deficient for Sirt1 (Fig. 7g–i; n= 8 mice per group; p <0.05). In contrast to G4 mice, Sirt1 status induced little changes in mice with preserved telomeres with respect to expression of PGC-1α/β, Tfam, ERRα, mitochondrial DNA copy number, complex I and complex IV activity levels of p53 and its targets, (Supp. Fig 5d–f; n= 8 mice per group and data not shown).
Fig. 7. NMN-dependent rescue of fibrosis, telomere maintenance, suppression of DNA damage response and improvement of mitochondrial function is partially Sirt1 dependent.

(a-c) Sirt1 deficiency in G4 mice significantly abrogates the beneficial effect of NMN in TAA-induced fibrosis in G4 mice as determined by (a) Sirius red staining, (b) hydroxyproline quantification and (c) fibrosis score (8 mice per group; p <0.05); (d) NMN-induced telomere length in G4 is partially Sirt1 dependent as shown by decreased telomere signal in the absence of Sirt1 in G4 mice treated with TAA; WT and Sirt1 deficient mice do not show discernable differences in telomere length with NMN; right graph shows quantification of telomere length (8 mice per group were analyzed; between 560-640 nuclei were quantified per group); (e, f) NMN-induced repression of p53 and p53 targets in G4 mice is largely Sirt1 dependent as indicated by (e) similar p53 protein levels in G4/Sirt -/mice treated with NMN compared to untreated G4/Sirt −/− untreated controls and (f) increased p53 targets (p21, Bax and Gadd45a, f) in G4/Sirt1 −/− ( 8 mice per group were analyzed); NMN-induced expression of (g) mitochondrial biogenesis factors Pgc-1α, Pgc-1β, Errα and Tfam, (h) mtDNA copy number and (i) complex I and IV activity mice is partially Sirt1 dependent in G4 mice (8 mice per group analyzed); Results are expressed as mean ± s.e.m.; t-test was used to determine statistical significance with p <0.05 considered as significant, as indicated by (*).
Discussion
Telomere dysfunction and sirtuin repression, independently, are highly associated with predisposition to diseases, accelerated aging and lifespan reduction and the current studies suggest that these two pathways are closely intertwined and cooperate to drive disease. This is suggested by the overlapping phenotypes in telomerase and sirtuin knockout mice including predisposition to genomic instability, stem cell failure, metabolic dysfunction, and diminished lifespan(Sahin and Depinho, 2010). Our studies uncover a telomere-dependent control of sirtuin expression and raise the possibility of a feed forward loop whereby compromised telomeres reduces sirtuin expression, which could further compromise telomere integrity, leading to a progressive deterioration. The repression of all seven sirtuin members upon telomere dysfunction would suggest that elevating the activity of several sirtuins - as opposed to individual sirtuins - would be advantageous based on the protective effect of NAD(+) precursors NMN and NR against metabolic disorders, age-related diseases and stem cell failure. This view is supported by the partial requirement of Sirt1 for NR - mediated protection from liver fibrosis, indicating that the observed beneficial effects of NMN supplementation could be the result of the cooperative effect of increased activity of several sirtuins and, potentially, other NAD(+) - dependent enzymes (see below).
Although the functional relevance of the other sirtuins for telomere dysfunction-associated pathology remains to be established, the current studies demonstrate an important role of Sirt1 in telomere-dependent liver disease. Sirt1 deficiency is highly associated with predisposition to age-related disorders as well as susceptibility to metabolic disorders(Imai and Guarente, 2014). In the liver, Sirt1 deficiency predisposes to fatty liver disease and increasing Sirt1 activity with Sirt1 activators or the NAD(+) precursor NR improves high fat diet-induced liver disease(Canto et al., 2012). Besides protecting from metabolic liver disease, increasing NAD(+) levels via NR supplementation or overexpression of the rate-limiting enzyme of NAD(+) biosynthesis, Nampt, has been shown to improve liver regeneration(Mukherjee et al., 2017). Mechanistically, our studies demonstrate that the repression of all seven sirtuins in the context of dysfunctional telomeres is dependent on the DNA damage response and central executor, p53, as deletion of p53 in mice with telomere dysfunction normalizes sirtuin expression. While these findings confirm previous studies demonstrating that p53 represses Sirt1 when telomeres are intact(Yamakuchi et al., 2008), we find that p53 regulates all seven sirtuins in the context of dysfunctional telomeres. This striking expansion of p53-regulated sirtuins upon telomere dysfunction might stem from elevated p53 activity in tissues with compromised telomeres among other factors. Although it remains to be determined whether sirtuins are jointly repressed in other settings with hyperactive p53, recent studies in a mouse model of increased DNA damage due to deficiency for the DNA repair protein CSA/CSB have demonstrated that all sirtuins except for Sirt6 are repressed(Scheibye-Knudsen et al., 2014).
Interestingly, our studies point to a distinct dichotomy in the p53-dependent regulation of sirtuins: while the predominantly non-mitochondrial sirtuins are regulated at the translational level, the mitochondrial sirtuins are regulated at the transcriptional level by p53. We find that the mitochondrial sirtuins are regulated by PGC-1α and PGC-1β, which are repressed by p53 in the context of short telomeres. Of note, the forced overexpression of PGC-1α and PGC-1β only drives the expression of mitochondrial sirtuins without affecting the other sirtuins. This striking selectivity of PGCs towards mitochondrial sirtuins indicates the existence of specific mechanisms that induce a PGC-dependent activation of mitochondrial sirtuins, potentially as part of a PGC-directed mitochondrial biogenesis program. In contrast to the mitochondrial sirtuins, the non-mitochondrial sirtuins are predominantly regulated post-transcriptionally through p53-dependent miRNAs. While the role of p53-dependent miRNAs for telomere-dependent disease and aging are largely unexplored, our studies suggest an important role of miR-34a and potentially other miRNAs for the development of telomere-dependent fibrosis by jointly repressing several sirtuins. Although deletion of miR-34a in mice with preserved telomeres is well tolerated and does not lead to the occurrence of any overt phenotype(Concepcion et al., 2012), under chronic conditions of cellular stress such as fatty liver disease and liver fibrosis, the p53-miR-34a axis might become functionally important(Castro et al., 2013). The relevance of miR-34a-Sirt1/Sirt7 axis for telomere-dependent liver fibrosis is also supported by the observation that liver fibrosis is ameliorated following either liver-specific miR-34a deletion or individual overexpression of Sirt1 and Sirt7 in late generation TERT knockout mice with short telomeres (H. Amano E. Sahin, unpublished data). Similar to Sirt1, Sirt7 has been shown to converge on and inactivate p53 and protect from tissue fibrosis, indicating that the convergence of several sirtuins on p53 could cooperatively dampen the p53 response(Vakhrusheva et al., 2008).
Our studies indicate that steady state levels of NAD(+) in livers of telomerase knockout mice are similar to wild type mice although differences in specific cellular compartments such as mitochondria cannot be ruled out. However, under conditions of increased DNA damage such as CCL4 treatment, NAD(+) levels decline much more significantly in G4 livers indicating that NAD(+) can become limiting more readily in cells with dysfunctional telomeres. The drop of NAD(+) levels in liver tissue with short telomeres mirrors the well-recognized susceptibility of cells with dysfunctional telomeres to different forms of DNA insults such as cytotoxic drugs and irradiation. The decrease in DNA damage foci in G4 mice with short telomeres following NAD(+) supplementation suggests that the increased susceptibility of cells with short telomeres to DNA damage is in part driven by an accelerated decline in NAD(+) levels compared to cells with preserved telomeres. Inhibiting the NAD(+) consuming enzyme CD38 has also been shown to decrease DNA damage foci at telomeres in wild type mice during aging(Tarrago et al., 2018). While a NAD(+) decline has been also observed during aging as well as in different disease conditions and in part attributed to the diminished expression of Nampt(Yoshino et al., 2011), the rate-limiting enzyme for NAD(+) synthesis, it remains to be established whether the age-related decrease in NAD(+) levels could be also a consequence of increased telomere and/or generalized DNA damage.
The mechanisms of NMN-mediated protection from liver fibrosis protection appear to be multifactorial and operative at several levels. At the DNA level, our studies demonstrate that NMN stabilize telomeres in a partially Sirt1 dependent manner under conditions of ongoing DNA damage and dampens the DNA damage response. The role of Sirt1 in telomere maintenance is well documented in yeast and mammalian cells. In yeast, Sir2, together with other Sir proteins, binds to telomeres and subtelomeric regions to cause transcriptional silencing(Perrod and Gasser, 2003). Although Sir2 deletion mutants alone do not have telomere defects, in a telomerase deficient yeast strain that is also defective for a factor essential for homology-directed repair at telomeres, rad52, Sir2 deletion further accelerates telomere shortening and senescence indicating that under conditions of telomere dysfunction Sir2 plays an important role in telomere maintenance, possibly through increased transcription of non-coding Telomeric Repeat containing RNAs (TERRA)(Maicher et al., 2012). In mice, deletion of Sirt1 leads to shorter telomeres while Sirt1 overexpression prevents age-related telomere shortening in several tissues including liver(Palacios et al., 2010). Importantly, studies in yeast and mammalian cells have shown that during aging and upon DNA damage Sirt1 translocates to DNA damage foci to facilitate DNA repair through the deacetylation of various DNA repair factors(Guarente, 2000, Oberdoerffer et al., 2008). This translocation has been shown to induce gene expression changes that recapitulate transcriptional changes seen during normal aging indicating an important role of Sirt1 redistribution as a mechanism of age-dependent changes(Oberdoerffer et al., 2008). How Sirt1 redistribution functions to induce transcriptional and genomic changes in the setting of dysfunctional telomeres remains to be fully established.
The partial rescue of telomere integrity by Sirt1 indicates the existence of other pathways that are involved in maintaining telomere integrity following NMN treatment. One of the primary candidates is Sirt6 based on the observation that Sirt6 binds to telomeres, deacetylates H3K9 and H3K56 at telomeres and facilitates the association of the WRN helicase with telomeric chromatin, which is essential for telomere capping. Accordingly, mice devoid of Sirt6 develop dysfunctional telomeres and profound genomic instability with end-to-end fusions(Michishita et al., 2008). Besides sirtuins, other NAD(+)-dependent enzymes are implicated in telomere maintenance including Poly(ADP-ribose) polymerase 1/2 (PARP1/2) and Tankyrase 1/2. PARP1 is the primary NAD(+)-consuming enzyme following DNA damage and although conflicting results have been reported about telomere compromise in two independent PARP1 deficient mouse lines, PARP1 has been shown to preferentially bind at dysfunctional telomeres following DNA damage and, when absent, leads to telomere dysfunction and chromosomal abnormalities(Gomez et al., 2006). Pharmacological inhibition of PARP1 is also associated with compromised telomere integrity in human cells(Beneke et al., 2008). It is possible that under conditions of ongoing DNA damage during fibrosis NAD(+) becomes limiting in cells with dysfunctional telomeres and impairs the repair activity of PARP1/2 at telomeres and, conversely, NAD(+) supplementation prevents telomere dysfunction through maintenance of PARP1/PARP2 activity. Alternatively, the increased DNA damage and NAD(+) consumption by PARP1 could impair the activity of Sirt1 and cause telomere dysfunction indirectly. Such a competition between the Sirt1 and PARP1/2 for NAD(+) has been demonstrated to lead to impairment of Sirt1 activity when PARPs are activated following DNA damage(Bai and Canto, 2012). Besides PARP, increasing NAD(+) levels could affect the activity of Tankyrase, which is involved in telomere elongation in human cells through its interaction with TRF1, a negative regulator of telomere length. However, mice deficient in either Tankyrase 1 and 2 have no telomere defects and appear not to interact with TRF1, which lacks the Tankyrase binding site known in human cells and thus, most likely, does not mediate telomere effects observed with NAD(+) supplementation directly.
The observed maintenance of telomere integrity in telomerase knockout mice indicates that NAD(+) supplementation stabilizes telomeres through telomerase-independent mechanisms. One possible indirect mechanism could involve the reduction of reactive oxygen species through improved mitochondrial function. Telomeres have been shown to be susceptible to ROS-induced damage and undergo rapid attrition under conditions of increased ROS(von Zglinicki et al., 1995). Recent genetic studies shave further highlighted the role of specific ROS – dependent repair enzymes including Peroxiredoxin 1 and Nudix hydrolase 1 for telomere maintenance as deletion of either factor leads to ROS-induced telomere loss and fragility, and induction of DNA damage signaling at telomeres(Ahmed and Lingner, 2018). The importance of ROS is further underlined by the maintenance of telomeres in vivo in a mouse model of cardiomyopathy when ROS inhibitors are delivered, although ROS scavengers did not prove effective in rescuing the functional compromise of hematopoietic stem cells with short telomeres, indicating that context and degree of stress might potentially influence the outcome(Chang et al., 2016, Sahin et al., 2011). The herein observed telomere-driven suppression of sirtuins could be an important anti-tumor mechanism and an important factor in the consideration of NAD(+)-based therapies for telomere-dependent disorders. Although the current studies with NAD(+) supplementation have not shown any increase in cancer, it remains to be established whether long-term NAD(+) supplementation increases the risk of malignant transformation in cells with already damaged telomeres. The abrogation of the DNA damage response in cell with compromised telomeres could extend the lifespan of cells but also potentially allow for the acquisition of mutations required for full transformation.
Taken together, these studies demonstrate that telomere dysfunction leads to the repression of sirtuins through p53-dependent mechanisms, and expand our knowledge of the close links between telomeres and sirtuins as important regulators of DNA integrity, transcription, metabolic processes. Our studies show that under conditions of DNA damage, NAD(+) levels fall significantly in cells with dysfunctional telomeres and boosting NAD(+) levels maintains telomere length in a partial Sirt1-dependent manner, and that this ameliorates telomere-dependent liver disease.
Limitations of this study
The limitations of this study include the sole use of male mice and the reliance on a chemically induced fibrosis model. The multiple pathways that are activated by NAD(+) supplementation in the context of dysfunctional telomeres need to be fully delineated and their functional relevance established. Lastly, detailed analysis of differences in NAD(+) synthesis and consumption in tissues with and without intact telomeres under steady state and stress was not carried out, and this remains an important area for future studies.
STAR METHODS
Contact for Reagent and Resource Sharing
Further information and requests for reagents should be directed to and will be fulfilled by the Lead Contact, Ergun Sahin (esahin@bcm.edu).
Experimental Model and Subject Details
Mouse Studies
All animal experiments were performed according to procedures approved by the Institutional Animal Care and Use Committee at Baylor College of Medicine. Mice were maintained on standard rodent chow with 12-hr light-dark cycles. For all studies age and sex matched mice were used. Male mice between 8 and 16 weeks of age were used unless otherwise stated and all mice were maintained on a C57/B6 background. Mice were maintained in openly ventilated cages with group housing (2-4 per cage), in a temperature-controlled (20-22°C) facility with 12 h light/12 h dark cycle, with ad libitum access to food (PicoLab® Select Rodent Diet 50 IF/6F Diet) and water.
TERT deficient mice
TERT deficient mice were provided by Ronald A. DePinho and generated by deletion of exon 1, an essential part of the TERT open reading frame, as described in detail previously(Sahin et al., 2011). TERT heterozygous mice were continuously interbred to produce successive generations (G1-G4) of TERT deficient mice with progressive telomere shortening in each generation as described(Sahin et al., 2011). G4 mice were used for all studies unless stated otherwise. Compound mice were on a C57/B6 background.
TERT/p53 −/− double mutant mice
P53 germline deficient mice were crossed to heterozygous TERT mice to generate a cohort of G1-G4 mice with decreasing telomere length either proficient or deficient for p53. These mice were maintained on a C57/B6 background.
TERT/Sirt1 fl/fl/AlbCre mice
Conditional Sirt1 and AlbCre transgenic mice were purchased from JAX laboratory and crossed with TERT heterozygous mice to generate mice with decreasing telomere length and Sirt1 fl/fl mice that were either positive or negative for the Alb-Cre transgene. All alleles were maintained on a C57/B6 background.
TERT/mir34a fl/fl mice: Mir-34a fl/fl(Concepcion et al., 2012)
Mice were purchased from JAX laboratory and crossed to heterozygous TERT mice to generate a cohort of G1-G4 mice with decreasing telomere length and floxed miR-34a allele. Mice were maintained on a C57/B6 background.
Mouse embryonic fibroblast
Mouse embryonic fibroblasts (MEFs) were generated from WT, p53−/−, G4 and G4/p53−/− embryos (both sexes) using standard techniques. MEFs were grown in DMEM supplemented with 10% fetal bovine serum (FBS), penicillin, and streptomycin and used between 2-4 passages. MEFs were cultured at 37°3 and 5% CO2.
Method Details
Western blot analysis
Cells and tissues lysates from were prepared in RIPA buffer (50 mM Tris-HCl, pH 7.4, 150 mM NaCl, 0.1% SDS, 0.5% sodium deoxycholate, 1.0% Triton X-100) containing a protease inhibitor cocktail (Roche Applied Science), 2.5 mM sodium pyrophosphate, 1.0 mM β-glycerophosphate, 1.0 mM sodium orthovanadate, 10 mM sodium fluoride, 10 mM nicotinamide (NAM), and 1 μM Trichostatin A (TSA). The crude lysates were briefly sonicated and later centrifuged for 10 min at 15,000x g at 4° C. The protein concentration was determined by the Bradford assay. Equal amounts of protein were loaded onto 12% SDS-PAGE gels and transferred to nitrocellulose membranes (Bio-Rad). Membranes were blocked with 5% skim milk in TBST (50 mM Tris-Cl, pH7.5, 150 mM NaCl, 0.05% Tween 20) for 1 hour at room temperature, followed by overnight incubation in primary antibody at 4° C (all antibodies and dilutions used in this study are listed under “Antibodies” in “Key Resource Table”) and subsequently incubated with horseradish peroxidase-coupled anti-mouse or anti-rabbit secondary antibodies for 1 hour at room temperature. Super Signal West Pico chemiluminescent substrate (Thermo Fisher Scientific) was used to visualize the signal. Films were scanned, and band densities were quantitated by densitometry using NIH image 1.49v software. Data were normalized to β-actin, vinculin or porin protein levels.
KEY RESOURCES TABLE
| REAGENT or RESOURCE | SOURCE | IDENTIFIER |
|---|---|---|
| Antibodies | ||
| Rabbit polyclonal anti-Sirt1(Sir2), 1:3000 | EMD Millipore | Cat# 07-131, RRID:AB_10067921 |
| Rabbit monoclonal anti-SirT2 (D4S6J), 1:1000 | Cell Signaling | Cat# 12672, RRID: AB_2636961 |
| Rabbit monoclonal anti-SirT3 (D22A3), 1:1000 | Cell Signaling | Cat# 5490S, RRID:AB_10828246 |
| Rabbit polyclonal anti-SirT4 (H234), 1:500 | Santa Cruz | Cat# sc-135053, RRID:AB_10611045 |
| Rabbit monoclonal anti-SirT5 (G-2), 1:500 | Santa Cruz | Cat# sc-271635, RRID:AB_10707657 |
| Rabbit monoclonal anti-SirT6 (D8D12), 1:1000 | Cell Signaling | Cat# 12486, RRID: AB_2636969 |
| Mouse monoclonal anti-SirT7 (C-3), 1:500 | Santa Cruz | Cat# sc-365344, RRID:AB_10850175 |
| Mouse monoclonal anti-Actb, 1:5000 | Genscript | Cat# A00702, RRID:AB_914102 |
| Rabbit monoclonal anti-alpha-Tubulin, 1:1000 | Cell Signaling | Cat# 2125, RRID:AB_2619646 |
| Rabbit polyclonal anti-histone H1, 1:2000 | Active Motif | Cat# 61201, RRID: AB_2636962 |
| Rabbit polyclonal anti-histone H3, 1:2000 | Active Motif | Cat# 39163, RRID: AB_2614978 |
| Rabbit polyclonal anti-histone H3K9ac, 1:2000 | Active Motif | Cat# 39137, RRID: AB_2561017 |
| Rabbit polyclonal anti-histone H3K18ac, 1:2000 | Active Motif | Cat# 39587, RRID: AB_2636965 |
| Rabbit polyclonal anti-histone H3K56ac, 1:2000 | Epigentek | Cat# A-4026, RRID: AB_2636966 |
| Rabbit polyclonal anti-histone H4, 1:2000 | Active Motif | Cat# 39269, RRID: AB_2636967 |
| Rabbit polyclonal anti-histone H4K16ac, 1:2000 | Active Motif | Cat# 39167, RRID: AB_2636968 |
| Rabbit normal IgG, 2 μg (IP) | Cell Signaling | Cat# 2729, RRID:AB_2617119 |
| Anti-Mouse IgG secondary antibody, Alexa Fluor 594 conjugate, 1:200 (IF) | Thermo Fisher Scientific | Cat# A-11005, RRID: AB_141372 |
| Anti-Goat, IgG secondary antibody, Alexa Fluor 647 conjugate, 1:500 (IF) | Thermo Fisher Scientific | Cat# A-21244, RRID:AB_2535812 |
| Rabbit polyclonal anti-p53, 2 μg (IP) | Santa Cruz | Cat# sc-6243, RRID:AB_653753 |
| p53 Tumor Suppressor Protein antibody, 1:1000, 1:100 (IHC) | Leica Biosystems | Cat# NCL-p53-CM5p, RRID:AB_563933 |
| Rabbit polyclonal anti-FKHR, 2 μg (IP) | Santa Cruz | Cat# sc-11350, RRID:AB_640607 |
| Rabbit monoclonal anti-FOXO1 (C29H4), 1:1000 | Cell Signaling | Cat# 2880, RRID:AB_2106495 |
| Rabbit polyclonal anti-PGC-1-alpha, 2 μg (IP) | Santa Cruz | Cat# sc-13067, RRID:AB_2166218 |
| Rabbit monoclonal anti-PGC-1-alpha, 1:1000 | EMD Millipore | Cat# ST1202, RRID:AB_2237237 |
| Rabbit polyclonal anti-SOD-2 (FL-222), 2 μg (IP) | Santa Cruz | Cat# sc-30080, RRID:AB_661470 |
| Rabbit monoclonal anti-SOD-2 (B-1), 1:1000 | Santa Cruz | Cat# sc-133254, RRID:AB_2191811 |
| Rabbit polyclonal anti-CPS1 (H-140), 2 μg (IP) | Santa Cruz | Cat# sc-30060, RRID:AB_2084244 |
| Rabbit polyclonal anti-CPS1, 1:1000 | Abcam | Cat# ab3682, RRID:AB_304000 |
| Rabbit polyclonal anti-Acetylated-Lysine, 1:1000 | Cell Signaling | Cat# 9441S, RRID:AB_331805 |
| Mouse monoclonal anti-VDAC1/porin [20B12AF2], 1:1000 | Abcam | Cat# ab14734, RRID:AB_443084 |
| Rabbit monoclonal anti-Ki67, 1:100 (IHC) | Novus Biologicals | Cat# NB110-89717, RRID:AB_1217074 |
| Mouse monoclonal anti-αSMA, 1:2000, 1:500 (IF) | Sigma | Cat# A2547, RRID:AB_476701 |
| Rabbit mAb γH2AX, 1:100 (IF) | Cell Signaling | Cat# 9718, RRID:AB_2118009 |
| Succinyl-Lysine antibody, 1:1000 | E. Verdin lab | N/A |
| Rabbit polyclonal Vinculin, 1:1000 | Cell Signaling | Cat# 4650, RRID:AB_10559207 |
| Goat polyclonal anti-GFP, 1:1000 | Rockland | Cat# 600-101-215, RRID:AB_218182 |
| Bacterial and Virus Strains | ||
| Ad-PGC-1α | Gift from Pere Puigserver | N/A |
| Ad-GFP | Gift from Pere Puigserver | N/A |
| Ad-TERT | Constructed | Sahin et al., Nature 2011, PMID 21307849 |
| AAV-Cre | Penn Vector Core | AV-8-PV1091 |
| AAV-GFP | Penn Vector Core | AV-8-PV0146 |
| Chemicals, Peptides, and Recombinant Proteins | ||
| DMEM | ATCC | Cat# 30-2002 |
| FBS | Gemini Bio-products | Cat# 900-208 |
| Penicillin/Streptomyn solution | Corning | Cat# 30-002-CI |
| RIPA buffer | Boston Bioproducts | Cat# BP-115 |
| Sodium pyrophosphate | Sigma | Cat# 221368-100G |
| β-glycerophosphate | Sigma | Cat# G9422-10G |
| Sodium orthovanadate | Sigma | Cat# S6508-10G |
| Sodium fluoride | Sigma | Cat# S7920-100G |
| Nicotinamide | Sigma | Cat# N0636-100G |
| Trichostatin A | Sigma | Cat# T8552-1MG |
| Tween-20 | G-Biosciences | Cat# 9005-65-5 |
| cOmplete™ Protease Inhibitor Cocktail | Roche | Cat# 11 836 153 001 |
| Super Signal West Pico chemiluminescent substrate | Thermo Fisher Scientific | Cat# 34080 |
| Tris-HCl | Sigma | Cat# T5941-1KG |
| NaCl | Fisher BioReagents | Cat# BP358-10 |
| EDTA | Research Products International Corp. | Cat# E57020-1000.0 |
| EGTA | Research Products International Corp. | Cat# E57060-50.0 |
| Triton-X100 | Fisher BioReagents | Cat# BP151-500 |
| HEPES | Research Products International | Cat# H75030-250.0 |
| KCl | Research Products International | Cat# P41000-1000.0 |
| MgCl2 | Research Products International | Cat# M24000-500.0 |
| DTT | Sigma | Cat# D0632-5G |
| SDS | GenDepot | Cat# S0793-050 |
| NP-40 | Boston Bio Products | Cat# P-877 |
| TrueBlot® Anti-Rabbit Ig IP Agarose Bead | Rockland | Cat# 00-8800-25 |
| Laemmli buffer | Bio-Rad | Cat# 161-0737 |
| NAM | Sigma | Cat# 72340-100G |
| n-dodecyl-b-D-maltoside | Sigma | Cat# D4641-1G |
| Trizol reagent | Thermo Fisher Scientific | Cat# 15596026 |
| DNase I | New England Biolabs | Cat# M0303 |
| Protoscript II | New England Biolabs | Cat# M0368 |
| SensiFAST™ Probes | Bioline | Cat# BIO-86005 |
| SensiFAST™ SYBR Kit | Bioline | Cat# Bio-98020 |
| Cycloheximide | Sigma | Cat# C4859-1ML |
| RNasin | Promega | Cat# N2111 |
| miRCURY LNA™ miRNA Mimics | Exiqon | Table S3 |
| pmirGLO | Promega | Cat# E1330 |
| Lipofectamine 2000 | Thermo Fisher Scientific | Cat# 11668027 |
| Lipofectamine RNAiMAX | Thermo Fisher Scientific | Cat# 13778075 |
| Cy3-labeled control oligo | Thermo Fisher Scientific | Cat# AM17120 |
| miRCURY LNATM miRNA inhibitors | Exiqon | Table S3 |
| Dioleoyl-sn-glycero-3-phosphocholine | Sigma | Cat# P6354-25MG |
| PrimeSTAR GXL | TaKaRa | Cat# R050A |
| pGL3-basic | Promega | Cat# E1751 |
| PrimeSTAR MAX polymerase | TaKaRa | Cat# R045A |
| Lipofectamine® LTX with Plus™ Reagent | Thermo Fisher Scientific | Cat# 15338100 |
| MG132 | Enzo Life Science | Cat# BML-PI102 |
| CCl4 | Sigma | Cat# 289116-100ML |
| Nicotinamide mononucleotide | OYC Americas, Inc, ChromaDex | Cat# 44500900, Cat# 00014315 |
| 10% neutral buffered formalin | EMD Millipore | Cat# 65346-88 |
| Horse serum | Vector Laboratories | Cat# S-2000 |
| DAPI | MP Biomedicals | Cat# 157574 |
| Hematoxylin | Richard-Allan Scientific | Cat# 7211 |
| Xylene | Thermo Fisher Scientific | Cat# 6615 |
| Permount | Richard-Allan Scientific | Cat# 7211 |
| Critical Commercial Assays | ||
| Bradford assay | Bio-Rad | Cat#500-0006 |
| EpiQuik Total Histone Extraction Kit | Epigentek | Cat# OP-0006-100 |
| Density Gradient Fractionation System | Brandel | Cat# BR-188 |
| TaqMan MicroRNA Reverse Transcription kit | Thermo Fisher Scientific | Cat# 4366596 |
| Dual-Luciferase Reporter Assay System | Promega | Cat# E1910 |
| Transformer site-directed mutagenesis kit | TaKaRa | Cat# Z0702N |
| Complex I Activity Kit | Abcam | Cat# ab109721 |
| Complex IV activity Kit | Abcam | Cat# ab109911 |
| Picrosirius Red Stain kit | Polysciences | Cat# 24901-250 |
| Total Collagen Content assay | QuickZyme | Cat# QZBtotcol1 |
| ImmPRESS HRP Anti-Mouse IgG Polymer Detection Kit | Vector Laboratories | Cat# MP-7402 |
| ImmPRESS HRP Anti-Rabbit IgG Polymer Detection Kit | Vector Laboratories | Cat# MP-7401 |
| DAB substrate kit | Vector Laboratories | Cat# SK-4100 |
| ApopTag® Peroxidase In Situ Apoptosis Detection Kit | Millipore | Cat# S7100 |
| Experimental Models: Organisms/Strains | ||
| TERT deficient mice | Gift from R. DePinho | N/A |
| P53 knock-out mice | Jackson laboratory | Cat# 002101, RRID:IMSR_JAX: 002101 |
| miR-34a conditional knockout mice | Jackson Laboratory | Cat# 018545, RRID:IMSR_JAX:018545 |
| Albumin-Cre transgenic mice | Jackson Laboratory | Cat# 003574, RRID:IMSR_JAX:003574 |
| Sirt1 floxed mice | Jackson Laboratory | Cat# 008041, RRID:IMSR_JAX:008041 |
| Oligonucleotides | ||
| TaqMan probes, see table S1 | This paper | N/A |
| qPCR primer pairs, see table S1 | This paper | N/A |
| Mitochondrial DNA primer COXIF: CTGAGCGGGAATAGTGGGTA | This paper | N/A |
| Mitochondrial DNA primer COXIR: TGGGGCTCCGATTATTAGTG | This paper | N/A |
| Mitochondrial DNA primer CytBF: ATTCCTTCATGTCGGACGAG | This paper | N/A |
| Mitochondrial DNA primer CytBR: ACTGAGAAGCCCCCTCAAAT | This paper | N/A |
| Genomic DNA primer H19R: GTCCACGAGACCAATGACTG | This paper | N/A |
| Genomic DNA primer H19F: GTACCCACCTGTCGTCC | This paper | N/A |
| Genomic DNA primer B1globinF: GCACCTGACTGATGCTGAGAA | This paper | N/A |
| Genomic DNA primer B1globinR: TTCATCGGCGTTCACCTTTCC | This paper | N/A |
| Software and Algorithms | ||
| miRwalk | Dweep, H et al. | http://zmf.umm.uni-heidelberg.de/apps/zmf/mirwalk2/ |
| TargetScan | Agarwal et al., 2015 | http://www.targetscan.org/vert_71/ |
| miRanda | A.J. Enright et al., 2003 | http://www.microrna.org/microrna/getDownloads.do |
| Diana-microT | Paraskevopoulou MD et al., 2013 | http://diana.imis.athena-innovation.gr/DianaTools/index.php |
| RNA22 | Miranda, KC et al., 2006 | https://cm.jefferson.edu/rna22/ |
| RNAhybrid | Rehmsmeier, Marc and Steffen et al., 2004 | https://bibiserv.cebitec.uni-bielefeld.de/rnahybrid/ |
| miRDeep2 | Sebastian Mackowiak et al., 2011 | https://www.mdc-berlin.de/8551903/en/ |
| R Limma | Ritchie ME et al., 2015 | https://bioconductor.org/packages/release/bioc/html/limma.html |
| ImageJ | Rasband, W.S., 1997-2006 | https://imagej.nih.gov/ij/download.html |
| LabSolution | Shimadzu | http://www.shimadzu.com/an/labsolutions-cs/index.html |
| Other | ||
| TelC-Cy3 telomere probe: CCCTAACCCTAACCCTAA | PNABio | Cat# F1002 |
| RNA sequencing data | This paper | GEO accession number GSE125847 |
Immunoprecipitation (IP)
Cells:
Cells were washed with PBS and lysed with IP buffer (20 mM Tris-HCl, pH 7.5, 150 mM NaCl, 1.0 mM EDTA, 1.0 mM EGTA, 1.0% Triton X-100) containing a protease inhibitor cocktail along with 2.5 mM sodium pyrophosphate, 1.0 mM β-glycerophosphate, 1.0 mM sodium orthovanadate, 10 mM sodium fluoride, 10 mM NAM, and 1.0 μM TSA.
Liver tissue:
Nuclear fractions were prepared according to published methods. Briefly, 300 mg of frozen liver tissue was pulverized in a liquid nitrogen cooled mortar and homogenized in Buffer A (10 mM HEPES, pH 7.9, 10 mM KCl, 1.5 mM MgCl2, 0.5 mM DTT) containing a protease inhibitor cocktail as well as 2.5 mM sodium pyrophosphate, 1.0 mM β-glycerophosphate, 1.0 mM sodium orthovanadate, 10 mM NAM, and 1.0 μM TSA in a chilled glass Dounce homogenizer. The extracts were centrifuged with a Eppendorf 5415R centrifuge at 1,000 rpm for 5 minutes at 4° C and pellets were resuspended in Buffer B (0.1% SDS, 0.5% sodium deoxycholate, 1.0% NP-40 in PBS) containing a protease inhibitor cocktail (Roche, 2.5 mM sodium pyrophosphate, 1.0 mM β-glycerophosphate, 1.0 mM sodium orthovanadate, 10 mM sodium fluoride,) 10 mM NAM, and 1.0 μM TSA. Lysates were centrifuged at 15,000 x g at 4° C for 10 minutes and 500 μg of protein was precleared with IgG beads (Rockland) for 30 minutes at 4° C. Pre-cleared extracts were incubated with antibodies at 4° C overnight (all antibodies and dilutions used in this study are listed under “Antibodies” in “Key Resource Table”) and IgG beads were added and rotated at 4° C for 2 hours. IgG beads were washed with PBS three times, boiled with 2x Laemli buffer at 95°C for 5 minutes, and the supernatant was subjected to western blot analysis.
Histone extraction
Histone extracts were prepared from mouse liver tissues and MEFs using EpiQuik Total Histone Extraction Kit (Epigentek) following the manufacturer’s instructions.
RNA isolation, cDNA synthesis and Real-time PCR
Trizol reagent (Thermo Fisher Scientific) was used to extract total RNA from cells and liver tissue. RNA was digested with DNase I (NEB) and further purified with RNeasy Mini columns (QIAGEN). 0.5 μg of total RNA was used for the reverse transcription reaction with Protoscript II (NEB). Quantitative PCR was performed using SensiFAST™ Probes or SensiFAST™ SYBR kit (BIOLINE) in a realplex4 thermocycler (Eppendorf). The primer sequences and TaqMan (Thermo Fisher Scientific) probes used for qPCR are shown in Table S1. The ΔΔCT method was used to calculate abundance of transcripts.
Polysomal fractionation
Confluent mouse embryonic fibroblasts were lysed in TMK buffer (10 mM Tris-HCl, pH 7.4, 5 mM MgCl2, 100 mM KCl, 0.5% sodium deoxycholate, 1.0% Triton X-100) containing 100 μg/mL Cycloheximide, protease inhibitor cocktail (Roche), 2 mM DTT, and 1000 U/mL of RNasin (Promega), and centrifuged at 16,000 x g at 4° C for 10 minutes. The supernatant was over-layed on a 10-50% linear sucrose density gradient (20 mM HEPES, pH 7.4, 5 mM MgCl2, 100 mM KCl, 2 mM DTT) in a Polyallomer centrifuge tube (Beckman Coulter) and centrifuged at 28,000 rpm for 4 hours at 4° C in a SW-40 rotor (Beckman). The gradient was fractionated into 20 aliquots in separate tubes using Density Gradient Fractionation System (Brandel, BR-188). RNA from polysomal fractions #9-17 was extracted with Trizol LS according to the manufacturer’s instructions. cDNA synthesis and RT-qPCR analysis were performed as described above.
Mitochondrial isolation and analysis
Mitochondria were isolated from liver tissue following a standard protocol as described before(Sahin et al., 2011). Briefly, freshly minced liver tissue was rinsed with cold PBS and cold LHM buffer (0.2M Mannitol, 50 mM Sucrose, 10 mM KCl, 1.0 mM EDTA, and 10 mM HEPES, pH 7.4) and then homogenized in LHM buffer containing protease inhibitors (Roche Applied Science), 10 mM NAM, and 1.0 μM TSA using a chilled glass Dounce homogenizer. Homogenates were centrifuged first at 1,000 x g at 4° C for 10 min and then re-centrifuged at 3,000 x g at 4° C for 10 min. Mitochondrial pellets were then re-suspended in LHM buffer and re-centrifuged at 3,000 x g at 4° C for 10 min three times. To prepare mitochondrial protein lysates, isolated mitochondria were lysed in MIP buffer supplemented with inhibitors (50 mM Tris-HCl, pH 7.4, 150 mM NaCl, 1% n-dodecyl-b-D-maltoside, 0.5 mM EDTA supplemented with protease inhibitors, 2.5 mM sodium pyrophosphate, 1.0 mM β-glycerophosphate, 1.0 mM sodium orthovanadate, 10 mM sodium fluoride, 10 mM NAM, and 1.0 μM TSA). Lysates were then centrifuged at 10,000 x g for 10 min at 4° C. The protein concentration was determined by Bradford assay. Western blot and immunoprecipitation was performed as described above.
Complex I and complex IV activity
Complex I and IV was measured in liver tissues using a complex I and IV activity assay kit (Abcam) following the provided protocols. Relative activities were blotted using WT or G4 untreated mice as reference to which NMN - treated mice were compared.
Mitochondrial DNA (mtDNA) copy number quantification
mtDNA copy number was quantified by qPCR from isolated total liver DNA using previously described primer pairs for genomic and mitochondrial loci(Sahin et al., 2011). 50 ng of total liver DNA was used in each qPCR reaction. All samples were measured in triplicates and qPCR results were confirmed by three independent experiments. Two different primer pairs were used to quantify relative mtDNA copy number: COXI and Cytochrome b for mitochondrial and β-Globin and H-19 for genomic DNA. The primer sequences are listed in “Key Resource Table” under “Oligonucleotides”. Q-PCR data were analyzed by the ΔΔ CT method.
MiRNA studies
In sillico miRNA target prediction
In order to identify potential target sites within Sirtuin 3’UTRs for candidate miRNAs, we used several miRNA prediction tools (miRwalk, TargetScan, miRanda, Diana-microT, RNA22, and RNAhybrid) using the default parameters. Predicted binding sites are listed in Table S2.
MiRNA isolation and quantification by qPCR
To quantify individual miRNAs, total RNA was extracted with Trizol. 10 ng of total RNA was reverse transcribed using a TaqMan MicroRNA Reverse Transcription kit (Thermo Fisher Scientific). TaqMan probes (Thermo Fisher Scientific, see Table S1) were used to quantify expression levels of miRNAs by qPCR using the ΔΔCT method.
MiRNA-seq
RNA from five G4/p53 +/+ and six G4/p53 −/− livers were isolated, and samples were sequenced on HiSeq2000 with SR50 reads at the Dana-Farber Cancer Center Genomics Core (Boston, MA). Reads were trimmed and subsequently aligned to mouse miRNA reference from miRBase release 17. miRNA abundance quantification was performed using miRDeep2. Resulting read count for each miRNA was transformed into Read Per Million (RPM). miRNAs that had <=3 RPM in all samples were filtered out, as those miRNAs were consistently undetected in all samples. A linear model was built for the remaining miRNAs using the R Limma package to identify significantly differentially expressed miRNAs (p-value<0.05) between the corresponding two sample groups.
MiRNA mimetic luciferase studies
In 293 cells, 2.5 pmol of miRCURY LNA™ miRNA Mimics (Exiqon) were co-transfected with 100 ng of pmirGLO containing the 3’UTR of Sirtuins or β-Actin using Lipofectamine 2000 (Thermo Fisher Scientific). Luciferase assays were performed 24 hours after transfection using Dual-Luciferase Reporter Assay System (Promega) in a luminometer (Tecan) according to the manufacturer’s instructions. The results were normalized by Renilla luciferase. Three independent studies in triplicates were done per mimetic.
MiRNA mimic transfection and western blot
Wild-type mouse embryonic fibroblasts were plated on 60 mm dish and grown for 16 hours prior transfection. The cells were transfected with 180 nmol of miRCURY LNA™ miRNA Mimics (Exiqon) using Lipofectamine RNAiMAX (Thermo Fisher Scientific). The cells were changed to fresh media the next day and harvested 48 hours after transfection. The transfection efficiency was monitored by a Cy3-labeled control oligo (Thermo Fisher Scientific). Western blot analysis was performed as indicated above. miRNA mimics and controls used are listed in Table S3.
Liposomal miRNA-inhibitor studies
For in vivo delivery, miRCURY LNATM miRNA inhibitors (Exiqon) were incorporated into dioleoyl-snglycero-3-phosphocholine (DOPC). DOPC and miRNA-mimetic were mixed in the presence of excess tertiary butanol at a ratio of 1:10 (w/w) miRNA/DOPC. The complexed inhibitors were IP injected at 250ng/g body weight. Liver tissue was harvested 48 hours after injection, and qPCR and western blot were performed to determine Sirtuin mRNA and protein abundance. All miRNA inhibitors and controls used are listed in Table S3.
Luciferase studies
Luciferase promoter studies
Promoter fragments of mouse Sirt1-7 were amplified with PrimeSTAR GXL (TAKARA) using wild type MEF genomic DNA as template and specific primers containing restriction enzyme sites. PCR products were cloned upstream of the Firefly luciferase gene into pGL3-basic (Promega). All primer sequences for the constructs are shown in Table S4. WT, p53 −/−, G4/p53 +/+ and G4 p53 −/− MEFs were transfected with pGL3 basic vector containing promoter elements and pRL-SV40 expressing wild type Renilla luciferase. Luciferase activity was determined 24 hours after transfection and normalized to Renilla signal.
Luciferase 3’UTR studies
3’UTRs of Sirt1-7 and β-Actin (serving as control) were amplified with PrimeSTAR MAX polymerase (TAKARA) using wild type liver cDNA as a template. Amplification primers are listed in Supplementary Table S4. PCR products were cloned downstream of the Firefly luciferase gene in pmirGLO (Promega). Site-directed mutagenesis of predicted miRNA binding sites in Sirtuin 3’UTRs was carried out with a site-directed mutagenesis kit (Transformer, TAKARA) according to the manufacturer’s instructions. All primer sequences for mutagenesis are shown in Table S5. MEFs (WT, p53 −/−, G4/p53 +/+, and G4 p53 −/−) were plated in 24-well plates and grown for 16 hours prior to transfection. Cells were transfected with 500 ng of pmirGLO-3’UTR of Sirtuins and β-Actin using Lipofectamine LTX and PLUS reagent (Thermo Fisher Scientific). Luciferase activity was determined 24 hours after transfection.
Proteosome studies
Proteasome inhibition was elicited by the addition of 1.0 μM MG132 (Enzo Life science) to the medium and subsequent incubation for 4 hours.
Adenovirus studies
Ad-PGC-1α and Ad-GFP
Ad-PGC-1α and Ad-GFP adenovirus were a gift of Pere Puigserver (Harvard Medical School) and was expanded and concentrated by Welgen Inc, Worcester, MA. WT MEFs were infected at a multiplicity of infection (MOI) of 5 with adenovirus expressing either PGC-Ια or GFP. Protein and RNA was harvested 48 hours after infection. RT-qPCR and western blot analyses were performed as detailed above.
Ad-TERT
G4 mice were injected 1 x 10¹⁰ PFU of Ad-Tert or Ad-GFP via tail vein. 96 hours post infection, mice were sacrificed, and tissues were shock-frozen in liquid nitrogen for subsequent RNA and protein analysis.
Liver fibrosis studies
CCl4 fibrosis induction
8-16 week old male mice were subjected to intraperitoneal injections of CCl4 dissolved in olive oil (20% v/v) at 2 μL/g body weight or with olive oil as control twice per week. Injections were repeated 12x over a 6-week period. Seventy-two hours after the last CCl4 injection mice were sacrificed and liver tissue processed.
TAA fibrosis model
TAA was administered at a concentration of 0.3g/l in drinking water. Mice were treated with TAA for 4 weeks.
NMN treatment
NMN was purchased from OYC Americas, Inc., dissolved in drinking water at 5 mM. Water containing NMN was changed twice a week.(Mills et al., 2016) Mice received NMN or plain water 2 weeks prior to TAA and NMN administration and continued to receive NMN or plain over the whole course of CCL4 or TAA treatment, 6 and 4 weeks respectively.
Sirius red staining
Liver tissue was fixed in 10% neutral buffered formalin and embedded in paraffin. Deparaffinized and rehydrated 10 μm liver sections were stained using the picrosirius red staining kit (Polysciences, Inc) according to the manufacturer’s instructions. as described previously. Sections were stained in phosphomolybdic acid for 2 minutes followed by 1 hour in picrosirius red solution, 2 minutes in acidified water and 45 seconds in 70% ethanol. Slides were dehydrated in ethanol gradient, cleared in xylene and mounted in Permount medium. Quantification of fibrotic area was performed with ImageJ (NIH) using 10 random low-power (40x) images per mouse after exclusion of capsule and vessel areas. Data is presented as percent fibrotic area.
Hepatic hydroxyproline content
Hydroxyproline content was analyzed using the Total Collagen Assay from QuickZyme according to the manufacturer’s instructions. Briefly, liver tissues were hydrolyzed at a concentration of 100 mg/ml in 6N HCl at 95° C for 20 hrs. Several dilutions were generated from cleared hydrolysates with 4M HCl and 35 μl of the diluted hydrolysates was used against a collagen standard to quantify hydroxyproline content photometrically at 570nm. The results are expressed as micrograms hydroxyproline per gram liver tissue.
Fibrosis score
Histologic scoring of liver fibrosis was performed in Sirius red-stained liver sections following a 5-point scale by a scorer who was blinded for the genotypes. The 5-point scale is defined as F0 = no fibrosis; F1 = mild fibrosis without bridging septa; F2 = advanced fibrosis with few septa; F3 = advanced fibrosis with numerous septa, without cirrhosis; F4 = cirrhosis). We scored also intermediate states (F0/F1; F1/F2 etc.).
Assessment of fibrosis by RT-qPCR
Markers of fibrogenesis and fibrinolysis were quantified by RT-qPCR (primers are listed in Table S1 under “qPCR primer pairs”).
Immunofluorescence to detect activated hepatic stellate cells
Deparaffinized and rehydrated 10 μm liver sections were heated in TE buffer (10 mM Tris-Cl, pH 8.0, 1 mM EDTA, 0.05% Tween 20) in a microwave for 20 min and treated with 3% H2O2 for 15 min at room temperature. Sections were then blocked with 2.5% horse serum at room temperature for 1 hour and incubated with αSMA antibody (A2547, Sigma) at 4° C overnight. After several PBS washes, slides were incubated with anti-mouse IgG secondary antibody, Alexa Fluor 594 conjugate (A-11005, Thermo Fisher Scientific) at room temperature for 1 hour. Slides were counterstained with DAPI. After washing in PBS, the slides were mounted with anti-fade mounting media.
Transaminase quantification
Alanine aminotransferase (ALT) and aspartate aminotransferase (AST) were determined at the Mouse Metabolism Core at Baylor College of Medicine.
IHC for Ki-67
For immunostaining, 10 μm liver sections were deparaffinized, rehydrated, treated with antigen retrieval buffer, and blocked as described above. The sections were incubated with anti-Ki-67 antibody (NB110-89717, Novus Biologicals) at 4°C overnight. After washing in PBS, slides were incubated with ImmPRESS HRP Anti-Mouse IgG Polymer (Vector Laboratories) at room temperature for 1 hour. The sections were developed with the DAB substrate (Vector Laboratories) and counterstained with hematoxylin. After rehydrating with ethanol and soaking in xylene, slides were mounted with Permount.
Apoptosis
Apoptotic cells were stained with ApopTag® Peroxidase In Situ Apoptosis Detection Kit (Millipore) as directed by the manufacturer.
IHC for p53
Paraffin embedded tissues were cut and slides were deparaffinized and rehydrated. Antigen retrieval was performed in a pressure cooker (30 minutes at 109°C). Tissues were permeabilized for 30 minutes with 0.5% Triton dissolved in PBS followed by 20 minute incubation in 3% H2O2 to quench endogenous peroxidases. Tissue slides were blocked for 1 hour in 5% BSA/TBST. P53 was detected with a rabbit CM5 antibody (NCL-p53-CM5p, Leica Biosystems) at a dilution of 1:100 overnight and an ImmPRESS™ HRP Anti-Rabbit IgG (Peroxidase) Polymer Detection Kit (Vector). Slides were developed using the DAB Substrate Kit (Vector), counterstained in Hematoxylin and mounted in Permount. P53 positive cells were identified as cells with dark nuclear staining and were counted per high – power field in 5 random sections per mouse. Eight mice per group were analyzed in TAA experiments.
Immunofluorescence (IF) for γH2AX
Paraffin embedded tissues were cut and slides were deparaffinized and rehydrated. Antigen retrieval was performed in a pressure cooker (30 minutes at 109°C). Autofluorescence was quenched by incubating tissue slides in 50mM NH4Cl/PBS and tissues were permeabilized in 0.5% Triton for 1 hour. Tissue slides were blocked for 1 hour in 5% BSA/TBST. γH2AX immunostaining was carried out using a rabbit Phospho-Histone γH2AX antibody (Cell Signaling) overnight followed by anti-rabbit cross-adsorbed secondary antibody, Alexa Fluor 647 (Thermo Fisher Scientific) for 1 hour. Slides were counterstained in DAPI and mounted in Fluoromount.. Imaging and analysis was performed as described in section for telomere-induced foci (see below). Liver sections from gamma-irradiated mice were used as positive control to detect γH2AX. Per mouse, between 50 and 70 nuclei in 5 randomly selected fields were analyzed. Eight mice per group were analyzed in TAA experiments.
HPLC analysis of NAD(+) in liver tissue
Sample preparation:
Frozen livers were weighed in a 1.5 mL tube. For determination of NAD(+), 500 μl of 0.6M PCA was added to the tissue and homogenized with a bead beater (Qiagen) for 1 minute at 4 °C. The suspension was placed on ice for 15 m in and then centrifuged at 16,000x g for 15 min. The supernatant was transferred to a spin column (Spin-X Centrifuge Tube Filter, 0.22 μm Nylon, Corning) and subsequently centrifuged at 16,000x g for 15 min to completely remove insoluble materials in the sample. The eluate was transferred to a new tube. Samples were stored at −80 °C and subjected to HPLC analysis.
HPLC conditions:
Separation of NAD (+) was carried out on an YMC-Pack ODS-A column (5 μm, 4.6 x 250 mm) preceded by a guard column at 50 °C. Flow rate was set at 0.4 mL/min. The mobile phase was initially 100% of mobile phase A (0.1 M potassium phosphate buffer, pH 6.0, containing 3.75% methanol). Methanol was increased at a linear rate with mobile phase B (0.1 M potassium phosphate buffer, pH 6.0, containing 30% methanol); increasing to 50% over 15 min. The column was washed after each separation by increasing mobile phase B to 100% for 5 min. UV absorbance was monitored at 260 nm and 340 nm with Shimadzu SPD-M20A. Pertinent peak areas were integrated by the LabSolution software from Shimadzu, and quantified using standard curves and normalized to weights of frozen tissues.
Telomere length measurement by quantitative fluorescence in situ hybridization (QFISH)
Hybridization:
Formalin-fixed tissue sections, 10 μm thick, were deparaffinized, hydrated, and immersed in citrate buffer for heat-induced antigen retrieval using a pressure cooker (30 minutes at 109°C). Tissue slides were then were allowed to coo l and subsequently quenched with 50mM NH4Cl in PBS for 30 minutes, followed by PBS washes and permeabilization in 0.5% Triton X-100 in PBS for 1 hour. A TelC-Cy3 probe (PNA Bio, dissolved in 70% formamide, 10mM Tris-HCl, pH7.5, 0.5% B/M blocking reagent (Roche) at a final concentration of 0.3 ng/μ) was added to slides that were incubated at 84°C for 7 minutes in a humidified chamber and then hybridized at room temperature for 2 hours. Tissues were then counterstained with DAPI and mounted in Fluoromount medium after 3 washes with PNA wash solution and PBS.
Image acquisition:
To collect the population data on telomere length, a GE Healthcare DV Live epifluorescence image restoration microscope was used with an Olympus PlanApo 100x/1.4 NA objective and a 1.9k x 1.9x sCMOS camera. Z stacks (0.20μm) covering the whole nucleus (~10μm) were acquired before applying a conservative restorative algorithm for quantitative image deconvolution. Exposures for DAPI and Cy3 were set on the wild type (non-treated) control samples and held constant within each set of samples to be comparable. Maximum intensity projections were generated and used for image analysis. 10 random images per mouse were taken at 40x.
Quantification of telomere length:
Analysis was conducted according to the Telometer program available online (http://demarzolab.pathology.jhmi.edu/telometer/.). The program is based on the subtraction of background noise, identification of the individual telomere spots, removal of halos and separation of conjoined telomeres and generation of telomere intensity values for each cell (proportional to telomere length) divided over the total DAPI intensity (proportional to total nuclear DNA content). The reported statistics include the intensity sum of all Cy3 telomere pixels for a single nucleus, which is proportional to telomere length as well as the intensity sum of all DAPI pixels for the nucleus, which is proportional to total nuclear DNA content. The calculation of the ratio of the telomere intensity sum to the corresponding DAPI intensity sum allows for correction of potential ploidy differences as well as the potential of presence of variable fractions of nuclei in the cutting plane of the tissue section. The product is multiplied by 10,000 to generate an arbitrary unit that is easier to compare. The analysis was carried out by two different genotype-blinded investigators 10 random images were analyzed with 60-80 nuclei per mouse. Per group eight mice were analyzed, totaling between 560-640 nuclei per group. The results are expressed at Telomere Fluorescence Intensity.
Telomere dysfunction induced foci (TIF)
To determine the presence of DNA damage signal at telomeres, telomeres were labeled with a Cy3-labeled PNA telomeric probe (PNA Bio) as described above followed by immunofluorescence - based staining for the DNA damage marker γH2AX. γH2AX immunostaining was performed using a rabbit γH2AX antibody (9718, Cell Signaling) overnight, followed by anti-rabbit, Alexa Fluor 647 labeled secondary antibody (A-21244, Thermo Fisher Scientific). Slides were counterstained in DAPI and mounted in Fluoromount medium. Imaging and analysis was performed as described in previous section. Liver sections from gamma-irradiated mice were used as positive control to identify γH2AX signals unequivocally. Quantification of TIFs was done manually by determining the co-localization of telomere probe and γH2AX foci. 50 hepatocytes per mouse were assessed and a total of 8 mice per group were analyzed. The results are plotted as number of TIFs per cell.
Quantification and Statistical Analysis
Statistical analysis was performed with GraphPad Prism (GraphPad Software, La Jolla, CA, USA). Results are presented as mean values ± s.e.m. Student’s t-test was used to determine the statistical differences between two groups. P-values less than 0.05 were considered statistically significant. The statistical parameters including numbers and significance are reported in the figure legends.
Data and Software Availability
RNaseq data have been deposited in GEO and the accession number is GSE125847
Supplementary Material
Table S1 – TaqMan probes and qPCR primer pairs. Related to STAR methods.
Table S2 – Predicted miRNA targets. Related to the Main text and STAR methods.
Table S3 – List of miRNA mimics and inhibitors. Related to STAR methods.
Table S4 – Primers for promoter analysis. Related to STAR methods.
Table S5 – 3’UTR and mutagenesis primers. Related to STAR methods.
Highlights.
-
-
Telomere dysfunction downregulates sirtuins in the liver in a p53-dependent manner
-
-
p53 represses sirtuins through transcriptional and posttranscriptional mechanisms
-
-
Telomere dysfunction is linked to a steep decline in NAD(+) upon additional damage
-
-
NAD(+) supplementation stabilizes telomeres and improves liver fibrosis
Acknowledgments
This work was in part supported by the Ted Nash Long Life Foundation, Edward Mallinckrodt Jr. Foundation and NIA RO1 grant (R01AG047924), all to E. S. Histological services were supported in part by PHS grant P30DK056338 to the Texas Medical Center Digestive Diseases Center. Y.V.P. is supported by a grant from PSC Partners for Cure Canada. C.R.A. was supported by the NIH through the Ovarian SPORE Career Enhancement Program FP00000019. A.C. was supported by R01DK115454, by the Ted Nash Long Life Foundation, and is a CPRIT Scholar in Cancer Research (RR140038). J.R.N. is the Athena Water Breast Cancer Research Scholar of the American Cancer Society (RSG-15-088-01RMC) and his work is supported by NCI grant CA190467. D.A.S. is supported by the Glenn Foundation for Medical Research and grants from the NIH (R37 AG028730, R01 AG019719, R21 DE027490 and R01 DK100263). J.A.B. is supported by NIH grants DK098656 and AG043483. Imaging for this project was supported by the Integrated Microscopy Core at Baylor College of Medicine with funding from NIH (DK56338, and CA125123), CPRIT (RP150578, RP170719), the Dan L. Duncan Comprehensive Cancer Center, and the John S. Dunn Gulf Coast Consortium for Chemical Genomics. We thank Bill Lagor, BCM, for continuous discussions and feedback.
Footnotes
Publisher's Disclaimer: This is a PDF file of an unedited manuscript that has been accepted for publication. As a service to our customers we are providing this early version of the manuscript. The manuscript will undergo copyediting, typesetting, and review of the resulting proof before it is published in its final citable form. Please note that during the production process errors may be discovered which could affect the content, and all legal disclaimers that apply to the journal pertain.
Declaration of Interests
J.A.B. is an inventor on a patent involving the use of NAD precursors to treat liver injuries. D.A.S. is a founder, equity owner, board member, advisor to, director of, consultant to, investor in and/or inventor on patents licensed to Vium, Jupiter Orphan Therapeutics, Cohbar, Galilei Biosciences, GlaxoSmithKline, OvaScience, EMD Millipore, Wellomics, Inside Tracker, Caudalie, Bayer Crop Science, Longwood Fund, Zymo Research, EdenRoc Sciences (and affiliates Arc-Bio, Dovetail Genomics, Claret Bioscience, Revere Biosensors, UpRNA and MetroBiotech, Liberty Biosecurity). Life Biosciences (and affiliates Selphagy, Senolytic Therapeutics, Spotlight Biosciences, Animal Biosciences, Iduna, Immetas, Prana, Continuum Biosciences, Jumpstart Fertility, and Lua. D.A.S. sits on the board of directors of both companies. DAS is an inventor on a patent application licensed to Elysium Health. His personal royalty share is directed to the Sinclair lab.
Supplemental Information
Supplemental documents include five Supplemental Fig 1–5 and five Supplemental Tables S1 – S5.
References:
- AHMED W & LINGNER J 2018. PRDX1 and MTH1 cooperate to prevent ROS-mediated inhibition of telomerase. Genes Dev, 32, 658–669. [DOI] [PMC free article] [PubMed] [Google Scholar]
- ARMANIOS M & BLACKBURN EH 2012. The telomere syndromes. Nat Rev Genet, 13, 693–704. [DOI] [PMC free article] [PubMed] [Google Scholar]
- BAI P & CANTO C 2012. The role of PARP-1 and PARP-2 enzymes in metabolic regulation and disease. Cell Metab, 16, 290–5. [DOI] [PubMed] [Google Scholar]
- BENEKE S, COHAUSZ O, MALANGA M, BOUKAMP P, ALTHAUS F & BURKLE A 2008. Rapid regulation of telomere length is mediated by poly(ADP-ribose) polymerase-1. Nucleic Acids Res, 36, 6309–17. [DOI] [PMC free article] [PubMed] [Google Scholar]
- CALADO RT & YOUNG NS 2009. Telomere diseases. N Engl J Med, 361, 2353–65. [DOI] [PMC free article] [PubMed] [Google Scholar]
- CANTO C, HOUTKOOPER RH, PIRINEN E, YOUN DY, OOSTERVEER MH, CEN Y, FERNANDEZ-MARCOS PJ, YAMAMOTO H, ANDREUX PA, CETTOUR-ROSE P, GADEMANN K, RINSCH C, SCHOONJANS K, SAUVE AA & AUWERX J 2012. The NAD(+) precursor nicotinamide riboside enhances oxidative metabolism and protects against high-fat diet-induced obesity. Cell Metab, 15, 838–47. [DOI] [PMC free article] [PubMed] [Google Scholar]
- CASTRO RE, FERREIRA DM, AFONSO MB, BORRALHO PM, MACHADO MV, CORTEZ-PINTO H & RODRIGUES CM 2013. miR-34a/SIRT1/p53 is suppressed by ursodeoxycholic acid in the rat liver and activated by disease severity in human non-alcoholic fatty liver disease. J Hepatol, 58, 119–25. [DOI] [PubMed] [Google Scholar]
- CHANG AC, ONG SG, LAGORY EL, KRAFT PE, GIACCIA AJ, WU JC & BLAU HM 2016. Telomere shortening and metabolic compromise underlie dystrophic cardiomyopathy. Proc Natl Acad Sci U S A. [DOI] [PMC free article] [PubMed] [Google Scholar]
- CHIN L, ARTANDI SE, SHEN Q, TAM A, LEE SL, GOTTLIEB GJ, GREIDER CW & DEPINHO RA 1999. p53 deficiency rescues the adverse effects of telomere loss and cooperates with telomere dysfunction to accelerate carcinogenesis. Cell, 97, 527–38. [DOI] [PubMed] [Google Scholar]
- CONCEPCION CP, HAN YC, MU P, BONETTI C, YAO E, D’ANDREA A, VIDIGAL JA, MAUGHAN WP, OGRODOWSKI P & VENTURA A 2012. Intact p53-dependent responses in miR-34-deficient mice. PLoS Genet, 8, e1002797. [DOI] [PMC free article] [PubMed] [Google Scholar]
- GOMEZ M, WU J, SCHREIBER V, DUNLAP J, DANTZER F, WANG Y & LIU Y 2006. PARP1 Is a TRF2-associated poly(ADP-ribose)polymerase and protects eroded telomeres. Mol Biol Cell, 17, 1686–96. [DOI] [PMC free article] [PubMed] [Google Scholar]
- GOTTSCHLING DE, APARICIO OM, BILLINGTON BL & ZAKIAN VA 1990. Position effect at S. cerevisiae telomeres: reversible repression of Pol II transcription. Cell, 63, 751–62. [DOI] [PubMed] [Google Scholar]
- GUARENTE L 2000. Sir2 links chromatin silencing, metabolism, and aging. Genes Dev, 14, 1021–6. [PubMed] [Google Scholar]
- HARTMANN D, SRIVASTAVA U, THALER M, KLEINHANS KN, N’KONTCHOU G, SCHEFFOLD A, BAUER K, KRATZER RF, KLOOS N, KATZ SF, SONG Z, BEGUS-NAHRMANN Y, KLEGER A, VON FIGURA G, STRNAD P, LECHEL A, GUNES C, POTTHOFF A, DETERDING K, WEDEMEYER H, JU Z, SONG G, XIAO F, GILLEN S, SCHREZENMEIER H, MERTENS T, ZIOL M, FRIESS H, JAREK M, MANNS MP, BEAUGRAND M & RUDOLPH KL 2011. Telomerase gene mutations are associated with cirrhosis formation. Hepatology, 53, 1608–17. [DOI] [PubMed] [Google Scholar]
- HOUTKOOPER RH, PIRINEN E & AUWERX J 2012. Sirtuins as regulators of metabolism and healthspan. Nat Rev Mol Cell Biol, 13, 225–238. [DOI] [PMC free article] [PubMed] [Google Scholar]
- IMAI S & GUARENTE L 2014. NAD+ and sirtuins in aging and disease. Trends Cell Biol, 24, 464–71. [DOI] [PMC free article] [PubMed] [Google Scholar]
- KONG X, WANG R, XUE Y, LIU X, ZHANG H, CHEN Y, FANG F & CHANG Y 2010. Sirtuin 3, a new target of PGC-1alpha, plays an important role in the suppression of ROS and mitochondrial biogenesis. PLoS One, 5, e11707. [DOI] [PMC free article] [PubMed] [Google Scholar]
- LAGOUGE M, ARGMANN C, GERHART-HINES Z, MEZIANE H, LERIN C, DAUSSIN F, MESSADEQ N, MILNE J, LAMBERT P, ELLIOTT P, GENY B, LAAKSO M, PUIGSERVER P & AUWERX J 2006. Resveratrol improves mitochondrial function and protects against metabolic disease by activating SIRT1 and PGC-1alpha. Cell, 127, 1109–22. [DOI] [PubMed] [Google Scholar]
- MAICHER A, KASTNER L, DEES M & LUKE B 2012. Deregulated telomere transcription causes replication-dependent telomere shortening and promotes cellular senescence. Nucleic Acids Res, 40, 6649–59. [DOI] [PMC free article] [PubMed] [Google Scholar]
- MARTIN SG, LAROCHE T, SUKA N, GRUNSTEIN M & GASSER SM 1999. Relocalization of telomeric Ku and SIR proteins in response to DNA strand breaks in yeast. Cell, 97, 621–33. [DOI] [PubMed] [Google Scholar]
- MICHISHITA E, MCCORD RA, BERBER E, KIOI M, PADILLA-NASH H, DAMIAN M, CHEUNG P, KUSUMOTO R, KAWAHARA TL, BARRETT JC, CHANG HY, BOHR VA, RIED T, GOZANI O & CHUA KF 2008. SIRT6 is a histone H3 lysine 9 deacetylase that modulates telomeric chromatin. Nature, 452, 492–6. [DOI] [PMC free article] [PubMed] [Google Scholar]
- MILLS KD, SINCLAIR DA & GUARENTE L 1999. MEC1-dependent redistribution of the Sir3 silencing protein from telomeres to DNA double-strand breaks. Cell, 97, 609–20. [DOI] [PubMed] [Google Scholar]
- MILLS KF, YOSHIDA S, STEIN LR, GROZIO A, KUBOTA S, SASAKI Y, REDPATH P, MIGAUD ME, APTE RS, UCHIDA K, YOSHINO J & IMAI SI 2016. Long-Term Administration of Nicotinamide Mononucleotide Mitigates Age-Associated Physiological Decline in Mice. Cell Metab, 24, 795–806. [DOI] [PMC free article] [PubMed] [Google Scholar]
- MOUCHIROUD L, HOUTKOOPER RH, MOULLAN N, KATSYUBA E, RYU D, CANTO C, MOTTIS A, JO YS, VISWANATHAN M, SCHOONJANS K, GUARENTE L & AUWERX J 2013. The NAD(+)/Sirtuin Pathway Modulates Longevity through Activation of Mitochondrial UPR and FOXO Signaling. Cell, 154, 430–41. [DOI] [PMC free article] [PubMed] [Google Scholar]
- MUKHERJEE S, CHELLAPPA K, MOFFITT A, NDUNGU J, DELLINGER RW, DAVIS JG, AGARWAL B & BAUR JA 2017. Nicotinamide adenine dinucleotide biosynthesis promotes liver regeneration. Hepatology, 65, 616–630. [DOI] [PMC free article] [PubMed] [Google Scholar]
- NEWELL P, VILLANUEVA A, FRIEDMAN SL, KOIKE K & LLOVET JM 2008. Experimental models of hepatocellular carcinoma. J Hepatol, 48, 858–79. [DOI] [PMC free article] [PubMed] [Google Scholar]
- OBERDOERFFER P, MICHAN S, MCVAY M, MOSTOSLAVSKY R, VANN J, PARK SK, HARTLERODE A, STEGMULLER J, HAFNER A, LOERCH P, WRIGHT SM, MILLS KD, BONNI A, YANKNER BA, SCULLY R, PROLLA TA, ALT FW & SINCLAIR DA 2008. SIRT1 redistribution on chromatin promotes genomic stability but alters gene expression during aging. Cell, 135, 907–18. [DOI] [PMC free article] [PubMed] [Google Scholar]
- PALACIOS JA, HERRANZ D, DE BONIS ML, VELASCO S, SERRANO M & BLASCO MA 2010. SIRT1 contributes to telomere maintenance and augments global homologous recombination. J Cell Biol, 191, 1299–313. [DOI] [PMC free article] [PubMed] [Google Scholar]
- PERROD S & GASSER SM 2003. Long-range silencing and position effects at telomeres and centromeres: parallels and differences. Cell Mol Life Sci, 60, 2303–18. [DOI] [PMC free article] [PubMed] [Google Scholar]
- RUDOLPH KL, CHANG S, MILLARD M, SCHREIBER-AGUS N & DEPINHO RA 2000. Inhibition of experimental liver cirrhosis in mice by telomerase gene delivery. Science, 287, 1253–8. [DOI] [PubMed] [Google Scholar]
- SAHIN E, COLLA S, LIESA M, MOSLEHI J, MULLER FL, GUO M, COOPER M, KOTTON D, FABIAN AJ, WALKEY C, MASER RS, TONON G, FOERSTER F, XIONG R, WANG YA, SHUKLA SA, JASKELIOFF M, MARTIN ES, HEFFERNAN TP, PROTOPOPOV A, IVANOVA E, MAHONEY JE, KOST-ALIMOVA M, PERRY SR, BRONSON R, LIAO R, MULLIGAN R, SHIRIHAI OS, CHIN L & DEPINHO RA 2011. Telomere dysfunction induces metabolic and mitochondrial compromise. Nature, 470, 359–65. [DOI] [PMC free article] [PubMed] [Google Scholar]
- SAHIN E & DEPINHO RA 2010. Linking functional decline of telomeres, mitochondria and stem cells during ageing. Nature, 464, 520–8. [DOI] [PMC free article] [PubMed] [Google Scholar]
- SAVAGE SA & ALTER BP 2009. Dyskeratosis congenita. Hematol Oncol Clin North Am, 23, 215–31. [DOI] [PMC free article] [PubMed] [Google Scholar]
- SCHEIBYE-KNUDSEN M, MITCHELL SJ, FANG EF, IYAMA T, WARD T, WANG J, DUNN CA, SINGH N, VEITH S, HASAN-OLIVE MM, MANGERICH A, WILSON MA, MATTSON MP, BERGERSEN LH, COGGER VC, WARREN A, LE COUTEUR DG, MOADDEL R, WILSON DM 3RD, CROTEAU DL, DE CABO R & BOHR VA 2014. A high-fat diet and NAD(+) activate Sirt1 to rescue premature aging in cockayne syndrome. Cell Metab, 20, 840–55. [DOI] [PMC free article] [PubMed] [Google Scholar]
- TARRAGO MG, CHINI CCS, KANAMORI KS, WARNER GM, CARIDE A, DE OLIVEIRA GC, RUD M, SAMANI A, HEIN KZ, HUANG R, JURK D, CHO DS, BOSLETT JJ, MILLER JD, ZWEIER JL, PASSOS JF, DOLES JD, BECHERER DJ & CHINI EN 2018. A Potent and Specific CD38 Inhibitor Ameliorates Age-Related Metabolic Dysfunction by Reversing Tissue NAD(+) Decline. Cell Metab, 27, 1081–1095 e10. [DOI] [PMC free article] [PubMed] [Google Scholar]
- TENNEN RI & CHUA KF 2011. Chromatin regulation and genome maintenance by mammalian SIRT6. Trends Biochem Sci, 36, 39–46. [DOI] [PMC free article] [PubMed] [Google Scholar]
- VAKHRUSHEVA O, SMOLKA C, GAJAWADA P, KOSTIN S, BOETTGER T, KUBIN T, BRAUN T & BOBER E 2008. Sirt7 increases stress resistance of cardiomyocytes and prevents apoptosis and inflammatory cardiomyopathy in mice. Circ Res, 102, 703–10. [DOI] [PubMed] [Google Scholar]
- VON ZGLINICKI T, SARETZKI G, DOCKE W & LOTZE C 1995. Mild hyperoxia shortens telomeres and inhibits proliferation of fibroblasts: a model for senescence? Exp Cell Res, 220, 186–93. [DOI] [PubMed] [Google Scholar]
- YAMAKUCHI M, FERLITO M & LOWENSTEIN CJ 2008. miR-34a repression of SIRT1 regulates apoptosis. Proc Natl Acad Sci U S A, 105, 13421–6. [DOI] [PMC free article] [PubMed] [Google Scholar]
- YOSHINO J, MILLS KF, YOON MJ & IMAI S 2011. Nicotinamide mononucleotide, a key NAD(+) intermediate, treats the pathophysiology of diet- and age-induced diabetes in mice. Cell Metab, 14, 528–36. [DOI] [PMC free article] [PubMed] [Google Scholar]
Associated Data
This section collects any data citations, data availability statements, or supplementary materials included in this article.
Supplementary Materials
Table S1 – TaqMan probes and qPCR primer pairs. Related to STAR methods.
Table S2 – Predicted miRNA targets. Related to the Main text and STAR methods.
Table S3 – List of miRNA mimics and inhibitors. Related to STAR methods.
Table S4 – Primers for promoter analysis. Related to STAR methods.
Table S5 – 3’UTR and mutagenesis primers. Related to STAR methods.
Data Availability Statement
RNaseq data have been deposited in GEO and the accession number is GSE125847