Abstract
Small-molecule natural products have been an essential source of pharmaceuticals to treat human diseases, but very little is known about their behavior inside dynamic, live human cells. Here, we demonstrate the first structure-activity-distribution relationship (SADR) study of complex natural products, the anti-cancer antimycin-type depsipeptides, using the emerging bioorthogonal Stimulated Raman Scattering (SRS) Microscopy. Our results show that the intracellular enrichment and distribution of these compounds are driven by their potency and specific protein targets, as well as the lipophilic nature of compounds.
Graphical Abstract

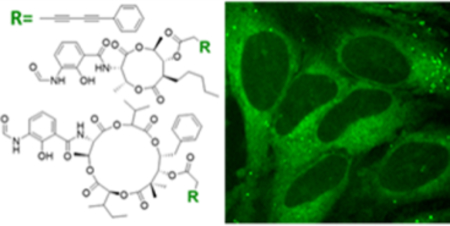
A structure activity distribution relationship study of antimycintype depsipeptides is demonstrated with bioorthogonal Raman microscopy.
Nature’s small molecules have played an enormous role in the history of medicinal and pharmaceutical chemistry. For example, it has been estimated that over 70% of anti-cancer small molecule treatments are natural products, their derivatives or mimics.1 Although the pharmaceutical value of natural products has been widely recognized, it is still difficult to transform medicinally active natural products into drugs. One of the major challenges is to understand the complex interplay between natural products and the network of cellular machinery beyond the specific protein targets.2 This has spurred the development of advanced imaging techniques to obtain views of natural products in cells, but often in a static and destructive manner using bulky fluorescent probes.3, 4 An improved imaging technique, which provides dynamic views of natural product uptake and distribution in live cells, will have a profound impact on natural product-based drug discovery and development.5 Tagging natural products with a bio-orthogonal alkyne functionality coupled with the Stimulated Raman Scattering (SRS) microscopy offers such promise.6, 7
Raman imaging has evolved greatly over the past decade, with improved sensitivity, resolution, and scanning speeds offered by the latest SRS technology.8–14 The vibrational Raman reporter can be as simple as an alkyne,6, 15 delivering chemical specificity and biocompatibility for natural product visualization and quantification in complex living systems with minimal activity perturbation of compounds. Compared to fluorescent imaging, SRS imaging offers additional advantages of minimal phototoxicity and photobleaching, allowing prolonged dynamic imaging of tagged natural products within live cells. SRS microscopy has recently been used to image various alkyne-tagged small-molecule derivatives that have high local intracellular concentrations.16–21 Despite the great potential, few natural products have been imaged using SRS microscopy to probe their intracellular behavior.
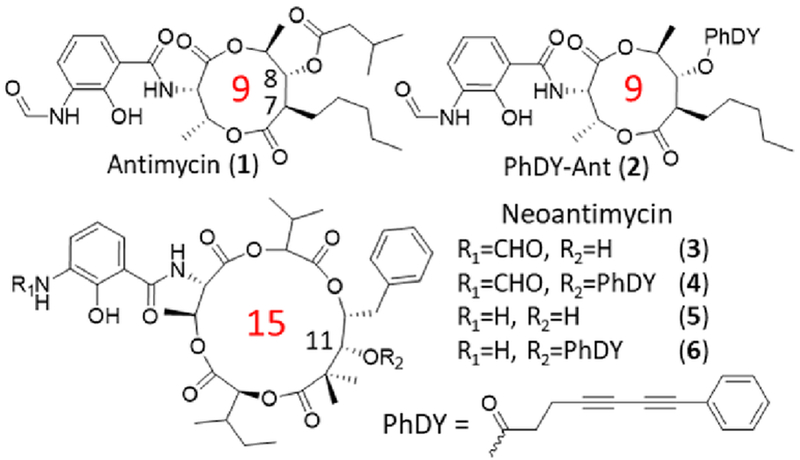
Here, we’ve applied SRS imaging to study antimycin-type depsipeptides, a class of complex natural products that have attracted recent attention due to their anti-cancer potential.22 This family of natural products share a common structural skeleton consisting of a macrocyclic ring with an amide linkage to a 3-formamidosalicylate unit, and primarily differ in the size of their macrolactone ring (Figure 1). The well-recognized members of this family are the 9-membered antimycins, for which multiple modes of action have been proposed, including inhibition of mitochondrial electron transport chain,23 anti-apoptotic proteins Bcl2/Bcl-xL,24 K-Ras plasma membrane localization,25 and ATP citrate lyase activity.26 The levels of contributions of these different mechanisms are unclear. Much less is known about the 15-membered neoantimycins, despite the fact that they have also shown promising anti-cancer activities toward various cancer cell lines.27 The inhibitory activity of K-Ras plasma membrane localization was shown to be shared between antimycins and neoantimycins,25 but neoantimycins lacked the Bcl-xL inhibitory activity and were demonstrated to inhibit the expression of GRP-78,28, 29 a molecular chaperone in the endoplasmic reticulum (ER) that promotes protein folding and provides resistance to both chemotherapy and hypoglycemic stress.30 To gain additional insights into anti-cancer activities of antimycin-type depsipeptides, we performed an SADR study of both antimycin and neoantimycin against live cancer cells.
Figure 1.
Structures of selected antimycin-type depsipeptides and their alkyne-tagged derivatives. The ring size is indicated in red numbers.
To increase the sensitivity of SRS imaging toward bioactive small molecules which are typically used in the low to mid micromolar range,31 we chose to employ a conjugated diyne with a terminal phenyl ring as a Raman tag. This tag is known to possess an increased Raman scattering cross section due to conjugation within the poly-yne chain and the presence of an aryl end-capping group also improves the stability of poly-ynes.16 This tag has recently been used in separate studies to image a phenyl-diyne anisomycin derivative in mammalian cells and to track the distribution of a cholesterol derivative in Caenorhabditis elegans where a detection limit of ~30 μM was attained.16, 32 Since bioactive antimycins naturally have high structural variations at the C-7 alkyl and C-8 acyloxy moieties (Figure 1) and the previous introduction of an alkyne side chain at C-8 did not significantly change cytotoxic activity nor binding of compounds to cancer cells,4 we reasoned that the Raman tag could be readily introduced at this position with minimal functional perturbation. To prepare phenyl-diyne antimycin (PhDY-Ant, 2), C-8 deacylated antimycin was first purified from the culture of Streptomyces albus ΔantB in which the last step of C-8 acyloxy formation is abolished in antimycin biosynthesis due to the deletion of the dedicated C-8 acyltransferase AntB.33 A phenyl-diyne carboxylic acid was chemically synthesized and then coupled to the purified deacylated antimycin via Steglich esterification to yield 2 (Scheme S1, Figure S1). As expected, the MTT proliferation assays with both HeLa (human cervical cancer) and MCF-7 (human breast cancer) cell lines confirmed that PhDY-Ant retained a comparable activity to the natural antimycin (Table 1, Figure S2).
Table 1.
GR50 values (μM)a for selected antimycins and neoantimycins against two cancer cell lines in vitro.
| Compound | HeLa | MCF-7 |
|---|---|---|
| Antimycin (1) | 20.2 ± 4.3b | 2.1 ± 0.5 |
| PhDY-Ant (2) | 31.8 ± 10.4 | 28.8 ± 9.7 |
| Neoantimycin (3) | 38.7 ± 8.2 | 24.4 ± 5.5 |
| PhDY-NeoA (4) | > 100c | 40.9 ± 22.8 |
| Deformylated NeoA (5) | > 1000 | > 1000 |
GR50 is the concentration at which the growth rate is half of that under untreated conditions.
All data were collected in at least triplicate and GR50 values were averaged between at least three biological replicates with error given in standard error of the mean (SEM).
GR50 could not be determined due to solubility limitations.
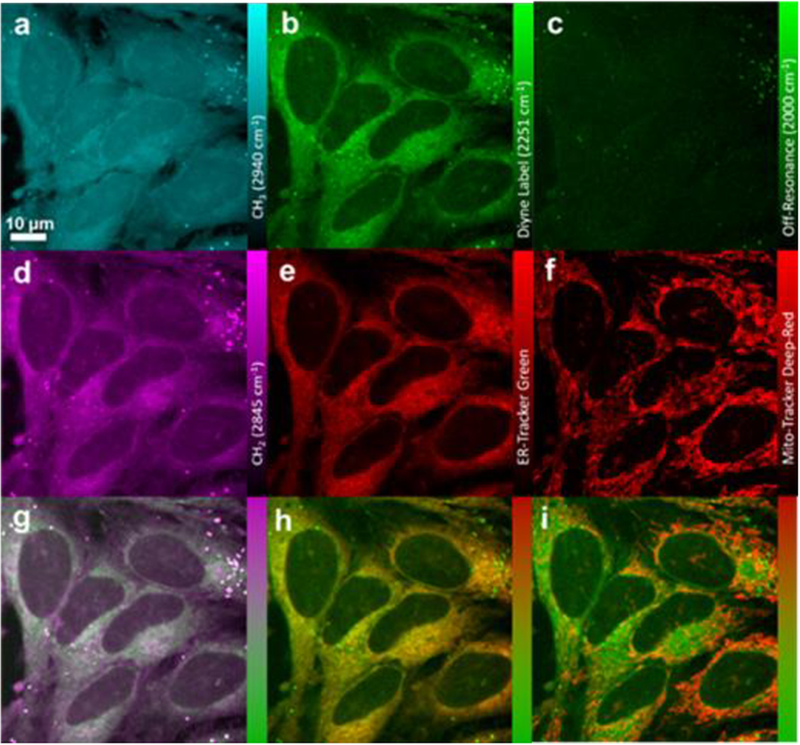
PhDY-Ant (2) was then incubated with HeLa cells and SRS images were acquired by tuning the frequency difference between the pump and Stokes lasers to be resonant with intracellular components such as proteins (CH3, 2940 cm−1) and lipids (CH2, 2845 cm−1), and in the bio-orthogonal region of the Raman spectrum (alkyne, 2251 cm−1; off-resonance, 2000 cm−1). 2 was used at solution concentrations ranging from 1–100 μM to probe the detection limit. Intracellular signal could be distinguished at concentrations as low as 10 μM, and contrast was dramatically improved by increasing the solution concentration of 2 to 50 μM (Figure 2 and S3). The absolute intracellular concentration of 2 was determined to be ~ 1.74 mM from the dosing concentration of 50 μM, showing a 35-fold enrichment of this compound in cells. To confirm that the observed signal was driven by the activity of antimycin, a control experiment was performed by incubating 50 μM PhDY tag with cells. No signal of compound was detected inside cells (Figure S3), suggesting that the observed Raman signal was not an off-target affect caused by the PhDY tag alone. We further re-isolated small molecules from the 2-treated HeLa cells and confirmed that 2 was not rapidly metabolized to products containing the PhDY tag (Figure S4), suggesting that the observed Raman signal was directly due to the presence of PhDY-Ant. We next probed the antimycin uptake rate and mechanism. Time-resolved imaging of 2 uptake into live HeLa cells showed that compound uptake was nearly immediate, reaching 75% of the maximum within six minutes (Figure S5). 2 appeared to rapidly distribute throughout the cytoplasm of the cells and persist through prolonged incubation. In addition, a low-temperature (4°C) uptake study was performed to investigate possible mechanisms of compound uptake. 2 was absorbed at comparable levels at both 4°C and 37°C (Figure S6), suggesting that PhDY-Ant crossed the cell membrane through passive diffusion.
Figure 2.
SRS and fluorescence imaging of PhDY-Ant (2) in HeLa cells. a) CH3 channel at 2940 cm−1 representing proteins. b) Diyne label at 2251 cm−1. c) Off-resonance channel at 2000 cm−1. d) CH2 channel at 2845 cm−1, representing lipids. e) Confocal fluorescence imaging of ER-Tracker excited at 488 nm. f) Confocal fluorescence imaging of Mito-Tracker excited at 635 nm. g) Overlay image of d) lipids and b) diyne label. h) Overlay image of e) ER-Tracker and b) diyne label. i) Overlay image of f) Mito-Tracker and b) diyne label.
The non-destructive nature of SRS imaging allows follow-up studies on compound distribution inside the cell, as well as correlating compound uptake with any possible phenotypic changes to cellular composition using dual-color and multi-modal approaches. For example, using a multi-modal approach to probe the subcellular localization of 2, HeLa cells were treated with ER-Tracker Green and Mito-Tracker Deep Red, cell-permeable fluorescent stains selective for the endoplasmic reticulum and mitochondria, respectively. Inspection of the merged images demonstrated that 2 correlated well with ER-Tracker (Figure 2). This colocalization agrees with one of its known direct protein targets, Bcl2, an anti-apoptotic protein localized primarily in the ER.34 Notably, a prolonged incubation led to a decrease of correlation between ER-Tracker and 2 (Figure S7), possibly due to compound dissociation from targets and/or translocation of protein targets. In spite of the known activity of antimycin in inhibiting the mitochondrial electron transport chain by binding to the quinone reduction site Qi of the cytochrome bc1 complex,23 no significant colocalization of 2 with Mito-Tracker was found (Figure 2). In addition, no obvious phenotypic changes were observed in lipids or proteins during the eight-hour incubation, although the merged images for 2 and the lipid channel showed a strong correlation, especially in lipid droplets (Figure 2). This correlation is likely caused by the lipophilic nature of 2 rather than any specific binding. Further image analysis using profile plots demonstrated that the localization of 2 was best explained by a combination of ER-Tracker and lipids (Figure S8). This result showed that the intracellular behavior of antimycin was not totally dictated by specific protein binding nor non-specific absorption. Instead, there was a complex interplay between antimycin, its protein targets, and the lipid-rich regions of the cell.
We next analyzed the distribution of PhDY-Ant (2) in MCF-7 and compared it to HeLa cells to probe if the distribution is cell-line specific. Similar to HeLa cells, 2 colocalized with ER-Tracker, but not Mito-Tracker (Figure S9). These data suggest that localization of antimycin in the ER is conserved across different cancer cell lines. In addition, MCF-7 cells showed a much smaller number of lipid droplets than HeLa cells, but instead contained highly lipid-rich regions at the intercellular boundaries that did not attract 2 (Figure S9). This result further suggests that the characteristics and location of lipids are also important for enrichment of antimycin. Indeed, a profile analysis showed that certain areas of localization of 2 in MCF-7 cells were best correlated with ER-Tracker while others were best correlated with the lipid channel (Figure S10).
Compared to antimycin, the molecular mechanism for the ring-expanded neoantimycin to inhibit cancer cell growth is much less known, and no direct protein target of neoantimycin has been identified. In addition, limited structure-activity relationship studies have been performed on the molecular scaffold of neoantimycin. It is yet to be determined if a similar tagging strategy, the esterification of the macrolactone C-11 hydroxyl moiety that is naturally present in neoantimycin (Figure 1), can be adopted to produce a neoantimycin derivative that is suitable for imaging analysis while retaining its anti-cancer activity. Neoantimycin was purified from the culture of S. orinoci and subjected to esterification by a phenyl-diyne carboxylic acid to generate phenyl-diyne neoantimycin (PhDY-NeoA, 4) (Scheme S2, Figure S11). The MTT proliferation assays with both HeLa and MCF-7 cells indicated that 4 had a slightly decreased but significant bioactivity, although its GR50 value against HeLa cells could not be determined due to solubility limitation (Table 1, Figure S12). This response of cell lines to the C-11 modification is consistent with a recent report in which oxidation of the same hydroxyl to ketone of neoantimycin led to slightly increased IC50 values against multiple cancer cell lines.27 The N-formyl group has been conserved in the antimycin-type depsipeptides and linked to respiration inhibition for antimycin.22 To probe the role of the N-formyl group in anti-cancer activities of neoantimycin, we produced deformylated neoantimycin (5) and its tagged version (6) through acid degradation of 3 and 4, respectively (Scheme S3, Figure S13 and S14). The growth of HeLa and MCF-7 cells was not inhibited upon treatment of up to 1 mM of 5 (Table 1, Figure S12), demonstrating the critical role of this moiety for anti-cancer activity of the 15-membered neoantimycin. This is in contrast to the 18-membered antimycin-type depsipeptides of which deformylation did not significantly decrease the inhibitory activity toward various cancer cell lines,35, 36 suggesting different modes of action for 15- and 18-membered compounds. Nonetheless, the generation of both active and inactive tagged neoantimycins provided an opportunity to investigate possible differential uptake of these compounds in live cells.
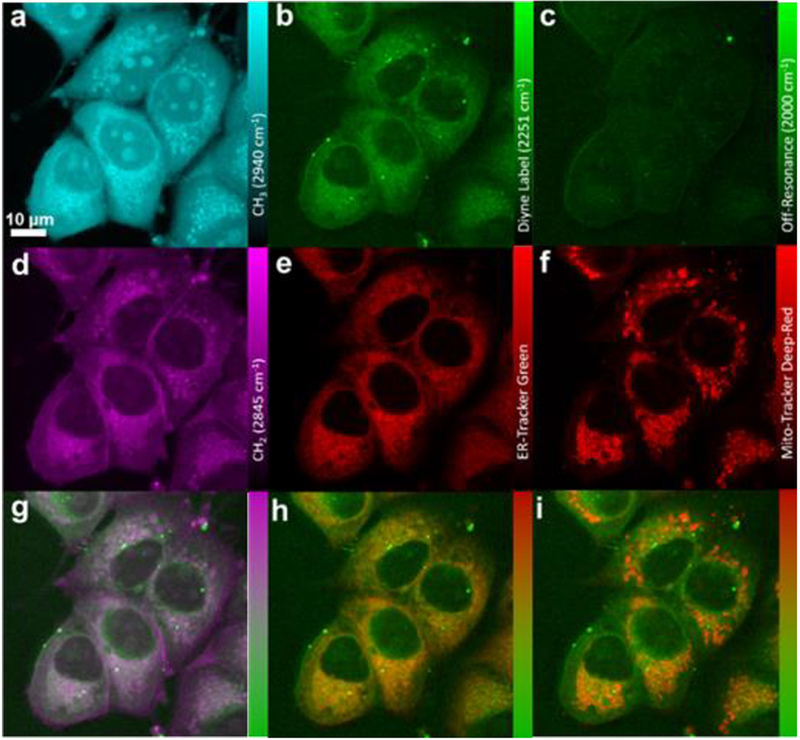
PhDY-NeoA (4) and deformylated PhDY-NeoA (6) were then subjected to SRS imaging analysis with both HeLa and MCF-7 cells. Enrichment of both compounds in lipid droplets was observed for both cell lines, which is likely due to the lipophilic nature of compounds rather than any specific binding to targets (Figure 3 and S15). In addition, 4 was detected by SRS throughout the cytoplasm of the MCF-7 cells with an estimated intracellular concentration of ~ 0.82 mM from a dosing concentration of 100 μM. 4 was also detected throughout the cytoplasm of the HeLa cells, although with a decreased signal intensity, demonstrating a positive correlation of compound intracellular enrichment to its cytotoxic activity. This is particularly true for intracellular enrichment of 6, for which significantly weaker SRS signals were detected (except within lipid droplets) in either cell line (Figure S15). We hypothesize that the loss of cytotoxic activity after deformylation is likely due to decreased binding to the molecular targets of neoantimycin, leading to a decreased intracellular enrichment. Further analysis using dual-color and multi-modal approaches showed that the intracellular distribution of PhDY-NeoA (4) differed from that of PhDY-Ant (2). In particular, 4 showed no correlation with Mito-Tracker and a very weak correlation with ER-Tracker in MCF-7 cells (Figure 3). Line plot analysis showed that 4 was much better correlated with lipids than with ER-Tracker (Figure S16), suggesting that neoantimycin does not target ER. This observation is consistent with previous reports that the known antimycin target, Bcl2/Bcl-xL, is not a neoantimycin protein target.37
Figure 3.
SRS and fluorescence imaging of PhDY-NeoA (4) in MCF-7 cells. a) CH3 channel at 2940 cm−1 representing proteins. b) Diyne label at 2251 cm−1. c) Off-resonance channel at 2000 cm−1. d) CH2 channel at 2845 cm−1, representing lipids. e) Confocal fluorescence imaging of ER-Tracker excited at 488 nm. f) Confocal fluorescence imaging of Mito-Tracker excited at 635 nm. g) Overlay image of d) lipids and b) diyne label. h) Overlay image of e) ER-Tracker and b) diyne label. i) Overlay image of f) Mito-Tracker and b) diyne label.
In summary, both the 9- and 15- membered antimycin-type depsipeptides have been subjected to the SADR study in live cancer cells. This work provides the first global and dynamic view of the interplay between these anti-cancer complex natural products and the complicated network of cellular machinery. We confirmed the high tolerance of the C-8 modification of the 9-membered antimycin for its anti-cancer activity and showed the passive while facile uptake of antimycin by live cancer cells. Interestingly, the primary localization of the 9-membered antimycin was demonstrated to be in the endoplasmic reticulum despite the previous known protein targets of antimycin in various cellular organelles. We also showed that the anti-cancer activity of the 15-membered neoantimycin was dependent on the N-formyl moiety and less sensitive toward the C-11 modification. Importantly, a different intracellular localization of the 15-membered neoantimycin compared to the 9-membered antimycin was revealed. Our results further demonstrated that the intracellular enrichment and distribution of these compounds were driven by their potency and specific protein targets, as well as the lipophilic properties of compounds. This new integrative workflow of SADR study on bioactive natural products is expected to extend beyond the traditional SAR study, complement existing biochemical and proteomic techniques in the mode-of-action study of natural products, and facilitate efforts in reducing off-target effects and improving efficacy of candidate compounds in the early stages of drug discovery.
This research was financially supported by grants to W.Z. from the American Cancer Society, Alfred P. Sloan Foundation, and the Chan Zuckerberg Biohub Investigator Program. W. M. acknowledges support of R01EB020892 and R01GM128214 from NIH, and the Camille and Henry Dreyfus Foundation. J.A.S. is supported by the National Science Foundation Graduate Research Fellowship Program. We thank the Berkeley Cell Culture Facility for providing cell culturing services for the cytotoxicity assays.
Supplementary Material
Footnotes
Electronic Supplementary Information (ESI) available: [details of any supplementary information available should be included here]. See DOI: 10.1039/x0xx00000x
Notes and References
- 1.Newman DJ and Cragg GM, J Nat Prod, 2016, 79, 629–661. [DOI] [PubMed] [Google Scholar]
- 2.Prescher JA and Bertozzi CR, Nat Chem Biol, 2005, 1, 13. [DOI] [PubMed] [Google Scholar]
- 3.DeGuire SM, Earl DC, Du Y, Crews BA, Jacobs AT, Ustione A, Daniel C, Chong KM, Marnett LJ, Piston DW, Bachmann BO and Sulikowski GA, Angew Chem Int Ed Engl, 2015, 54, 961–964. [DOI] [PMC free article] [PubMed] [Google Scholar]
- 4.Yan Y, Chen J, Zhang L, Zheng Q, Han Y, Zhang H, Zhang D, Awakawa T, Abe I and Liu W, Angew Chem Int Ed Engl, 2013, 52, 12308–12312. [DOI] [PubMed] [Google Scholar]
- 5.Conway JRW, Carragher NO and Timpson P, Nat Rev Cancer, 2014, 14, 314. [DOI] [PubMed] [Google Scholar]
- 6.Wei L, Hu F, Shen Y, Chen Z, Yu Y, Lin CC, Wang MC and Min W, Nat Methods, 2014, 11, 410–412. [DOI] [PMC free article] [PubMed] [Google Scholar]
- 7.Hong S, Chen T, Zhu Y, Li A, Huang Y and Chen X, Angew Chem Int Ed Engl, 2014, 53, 5827–5831. [DOI] [PubMed] [Google Scholar]
- 8.Wei L, Hu F, Chen Z, Shen Y, Zhang L and Min W, Acc Chem Res, 2016, 49, 1494–1502. [DOI] [PMC free article] [PubMed] [Google Scholar]
- 9.Tipping WJ, Lee M, Serrels A, Brunton VG and Hulme AN, Chem Soc Rev, 2016, 45, 2075–2089. [DOI] [PMC free article] [PubMed] [Google Scholar]
- 10.Freudiger CW, Min W, Saar BG, Lu S, Holtom GR, He C, Tsai JC, Kang JX and Xie XS, Science, 2008, 322, 1857–1861. [DOI] [PMC free article] [PubMed] [Google Scholar]
- 11.Prince RC, Frontiera RR and Potma EO, Chem Rev, 2017, 117, 5070–5094. [DOI] [PMC free article] [PubMed] [Google Scholar]
- 12.Cheng J-X and Xie XS, Science, 2015, 350, aaa8870. [DOI] [PubMed] [Google Scholar]
- 13.Camp CH Jr and Cicerone MT, Nat Photonics, 2015, 9, 295. [DOI] [PMC free article] [PubMed] [Google Scholar]
- 14.Krafft C, Schmitt M, Schie IW, Cialla-May D, Matthäus C, Bocklitz T and Popp J, Angew Chem Int Ed Engl, 2017, 56, 4392–4430. [DOI] [PubMed] [Google Scholar]
- 15.Yamakoshi H, Dodo K, Palonpon A, Ando J, Fujita K, Kawata S and Sodeoka M, J Am Chem Soc, 2012, 134, 20681–20689. [DOI] [PubMed] [Google Scholar]
- 16.Tipping WJ, Lee M, Serrels A, Brunton VG and Hulme AN, Chem Sci, 2017, 8, 5606–5615. [DOI] [PMC free article] [PubMed] [Google Scholar]
- 17.Gaschler MM, Hu F, Feng H, Linkermann A, Min W and Stockwell BR, ACS Chem Biol, 2018, 13, 1013–1020. [DOI] [PMC free article] [PubMed] [Google Scholar]
- 18.Yamakoshi H, Dodo K, Okada M, Ando J, Palonpon A, Fujita K, Kawata S and Sodeoka M, J Am Chem Soc, 2011, 133, 6102–6105. [DOI] [PubMed] [Google Scholar]
- 19.El-Mashtoly SF, Petersen D, Yosef HK, Mosig A, Reinacher-Schick A, Kötting C and Gerwert K, Analyst, 2014, 139, 1155–1161. [DOI] [PubMed] [Google Scholar]
- 20.Zhao Z, Shen Y, Hu F and Min W, Analyst, 2017, 142, 4018–4029. [DOI] [PMC free article] [PubMed] [Google Scholar]
- 21.Hu F, Chen Z, Zhang L, Shen Y, Wei L and Min W, Angew Chem Int Ed Engl, 2015, 54, 9821–9825. [DOI] [PMC free article] [PubMed] [Google Scholar]
- 22.Liu J, Zhu X, Kim SJ and Zhang W, Nat Prod Rep, 2016, 33, 1146–1165. [DOI] [PubMed] [Google Scholar]
- 23.Huang LS, Cobessi D, Tung EY and Berry EA, J Mol Biol, 2005, 351, 573–597. [DOI] [PMC free article] [PubMed] [Google Scholar]
- 24.Tzung SP, Kim KM, Basanez G, Giedt CD, Simon J, Zimmerberg J, Zhang KY and Hockenbery DM, Nat Cell Biol, 2001, 3, 183–191. [DOI] [PubMed] [Google Scholar]
- 25.Salim AA, Cho KJ, Tan L, Quezada M, Lacey E, Hancock JF and Capon RJ, Org Lett, 2014, 16, 5036–5039. [DOI] [PMC free article] [PubMed] [Google Scholar]
- 26.Barrow CJ, Oleynek JJ, Marinelli V, Sun HH, Kaplita P, Sedlock DM, Gillum AM, Chadwick CC and Cooper R, J Antibiot (Tokyo), 1997, 50, 729–733. [DOI] [PubMed] [Google Scholar]
- 27.Zhou Y, Lin X, Williams SR, Liu L, Shen Y, Wang S-P, Sun F, Xu S, Deng H, Leadlay PF and Lin H-W, ACS Chem Biol, 2018, 13, 2153–2160. [DOI] [PubMed] [Google Scholar]
- 28.Izumikawa M, Ueda JY, Chijiwa S, Takagi M and Shin-ya K, J Antibiot (Tokyo), 2007, 60, 640–644. [DOI] [PubMed] [Google Scholar]
- 29.Umeda Y, Chijiwa S, Furihata K, Sakuda S, Nagasawa H, Watanabe H and Shin-ya K, J Antibiot (Tokyo), 2005, 58, 206–209. [DOI] [PubMed] [Google Scholar]
- 30.Lee AS, Nat Rev Cancer, 2014, 14, 263–276. [DOI] [PMC free article] [PubMed] [Google Scholar]
- 31.Zhu T, Cao S, Su P-C, Patel R, Shah D, Chokshi HB, Szukala R, Johnson ME and Hevener KE, J Med Chem, 2013, 56, 6560–6572. [DOI] [PMC free article] [PubMed] [Google Scholar]
- 32.Lee HJ, Zhang W, Zhang D, Yang Y, Liu B, Barker EL, Buhman KK, Slipchenko LV, Dai M and Cheng J-X, Sci Rep-Uk, 2015, 5, 7930. [DOI] [PMC free article] [PubMed] [Google Scholar]
- 33.Sandy M, Zhu X, Rui Z and Zhang W, Org Lett, 2013, 15, 3396–3399. [DOI] [PubMed] [Google Scholar]
- 34.Schinzel A, Kaufmann T and Borner C, Biochim Biophys Acta - Mol Cell Res, 2004, 1644, 95–105. [DOI] [PubMed] [Google Scholar]
- 35.Pettit GR, Tan R, Pettit RK, Smith TH, Feng S, Doubek DL, Richert L, Hamblin J, Weber C and Chapuis JC, J Nat Prod, 2007, 70, 1069–1072. [DOI] [PMC free article] [PubMed] [Google Scholar]
- 36.Pettit GR, Smith TH, Feng S, Knight JC, Tan R, Pettit RK and Hinrichs PA, J Nat Prod, 2007, 70, 1073–1083. [DOI] [PMC free article] [PubMed] [Google Scholar]
- 37.Vanner SA, Li X, Zvanych R, Torchia J, Sang J, Andrews DW and Magarvey NA, Mol Biosyst, 2013, 9, 2712–2719. [DOI] [PubMed] [Google Scholar]
Associated Data
This section collects any data citations, data availability statements, or supplementary materials included in this article.


