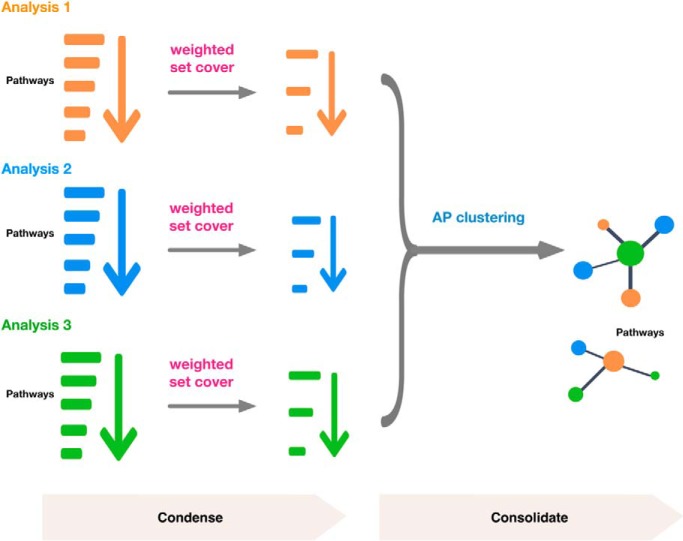
Weighted set cover and affinity propagation algorithms are used to combine results from multiple enrichment analyses. Weighted set cover first condenses enriched gene sets to use the fewest number of gene sets that cover all relevant genes. Affinity propagation then clusters the enriched pathways and selects the most representative set. Together they facilitate interpretation of multiple enrichment analysis results. A demonstration of its utility highlights both general and unique pathways associated with cancer survival across seven cancer types.
Keywords: Omics, Cancer Biology*, Computational Biology, Algorithms, Bioinformatics software, Breast cancer, Data evaluation, Networks*, Pathway Analysis
Graphical Abstract
Highlights
Weighted set cover significantly condenses gene sets after enrichment analysis.
Affinity propagation clusters gene sets from multiple enrichment analyses.
Clustering pathways using selected genes is more biologically relevant.
Pathways associated with poor or good survival from seven cancer types.
Abstract
Gene set analysis plays a critical role in the functional interpretation of omics data. Although this is typically done for one omics experiment at a time, there is an increasing need to combine gene set analysis results from multiple experiments performed on the same or different omics platforms, such as in multi-omics studies. Integrating results from multiple experiments is challenging, and annotation redundancy between gene sets further obscures clear conclusions. We propose to use a weighted set cover algorithm to reduce redundancy of gene sets identified in a single experiment. Next, we use affinity propagation to consolidate similar gene sets identified from multiple experiments into clusters and to automatically determine the most representative gene set for each cluster. Using three examples from over representation analysis and gene set enrichment analysis, we showed that weighted set cover outperformed a previously published set cover method and reduced the number of gene sets by 52–77%. Focusing on overlapping genes between the list of input genes and the enriched gene sets in over-representation analysis and leading-edge genes in gene set enrichment analysis further reduced the number of gene sets. A use case combining enrichment analysis results from RNA-Seq and proteomics data comparing basal and luminal A breast cancer samples highlighted the known difference in proliferation and DNA damage response. Finally, we used these algorithms for a pan-cancer survival analysis. Our analysis clearly revealed prognosis-related pathways common to multiple cancer types or specific to individual cancer types, as well as pathways associated with prognosis in different directions in different cancer types. We implemented these two algorithms in an R package, Sumer, which generates tables and static and interactive plots for exploration and publication. Sumer is publicly available at https://github.com/bzhanglab/sumer.
The generation of large omics datasets is increasingly popular for studying biological and pathological systems. Analysis of these datasets frequently involves the identification of biological pathways, or more broadly defined gene sets, that are associated with the biological or clinical features of interest. To perform this analysis, predefined gene sets can be downloaded from a variety of databases, such as the Gene Ontology (GO)1 (1, 2), KEGG (3), WikiPathways (4), Reactome (5), and the Pathway Interaction Database (PID) (6). In addition, meta-databases combining multiple databases to generate large collections of gene sets, such as the MSigDB (7), have also been developed. The two most popular gene set analysis methods are over-representation analysis (ORA) (8) and gene set enrichment analysis (GSEA) (9). Application of these methods to data generated from a single omics experiment is well standardized with many available tools (10–12). However, integrating gene set analysis results from multiple experiments performed on the same or different omics platforms, such as multi-omics or pan-cancer studies, remains an open challenge. This problem is further complicated by redundancy in gene set databases.
Gene set redundancy is common both within a single database and across databases. Within a single database, some gene sets may be more specific subsets of larger gene sets. This is particularly evident in GO, which is set up as hierarchical sets with increasing functional specialization. Crosstalk between biological processes and pathways can also result in shared genes between different gene sets within a single database. Across databases, redundancy can occur when the same gene set is included in multiple databases, or similar but non-identical sets of genes were associated with the same pathway in different database annotations, typically because of different perspectives in defining pathway boundaries. For example, the Reactome and KEGG databases contain two overlapping but different gene sets for the apoptosis pathway, and both of these gene sets are included in the MSigDB C2 collection of curated pathways.
Several methods have been developed to handle gene set redundancy. Pathcards and ReCiPa both use algorithms to combine similar sets into larger super-sets (13, 14). However, this method must be performed before enrichment analysis and may favor large, general pathways over highly specialized functional sets, although the latter provide more precise biological mechanisms. Recently, Stoney et al. developed a method using a modified set cover algorithm to select gene sets without changing the genes in the sets (15). Set cover is an algorithm that tries to identify the smallest sub-collection of sets that covers the elements in the entire collection, but this method is biased toward selecting the largest subset (15). Stoney et al. modified the set cover algorithm to select gene sets in order of increasing significance until all genes are covered. Because gene set prioritization is driven only by statistical significance, this method is not optimized for removing redundancy. In this study, we used a weighted set cover algorithm, which allows simultaneous consideration of both gene set size and significance.
The integration of enrichment analysis results from multiple experiments is a further challenge. PaintOmics 3 uses a joint p value to combine results from different omics platforms (16). RAMONA can compare two enrichment analysis results using Bayesian networks (17). These methods focus on common rather than platform-specific gene sets. Moreover, their implementations only work for a certain type of enrichment analysis method or specific gene set databases. Network-based methods, such as ClueGO and Enrichment Map (18, 19), connect similar gene sets into a network and then rely on network clustering to consolidate enrichment analysis results. Using Enrichment Map as an example, it connects gene sets from any number and type of enrichment analyses into a network based on the Jaccard or overlap similarity and colors gene sets (i.e. nodes in the network) based on the results from each experiment (19). Although network visualization and the gene set grouping achieved by the graph layout algorithms are very helpful, clusters of functionally related gene sets need to be manually identified and interpreted. This quickly becomes infeasible if many significant gene sets need to be consolidated. In this study, we used the affinity propagation algorithm (20), which not only groups functionally related gene sets identified from multiple experiments or omics platforms into clusters but also automatically determines the most representative gene set for each cluster.
We implemented both weighted set cover and affinity propagation algorithms into an R package named Sumer. Sumer first reduces annotation redundancy in the results from an individual enrichment analysis using weighted set cover. It then clusters the results from multiple enrichment analyses using affinity propagation and provides tables, static and interactive plots, and downloadable results for exploration and publication. Sumer is flexible in allowing results from any gene set and any type of enrichment analysis. We use multiple examples to demonstrate its efficiency in gene set redundancy removal and its application to multi-omics and pan-cancer studies.
EXPERIMENTAL PROCEDURES
Overrepresentation Analysis
Colorectal cancer-associated genes were downloaded from GLAD4U (21) with the search term “colorectal cancer”. ORA was performed by WebGestalt (10) using the GO biological process sets with a minimum overlap of 5 genes and a maximum overlap of 500 against a background of all human protein-coding genes. GO terms were considered enriched with a Benjamini-Hochberg corrected p value less than 0.05.
Data Processing for Gene Set Enrichment Analysis
Processed breast cancer RNA-Seq (1093 samples) and proteomics data (105 samples) from the Cancer Genome Atlas (TCGA) and the Clinical Proteomic Tumor Analysis Consortium (CPTAC) were downloaded from LinkedOmics (22). Genes and proteins were compared between basal and luminal A samples using the Wilcoxon rank sum test with the requirement of at least 3 non-missing values in both groups. They were ranked according to -log10(p value) and signed according to the difference in median between the two groups.
Association of RNA-Seq gene expression data with survival was performed for seven TCGA cancer types using Cox regression analysis in LinkedOmics (22). The seven cancer types included acute myeloid leukemia (LAML), bladder urothelial carcinoma (BLCA), breast invasive carcinoma (BRCA), colorectal adenocarcinoma (COADREAD), kidney carcinoma (KIPAN), lung adenocarcinoma (LUAD), and uterine endometrial carcinoma (UCEC). Genes were ranked by -log10(p value) and signed by the log10(hazard ratio).
Gene Set Enrichment Analysis
GSEA was performed using default parameters in WebGestalt (minimum overlap of 5, maximum overlap of 500, and 1000 permutations). The MSigDB C2 canonical pathways gene set collection and Wikipathways were used (7, 9). Gene sets with a false discovery rate (FDR) < 0.05 were considered enriched, where the FDR is the estimated probability that a gene set with a given normalized enrichment score represents a false positive finding (9).
Weighted Set Cover Algorithm to Reduce Gene Set Redundancy
Given a universe of finite set U with |U| = n and sets C = {C1, ⋯, Cm} ⊆ U, a set cover is a collection S of some of the sets from C whose union is the entire universe. In this study, C corresponds to all gene sets of interest, and U corresponds to the union of all genes within these gene sets. Here we consider a generalized version of weighted set cover and maximum coverage (23) called size-constrained weighted set cover (24) where each set is also associated with a weight wi, which is calculated as -log10(p value). Therefore, higher weights are assigned to gene sets with smaller enrichment p values. The input to the problem further includes a size constraint k. The goal is to find S, a sub-collection of up to k sets, whose sum of weights is maximal and whose union covers as many elements as possible. Assume that one or more sets have been selected into S. We denote the marginal benefit set of a candidate set s given S, Bm (s, S), as the set of elements from U covered by s but have not yet been covered by any set in S. In addition, we define the marginal gain of selecting s into S as G(s, S) = |Bm(s, S)|wS. The algorithm starts with computing the marginal benefit set for all sets in C. Next, it selects the set with maximal marginal gain and adds it to the solution S. The algorithm then updates the marginal benefit set of the remaining candidate sets and removes those candidates with empty marginal benefit set before repeating the selection step. The algorithm returns as soon as it has covered all elements in U or after k iterations. It outputs the selected sets and fraction of coverage ŝ. Fig. 1 lists the pseudocode of this algorithm.
Fig. 1.

Set-constrained weighted set cover algorithm.
Affinity Propagation for Gene Sets Consolidation
Given a list of input gene sets, the affinity propagation algorithm (20) clusters similar gene sets into groups and identifies one representative gene set (termed “exemplar”) that best represents each group. This algorithm simultaneously considers all gene sets as potential exemplars and exchanges messages between gene sets until a satisfying set of clusters emerges.
The algorithm takes as input a similarity matrix M where Mij implies the appropriateness of selecting gene set j to be the exemplar for gene set i. We use the following formula to set M:
Therefore, if a pair of gene sets i and j overlap, the Jaccard distance is set as its similarity value. Otherwise, its similarity is set to −∞ as it is not appropriate for gene set i to represent gene set j if they do not overlap.
The algorithm further requires an input preference, which can be interpreted as the suitability of a gene set to serve as an exemplar. Highly significant gene sets, for example, should have increased tendency to be selected as an exemplar. We use the following procedure to set the preference values. Assume that the gene set enrichment significance levels, i.e. -log10(p value), are in the range of [pmin, pmax] and let mmed denote the median of all finite values in the similarity matrix M. We set the maximum preference to mmed and the minimum to 0. For gene set i its input preference is interpolated linearly as:
After the first set of exemplars is selected, the algorithm is repeated to cluster the exemplar gene sets and select a final set of exemplars. These final exemplars are the most representative gene sets that connect the initial gene set clusters.
Implementation of Sumer
The weighted set cover algorithm and affinity propagation algorithm were combined into a single R package, Sumer, for convenient analysis of gene set analysis results. Sumer requires two input files for up to seven experiments: a tab-delimited table of pathway names and their associated enrichment score and a GMT file (7) of pathway names with their associated genes. Higher enrichment scores should indicate greater significance. The program takes a JSON file of filenames and a limit for the maximum number of sets chosen by weighted set cover.
Analysis Using Sumer
The weight for significantly enriched pathways was calculated as the signed -log10(p value). Here the nominal p value was used because it is comparable across multiple enrichment analyses with varying gene set database sizes. The sign was according to the direction of the normalized enrichment score (NES) and used for visualization. The weight for a p value of 0 was given the value of 16 (-log10(1 × 10⁻¹⁶)), as this was the smallest p value available because of computational limits. We set k, the maximum number of selected sets, to 250 so that the weighted set cover algorithm ended with 100% gene coverage.
Comparison with Enrichment Set Cover
The python script for enrichment set cover was downloaded from github (15) and the enrichment analysis set cover algorithm was run using enriched pathways with FDR < 0.05 and the same pathway genes as Sumer. The enrichment analysis p values were provided as the pathway scores.
RESULTS
Weighted Set Cover Condensed Enrichment Results
To demonstrate the general applicability of Sumer, we performed three examples of enrichment analyses (one ORA and two GSEA) using three different data sets and two different gene set collections (Table I). For the ORA analysis, 407 genes identified as being associated with colorectal cancer in the literature were used. A total of 910 gene sets passed a Benjamini-Hochberg corrected p value of 0.05.
Table I. Gene sets reduction after weighted set cover for three different enrichment analyses.
| Data type | Gene sets | Number of enriched gene sets | Number of enriched gene sets after set cover | Genes covered |
|---|---|---|---|---|
| Colorectal cancer-associated genes (ORA) | GO Biological Process | 910 | 212 | 10,220 |
| Gene expression in Basal vs Luminal A breast cancer (GSEA) | MSigDB C2 Canonical Pathways | 123 | 51 | 1,716 |
| Protein abundance in Basal vs Luminal A breast cancer (GSEA) | MSigDB C2 Canonical Pathways | 97 | 47 | 1,432 |
GSEA was used for pathway enrichment of genes and proteins differentially expressed between the basal and luminal A breast cancer subtype tumors in the TCGA study. Basal and luminal A are two major subtypes of breast cancer with distinct survival outcomes (25). RNA-Seq identified 20,148 genes in 147 basal and 426 luminal A samples, whereas a subset of these samples (21 basal, 27 luminal A) had proteomic data for 9733 proteins. Of the 1329 pathways in the MSigDB C2 database, 123 were significantly enriched (FDR < 0.05) in the RNA data and 97 in the proteomics data.
The weighted set cover algorithm tries to select the fewest number of gene sets that cover all genes associated with the enriched sets, with priority for the most significant sets. Using the -log transformed enrichment p value to prioritize the gene sets, the algorithm reduced the original number of gene sets by 52–77% (Table I).
Weighted Set Cover Provides an Improved Method for Redundancy Reduction
Previously, Stoney et al. used a modified set cover algorithm named enrichment set cover to reduce the number of gene sets identified from enrichment analysis by selecting gene sets in order of enrichment p value until all genes associated with all enriched gene sets were covered (15). Here the priority is given only to enrichment significance, which may not provide an optimal solution. Suppose gene set A has a p value of 0.010 and gene set B has a p value of 0.011 and one additional gene that was not in the first gene set. The enrichment set cover will choose both sets to remain in the results, whereas a balanced solution simultaneously optimizing both enrichment significance and parsimony would select just gene set B.
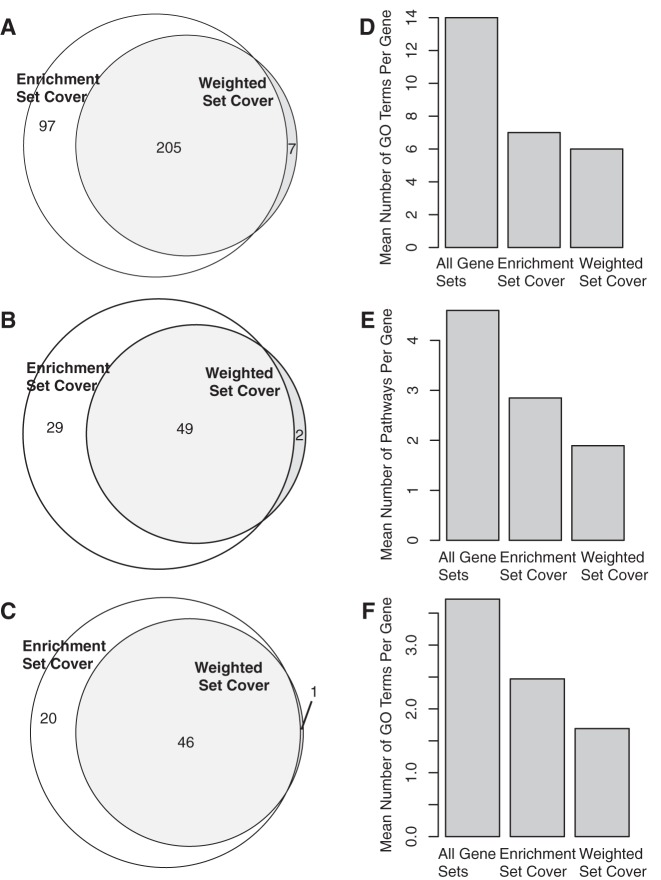
This effect was shown when using the enrichment set cover algorithm on the same datasets. Out of 910 GO terms enriched for colorectal cancer-associated genes, the weighted set cover algorithm required only 212 GO terms to cover the same genes, whereas the enrichment set cover algorithm retained 302 terms (Fig. 2A). Similarly, the enrichment set cover algorithm selected 78 of the enriched pathways associated with basal compared with luminal A breast cancer in RNA data, whereas the weighted set cover only required 51 of those same pathways (Fig. 2B). Finally, weighted set cover required 47 pathways to cover the proteins in the enriched pathways in the proteomic data, whereas enrichment set cover required 66. For each enrichment analysis, the weighted set cover algorithm had more genes covered by a single gene set compared with the enrichment set cover algorithm (Fisher's exact test p = 1.6 × 10⁻¹⁴, p = 3.0 × 10⁻⁴, and p < 2.2 × 10⁻¹⁶, respectively) and the mean number of pathways per gene was reduced (Fig. 2D–2F).
Fig. 2.
Enrichment results after performing enrichment set cover and weighted set cover. A, Number of GO terms enriched with colorectal cancer-associated genes. B, Number of enriched pathways in RNA data for basal compared with luminal A breast cancer. C, Number of enriched pathways for basal compared with luminal A breast cancer in proteomic data. D–F, The mean number of gene sets per gene in the full enrichment results, after enrichment set cover, and after weighted set cover for (D) colorectal cancer-associated genes, E, basal versus luminal A gene expression, and F, basal versus luminal A protein abundance.
Discriminating Genes within a Gene Set Improves Biological Relevance in Gene Set Selection
Existing methods for gene set redundancy reduction consider the entire list of genes in a gene set equally, regardless of individual genes' association with the phenotype of interest. However, for ORA analyses, the overlapping genes between the genes of interest in the submitted list and the gene set are more relevant than the remaining genes in an enriched gene set. We reason that performing weighted set cover on only overlapping genes is more biologically relevant than performing weighted set cover on all genes in an enriched gene set.
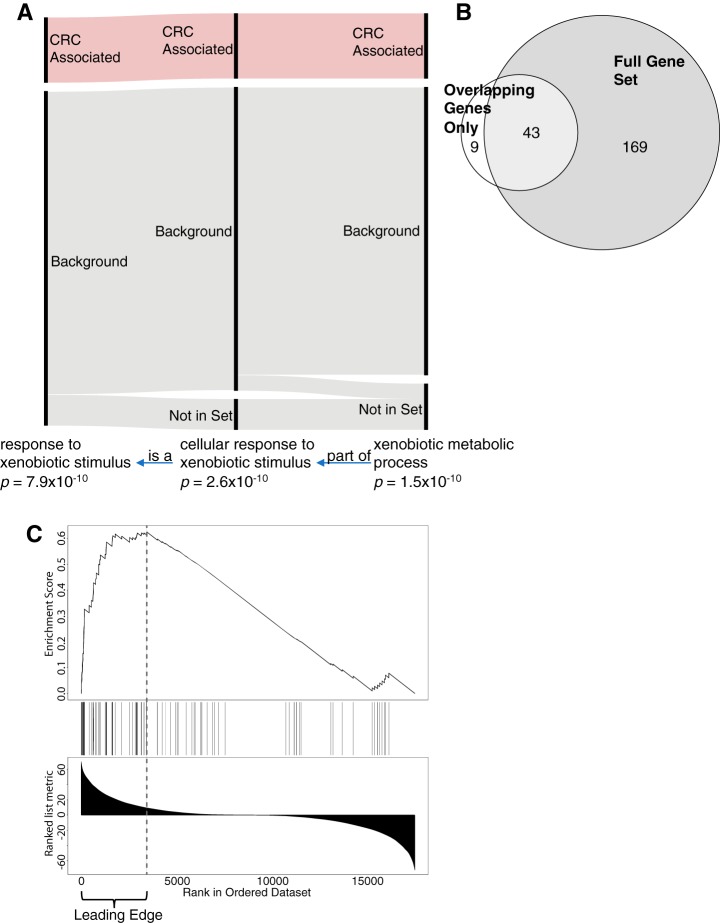
To illustrate this idea, we further examined the ORA analysis that found 910 GO terms enriched for colorectal cancer-associated genes against a background of the human genome. Of these terms, 290 had the same set of colorectal cancer-associated genes as another term. For example, three related GO terms contained the same 17 colorectal cancer-associated genes (Fig. 3A) despite having a different number of total genes. “Xenobiotic metabolic process” is a subset of “cellular response to xenobiotic stimulus,” which is also a subset of “response to xenobiotic stimulus.” If the weighted set cover algorithm was performed for these three sets with all genes, it would have to select the most general set, “response to xenobiotic stimulus” to cover all the genes. However, because these sets are identical for genes overlapping with the list of colorectal cancer-associated genes, the weighted set cover algorithm would select the set with the most significant p value if only the list of interesting genes were used. Weighted set cover will therefore select the most specific gene set, which better describes the actual function of the colorectal cancer-associated genes.
Fig. 3.
Using the most significant genes for annotation redundancy elimination. A, An example of different GO terms with the same overlapping gene set. The term “xenobiotic metabolic process” is a part of “cellular response to xenobiotic stimulus,” which is a “response to xenobiotic stimulus.” The gray bars indicate genes present in the background dataset. The red bars indicate genes in each set that overlap with the colorectal cancer-associated genes. B, Overlap of GO terms after weighted set cover using all genes in the enriched GO term or only colorectal cancer-associated genes. C, Enrichment analysis result for the PID MYC Active pathway for basal versus luminal A breast cancer using RNA-Seq data. Genes are ranked by signed -log(p value), with genes more highly expressed in basal samples on the left and genes more highly expressed in luminal A samples on the right. The dotted line indicates the leading-edge genes.
We repeated the weighted set cover analysis focusing only on the colorectal cancer-associated genes. As shown in Fig. 3B, only 52 GO terms were required to cover all of the colorectal cancer-associated genes, whereas 212 sets were required to cover all genes in enriched GO terms. This indicates that most of the uniqueness of the 212 sets arises from the uninteresting background genes rather than colorectal cancer-associated genes.
Similarly, the GSEA enrichment signal is driven by a subset of genes with strong association with the phenotype of interest (i.e. leading-edge genes, Fig. 3C). Other genes in the gene set do not contribute to the enrichment of the gene set. Performing weighted set cover based on the leading-edge genes will focus results on the gene sets that are the most relevant to the phenotype of interest, a strategy we used in the following analyses.
Integration of Multi-Omics Enrichment Analyses
Once the enrichment analysis results have been condensed for each experiment, results from multiple experiments can be combined to highlight both concordant and discordant findings across experiments. In this case, similar gene sets both within an experiment and across experiments should be grouped together. The affinity propagation algorithm not only groups similar gene sets, but also identifies the most representative gene set for each group.
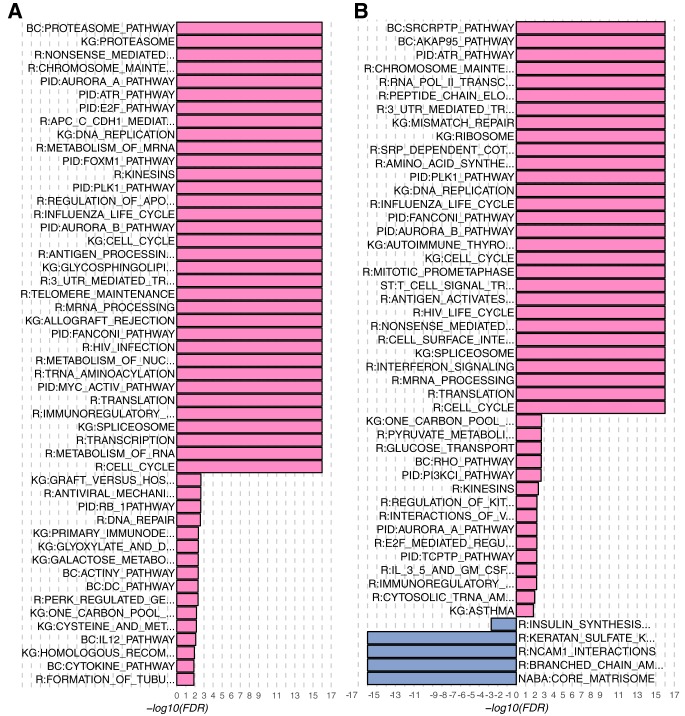
Here we present a use case combining enrichment analysis results from RNA-Seq and proteomics data comparing basal and luminal A breast cancer samples. As noted in Table I, GSEA analysis of the RNA-Seq data against the MSigDB C2 Canonical Pathways identified 123 pathways enriched in the basal samples compared with the luminal A samples (supplemental Table S1). The 123 pathways from RNA-Seq data were condensed to 50 after weighted set cover using only the leading-edge genes (Fig. 4A). A parallel analysis of the protein data identified 91 pathways enriched in the basal samples and 6 pathways enriched in the luminal A samples (supplemental Table S2). The 97 pathways from protein data were condensed to 49 after weighted set cover using the leading-edge genes (Fig. 4B) and the names of only 18 pathways overlapped with those from the RNA-Seq data.
Fig. 4.
Barplots of significantly enriched pathways in basal versus luminal A breast cancer after weighted set cover. Enriched pathways from (A) RNA-Seq and (B) proteomics data. The names of some pathway databases are abbreviated: r = Reactome, KG = KEGG, BC = BIOCARTA.
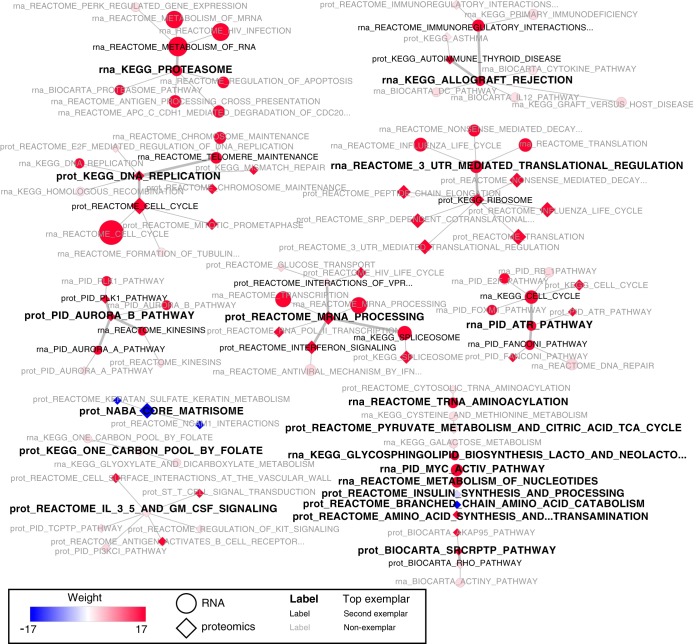
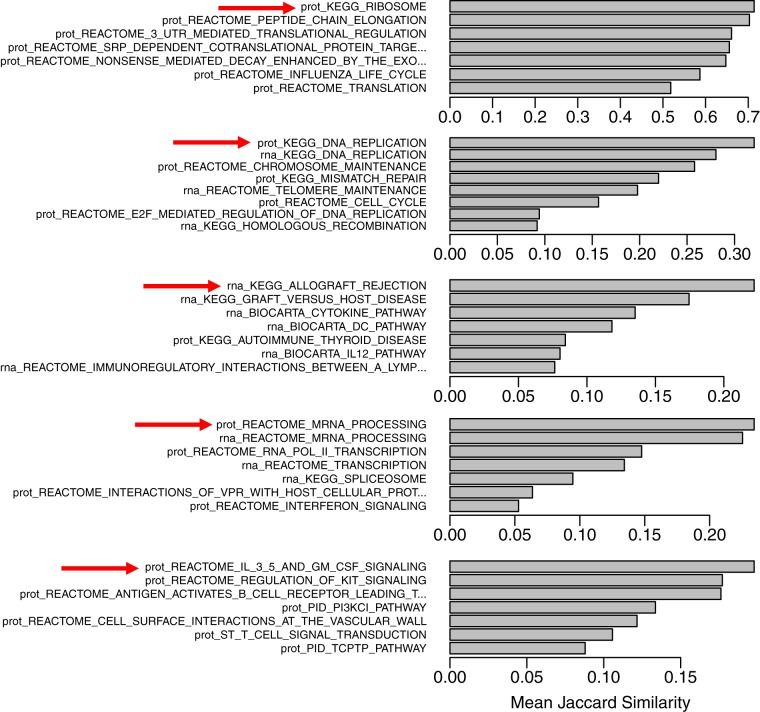
The 99 pathways (50 from RNA-Seq and 49 from proteomics) were clustered using affinity propagation. As shown in Fig. 5, affinity propagation clustered these gene sets into 19 groups with 1 to 12 pathways in each group. The algorithm selected the most representative gene set, termed “exemplar,” to represent each initial cluster (nodes with the smaller black font in Fig. 5) and further clustered the exemplars to pick one ultimate exemplar for each final cluster (nodes with the largest black font in Fig. 5). This ultimate exemplar is the gene set that best describes all the gene sets in the final cluster. To evaluate the exemplars selected by the algorithm, we further investigated the five groups with at least six connected gene sets (i.e. one exemplar plus five or more other sets) by computing pairwise Jaccard similarity scores between all gene sets in a group. As shown in Fig. 6, compared with the non-exemplars, the exemplars selected by affinity propagation had the highest mean Jaccard similarity score to the other gene sets in all five investigated groups.
Fig. 5.
Pathway clusters from basal versus luminal A enrichment analysis of proteomics and RNA-Seq data. Red nodes indicate up-regulation in basal, whereas blue nodes indicate up-regulation in luminal A samples. Enrichment results from proteomics data are identified by a diamond-shaped node, whereas results from RNA-Seq data are identified by a circle. The weight of the edge indicates the exemplar level, and the largest font indicates the exemplar of the cluster.
Fig. 6.
Mean Jaccard similarity between an individual pathway and each other pathway in the cluster. The exemplar chosen by affinity propagation is indicated with a red arrow.
Pathways identified by the same omics platform that have similar leading-edge genes, but different pathway names were grouped together (Fig. 5). For example, the KEGG spliceosome pathway was grouped with the Reactome pathway mRNA Processing. These are both processes that prepare mature RNA, although this conclusion would require manual searching without affinity propagation. Affinity propagation is also useful to group gene sets across platforms. Gene sets with identical names, such as the PID ATR Pathway enriched in both the RNA-Seq and proteomics data, were grouped together. Moreover, gene sets with dissimilar names but similar leading-edge genes, such as the Reactome Cell Cycle and the KEGG DNA replication pathway enriched in the protein data, were also grouped together. Although most groups included pathways enriched in both platforms, a few groups, such as the groups exemplified by KEGG Proteasome and by NABA Core Matrisome, included only pathways identified in RNA-Seq and proteomics, respectively.
Pan-Cancer Survival Analysis Using Sumer
In addition to integrating results from multiple omics platforms within a single study, Sumer can be applied to integrate single omics results from multiple studies. Here we present a use case identifying pathways associated with survival across multiple cancer types.
TCGA provides both RNA-Seq data and clinical data for over 30 types of tumors from individual patients. Using Cox regression analysis, association of gene expression with survival were performed for seven cancer types (bladder (BLCA), breast (BRCA), colorectal (COADREAD), kidney (KIPAN), leukemia (LAML), lung adenocarcinoma (LUAD), and endometrial (UCEC)) that had a significant number of samples (Table II). GSEA analysis using Wikipathway gene sets of the RNA-Seq data ranked by association to survival was performed for the seven cancer types. Between 6 and 52 pathways were significantly associated with survival in these cancer types (Table III). Weighted set cover did not significantly reduce the number of pathways, likely because of the low gene set redundancy within the Wikipathway database and the minimal number of significant pathways (Table III).
Table II. Pan-cancer survival analysis data.
| Cancer type | Total number of patients | Number of deceased patients | Number of genes with expression data |
|---|---|---|---|
| Bladder | 398 | 176 | 20041 |
| Breast | 1051 | 151 | 20108 |
| Colorectal | 367 | 86 | 19733 |
| Kidney | 861 | 226 | 20169 |
| Leukemia | 149 | 93 | 19208 |
| Lung | 492 | 178 | 19980 |
| Endometrial | 162 | 32 | 19801 |
Table III. Enrichment results from a pan-cancer survival analysis.
| Cancer type | Number of enriched pathways, upregulated | Number of enriched pathways after set cover, upregulated | Number of enriched pathways, downregulated | Number of enriched pathways after set cover, downregulated |
|---|---|---|---|---|
| Bladder | 45 | 43 | 7 | 7 |
| Breast | 0 | 0 | 16 | 16 |
| Colorectal | 0 | 0 | 22 | 20 |
| Kidney | 15 | 14 | 11 | 11 |
| Leukemia | 29 | 24 | 0 | 0 |
| Lung | 39 | 34 | 1 | 1 |
| Endometrial | 1 | 1 | 5 | 5 |
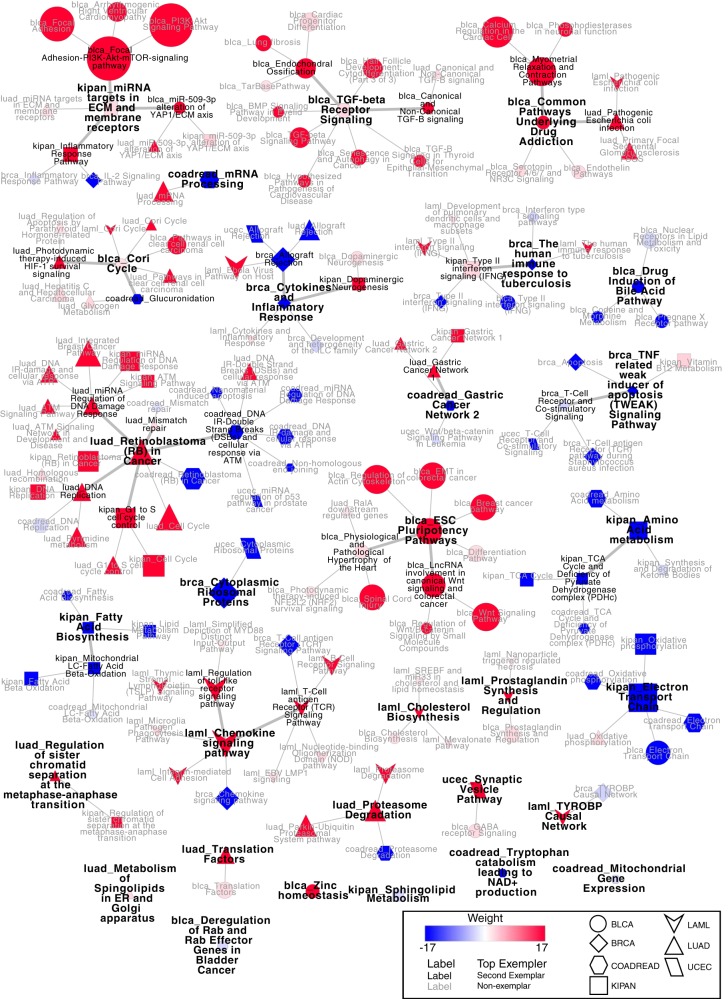
Affinity propagation clustered these gene sets into 29 groups with 1 to 21 pathways in each group (Fig. 7). ECM-related pathways were associated with poor prognosis in several cancer types (bladder cancer, kidney cancer, and lung adenocarcinoma). Amino acid metabolism, which clustered with other metabolic-related signaling pathways, was associated with good prognosis in kidney and colorectal cancer.
Fig. 7.
Pathways clusters from the pan-cancer survival analysis. Red nodes indicate a positive association with worse survival, whereas blue nodes indicate positive association with survival. The weight of the edge indicates the exemplar level, and the largest font indicates the cluster exemplar. The node shape identifies the cancer type.
Sumer furthermore clearly shows cancer-specific differences in pathways. In colorectal and endometrial cancers, the expression of a set of genes in DNA damage response pathways is associated with survival, whereas a similar set of genes is negatively associated with survival in lung adenocarcinoma and kidney cancer (Fig. 7). Additionally, the pathway Retinoblastoma (RB) in Cancer was associated with poor survival in lung adenocarcinoma and kidney cancer, but it was associated with good survival in colorectal cancer. Finally, cancer-specific pathways were highlighted by Sumer. A cluster of pathways related to ESC pluripotency and WNT signaling were almost exclusively associated with poor survival in bladder cancer.
DISCUSSION
We have shown here a method to reduce gene set redundancy after enrichment analysis and to consolidate results from multiple enrichment analyses. First, removing annotation redundancy vastly reduces the overwhelming number of significant sets from a single enrichment analysis when the original database contained significant gene set redundancy and allows focused analyses on the most interesting gene sets. Affinity propagation clustering can then identify common themes from the remaining gene sets both in a single enrichment analysis and across multiple experiments. Although other related algorithms require manual interpretation of each gene set cluster, affinity propagation automatically recommends one exemplar for each gene set cluster.
We demonstrated the utility of Sumer to integrate enrichment analyses from multi-omics data in a single study. Breast cancer can be separated into several subtypes based on gene expression. The basal and luminal subtypes have very different prognoses, treatment options, and outcomes. The enrichment analyses identified the well-known differences between the groups. The luminal A subtype tends to slowly proliferate and has better outcomes, whereas the basal subtype has an impaired DNA damage response and poor clinical outcomes (26). This was recapitulated by the enrichment of cell cycle-related pathways (i.e. KEGG DNA Replication, Reactome Cell Cycle, KEGG Cell Cycle, and PID E2F Pathway) and the DNA damage-related pathways (i.e. PID Fanconi Pathway, PID ATR pathway, and Reactome DNA Repair) in the basal subtype. Integrating enrichment results from proteomics data emphasized the common up-regulation of cell cycle genes and DNA repair genes at both the transcription and translation levels. Finally, pathways specific to an omics type were highlighted by the clustering analysis. The Core Matrisome pathway, which contains core extracellular matrix genes, was more highly enriched in luminal samples solely in the proteomic data. This might suggest post-translational regulation of the proteins in this pathway.
Sumer can further be used to integrate results from multiple studies. Poor survival in several cancer types correlated with high expression of ECM-related genes, indicating this may be a common mechanism across cancer. However, there were also differences among cancer types. Interestingly, the Retinoblastoma (RB) in Cancer Pathway was correlated with poor survival in lung adenocarcinoma and kidney cancer, but it correlated with good survival in colorectal cancer. The retinoblastoma gene product, RB, is a classic tumor suppressor and master cell cycle regulator. The gene is frequently mutated or deleted in cancer, including lung adenocarcinoma (27). However, the RB gene is frequently amplified in colorectal cancer and the protein is often overexpressed (28, 29). This may indicate differing function of the RB pathway in these different cancer types.
A unique strength of affinity propagation is to automatically identify an exemplar for each gene set cluster. Our analysis in Fig. 6 demonstrated the statistical appropriateness of the selected exemplars. Nevertheless, the chosen exemplars may not always have the most biologically relevant names. For example, an exemplar in the pan-cancer survival study was the Human Immune Response to Tuberculosis pathway enriched from breast cancer. The response to tuberculosis may not describe the function of those genes in breast cancer. However, the other sets in the cluster clarify that the genes in that pathway are likely related to interferon signaling, which has been linked to cancer prognosis and survival (30).
Importantly, Sumer allows for significant customization based on the user's preferences. We demonstrated the case of using Sumer to consolidate and aggregate gene sets based on user-defined gene sets. This provides focused analysis of the genes most significantly associated with gene sets, such as using only the leading edge genes from GSEA or the overlapping genes between the submitted list and the gene set from ORA analysis. Furthermore, Sumer accepts a user-defined weight for the weighted set cover algorithm to prioritize sets for consolidation and aggregation. This provides a significant advantage over the original set cover algorithm (i.e. weighted set cover with uniform weights) which prioritizes the largest gene sets (15). However, the choice is left to the user to decide the best prioritization for their analysis. Furthermore, Sumer provides downloadable figures and result tables, allowing users to perform additional analyses or figure customization. Because Sumer simply takes tables of scores associated with gene sets and corresponding GMT files as input, it is compatible with different enrichment analysis tools.
In summary, Sumer is a flexible tool for condensing and consolidating gene set analysis results from multi-omics or other types of integrative studies.
Supplementary Material
Footnotes
* This work was supported by grants U24CA210954 from the National Cancer Institute Clinical Proteomic Tumor Analysis Consortium (CPTAC), by grant CPRIT RR160027 from the Cancer Prevention & Research Institutes of Texas, and by funding from the McNair Medical Institute at The Robert and Janice McNair Foundation.
 This article contains supplemental material.
1 The abbreviations used are:
- BLCA
- bladder urothelial cancer
- BRCA
- breast invasive carcinoma
- COADREAD
- colorectal adenocarcinoma
- CPTAC
- Clinical Proteomic Tumor Analysis Consortium
- FDR
- false discovery rate
- GO
- gene ontology
- GSEA
- gene set enrichment analysis
- KIPAN
- pan kidney cancer cohort
- LAML
- acute myeloid leukemia
- LUAD
- lung adenocarcinoma
- ORA
- over-representation analysis
- PID
- Pathway Interaction Database
- TCGA
- The Cancer Genome Atlas
- UCEC
- uterine endometrial carcinoma.
REFERENCES
- 1. Ashburner M., Ball C. A., Blake J. A., Botstein D., Butler H., Cherry J. M., Davis A. P., Dolinski K., Dwight S. S., Eppig J. T., Harris M. A., Hill D. P., Issel-Tarver L., Kasarskis A., Lewis S., Matese J. C., Richardson J. E., Ringwald M., Rubin G. M., and Sherlock G. (2000) Gene ontology: tool for the unification of biology. The Gene Ontology Consortium. Nat. Genet. 25, 25–29 [DOI] [PMC free article] [PubMed] [Google Scholar]
- 2. The Gene Ontology Consortium. (2017) Expansion of the Gene Ontology knowledgebase and resources. Nucleic Acids Res. 45, D331–D338 [DOI] [PMC free article] [PubMed] [Google Scholar]
- 3. Kanehisa M., Furumichi M., Tanabe M., Sato Y., and Morishima K. (2017) KEGG: new perspectives on genomes, pathways, diseases and drugs. Nucleic Acids Res. 45, D353–D361 [DOI] [PMC free article] [PubMed] [Google Scholar]
- 4. Slenter D. N., Kutmon M., Hanspers K., Riutta A., Windsor J., Nunes N., Mélius J., Cirillo E., Coort S. L., Digles D., Ehrhart F., Giesbertz P., Kalafati M., Martens M., Miller R., Nishida K., Rieswijk L., Waagmeester A., Eijssen L. M. T., Evelo C. T., Pico A. R., and Willighagen E. L. (2018) WikiPathways: a multifaceted pathway database bridging metabolomics to other omics research. Nucleic Acids Res. 46, D661–D667 [DOI] [PMC free article] [PubMed] [Google Scholar]
- 5. Fabregat A., Jupe S., Matthews L., Sidiropoulos K., Gillespie M., Garapati P., Haw R., Jassal B., Korninger F., May B., Milacic M., Roca C. D., Rothfels K., Sevilla C., Shamovsky V., Shorser S., Varusai T., Viteri G., Weiser J., Wu G., Stein L., Hermjakob H., and D'Eustachio P. (2018) The Reactome Pathway Knowledgebase. Nucleic Acids Res. 46, D649–D655 [DOI] [PMC free article] [PubMed] [Google Scholar]
- 6. Schaefer C. F., Anthony K., Krupa S., Buchoff J., Day M., Hannay T., and Buetow K. H. (2009) PID: the Pathway Interaction Database. Nucleic Acids Res. 37, D674–D679 [DOI] [PMC free article] [PubMed] [Google Scholar]
- 7. Liberzon A., Subramanian A., Pinchback R., Thorvaldsdóttir H., Tamayo P., and Mesirov J. P. (2011) Molecular signatures database (MSigDB) 3.0. Bioinformatics 27, 1739–1740 [DOI] [PMC free article] [PubMed] [Google Scholar]
- 8. Zhang B., Kirov S., and Snoddy J. (2005) WebGestalt: an integrated system for exploring gene sets in various biological contexts. Nucleic Acids Res. 33, W741–W748 [DOI] [PMC free article] [PubMed] [Google Scholar]
- 9. Subramanian A., Tamayo P., Mootha V. K., Mukherjee S., Ebert B. L., Gillette M. A., Paulovich A., Pomeroy S. L., Golub T. R., Lander E. S., and Mesirov J. P. (2005) Gene set enrichment analysis: A knowledge-based approach for interpreting genome-wide expression profiles. Proc. Natl. Acad. Sci. U.S.A. 102, 15545–15550 [DOI] [PMC free article] [PubMed] [Google Scholar]
- 10. Wang J., Vasaikar S., Shi Z., Greer M., and Zhang B. (2017) WebGestalt 2017: a more comprehensive, powerful, flexible and interactive gene set enrichment analysis toolkit. Nucleic Acids Res. 45, W130–W137 [DOI] [PMC free article] [PubMed] [Google Scholar]
- 11. Huang D. W., Sherman B. T., and Lempicki R. A. (2009) Bioinformatics enrichment tools: paths toward the comprehensive functional analysis of large gene lists. Nucleic Acids Res. 37, 1–13 [DOI] [PMC free article] [PubMed] [Google Scholar]
- 12. Kuleshov M. V., Jones M. R., Rouillard A. D., Fernandez N. F., Duan Q., Wang Z., Koplev S., Jenkins S. L., Jagodnik K. M., Lachmann A., McDermott M. G., Monteiro C. D., Gundersen G. W., and Ma'ayan A. (2016) Enrichr: a comprehensive gene set enrichment analysis web server 2016 update. Nucleic Acids Res. 44, W90–97 [DOI] [PMC free article] [PubMed] [Google Scholar]
- 13. Belinky F., Nativ N., Stelzer G., Zimmerman S., Iny Stein T., Safran M., and Lancet D. (2015) PathCards: multi-source consolidation of human biological pathways. Database pii: bav006. [DOI] [PMC free article] [PubMed] [Google Scholar]
- 14. Vivar J. C., Pemu P., McPherson R., and Ghosh S. (2013) Redundancy control in pathway databases (ReCiPa): an application for improving gene-set enrichment analysis in Omics studies and “Big data” biology. OMICS 17, 414–422 [DOI] [PMC free article] [PubMed] [Google Scholar]
- 15. Stoney R. A., Schwartz J.-M., Robertson D. L., and Nenadic G. (2018) Using set theory to reduce redundancy in pathway sets. BMC Bioinformatics 19, 386. [DOI] [PMC free article] [PubMed] [Google Scholar]
- 16. Hernández-de-Diego R., Tarazona S., Martínez-Mira C., Balzano-Nogueira L., Furió-Tarí P., Pappas G. J., and Conesa A. (2018) PaintOmics 3: a web resource for the pathway analysis and visualization of multi-omics data. Nucleic Acids Res. 46, W503–W509 [DOI] [PMC free article] [PubMed] [Google Scholar]
- 17. Sass S., Buettner F., Mueller N. S., and Theis F. J. (2015) RAMONA: a Web application for gene set analysis on multilevel omics data. Bioinformatics 31, 128–130 [DOI] [PubMed] [Google Scholar]
- 18. Bindea G., Mlecnik B., Hackl H., Charoentong P., Tosolini M., Kirilovsky A., Fridman W.-H., Pagès F., Trajanoski Z., and Galon J. (2009) ClueGO: a Cytoscape plug-in to decipher functionally grouped gene ontology and pathway annotation networks. Bioinformatics 25, 1091–1093 [DOI] [PMC free article] [PubMed] [Google Scholar]
- 19. Merico D., Isserlin R., Stueker O., Emili A., and Bader G. D. (2010) Enrichment map: A network-based method for gene-set enrichment visualization and interpretation. PLoS ONE 5, e13984. [DOI] [PMC free article] [PubMed] [Google Scholar]
- 20. Frey B. J., and Dueck D. (2007) Clustering by passing messages between data points. Science 315, 972–976 [DOI] [PubMed] [Google Scholar]
- 21. Jourquin J., Duncan D., Shi Z., and Zhang B. (2012) GLAD4U: deriving and prioritizing gene lists from PubMed literature. BMC Genomics 13, S20. [DOI] [PMC free article] [PubMed] [Google Scholar]
- 22. Vasaikar S. V., Straub P., Wang J., and Zhang B. (2018) LinkedOmics: analyzing multi-omics data within and across 32 cancer types. Nucleic Acids Res. 46, D956–D963 [DOI] [PMC free article] [PubMed] [Google Scholar]
- 23. Hochbaum D. S. (1997) in ed Hochbaum DS. (PWS Publishing Co., Boston, MA: ), pp 94–143 [Google Scholar]
- 24. Golab L., Korn F., Li F., Saha B., and Srivastava D. (2015) in 2015 IEEE 31st International Conference on Data Engineering, pp 879–890, IEEE, Seoul, South Korea [Google Scholar]
- 25. Bertucci F., Finetti P., and Birnbaum D. (2012) Basal breast cancer: A complex and deadly molecular subtype. Curr. Mol. Med. 12, 96–110 [DOI] [PMC free article] [PubMed] [Google Scholar]
- 26. Bertucci F., Finetti P., Cervera N., Charafe-Jauffret E., Buttarelli M., Jacquemier J., Chaffanet M., Maraninchi D., Viens P., and Birnbaum D. (2009) How different are luminal A and basal breast cancers? Int. J. Cancer 124, 1338–1348 [DOI] [PubMed] [Google Scholar]
- 27. Greulich H. (2010) The Genomics of Lung Adenocarcinoma. Genes Cancer 1, 1200–1210 [DOI] [PMC free article] [PubMed] [Google Scholar]
- 28. Yamamoto H., Soh J. W., Monden T., Klein M. G., Zhang L. M., Shirin H., Arber N., Tomita N., Schieren I., Stein C. A., and Weinstein I. B. (1999) Paradoxical increase in retinoblastoma protein in colorectal carcinomas may protect cells from apoptosis. Clin. Cancer Res. 5, 1805–1815 [PubMed] [Google Scholar]
- 29. Oliveira D. M., Santamaria G., Laudanna C., Migliozzi S., Zoppoli P., Quist M., Grasso C., Mignogna C., Elia L., Faniello M. C., Marinaro C., Sacco R., Corcione F., Viglietto G., Malanga D., and Rizzuto A. (2018) Identification of copy number alterations in colon cancer from analysis of amplicon-based next generation sequencing data. Oncotarget 9, 20409–20425 [DOI] [PMC free article] [PubMed] [Google Scholar]
- 30. Research AAfor, C. (2014) Type I IFN Signaling in Cancer Cells Enhances Chemotherapy Responses. Cancer Discov. 4, 1365–1365 [Google Scholar]
Associated Data
This section collects any data citations, data availability statements, or supplementary materials included in this article.


