

Abstract
Atopic dermatitis (AD) affects up to 20% of children and adults worldwide. To gain a deeper understanding of the pathophysiology of AD, we conducted a large-scale transcriptomic study of AD with deeply-sequenced RNA-seq samples using long (126) paired-end reads. In addition to the comparisons against previous transcriptomic studies, we conducted in-depth analysis to obtain a high-resolution view of the global architecture of the AD transcriptome and contrasted it with that of psoriasis from the same cohort. By using 147 RNA-samples in total, we found striking correlation between dysregulated genes in lesional psoriasis and lesional AD skin with 81% of AD dysregulated genes being shared with psoriasis. However, we described disease-specific molecular and cellular features, with AD skin showing dominance of IL-13 pathways but with near undetectable IL-4 expression. We also demonstrated greater disease heterogeneity and larger proportion of dysregulated lncRNAs in AD, and illustrated the translational impact, including skin-type classification and drug-target prediction. This study is by far the largest study comparing the AD and psoriasis transcriptomes using RNA-seq and demonstrating the shared inflammatory components as well as specific discordant cytokine signatures of these two skin diseases.
Keywords: Atopic dermatitis, psoriasis, RNA-seq, cytokine signature, bioinformatics, integrative analysis
I. Introduction
Atopic dermatitis (AD) is a common chronic inflammatory skin disease that affects up to 20% of children and adults of different populations (DaVeiga, 2012). It has a complex genetic condition (Paternoster et al., 2015) and is characterized by disturbed epidermal architecture and keratinocyte differentiation as well as excessive T cell mediated inflammation (Boehncke and Schon, 2015, Wei dinger and Novak, 2016). While these pathophysiological features are broadly shared with psoriasis, the clinical presentations are mutually exclusive with opposing genetic effects in shared pathways (Baurecht et al., 2015) and antagonistic immune deviations (Eyerich et al., 2011). While different groups have investigated the AD transcriptome using microarray technology (Choy et al., 2012, Gittler et al., 2012, Quaranta et al., 2014, Rodriguez et al., 2014, Suarez-Farinas et al., 2015), the sample sizes so far have been relatively small when compared against those conducted for psoriasis. In addition, AD is a heterogeneous disease that has been proposed to comprise several distinct subtypes (Thijs et al., 2017, Weidinger and Novak, 2016). In contrast, transcriptomic studies, particularly RNA-seq based, have been instrumental in identifying transcripts and pathways in psoriasis (Gudjonsson et al., 2010, Li et al., 2014, Swindell et al., 2013, Tsoi et al., 2015), establishing psoriasis as a Th17/IL-23 and TNF–associated disease (Greb et al., 2016, Varshney et al., 2016); and AD based studies have been mostly limited to lower resolution microarray-based studies (Choy et al., 2012, Gittler et al., 2012, Guttman-Yassky et al., 2009, Nomura et al., 2003, Rodriguez et al., 2014, Suarez-Farinas et al., 2011). There have been limited RNA-seq based small studies conducted on AD skin (Suarez-Farinas et al., 2015), and a small number of microarray based studies have attempted to disentangle the specific transcriptomic signatures of psoriasis versus AD (Choy et al., 2012, Guttman-Yassky et al., 2009, Nomura et al., 2003, Quaranta et al., 2014). Here, we performed RNA-seq by sequencing in high-depth the transcriptomes of 147 samples from carefully matched and tightly defined cohorts of AD patients, PSO patients, and healthy controls, whom were recruited within an ongoing investigator-initiated clinical study to identify shared and distinct disease mechanisms of AD and Psoriasis. We hypothesized that by integrating deep sequencing-based transcriptome profiling with systems biology analysis, we are able to provide deep characterization for the expression signatures for AD, and by including psoriasis samples in the analysis, we can reveal the distinct molecular features of uninvolved and lesional skin of AD that have not been previously described.
II. Results
Transcriptomic architecture and components of AD
Our cohort provides the largest number of co-sequenced AD and psoriasis samples of uninvolved and lesional skin to date (Supplementary Tables 1–3) and obtained on average >31 million read (126bp) pairs per sample. With 80% of uniquely mapped reads, we detected expression of 31,364 genes. While the first two principal component (PCs) computed using the whole transcriptome can separate the normal/uninvolved skin versus lesional skin samples, they were not adequate to provide clean separation for psoriasis and AD lesional skin (Supplementary Figure 1). However, the top three PCs could provide a near perfect separation between the different lesional skin types (Figure 1a). AD has been regarded a heterogeneous clinical condition (Weidinger and Novak, 2016), and we evaluated the transcriptomic heterogeneity using the top principal components, and demonstrate that the AD lesional skin presents a higher degree of heterogeneity than psoriasis (Figure 1b). By using psoriasis lesional skin as a reference, these results provide molecular and mechanistic support to complement previous clinical- or genetic-based observations for the heterogeneity of AD (Cole et al., 2014, Weidinger and Novak, 2016).
Figure 1. Transcriptomes of different skin types.
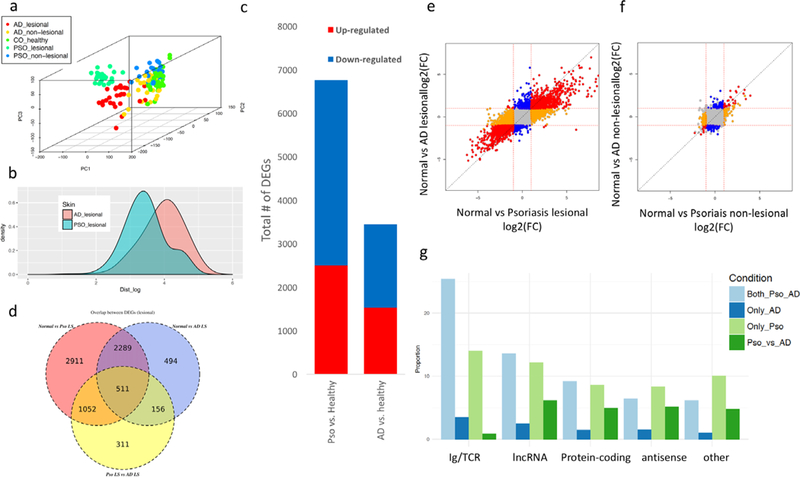
a) the top three principal components for the samples in the cohort; b) euclidean distance (in logarithmic scale) distributions between all pairwise samples within the AD and Psoriasis skin conditions. The distance was computed using the top 3 principal components; c) Venn Diagram showing the overlap between the differentially expressed genes in lesional skin; d) number of differentially expressed genes in lesional skin; e-f) scatter plots illustrating the concordance between lesional (e) and non-lesional (f) skin for psoriasis and AD, coloring genes differentially expressed in both axis (red), only in the x-axis (orange), or only in the y-axis (blue); g) proportion of differentially expressed genes under each category for different differential expression conditions.
Differential expression (DE; Supplementary Table 4) analyzes were conducted to identify differentially expressed genes, DEGs (False Discovery Rate, FDR≤5% and |log2(Fold Change)|≥1). Our results are concordant with previous studies in psoriasis (Li et al., 2014, Tsoi et al., 2015), which demonstrated large number of DEGs (up/down=2,502/4,261) when comparing normal versus psoriasis lesional skin; Figure 1c). The DE analysis for normal versus AD lesional skin, revealed substantial larger number of DEGs (up/down=1,529/1,921) compared to previous studies (Gittler et al., 2012, Rodriguez et al., 2014, Suarez-Farinas et al., 2011, Suarez-Farinas et al., 2015), suggesting that the sample size and the deep-sequencing can enhance the statistical power for more robust characterization of AD lesional skin. In fact, when comparing the changes in AD skin measured in previous microarray studies, we demonstrated the limited ability of microarray technology to detect low-expressing transcripts (Supplementary Figure 2). For instance, IL-13, an up-regulated cytokine in AD, could only be identified as significant in our study but not in previous microarray experiments.
Strikingly, we identified a large amount of DEGs (2,800) shared between AD and psoriasis lesional skin (Figure 1d; corresponding to 41% and 81% of the psoriasis and AD DEGs, respectively), and the correlations of the magnitudes in dysregulation in lesional skin in both diseases were significantly correlated (Figure 1e; Spearman ρ=0.8; p<1×10¹⁶). In contrast, direct comparison between AD versus psoriasis lesional skin showed lower number of DEGs (up/down=1,259/771) than those revealed in the normal versus lesional comparison. The DE results for comparing non-lesional with lesional AD skin illustrate similar findings (Supplementary Table 4). Despite modest differences between normal and non-lesional skin of psoriasis (also versus non-lesional skin of AD), the dysregulation in uninvolved skin was significantly correlated with those in lesional skin (ρ=0.55 and 0.64 for psoriasis and AD, respectively; p<1×10~16), suggesting that non-lesional skin exhibit subtle pro-inflammatory responses and epidermal dysregulation that are further manifested in lesional skin. Interestingly, we also observed significant correlation (ρ=0.4; p<1×10~16) between the magnitudes of dysregulation in the psoriatic and AD non-lesional skin (Figure 1f). These evaluations identified gene profiles that mark progression from normal to uninvolved to inflamed skin and illustrated a surprisingly high degree of concordance between the gene expression in lesional AD and psoriatic skin.
We demonstrated previously that a higher proportion of long noncoding (lnc)RNAs tend to be differentially expressed in the psoriatic lesional skin than protein-coding genes, probably due to differences in cellular compositions (Tsoi et al., 2015). We observed the same trend in this study (i.e. 30% lncRNA vs 21% protein-coding are DEGs) (Supplementary Figure 3). Interestingly, a higher proportion of lncRNAs tended to be differentially expressed in lesional AD skin (17% vs 11%). These results were not influenced by the large number of DEGs overlapping between AD and psoriasis skin, as we still demonstrated consistent results in both AD-only and psoriasis-only DEGs (Figure 1g). Notably, while “Immunoglobin/T-cell receptor” was the gene category with the largest proportion of DEGs in any of the control versus lesional skin comparisons, it represents the smallest proportion in the direct psoriasis versus AD DE analysis, suggesting that the diseases share overlapping inflammatory pathways and responses (see below). Despite otherwise distinct clinical features of AD and psoriasis, these two diseases have significant overlap in their molecular architecture, particularly in categories related to inflammatory responses.
Common and specific molecular and cellular features of AD and Psoriasis
We identified 469 significant functions enriched in the common DEGs for lesional skin in AD/psoriasis, including functions associated with immunological responses, and interferon and cytokine signaling pathways (top functions in Figure 2a; full list in Supplementary Table 5). When comparing the enrichment results between the AD-only versus the Psoriasis-only DEGs, we observed distinct patterns of significance (Figure 2b). Functions involving in growth factor activity and myeloid dendritic cell activation were enriched in AD-only DEGs (Supplementary Table 5), while genes involved in functions like MHC class I antigen processing/presentation, cell cycle, and arginine/proline metabolism were enriched in psoriasis-only DEGs (Figure 2c). Nerve growth factor levels have been shown to reflect the severity of itching and eruption in AD (Yamaguchi et al., 2009), and perturbation of proline/arginine metabolism has been demonstrated in psoriasis (Kamleh et al., 2015). Functions that were enriched among genes dysregulated in the direct AD versus psoriasis comparison included “carbohydrate derivative binding”, “collagen metabolic process” (Supplementary Table 5), among the significant functions encompassing AD specific DEGs included activity and composition of “chloride channels”, “regulation of fibroblast growth factor receptor signaling pathway”, “regulation of macrophage activation”, and “GABA ERK1/2 receptor activity” (Figure 2d). Interestingly, recent experimental data indicate that dysregulation of epidermal chloride channels (Seltmann et al., 2018), fibroblast growth factor receptor signaling (Sulcova et al., 2015), as well as P38/ERK MAPK signaling pathways (Tan et al., 2017) all impact epidermal barrier function and cutaneous homoeostasis and might be involved in the pathogenesis of AD.
Figure 2. Functional analysis for differentially expressed genes.
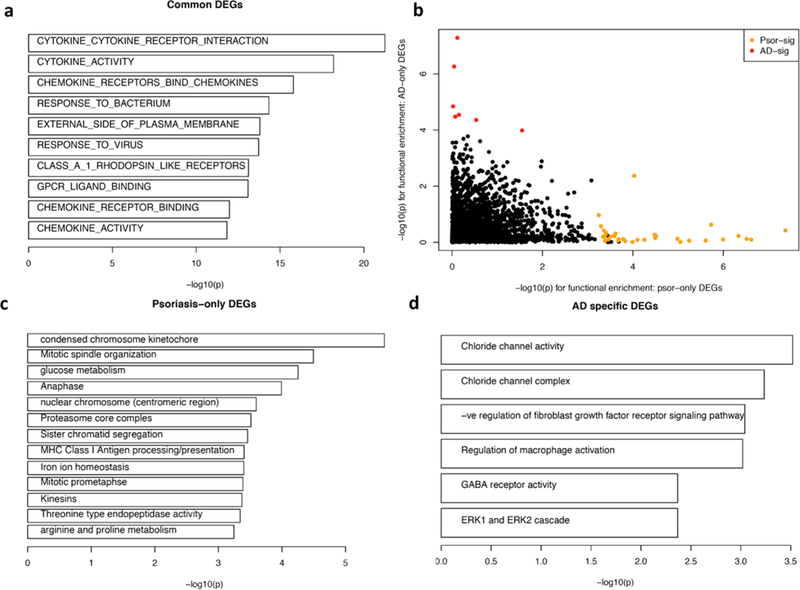
a) Biological functions with corresponding genes significantly overlapped (-log(p-value) for each function is shown) against genes commonly differentially expressed in AD and psoriatic lesional skin; b) functional enrichment results between the psoriasis-only (x-axis) versus AD-only (y-axis) DEGs, each point represents one function; c) top significant functions enriched among genes differentially expressed only in psoriatic lesional skin but not in AD lesional skin; d) significant functions encompassing genes differentiating AD and Psoriasis, and the genes are differentially expressed AD lesional skin but not in psoriatic skin.
The DE analysis demonstrated overlap between the transcriptomes of non-lesional skin from AD and psoriasis patients (Figure 1f), when each was compared to normal control skin. Interestingly, each of the AD and psoriatic non-lesional skin DE gene sets were enriched for 32 significant functions/pathways, and >50% (17) of these overlapped, including “keratinocytes differentiation” (p<=5×10⁻¹¹) and “cytokine activity” (p<=1×10⁻³) (Supplementary Table 6). Interestingly, for “keratinocyte differentiation” the same genes (i.e. LCE3A/D, S100A7, etc.) were dysregulated in the same direction in both types of non-lesional skin, with S100A7 and other precursor genes of cornified cell envelope (e.g. SPRR2A/B) having a higher expression in psoriasis non-lesional skin than AD non-lesional skin, and late cornified genes (i.e. LCE3A/D) showing no difference between the two non-lesional types. While both non-lesional skin have alterations in common genes associated with keratinocyte differentiation, the changes were greater in psoriasis. For “cytokine activity”, different dysregulated genes were involved in psoriasis non-lesional (CCL4, IL19, IL36A/G) and AD non-lesional (CCL13, CCL18, IL13, IL20, IL26) (see also below).
We evaluated the profiles for 33 cytokines expressed in our skin samples to further characterize the inflammatory signatures (Figure 3). Cytokines encoding IL-17 (IL17A/F), IL-36 (IL36A/G), and interferon responses (IFNG) had the most prominent expression in lesional psoriatic skin (at least 7-fold more highly expressed in psoriasis as compared to AD, respectively). It is noteworthy that IL36, which has been studied in psoriasis extensively (Mahil et al., 2017), is also elevated in AD lesional skin (Figure 3, Supplementary Figure 4). IL-20 family cytokines, which have been shown to contribute to epidermal proliferation (i.e. IL19, IL20, IL22, IL24) were elevated in both AD and psoriasis. The Th2 signature gene, IL13, was the most distinctive markers for AD. In strong contrast to IL13, mRNA expression of IL4 was detectable in only 40% of the AD lesional samples, and at very low expression levels (Supplementary Table 7), suggesting that AD is an IL-13 rather than IL-4 driven disease (Tazawa et al., 2004).
Figure 3. Gene expressions for cytokines.
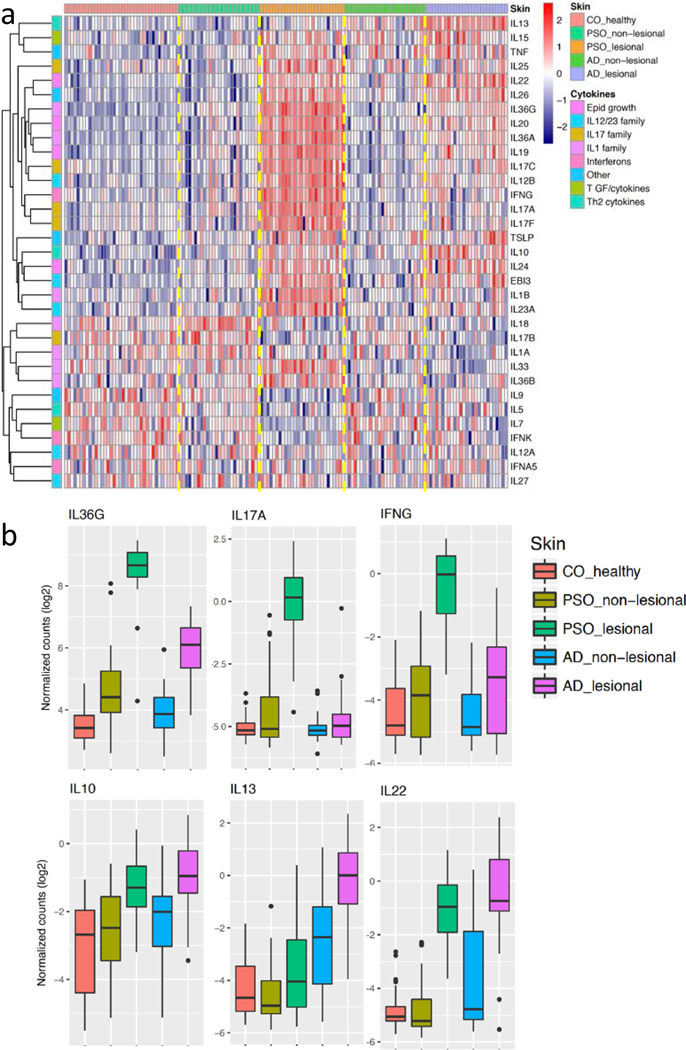
a) Heatmap illustrates the expression levels of different cytokines (rows; stratified by their families) across different samples (columns; stratified by different skin types); b) boxplots to illustrate the expression distributions of six cytokines across the different skin conditions.
We then analyzed the enrichment of DEGs near different immune cell-specific active enhancer marks (defined by H3K27ac) using recent large-scale epigenomic datasets (Farh et al., 2015, Roadmap Epigenomics et al., 2015) to infer cell type origins for these transcripts (Figure 4a; Supplementary Table 8). The shared DEGs in the lesional skin of AD and psoriasis were highly enriched in Th1/Th2/Th17/monocyte marks, while the Th2 epigenomic signature was enriched among the AD-only DEGs. The nearby enhancers of Treg and Tmem were enriched in the common AD/psoriasis DEGs, while no enrichment in Tnaive cells was observed. Among the DEGs in the direct psoriasis versus AD comparison, enrichment for CD8+ memory cells in both the AD-elevated and the Psoriasis-elevated genes were observed separately. Using quantitative immunohistochemistry (Figure 4b; Supplementary Figure 5 and Supplementary Table 9), we illustrated that the proportions of CD8+ and CD3+ cells in lesional psoriasis skin were significantly increased compared to normal skin (p=0.01). Although we did not observe a significant increase in CD8+ cells in lesional AD skin when comparing against control or non-lesional AD skin, the presence of CD8+ cells and CD8+ chromatin signature (Figure 4) are consistent with previous suggestions that CD8+ T cells may play important roles in inflammatory cytokine production in AD, as well as psoriasis (Hijnen et al., 2013)
Figure 4. Cell type signatures in different skin types.
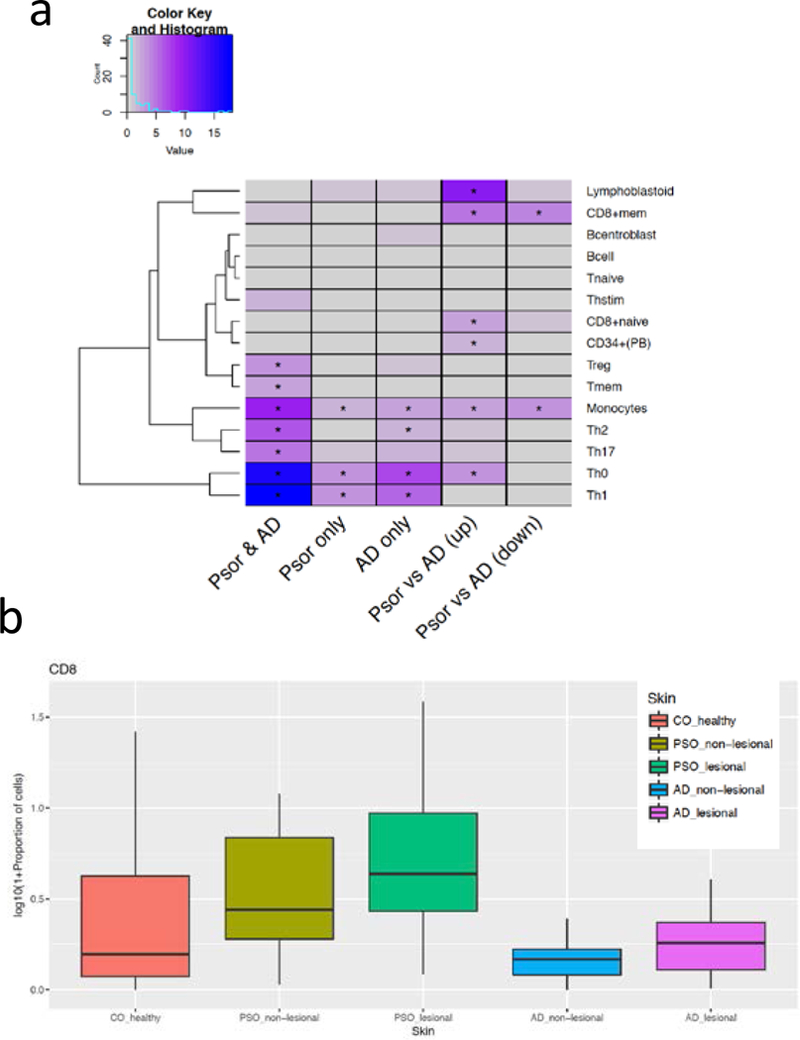
a) Heatmap illustrates the enrichment (negative logarithm of enrichment p-value) of differentially expressed genes (columns for different comparisons) against nearby H3k27ac marks specific in different immune cells (rows). * indicates FDR≤5%; b) proportions (%) of CD8 cells under different skin types (in logarithmic scale).
Using independent RNA-seq generated from keratinocytes stimulated by different cytokines, we correlated the gene expression responses against our disease DEGs (Figure 5a). When correlating cytokine responses in keratinocytes against the direct psoriatic versus AD lesional skin comparison, genes with higher expressions in psoriasis tend to be induced by IL-17A, IL-17A/TNF, IL-36α,β,γ and IFN-α; while genes with higher expressions in AD tend to be induced by IL-4 and IL-13. These results indicate that while both diseases might have contribution from IL-17A/IL-36/TNF/IFN-α responses, the magnitude and the degree of these responses are less intense in AD, and vice-versa for IL-4/IL-13. In fact, by using IL-17A, IL-4, and IL-13 responses as features, we could separate AD from psoriasis (Figure 5b). Notably, the uninvolved skin samples from both AD and psoriasis moved towards the same cytokine-response-axes as the affected AD and psoriatic skin, respectively.
Figure 5. Cytokine-induced signatures.
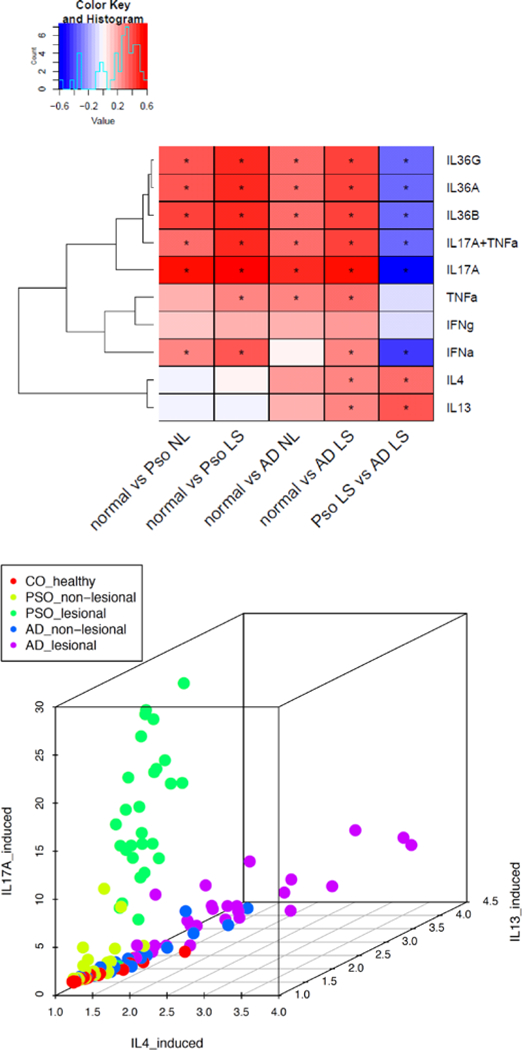
a) Heatmap shows the correlation between fold changes of dysregulated genes under cytokine-stimulated keratinocytes (rows) and fold changes of the DE analysis conducted in this study (columns). *indicates FDR≤5% and correlation coefficient ≥0.25; b) the scatter plot projects how each sample responds to IL-17A, IL-13, and IL-4 stimulations.
Transcriptomic analysis to provide translational inference for AD
We were able to provide near perfect classification for AD and psoriasis (Area under the Receiver Operating Curve (AUROC)=0.99 for left out dataset) using only the IL17A, IL13, and IL36G expression profiles (Figure 6a), the classification performance concords with results from previous studies using the expressions of NOS2 and CCL27 as biomarkers (Garzorz-Stark et al., 2016, Quaranta et al., 2014). Despite the modest differences between healthy skin and non-lesional AD skin, as well as healthy skin versus non-lesional psoriatic skin, we could obtain good classification: AUROC=0.86 for AD uninvolved skin using IL13, EBI3, IL26, IL20, IL5, IL36A, IL36G and AUROC=0.91 for psoriasis uninvolved skin using IL36G, IL19, IL18, IL36A, EBI3, IL13 (Supplementary Table 10). These results reinforce the presence of a “pre-inflammatory” signature in both uninvolved AD and psoriasis skin. Notably, while both IL17A and IL36G were up-regulated in psoriatic lesional skin, only IL36G, but not IL17A, was selected as one of the features differentiating normal from psoriatic non-lsional skin. Indeed, despite concordance between psoriasis uninvolved skin and IL17A induced effect in Figure 5a, IL36G, but not IL17A, was significantly up-regulated in non-lesional psoriatic skin.
Figure 6. Translational implications of this transcriptomic study.
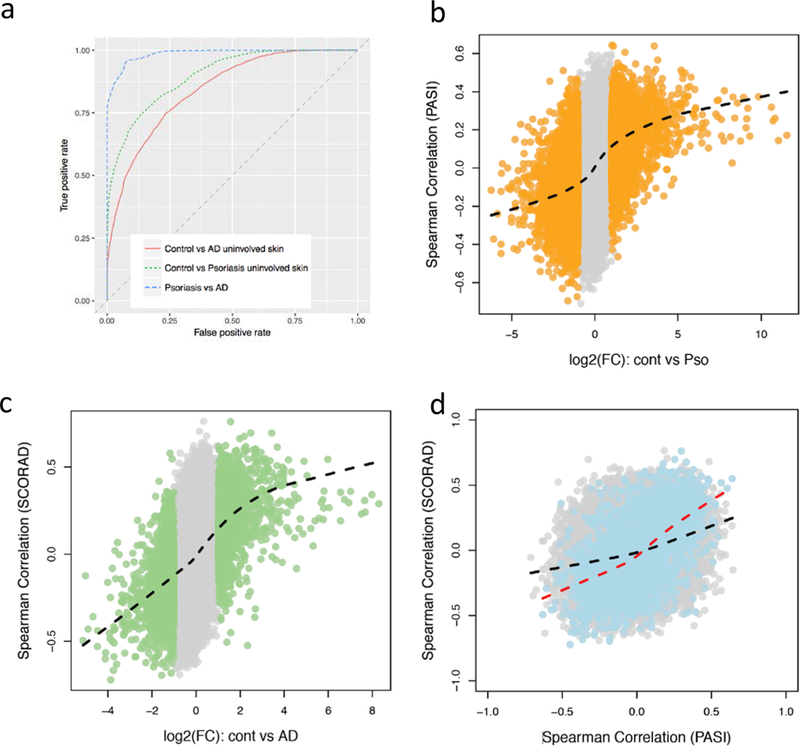
a) Area under ROC to evaluate the performance of classifying different skin types using machine learning approach; b) & c) for each gene, the effect size in control versus lesional skin comparison (x-axis) versus its Spearman correlation between the expression level and severity index (y-axis); d) for each gene, the comparison between the PASI correlation (x-axis) versus SCORAD correlation (y-axis). Black line indicates lowess fit using all genes (grey); red line represents lowess fit using only common DEGs (blue) in both AD and psoriatic lesional skin).
We hypothesized that with our larger transcriptomic cohort in AD lesional skin profiled using the higher resolution RNA sequencing technology, we would obtain more powerful associations for disease severity when comparing with previous work(Tejasvi et al., 2013). Analyzing expression of cytokines change with the severity index (PASI for psoriasis; SCORAD for AD (Oranje, 2011)) together revealed that IL17A, IL23A, IL27, and EBI3 were correlated (p<0.05) with PASI (all but IL27 was positively correlated), and IL13 and TSLP were positively correlated (p<0.05) with SCORAD (Supplementary Figure 6 and Supplementary Table 11). While these correlations are only nominally significant, we observed strong global correlations when associating the expression changes in lesional skin and the severity indices across the whole transcriptome for both associations (Figure 6b–c; Spearman correlations ρ=0.4; p<2×10⁻¹⁶), an observation which has not been described previously. Notably, the two Spearman correlation values from the above calculations were also highly correlated, particularly for the common AD/psoriasis DEGs (ρ=0.3 for whole genome versus ρ=0.6 for common DEGs; Figure 6d).
Finally, we investigated current medication gene targets for AD, and evaluated for enrichment among the different sets of DEGs. This demonstrated that existing drug targets for AD were highly enriched among DEGs in AD skin (p<5×10⁻¹⁴; Supplementary Figure 7; Supplementary Table 12). Extending this analysis to other drugs and determining whether their gene targets were enriched with AD DEGs, we observed enrichment for several steroid agents (budesonide, triamcinolone, beclomethasone, alclometasone dipropionate) (FDR<1%; Obs/Exp≥4). Most notably, tofacitinib, a Jak inhibitor, which has recent success in treating AD (Bissonnette et al., 2016), proved to be highly significant (p=5.4×10⁻¹⁸; Obs/Exp=4.9). These results demonstrate that transcriptomic data can be a valuable resource to reveal novel drug targets.
III. Discussion
AD is associated with epidermal barrier dysfunction, e.g. due to mutations in the FLG gene (O’Regan et al., 2008), type 1 allergic responses, with an increased susceptibility towards both bacterial and viral infections (Weidinger et al., 2018, Wollenberg et al., 2003). In addition, AD is also associated with atopic features such as asthma and allergic rhinitis. In line with this, 25% of the AD patients studied here carried a FLG mutation, and 60% suffered from comorbid asthma and/or rhinitis (Supplementary Table 2). In contrast, psoriasis typically is not associated with a general skin barrier dysfunction neither allergic features and is relatively resistant to skin infection. Although these two diseases are readily distinguished using clinical criteria, it has been suggested that AD and psoriasis exist on a “spectrum” (Guttman-Yassky and Krueger, 2017) and amendable to shared treatment approaches (Guttman-Yassky et al., 2017), based on shared immunological processes and the observation that with increased chronicity AD takes on histologic features that resemble psoriasis with associated prominence of Th1/IFN-γ responses (Guttman-Yassky et al., 2011). Our study provides novel insights into the shared and unique molecular features of psoriasis and AD: while the analyses revealed overlap of transcripts relevant for inflammation both in unaffected and affected skin, we identified distinct sets of gene features that clearly separate both diseases such as IL-13/IL-4 response in AD versus IL-17 responses in psoriasis.
AD has for a long time been considered a Th2 disease characterized by IL-4 cytokine responses (Leung and Bieber, 2003). A surprising finding was that the mRNA expression of IL4 was detectable in only 40% of AD samples. While we found prominent enrichment for “IL-4 responses” in AD skin (Figure 5), IL-4 has a short in vivo half-life, and shares much of its biology with the cytokine IL-13, and IL-13 shares the heterodimeric receptor IL-4R/IL-13Ra with IL-4 (Mueller et al., 2002). It is likely that the “IL-4 signature” is largely attributable to IL-13 and related to the excessive amounts of IL-13 in AD skin (Figure 3). In fact, IL-4/IL-13 inhibition through blockade of the IL-4R by dupilumab has been shown in several studies to be a highly effective treatment for AD (Blauvelt et al., 2017, Simpson et al., 2016), whereas no clinical trials directly targeting IL-4 in AD have ever been published. Consistent with our findings, anti-IL-13 targeted therapy, with tralokinumab, led to early and sustained improvement in AD symptoms(Wollenberg et al., 2018).
We acknowledge that AD is a heterogeneous disease and thus transcriptomic profiling results can vary as lesions evolve. In this study, we recruited only adult patients with a chronic AD/Psoriasis using established criteria (for AD, the American Academy of Dermatology Consensus Criteria). Only AD lesions with a reported duration of >72 hours corresponding to the subacute to chronic state were selected, in order to minimize potential differences between “early” versus “established” lesions. Future study that can consider the dynamics and fluctuations of the AD lesion through longitudinally assessments can have potential to provide a more thorough understanding of the disease trajectory as well as its heterogeneous nature.
In summary, this study provides detailed view of the mechanisms operating in psoriasis and AD and suggests that AD is primarily an IL-13 dominant disease. Our data demonstrates a shared “core transcriptome” shared between AD and psoriasis primarily characterized by enriched Th1/IFN responses. However, therapeutics targeting of those shared processes have been largely disappointing in AD. Given the opposing polarization signal in AD (towards IL-13 responses) and psoriasis (towards IL-17 responses), our data are consistent with the notion that these diseases represent overlapping, yet distinct diseases, and do not fit the view that these diseases exist on an extended spectrum.
IV. Material and Methods
Sample preparation
Informed written consent was obtained from human subjects under a protocol approved by the local ethics board at the University Hospital Schleswig-Holstein, Campus Kiel, Germany (reference: A100/12). AD or psoriasis was diagnosed on the basis of a skin examination by experienced dermatologists according to standard criteria (for AD, the American Academy of Dermatology Consensus Criteria were used). 5mm skin punch biopsies from the extremities (under local anesthesia) were obtained. Total RNA was isolated from PAXgene® fixed tissue samples using the AllPrep DNA/RNA Mini Kit following the manufacturers specifications. Preceding RNA isolation all samples were disrupted using innuSPEED Lysis Tubes W (1,4–1,6 mm steel beads & 3,5 mm ceramic beads) in a SpeedMill Plus (3×1min intervals) together with 600μl of RLT-Plus-Buffer (Qiagen) including ß-Mercaptoethanol and additionally homogenized with QIAshredder spin-columns. Only samples with a concentration of >50ng/μl, an OD260/280 ≥1.8 and a RNA integrity number (RIN) >7 were included in subsequent library preparation and sequencing. RNA samples were prepared for sequencing using the Illumina Truseq® Stranded total RNA Protocol in combination with the RiboZero rRNA removal Kit and sequenced on the HiSeq2500 in pools of 10 samples with 2×125bp.
RNA-seq data analysis
Illumina standard primers were trimmed, and the quality of the data was assessed using FastQC (vs 0.11.3) (Andrews, 2010). Paired reads were mapped to the human reference genome (b37) using STAR (Dobin et al., 2013), only uniquely mapped read pairs were retained. Number of reads for each gene was counted using HTSeq (Anders et al., 2015), only genes with on average ≥1 read/sample were used in our analysis. TMM was used to normalize the RNA-seq data (Robinson and Oshlack, 2010), and we applied voom transformation to model the mean-variance relationship of the expression data (Law et al., 2014). We conducted differential expression analysis between different conditions using empirical Bayes linear model as implemented in the limma package (Ritchie et al., 2015). We identified cell-type specificity using H3K27ac peak signals (Farh et al., 2015) and cytokine signatures using different cytokine stimulated keratinocytes transcriptome profiles. The details of the data and approaches are available in the supplementary documents.
Supplementary Material
Acknowledgments
Funding support
This work was supported by an award from the Else Kröner-Fresenius-Stiftung (2014_A270)(SW, ER), by the Deutsche Forschungsgemeinschaft (DFG, German Research Foundation) under Germany’s excellence Strategy - EXC 22167-390884018, by grants from the German Federal Ministry of Education and Research (BMBF) within the framework of the e:Med research and funding concept (sysINFLAME, grant 01ZX1306A) and the ComorbSysMed, grant 01ZX1510 (SS), and by the Babcock Endowment Fund (LCT, MKS, JT, JEG), by the National Institute of Arthritis and Musculoskeletal and Skin Diseases (NIAMS): AR060802 (JEG), AR054966 (JTE), and AR072129 (LCT), and National Institute of Allergy and Infectious Diseases (NIAID) under Award Number R01-AR06 (JEG), and the A. Alfred Taubman Medical Research Institute Kenneth and Frances Eisenberg Emerging Scholar Award (JEG). LCT is supported by the Dermatology Foundation, Arthritis National Research Foundation, and National Psoriasis Foundation.
Abbreviations
- AD
atopic dermatitis
- AUROC
area under the receiver operating curve
- DE
Differential expression
- DEGs
differential expressed genes
- FDR
False discovery rate
- FC
Fold Change
- lncRNAs
long non-coding RNAs
- PASI
psoriasis area severity index
- PC
Principal component
- SCORAD
SCORing AD, severity index for AD
Footnotes
Data accession: NCBI GEO accession: GSE121212
Disclosures
J.E.G. serves as Advisory Board for Novartis and MiRagen, and has received research support from AbbVie, SunPharma, and Genentech. S.G. is an employee and stakeholder of GlaxoSmithKline, and this study is in no way influenced by the work at GSK.
References
- Anders S, Pyl PT, Huber W. HTSeq--a Python framework to work with high-throughput sequencing data. Bioinformatics 2015;31(2):166–9. [DOI] [PMC free article] [PubMed] [Google Scholar]
- Andrews S FastQC: a quality control tool for high throughput sequence data., http://www.bioinformatics.babraham.ac.uk/projects/fastqc; 2010. [accessed.
- Baurecht H, Hotze M, Brand S, Buning C, Cormican P, Corvin A, et al. Genome-wide comparative analysis of atopic dermatitis and psoriasis gives insight into opposing genetic mechanisms. American journal of human genetics 2015;96(1):104–20. [DOI] [PMC free article] [PubMed] [Google Scholar]
- Bissonnette R, Papp KA, Poulin Y, Gooderham M, Raman M, Mallbris L, et al. Topical to facitinib for atopic dermatitis: a phase IIa randomized trial. Br J Dermatol 2016;175(5):902–11. [DOI] [PubMed] [Google Scholar]
- Blauvelt A, de Bruin-Weller M, Gooderham M, Cather JC, Weisman J, Pariser D, et al. Long-term management of moderate-to-severe atopic dermatitis with dupilumab and concomitant topical corticosteroids (LIBERTY AD CHRONOS): a 1-year, randomised, double-blinded, placebocontrolled, phase 3 trial. Lancet 2017;389(10086):2287–303. [DOI] [PubMed] [Google Scholar]
- Boehncke WH, Schon MP. Psoriasis. Lancet 2015;386(9997):983–94. [DOI] [PubMed] [Google Scholar]
- Choy DF, Hsu DK, Seshasayee D, Fung MA, Modrusan Z, Martin F, et al. Comparative transcriptomic analyses of atopic dermatitis and psoriasis reveal shared neutrophilic inflammation. J Allergy Clin Immunol 2012;130(6):1335–43 e5. [DOI] [PMC free article] [PubMed] [Google Scholar]
- Cole C, Kroboth K, Schurch NJ, Sandilands A, Sherstnev A, O’Regan GM, et al. Filaggrin-stratified transcriptomic analysis of pediatric skin identifies mechanistic pathways in patients with atopic dermatitis. J Allergy Clin Immunol 2014;134(1):82–91. [DOI] [PMC free article] [PubMed] [Google Scholar]
- DaVeiga SP. Epidemiology of atopic dermatitis: a review. Allergy Asthma Proc 2012;33(3):227–34. [DOI] [PubMed] [Google Scholar]
- Dobin A, Davis CA, Schlesinger F, Drenkow J, Zaleski C, Jha S, et al. STAR: ultrafast universal RNA-seq aligner. Bioinformatics 2013;29(1): 15–21. [DOI] [PMC free article] [PubMed] [Google Scholar]
- Eyerich S, Onken AT, Weidinger S, Franke A, Nasorri F, Pennino D, et al. Mutual antagonism of T cells causing psoriasis and atopic eczema. The New England journal of medicine 2011;365(3):231–8. [DOI] [PubMed] [Google Scholar]
- Farh KK, Marson A, Zhu J, Kleinewietfeld M, Housley WJ, Beik S, et al. Genetic and epigenetic fine mapping of causal autoimmune disease variants. Nature 2015;518(7539):337–43. [DOI] [PMC free article] [PubMed] [Google Scholar]
- Garzorz-Stark N, Krause L, Lauffer F, Atenhan A, Thomas J, Stark SP, et al. A novel molecular disease classifier for psoriasis and eczema. Exp Dermatol 2016;25(10):767–74. [DOI] [PubMed] [Google Scholar]
- Gittler JK, Shemer A, Suarez-Farinas M, Fuentes-Duculan J, Gulewicz KJ, Wang CQ, et al. Progressive activation of T(H)2/T(H)22 cytokines and selective epidermal proteins characterizes acute and chronic atopic dermatitis. J Allergy Clin Immunol 2012; 130(6): 1344–54. [DOI] [PMC free article] [PubMed] [Google Scholar]
- Greb JE, Goldminz AM, Elder JT, Lebwohl MG, Gladman DD, Wu JJ, et al. Psoriasis. Nat Rev Dis Primers 2016;2:16082. [DOI] [PubMed] [Google Scholar]
- Gudjonsson JE, Ding J, Johnston A, Tejasvi T, Guzman AM, Nair RP, et al. Assessment of the psoriatic transcriptome in a large sample: additional regulated genes and comparisons with in vitro models. J Invest Dermatol 2010;130(7):1829–40. [DOI] [PMC free article] [PubMed] [Google Scholar]
- Guttman-Yassky E, Krueger JG. Atopic dermatitis and psoriasis: two different immune diseases or one spectrum? Curr Opin Immunol 2017;48:68–73. [DOI] [PubMed] [Google Scholar]
- Guttman-Yassky E, Krueger JG, Lebwohl MG. Systemic immune mechanisms in atopic dermatitis and psoriasis with implications for treatment. Exp Dermatol 2017. [DOI] [PubMed] [Google Scholar]
- Guttman-Yassky E, Nograles KE, Krueger JG. Contrasting pathogenesis of atopic dermatitis and psoriasis--part I: clinical and pathologic concepts. J Allergy Clin Immunol 2011; 127(5): 1110–8. [DOI] [PubMed] [Google Scholar]
- Guttman-Yassky E, Suarez-Farinas M, Chiricozzi A, Nograles KE, Shemer A, Fuentes-Duculan J, et al. Broad defects in epidermal cornification in atopic dermatitis identified through genomic analysis. J Allergy Clin Immunol 2009;124(6):1235–44 e58. [DOI] [PubMed] [Google Scholar]
- Hijnen D, Knol EF, Gent YY, Giovannone B, Beijn SJ, Kupper TS, et al. CD8(+) T cells in the lesional skin of atopic dermatitis and psoriasis patients are an important source of IFN-gamma, IL-13, IL-17, and IL-22. J Invest Dermatol 2013;133(4):973–9. [DOI] [PMC free article] [PubMed] [Google Scholar]
- Kamleh MA, Snowden SG, Grapov D, Blackburn GJ, Watson DG, Xu N, et al. LC-MS metabolomics of psoriasis patients reveals disease severity-dependent increases in circulating amino acids that are ameliorated by anti-TNFalpha treatment. J Proteome Res 2015;14(1):557–66. [DOI] [PMC free article] [PubMed] [Google Scholar]
- Law CW, Chen Y, Shi W, Smyth GK. voom: Precision weights unlock linear model analysis tools for RNA-seq read counts. Genome Biol 2014;15(2):R29. [DOI] [PMC free article] [PubMed] [Google Scholar]
- Leung DY, Bieber T. Atopic dermatitis. Lancet 2003;361(9352):151–60. [DOI] [PubMed] [Google Scholar]
- Li B, Tsoi LC, Swindell WR, Gudjonsson JE, Tejasvi T, Johnston A, et al. Transcriptome analysis of psoriasis in a large case-control sample: RNA-seq provides insights into disease mechanisms. J Invest Dermatol 2014;134(7):1828–38. [DOI] [PMC free article] [PubMed] [Google Scholar]
- Mahil SK, Catapano M, Di Meglio P, Dand N, Ahlfors H, Carr IM, et al. An analysis of IL-36 signature genes and individuals with IL1RL2 knockout mutations validates IL-36 as a psoriasis therapeutic target. Sci Transl Med 2017;9(411). [DOI] [PubMed] [Google Scholar]
- Mueller TD, Zhang JL, Sebald W, Duschl A. Structure, binding, and antagonists in the IL-4/IL-13 receptor system. Biochim Biophys Acta 2002;1592(3):237–50. [DOI] [PubMed] [Google Scholar]
- Nomura I, Gao B, Boguniewicz M, Darst MA, Travers JB, Leung DY. Distinct patterns of gene expression in the skin lesions of atopic dermatitis and psoriasis: a gene microarray analysis. J Allergy Clin Immunol 2003;112(6):1195–202. [DOI] [PubMed] [Google Scholar]
- O’Regan GM, Sandilands A, McLean WH, Irvine AD. Filaggrin in atopic dermatitis. J Allergy Clin Immunol 2008;122(4):689–93. [DOI] [PubMed] [Google Scholar]
- Oranje AP. Practical issues on interpretation of scoring atopic dermatitis: SCORAD Index, objective SCORAD, patient-oriented SCORAD and Three-Item Severity score. Curr Probl Dermatol 2011;41:149–55. [DOI] [PubMed] [Google Scholar]
- Paternoster L, Standl M, Waage J, Baurecht H, Hotze M, Strachan DP, et al. Multi-ancestry genome-wide association study of 21,000 cases and 95,000 controls identifies new risk loci for atopic dermatitis. Nature genetics 2015;47(12):1449–56. [DOI] [PMC free article] [PubMed] [Google Scholar]
- Quaranta M, Knapp B, Garzorz N, Mattii M, Pullabhatla V, Pennino D, et al. Intraindividual genome expression analysis reveals a specific molecular signature of psoriasis and eczema. Sci Transl Med 2014;6(244):244ra90. [DOI] [PubMed] [Google Scholar]
- Ritchie ME, Phipson B, Wu D, Hu Y, Law CW, Shi W, et al. limma powers differential expression analyses for RNA-sequencing and microarray studies. Nucleic Acids Res 2015;43(7):e47. [DOI] [PMC free article] [PubMed] [Google Scholar]
- Roadmap Epigenomics C, Kundaje A, Meuleman W, Ernst J, Bilenky M, Yen A, et al. Integrative analysis of 111 reference human epigenomes. Nature 2015;518(7539):317–30. [DOI] [PMC free article] [PubMed] [Google Scholar]
- Robinson MD, Oshlack A. A scaling normalization method for differential expression analysis of RNA-seq data. Genome Biol 2010;11(3):R25. [DOI] [PMC free article] [PubMed] [Google Scholar]
- Rodriguez E, Baurecht H, Wahn AF, Kretschmer A, Hotze M, Zeilinger S, et al. An integrated epigenetic and transcriptomic analysis reveals distinct tissue-specific patterns of DNA methylation associated with atopic dermatitis. J Invest Dermatol 2014;134(7):1873–83. [DOI] [PubMed] [Google Scholar]
- Seltmann K, Meyer M, Sulcova J, Kockmann T, Wehkamp U, Weidinger S, et al. Humidity-regulated CLCA2 protects the epidermis from hyperosmotic stress. Sci Transl Med 2018;10(440). [DOI] [PubMed] [Google Scholar]
- Simpson EL, Bieber T, Guttman-Yassky E, Beck LA, Blauvelt A, Cork MJ, et al. Two Phase 3 Trials of Dupilumab versus Placebo in Atopic Dermatitis. N Engl J Med 2016;375(24):2335–48. [DOI] [PubMed] [Google Scholar]
- Suarez-Farinas M, Tintle SJ, Shemer A, Chiricozzi A, Nograles K, Cardinale I, et al. Nonlesional atopic dermatitis skin is characterized by broad terminal differentiation defects and variable immune abnormalities. J Allergy Clin Immunol 2011;127(4):954–64 e1–4. [DOI] [PMC free article] [PubMed] [Google Scholar]
- Suarez-Farinas M, Ungar B, Correa da Rosa J, Ewald DA, Rozenblit M, Gonzalez J, et al. RNA sequencing atopic dermatitis transcriptome profiling provides insights into novel disease mechanisms with potential therapeutic implications. J Allergy Clin Immunol 2015;135(5):1218–27. [DOI] [PubMed] [Google Scholar]
- Sulcova J, Meyer M, Guiducci E, Feyerabend TB, Rodewald HR, Werner S. Mast cells are dispensable in a genetic mouse model of chronic dermatitis. Am J Pathol 2015;185(6): 1575–87. [DOI] [PubMed] [Google Scholar]
- Swindell WR, Johnston A, Voorhees JJ, Elder JT, Gudjonsson JE. Dissecting the psoriasis transcriptome: inflammatory- and cytokine-driven gene expression in lesions from 163 patients. BMC Genomics 2013;14:527. [DOI] [PMC free article] [PubMed] [Google Scholar]
- Tan Q, Yang H, Liu E, Wang H. P38/ERK MAPK signaling pathways are involved in the regulation of filaggrin and involucrin by IL17. Mol Med Rep 2017;16(6):8863–7. [DOI] [PMC free article] [PubMed] [Google Scholar]
- Tazawa T, Sugiura H, Sugiura Y, Uehara M. Relative importance of IL-4 and IL-13 in lesional skin of atopic dermatitis. Arch Dermatol Res 2004;295(11):459–64. [DOI] [PubMed] [Google Scholar]
- Tejasvi T, Tsoi LC, Stuart PE, Nair RP, Voorhees JJ, Abecasis GR, et al. Transcriptome analysis reveals that severity of psoriasis is correlated with expression of genes involved in epidermal differentiation and proliferation. Society of Investigateive Dermatology annual meeting 2013. [Google Scholar]
- Thijs JL, Strickland I, Bruijnzeel-Koomen C, Nierkens S, Giovannone B, Csomor E, et al. Moving toward endotypes in atopic dermatitis: Identification of patient clusters based on serum biomarker analysis. J Allergy Clin Immunol 2017;140(3):730–7. [DOI] [PubMed] [Google Scholar]
- Tsoi LC, Iyer MK, Stuart PE, Swindell WR, Gudjonsson JE, Tejasvi T, et al. Analysis of long non-coding RNAs highlights tissue-specific expression patterns and epigenetic profiles in normal and psoriatic skin. Genome Biol 2015;16:24. [DOI] [PMC free article] [PubMed] [Google Scholar]
- Varshney P, Narasimhan A, Mittal S, Malik G, Sardana K, Saini N. Transcriptome profiling unveils the role of cholesterol in IL-17A signaling in psoriasis. Sci Rep 2016;6:19295. [DOI] [PMC free article] [PubMed] [Google Scholar]
- Weidinger S, Beck LA, Bieber T, Kabashima K, Irvine AD. Atopic dermatitis. Nat Rev Dis Primers 2018;4(1):1. [DOI] [PubMed] [Google Scholar]
- Weidinger S, Novak N. Atopic dermatitis. Lancet 2016;387(10023):1109–22. [DOI] [PubMed] [Google Scholar]
- Wollenberg A, Howell MD, Guttman-Yassky E, Silverberg JI, Kell C, Ranade K, et al. Treatment of atopic dermatitis with tralokinumab, an anti-IL-13 mAb. J Allergy Clin Immunol 2018. [DOI] [PubMed] [Google Scholar]
- Wollenberg A, Wetzel S, Burgdorf WH, Haas J. Viral infections in atopic dermatitis: pathogenic aspects and clinical management. J Allergy Clin Immunol 2003;112(4):667–74. [DOI] [PubMed] [Google Scholar]
- Yamaguchi J, Aihara M, Kobayashi Y, Kambara T, Ikezawa Z. Quantitative analysis of nerve growth factor (NGF) in the atopic dermatitis and psoriasis horny layer and effect of treatment on NGF in atopic dermatitis. J Dermatol Sci 2009;53(1):48–54. [DOI] [PubMed] [Google Scholar]
Associated Data
This section collects any data citations, data availability statements, or supplementary materials included in this article.