Abstract
Metformin may reduce the progression of head and neck squamous cell carcinoma (HNSCC), however, whether metformin acts by altering the host metabolism or targets cancer initiating cells remains poorly understood. This gap in knowledge has prevented the stratification of patient populations that are most likely to benefit from metformin treatment. Here, we explored whether metformin acts directly on HNSCC cells to inhibit aberrant cell growth. To investigate the tumor cell autonomous effects of metformin, we engineered representative HPV- and HPV+ HNSCC cells harboring typical genetic alternations to express the yeast mitochondrial NADH dehydrogenase (NDI1) protein, which is insensitive to metformin. NDI1 expression rescued the inhibitory effects of metformin on mitochondrial complex I, abolished the ability of metformin to activate AMPK and inhibit mTOR signaling both in vitro and in vivo, and was sufficient to render metformin ineffective to prevent HNSCC tumor growth. This experimental system provided an opportunity to identify metformin-regulated transcriptional programs linked to cancer cell growth inhibition in the tumor microenvironment. Remarkably, computational analysis of the metformin-induced transcriptome revealed that metformin downregulated gene expression signatures associated with cancer stemness and epithelial mesenchymal transition, concomitant with increased expression of squamous differentiation genes. These findings support that metformin may act directly on cancer initiating cells to prevent their progression to HNSCC, which may inform the selection of patients at risk of developing HNSCC in future early-stage clinical trials.
Keywords: Cancer initiating cell, Mitochondrial Complex I, Cancer prevention/treatment, mTOR, HNSCC
Introduction
Approximately 51,540 new cases of squamous cell carcinoma of the head and neck (HNSCC) are estimated to occur in 2018 in the United States alone, resulting in 10,030 deaths (1). The main risk factors include tobacco and alcohol, and human papillomavirus (HPV+) infection (2). The 5-year survival rate of HNSCC patients has not significantly improved for decades and remains at about 63%, mainly because of the delayed disease detection and intervention, and the dearth of therapeutic options in advanced HNSCC cases once tumors have metastasized (1). New chemopreventive agents for early-stage intervention are key to improve the prognosis of HNSCC patients. In this regard, recent large retrospective analysis and extensive laboratory findings indicate that metformin, the most widely used oral anti-hyperglycemic agent, may have preventive effects in HNSCC (3–7). Furthermore, encouraging results have been recently obtained in a Phase II trial exploring the chemopreventive activity of metformin in patients with oral premalignant lesions (8). Therefore, repurposing metformin may hold promise for early-stage intervention to halt HNSCC development.
Indeed, there is a growing enthusiasm for clinical trials using metformin for cancer prevention and treatment. However, the underlying mechanisms by which metformin acts remain poorly understood. In this regard, the well known insulin-sensitizing and anti-hyperglycemic effects of metformin may lower cancer risk due to its indirect effect on cancer cell metabolism by decreasing circulating insulin at the organismal level (9). While this mechanism can account for the protective effects of metformin in diabetic patients, metformin also displays anti-tumor effects in preclinical models in which animals are not obese or insulin-resistant (3,4). Furthermore, metformin showed efficacy in non-diabetic patients when administered after surgical resection in a phase 3 clinical trial exploring colon cancer prevention (10). Therefore, the direct effects of metformin on cancer cells should be also considered. The still poorly understood mechanisms of metformin anti-cancer action may prevent the stratification of the patient populations that are most likely to benefit from metformin treatment, and as such, this gap in knowledge may prevent achieving the full therapeutic potential of metformin in the cancer prevention setting.
Materials and Methods
Cell lines
HNSCC cell lines CAL27, CAL33, and UMSCC47 were obtained from the NIDCR Oral and Pharyngeal Cancer Branch cell collection and have been described previously (3), and were grown in Dulbecco’s modified Eagle’s medium (DMEM) supplemented with 10% fetal bovine serum (FBS), 100 units/ml penicillin, and 100 μg/ml streptomycin (Sigma Aldrich) at 37°C in humidified air with 5% CO2. All cell lines identity authentication was conducted by multiplex STR profiling (Genetica DNA Laboratories, Inc. Burlington, NC). Mycoplasma were not detected by conducting Mycoplasma Detection Kit-QuickTest from Biomake (Houston, TX, USA). Cells were routinely grown to 70–80% confluence before the indicated experiments. For in vitro treatment with metformin, the cells were cultured in DMEM with physiologically relevant glucose levels (5 mM) and without pyruvate. Cryogenic preserved cell vials were thawed from frozen stocks that were validated within six months before freezing.
Vector construction and Lentiviral infection
The sequence of S. cerevisiae NDI1 was amplified from Yeast cDNA, epitope tagged and subcloned into pLenti-CMV-Puro-DEST using the Gateway system. Please, see detailed information in the Supplementary Material and Methods, including methods used for viral production and cell infection and selection.
Immunoblot analysis
Immunodetection was carried out as described before (3). The antibodies were from Cell Signaling Technology against S6, phospho-S6 (Ser240/244), total AMPK, phospho-AMPKα (Thr172), total AKT, phospho-AKT(Ser473), and GAPDH, the latter as a loading control. Flag-NDI1 was detected using a primary antibody from Sigma (F31665). Secondary horseradish peroxidase-linked goat anti-rabbit and anti-mouse IgG antibodies were obtained from Southern Biotech. Please, see detailed information in the Supplementary Material and Methods.
Cell Viability, Colony formation, and Sphere formation assay
Cell Viability assay: Cells grown in 96 well plates were treated with metformin for 72 hours. Cell viability was determined by AlamarBlue. Colony formation assay: Cells were seeded in 6-well plates and treated with metformin or control media. Colonies were fixed with 1% formaldehyde and stained with crystal violet solution. Colony number and average area were analyzed using ImageJ. For sphere formation assay, cells were seeded in 96-well ultra-low attachment culture dishes with metformin treatment or control medium. Ten days after seeding, the numbers of sphere colonies on each well were counted using a microscope. Please, see detailed information in the Supplementary Material and Methods.
Xenograft tumor models
All animal studies were approved by the Institutional Animal Care and Use Committee (IACUC) of University of California, San Diego with protocol ASP # S15195. Female 4- to 6-week-old nude mice were purchased from Charles River Laboratories. (Worcester, MA, USA) Mice were injected subdermally in flanks with 1 million of CAL33 cells. The day of injection they were given either water (control) or metformin in the drinking water at 2.5 mg/ml. All animals underwent weekly or more frequent examination for tumor growth in flanks. The mice were euthanized at the indicated time points (or when control-treated mice succumbed to disease, as determined by the ASP guidelines) and tumors were isolated for histologic and immunohistochemical evaluation.
RNA isolation, qPCR analysis, gene expression profiling, and GSEA analysis
RNA was extracted using the Qiagen RNeasy plus kit. Reverse transcribed to cDNA using the high-capacity reverse transcription kit (Thermofisher). qPCR was performed using the SYBR green assay (Life Technologies). qPCR data for mRNAs were normalized to GAPDH. Sequenced reads were mapped to the reference transcript sequences to compute the transcript abundance, using ‘Kallisto’ (see Supplementary Methods). The expression value for a gene set from the Molecular Signatures Database (MSigDB) was computed using single-sample Gene Set Enrichment Analysis. Differential gene and gene set expression analyses was obtained using Information Coefficient (IC) scores (see Supplementary Methods).
Seahorse assay
Oxygen consumption rates were measured using a Seahorse XF96 analyzer. (see Supplementary Methods).
Immunofluorescence and immunohistochemistry (IHC)
MitoTracker Red CMXRos(Thermofisher) add to cell culture plate to stain mitochondria in live cells followed with the manufacturer protocol.
For IHC, all tissue samples were processed and stained as previously described (3). The following antibodies were used: pS6, pACC from Cell Signaling Technology (Danvers, MA, USA); Ki67 was from DAKO (Carpinteria, CA, USA). For the analysis of CK10 positive areas, three representative areas were chosen at high magnification (X400), then the areas were calculated using Image J software. The anti-CK10 polyclonal antibody was purchased from BioLegend (CA, USA).
Statistical Analysis
Data analyses, variation estimation and validation of test assumptions were performed with GraphPad Prism version 7 for Windows (GraphPad Software, San Diego, CA). The differences between experimental groups were analyzed using ANOVA, independent t-tests, or longitudinal data analysis method. The asterisks of figures denote statistical significance (non-significant or ns, P>0.05; *P<0.05; **, P<0.01; ***, P<0.001).
Results
Metformin inhibits mitochondrial complex I activity in HNSCC cells
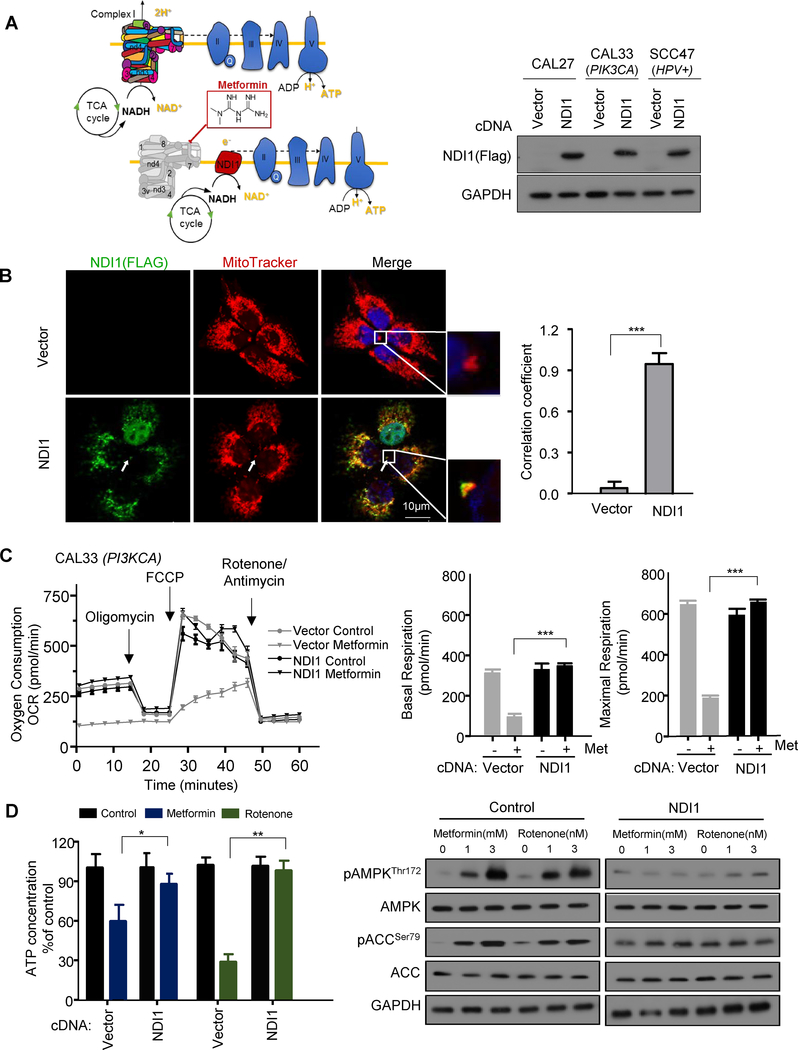
In previous studies, we have shown that metformin represents an attractive drug candidate to prevent the development of HNSCC cancer lesions (3,4). However, which of the numerous mechanisms of metformin responsible for this desirable preventive activity is currently unknown. To investigate whether mitochondrial complex I (complex I) is a required target of metformin in HNSCC cells, we stably expressed the Saccharomyces cerevisiae protein NDI1 in representative cell lines that carry typical HNSCC-associated genetic alterations, including CAL33 (PIK3CA+, HPV-), CAL27 (HPV- and no driver mutation), and UMSCC47 (HPV+) (11). When expressed in mammalian cells, yeast NDI1 can continue to function as an NADH dehydrogenase in the presence of metformin, as the yeast single subunit enzyme is insensitive to this inhibitor, unlike the multi-subunit complex in mammalian cells (Fig.1A), as previously described in colon cancer cells (12). We first examined the effect of metformin on cellular oxygen consumption rate (OCR), a key indicator of mitochondrial function. The stably expressed NDI1 (Fig. 1A) was clearly co-localized with MitoTracker in HNSCC cells (Fig. 1B). Both control cells and NDI1-expressing cells had similar basal OCR and response to typical respiratory chain inhibitors: oligomycin, rotenone, and antimycin (Fig. 1C). After metformin treatment, however, the basal OCR decreased in control cells but not in NDI1-expressing cells. Thus, NDI1-expressing cells are resistant to the effects of metformin on cellular oxygen consumption, supporting that metformin targets complex I in HNSCC cells.
Figure 1.
Metformin activates AMPK signaling in HNSCC cells by inhibiting mitochondrial complex I. A, Schematic representation of yeast NDI1, which when expressed in HNSCC cells rescues the inhibitory effect of metformin on mitochondrial complex I in the respiratory chain. Western blot analysis of expressed NDI1 levels in HNSCC cell lines CAL27, CAL33, and UMSCC47. B, NDI1 (green) was colocalized with mitochondrial membrane marker MitoTracker (red). White arrow depicts examples of areas of colocalization, scale bar 10uM; Pearson’s correlation coefficient was 0.92. The coefficient was generated using Image J software. C, Representative measurement of OCR in control (CAL33; PIK3CA) and NDI1 expressing HNSCC cells after overnight metformin (3 mM) treatment. Basal and maximal FCCP-stimulated respiratory rates are plotted, and represent three technical replicates. D, Celluar ATP level was determined after overnight metformin (3 mM) treatment. Rotenone (3 nM) was used as a positive control. Western blotting for expression of pAMPK/AMPK, pACC/ACC, and GAPDH as a loading control. (*, P<0.05; **, P<0.01; ***, P<0.001; mean ± SD).
Metformin activates AMPK and inhibits mTOR by targeting complex I in HNSCC cells
As AMP-activated protein kinase (AMPK) is acutely activated by reductions in cellular ATP levels and the consequent increase in AMP, we next examined whether NDI1 could rescue the cellular ATP reduction and AMPK activation in response to metformin. First, we measured the intracellular ATP concentration of control and NDI1 cells after treated with metformin or rotenone, the latter a direct complex I inhibitor. A significant reduction in the concentration of intracellular ATP was observed in control cells, but only a slight decrease in NDI1 expressing
HNSCC cells (Fig. 1D). Different from the mammalian complex, rotenone does not inhibit the yeast enzyme (13). Accordingly, both AMPK and its downstream target, ACC, were phosphorylated after metformin or rotenone treatment in control cells but failed to promote AMPK pathway activation in NDI1 expressing cells (Fig.1D). This finding supports that metformin activates AMPK in HNSCC cells as a result of the reduction of ATP concentration caused by inhibition of complex I in the mitochondrial respiratory chain.
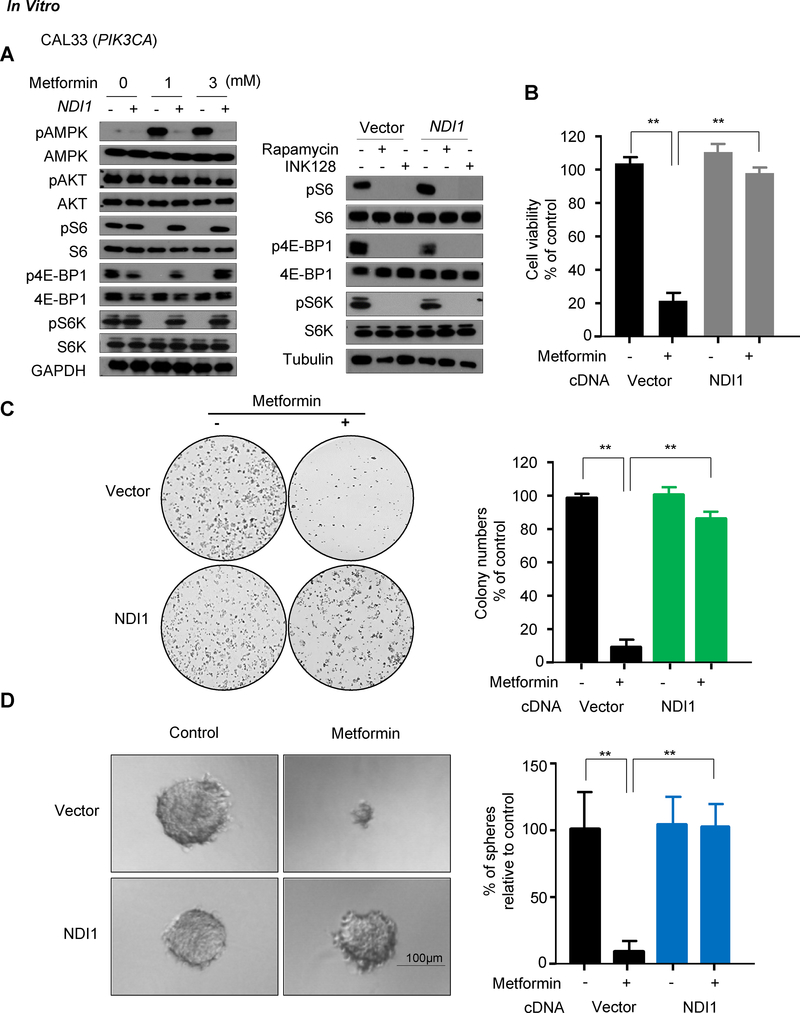
We next sought to address whether inhibition of the mTOR pathway required the activity of complex I. When treated with metformin, control CAL27, CAL33, and UMSCC47 cells exhibited a marked increase of pAMPK and a decrease in mTOR activity as judged by the reduction in pS6, p4EBP and p70S6K (pS6K) (14); however, metformin did not reduce mTOR activity in NDI1 expressing cells (Fig. 2A and Supplementary Fig. S1A). This indicates that the inhibition of complex I by metformin is responsible for the reduced activity of the mTOR pathway in HNSCC cells in vitro.
Figure 2.
The inhibitory effect of metformin on mTOR signaling and cell viability in vitro requires functional mitochondrial complex I. A, Cells were treated metformin for 24 hours at the indicated doses, and level of expression of pAMPK/AMPK, pS6/S6, pAKT/AKT, p4E-BP1/4E-BP1, pS6K/S6K was analyzed by Western blot. Rapamycin and INK128 were used as positive control of mTOR inhibition in cell lines. B, The relative viability of the cells was compared to controls after 72 hours of metformin treatment (3mM). C, Colony formation assay of the CAL33 cells treated with metformin (3 mM); D, Sphere formation assay of CAL33 cells treated with metformin (3 mM). (**, P<0.01; mean ± SD)
Metformin effects on cell proliferation in vitro and antitumor activity in vivo require a functional complex I
The reduction of the metformin’s effect on mTOR signaling in HNSCC cells prompted us to examine whether metformin can still affect cell proliferation of HNSCC cells in which mitochondrial function is rescued. NDI1-expressing cells were completely resistant to the metformin-induced growth inhibitory effects (Fig. 2B and Supplementary Fig.S1B). The growth suppressive activity of metformin was also analyzed by clonogenic and sphere formation assays, which reflect in vivo tumorigenicity better. Metformin treatment reduced the number of colonies in control HNSCC but not in NDI1-expressing cells (Fig. 2C and Supplementary Fig. S1C). Control cells treated with metformin formed significantly smaller and fewer spheres than NDI1-expressing cells (Fig. 2D and Supplementary Fig. S2).
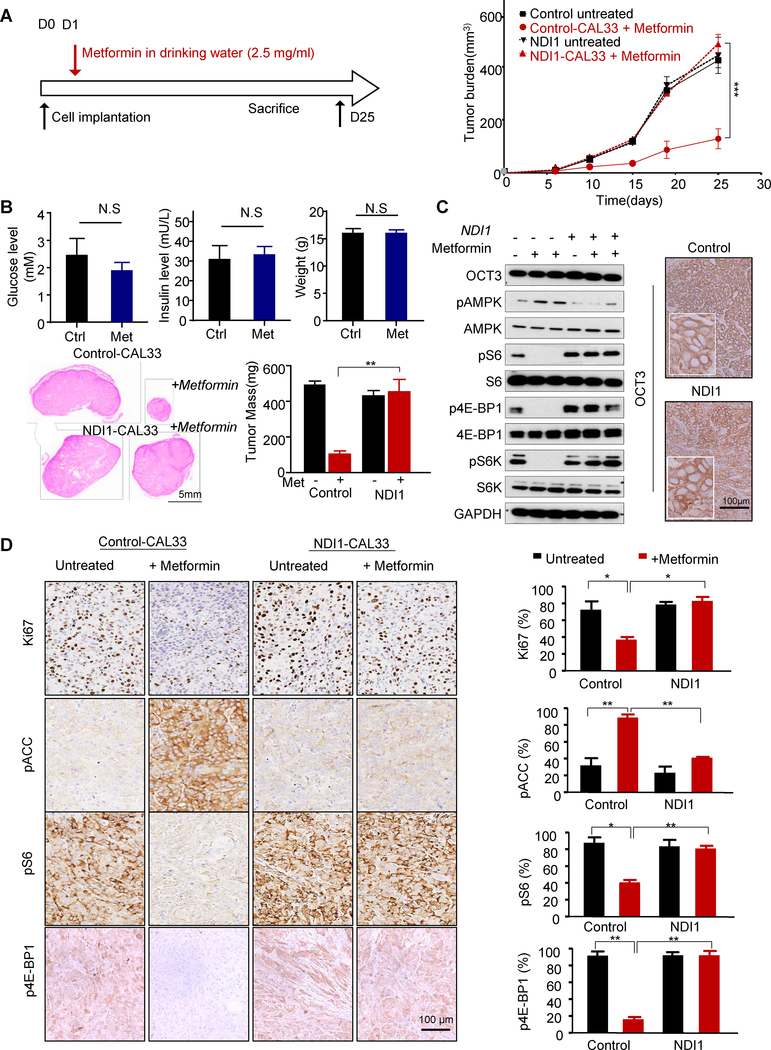
To directly examine whether the antitumor effect of metformin in vivo also requires complex I, we implanted control and NDI1-expressing HNSCC cells in nude mice, and delivered metformin in drinking water daily to achieve clinically relevant metformin plasma levels as we previously described (3) (Fig. 3A). NDI1-expressing cells failed to respond to metformin in vivo (Fig. 3A). Indeed, only the mice that were implanted with control cells and treated with metformin exhibited reduced tumor volume and weight with respect to control tumors, albeit in these non-obese mice metformin did not reduce glucose and insulin serum levels, and did not affect the body weight (Fig. 3B). Metformin caused reduced tumor cellular proliferation as indicated by Ki-67 IHC staining, and a significant decrease of pS6, pS6K, and p4E-BP1, and an increase of pAMPK and pACC in the control tumors (Fig. 3C and 3D). In contrast, we did not observe significant changes in pS6 and pACC levels in the metformin-treated NDI1-expressing tumors, indicating that these cells are resistant to metformin in vitro and in vivo. We have previously shown that metformin needs to accumulate in HNSCC cancer cells to be effective, and that this process strictly requires the expression of a metformin transporter, OCT3 (3). As such, we confirmed that NDI1 expression does not reduce the levels of OCT3 in HNSCC cells, both by Western blotting and IHC staining of tumor lesions (Fig. 3C). These data support the critical role of complex I function in response to metformin in tumor signaling and growth.
Figure 3.
Metformin antitumor effect in vivo requires functional complex I. A, Schematic representation of timescale for metformin treatment (in the drinking water, 2.5 mg/mL) in a mouse xenograft model, and in vivo growth curve of average tumor volume. Control mice received drinking water only while other groups received metformin (2.5 mg/mL) in drinking water for 3 days. B, Serum glucose and insulin levels and mice weight before and after metformin treatment are depicted. The average weight of tumors at the endpoint of the experiment; H&E staining of tumor sections with control CAL33 tumors are shown on top and the tumors from NDI1-CAL33 are shown at the bottom. C, The tumors were isolated and analyzed by western blot for OCT3, pS6/S6, pAMPK/AMPK, p4E-BP1/4E-BP1, pS6K/S6K and GAPDH expression. The cell surface OCT3 expression was also detect in the tissues by IHC staining. D, IHC staining of control and NDI1 expressing CAL33 tumor sections for Ki67, pS6, p4E-BP1 and pACC. Quantification from the stained sections are shown on the right. (*, P<0.05; **, P<0.01; ***, P<0.001; mean ± SD)
The effects on metformin on colony formation and AMPK and mTOR networks can be rescued by methyl-pyruvate
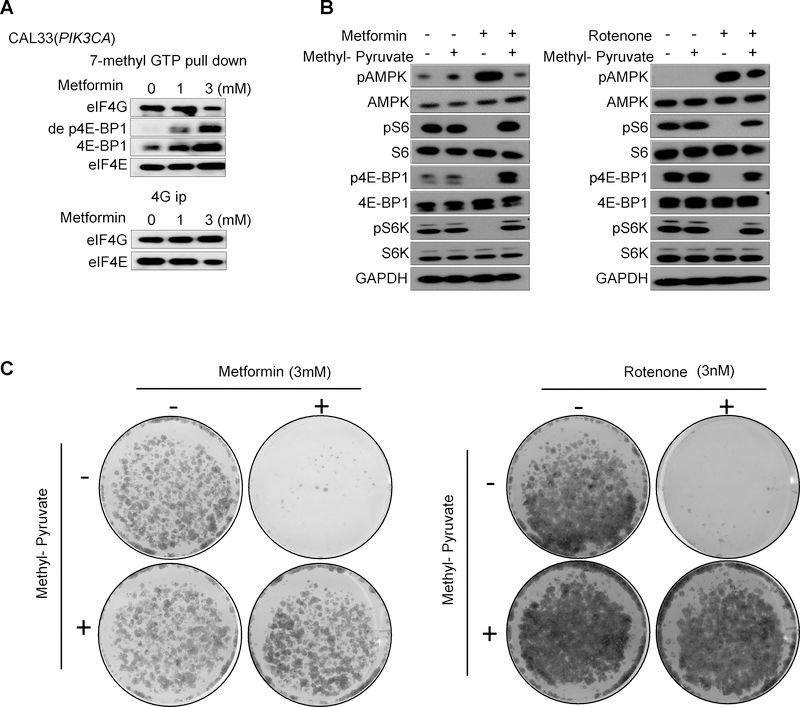
To begin gaining a mechanistic understanding of metformin actions in HNSCC cells, we first ask if mTOR inhibition and p4E-BP1 reduction results in the reactivation of 4E-BP1, based on our recent findings that 4E-BP1 may represent a candidate tumor suppressor protein in HNSCC, which is reactivated by mTOR blockade (15). Using 7mGTP pull down and eIF4G co-immunoprecipitation (co-IP) assays we confirmed that the effect of metformin on p4E-BP1 reduction resulted in the increased association of eIF4E with de-phosphorylated 4E-BP1 (de p4E-BP) and a concomitant decreased association of eIF4E with eIF4G (Fig. 4A). This suggests that metformin regulates the translation–initiation complex formation by mTOR inhibition.
Figure 4.
Regulation of translation–initiation complex by metformin, and rescue from metformin actions by Methyl-pyruvate. A, 7mGTP pull down and eIF4G co-IP (B) were performed to analyze the regulation of translation–initiation complex formation by mTOR inhibition treated by metformin with indicated doses for 24 hours. B, Methyl-pyruvate (3 mM) was added to the cell culture medium, and rescued the mTOR inhibition induced by metformin (3 mM) and rotenone (3 nM) (24 hour treatment). C, Methyl-pyruvate (3 mM) rescued from metformin- and rotenone-induced decrease in colony formation in the control CAL33 cells.
We also confirmed that a classical mitochondrial complex I inhibitor, rotenone, mimics the effects of metformin on AMPK activation, mTOR functional inactivation, and growth inhibition, the latter as judged by colony formation assays. In addition, recent studies revealed that mitochondria complex I inhibition reduces cell proliferation by inhibiting aspartate biosynthesis (16,17). Remarkably, aligned with this mechanism of action, culturing cells in the presence of methyl-pyruvate rescued HNSCC cells from the activation of AMPK, mTOR inhibition, and the growth suppressive activity of both metformin and rotenone (Fig. 4B and 4C).
Metformin downregulates cancer stemness signature associated genes
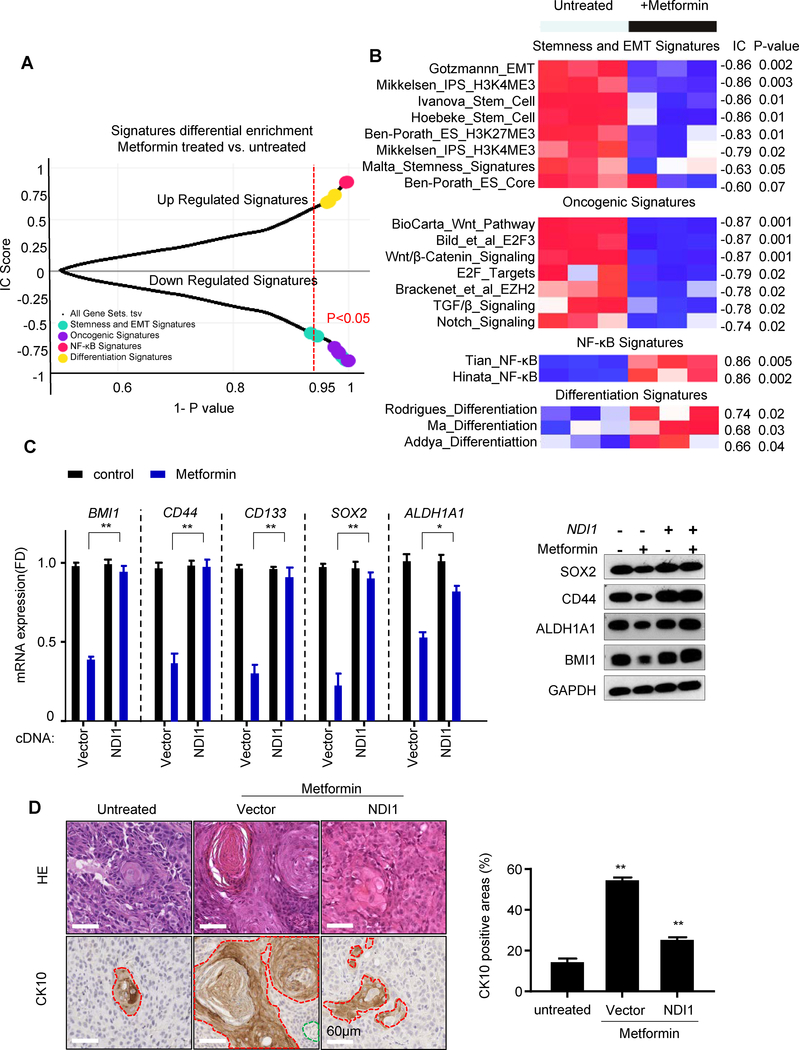
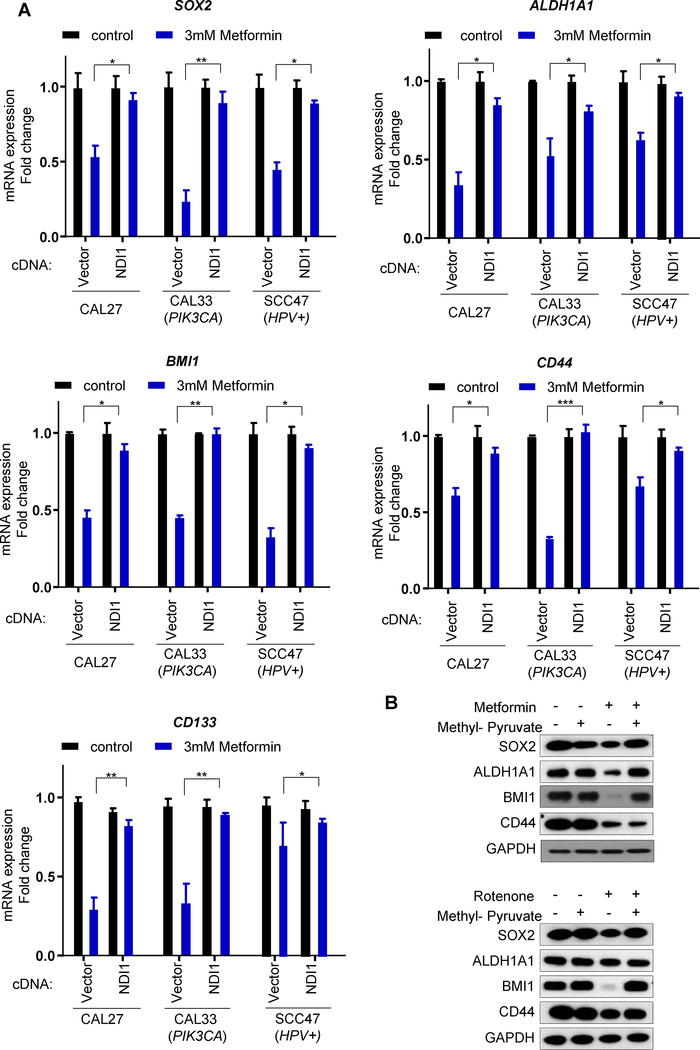
We next conducted RNAseq and a detailed single-sample Gene Set Enrichment Analysis (GSEA) using the Molecular Signatures Database (MSigDB) Hallmark gene set collection (18) as a first step to reveal biological processes that were differentially affected in metformin-treated tumors. Of interest, among the multiple changes, we observed that metformin reduced the expression of genes associated with cell cycle progression and MYC/E2F targets, some of which are associated with pluripotency in embryonic stem cells (ESCs) (Fig. 5A and Fig. 5B) (19). Notably, the analysis also demonstrated significant repression of genes associated with Wnt/β catenin, TGFβ, and Notch signaling pathway, all of which are often involved in the maintenance of the cancer stem cells self-renewal (20). Furthermore, taking advantage of a recently described gene sets associated with stemness in cancer and healthy cells (21), we found that stemness signature genes were clearly down-regulated in the metformin-treated group. Indeed, GSEA analysis revealed that metformin treated tumors had a highly significant reversal of gene expression signatures associated with stemness and oncogenic dedifferentiation (21) (Fig. 5A and Fig. 5B). GSEA also revealed that differentiation-associated and TNF/NFkB gene sets were differentially enriched in the metformin treatment group (Fig. 5A and 5B). The majority of these effects of metformin were reversed by the expression of NDI1 (Supp. Fig. S3). We chose representative genes (CD44, CD133, ALDH1A1, BMI1, and SOX2) that are part of the stemness signature in HNSCC (22) for validation of our RNAseq data by quantitative PCR, and at the protein level (Fig.5C). We also noticed that long-term treatment with metformin induced squamous differentiation, represented as keratinization and high positivity for CK10 (Fig. 5D), a squamous differentiation marker. In contrast, NDI1-expressing cells were protected from the metformin-induced expression of growth suppressive and pro-differentiation gene programs in all cells tested (Fig. 5 and Fig. 6A).
Figure 5.
Metformin induced cancer cell differentiation, NFkB activation, and downregulation of cancer stemness and oncogenic signatures. A, Plot of Information Coefficient (IC) scores vs. p-values of GSEA profiles of transcriptional signatures matched against the untreated vs. treated metformin phenotype (see Supplementary Methods). B, Heatmap showing the individual signatures GSEA profiles. The bar on top is the untreated vs. treated metformin phenotype, and the numbers on the right are the IC scores and p-values. C, The expression of stemness markers were validated in control and NDI1-expressing cells treated with or without metformin in vivo measured by qPCR. The corresponding protein expression was detected by Western blotting. D, CK10 positivity was analyzed by immunohistochemistry in tumors. Representative H&E staining and CK10 positive areas are shown. CK10 positive tumor cells are surrounded by the red line, connective tissue by the green line, and the rest represent CK10 negative tumor cells. Quantitative analysis of CK10 positive areas are shown in the right graph. (*, P<0.05; **, P<0.01; mean ± SD)
Figure 6.
Validation of the changes in expression of stemness genes caused by metformin in HNSCC cells. A. Validation of the stemness genes (SOX2/ALDH1A1/BMI1/CD44/CD133) expression in the indicated HNSCC cells treated with or without metformin in vitro, measured by qPCR. (*, P<0.05; **, P<0.01; ***, P<0.001; mean ± SD.) B. The cell lysates were used to evaluate the expression of the protein product of stemness genes in response to metformin and the impact of methyl-pyruvate treatment as in A.
Furthermore, methyl-pyruvate rescued from the reduced expression of stemness associated gene products caused by metformin and rotenone (Fig. 6B), supporting that they are primarily caused by mitochondria complex I inhibitions. Taken together, these results indicate that metformin reduces the expression of cancer stem cell programs and triggers cell differentiation, thus supporting that metformin may act directly on HNSCC cancer-initiating cells. Aligned with this possibility, metformin reduced the cell population expressing high levels of CD44/ALDH1, which are often used as cancer stem cell markers in HNSCC (23,24) (Supp. Fig. S4).
Discussion
A mechanistic framework for metformin action in HNSCC
The mechanisms by which metformin acts in HNSCC is just beginning to be elucidated. Metformin reduces circulating glucose level by decreasing gluconeogenesis, and the secretion of insulin, which is known to act as a growth factor that triggers more rapid cancer cell growth. Thus, it is widely believed that metformin could halt the growth of tumor cells that are insulin responsive by lowering insulin levels (25). This may represent one of the possible mechanisms for reducing cancer incidence in type 2 diabetics who exhibit high levels of blood glucose and circulating insulin. Indeed, metformin has shown preclinical anticancer activity in numerous animal models of obesity, but it has also displayed activity in non-obese cancer models and non-diabetic patients (reviewed in (25–29). Regarding the latter, the anticancer effects of metformin have been related to both direct and indirect (insulin-lowering) mechanisms of actions. In particular for oral cancer, the preclinical mouse models used in our previous study are neither obese nor insulin-resistant (3,4), and we now show that metformin does not reduce glucose and insulin levels. In addition, we have shown that normal and premalignant oral mucosa express high levels of the OCT3 metformin transporter both in human clinical samples and mouse tissues (3), and that OCT3 knockdown in HNSCC cells reduces the effect of metformin in vitro and in vivo (3). We now demonstrate that bypassing mitochondrial complex 1 inhibition is sufficient to render metformin ineffective to control tumor growth. Thus, although metformin’s systemic effects may contribute to its tumor preventive activity, our results favor the possibility that metformin acts preferentially on HNSCC cells directly.
Specifically, we now show that metformin activates AMPK and reduces the activity of mTOR in HNSCC cells downstream from complex I inhibition, thereby suppressing a central HNSCC oncogenic pathway by acting on the cancer cells. In turn, the precise molecular events inhibiting HNSCC growth are still not fully understood, albeit rescue experiments using methyl-pyruvate support the key role for aspartate biosynthesis inhibition in the anti-tumor activity of metformin downstream from complex I inhibition (16,17). In this case, inhibition of aspartate biosynthesis results in the loss of NAD+/NADH homeostasis, since complex I function is required for regenerating NAD+ that is essential for tumor growth in the tumor microenvironment (30). In addition, we also observed that in our cellular systems methyl-pyruvate prevents AMPK activation and mTOR inhibition by both metformin and rotenone. This suggests that methyl-pyruvate may also restore ATP production after complex I inhibition, for example by promoting glycolysis as previously proposed in other cellular systems (31). This, as well as the possibility that metformin acts by alternative direct (cell autonmous), actions, such as by controling mitochondrial glycerophospate dehydrogenase (32), warrants further investigation.
The remarkable reversion of metformin’s growth suppressive effects by solely rescuing complex I in HNSCC cells provided an opportunity to explore the mechanisms driving growth inhibition in vivo, focused on identifying transcriptome program changes associated with the therapeutic response to metformin. Remarkably, we found that metformin represses the expression of HNSCC stem cell programs, and causes the loss of expression of markers associated with cancer stem cells and promotes HNSCC terminal differentiation. These findings can be explained by our recent observations that 4E-BP1 can suppress the translation of stemness-related genes in HNSCC when reactivated upon mTOR inhibition (15). This is relevant considering that metformin caused the association of dephosphorylated 4E-BP1 with eIF4E, and disruption of the association between eIF4E and eIF4G. Furthermore, the transcriptional reduction of cancer stemness gene programs suggests that metformin may target cancer-initiating cells directly, therefore triggering cell differentiation and halting their progression to HNSCC.
Overall, these findings may have important clinical implications, as multiple clinical trials using metformin preferentially recruit patients that are obese or high BMI, based on the premise that metformin acts primarily by altering the host metabolism, including circulating insulin. Our study strongly supports that in addition to these systemic effects, metformin can directly target HNSCC tumors and their initiating cancer cells, a process that is required for its cancer preventive functions. Thus, our findings may help to expand the patient populations to non-obese and -diabetic patients harboring potential premalignant lesions, which may also benefit from metformin treatment. These results also suggest that the in depth analysis of genetic alterations affecting cancer cell autonomous responses to metformin will yield valuable information regarding patients that are most likely to benefit from metformin treatment in future precision prevention trials.
Supplementary Material
Significance.
Metformin’s ability to directly target HNSCC initiating cells instead of exerting cancer preventive activity based solely on its systemic effects may inform the selection of patients in future precision prevention trials.
Acknowledgments
This research was supported by the National Institute of Dental and Craniofacial Research grant (R01DE026644) and (R01DE026870) to XW, ZW, YG and JSG; the National Cancer Institute grants (R01CA121941) to PT and HY, (P30CA023100) to PT and SML, and (U01CA217885) to PT, HY and VHW; and by the National Natural Science Foundation of China (No.81520108009, 81621062) and 111 Project of MOE in China (B14038) to XZ and QC.
Footnotes
Conflicts of interest:
No potential conflicts of interest were disclosed.
References
- 1.Siegel Rebecca L, Miller Kimberly D, Jemal A. Cancer statistics, 2018. CA: A Cancer Journal for Clinicians 2018;68:7–30 [DOI] [PubMed] [Google Scholar]
- 2.Chaturvedi AK, Engels EA, Pfeiffer RM, Hernandez BY, Xiao W, Kim E, et al. Human papillomavirus and rising oropharyngeal cancer incidence in the United States. J Clin Oncol 2011;29:4294–301 [DOI] [PMC free article] [PubMed] [Google Scholar]
- 3.Madera D, Vitale-Cross L, Martin D, Schneider A, Molinolo AA, Gangane N, et al. Prevention of tumor growth driven by PIK3CA and HPV oncogenes by targeting mTOR signaling with metformin in oral squamous carcinomas expressing OCT3. Cancer Prev Res (Phila) 2015;8:197–207 [DOI] [PMC free article] [PubMed] [Google Scholar]
- 4.Vitale-Cross L, Molinolo AA, Martin D, Younis RH, Maruyama T, Patel V, et al. Metformin prevents the development of oral squamous cell carcinomas from carcinogen-induced premalignant lesions. Cancer Prev Res (Phila) 2012;5:562–73 [DOI] [PMC free article] [PubMed] [Google Scholar]
- 5.Evans JMM, Donnelly LA, Emslie-Smith AM, Alessi DR, Morris AD. Metformin and reduced risk of cancer in diabetic patients. BMJ 2005;330:1304–5 [DOI] [PMC free article] [PubMed] [Google Scholar]
- 6.Tseng C-H, Tseng C-H. Metformin may reduce oral cancer risk in patients with type 2 diabetes. Oncotarget 2015;7:2000–8 [DOI] [PMC free article] [PubMed] [Google Scholar]
- 7.Yen YC, Lin C, Lin SW, Lin YS, Weng SF. Effect of metformin on the incidence of head and neck cancer in diabetics. Head & Neck 2014;37:1268–73 [DOI] [PubMed] [Google Scholar]
- 8.Gutkind JS, Ondrey FG, Laronde D, Rosin M, Molinolo AA, Coffey C, et al. Abstract 4985: M4OC-Prevent: Clinical evaluation of metformin for oral cancer precision prevention. Cancer Res 2018;78:4985– [Google Scholar]
- 9.Pollak M The insulin and insulin-like growth factor receptor family in neoplasia: an update. Nature Reviews Cancer 2012;12:159–69 [DOI] [PubMed] [Google Scholar]
- 10.Higurashi T, Hosono K, Takahashi H, Komiya Y, Umezawa S, Sakai E, et al. Metformin for chemoprevention of metachronous colorectal adenoma or polyps in post-polypectomy patients without diabetes: a multicentre double-blind, placebo-controlled, randomised phase 3 trial. The Lancet Oncology 2016;17:475–83 [DOI] [PubMed] [Google Scholar]
- 11.Martin D, Abba MC, Molinolo AA, Vitale-Cross L, Wang Z, Zaida M, et al. The head and neck cancer cell oncogenome: a platform for the development of precision molecular therapies. Oncotarget 2014;5:8906–23 [DOI] [PMC free article] [PubMed] [Google Scholar]
- 12.Wheaton WW, Weinberg SE, Hamanaka RB, Soberanes S, Sullivan LB, Anso E, et al. Metformin inhibits mitochondrial complex I of cancer cells to reduce tumorigenesis. eLife Sciences 2014;3:e02242. [DOI] [PMC free article] [PubMed] [Google Scholar]
- 13.Seo BB, Kitajima-Ihara T, Chan EKL, Scheffler IE, Matsuno-Yagi A, Yagi T. Molecular remedy of complex I defects: Rotenone-insensitive internal NADH-quinone oxidoreductase of Saccharomyces cerevisiae mitochondria restores the NADH oxidase activity of complex I-deficient mammalian cells. Proc Natl Acad Sci U S A 1998;95:9167–71 [DOI] [PMC free article] [PubMed] [Google Scholar]
- 14.Zoncu R, Efeyan A, Sabatini DM. mTOR: from growth signal integration to cancer, diabetes and ageing. Nat Rev Mol Cell Biol 2011;12:21–35 [DOI] [PMC free article] [PubMed] [Google Scholar]
- 15.Wang Z, Feng X, Molinolo AA, Martin D, Vitale-Cross L, Nohata N, et al. 4E-BP1 Is a Tumor Suppressor Protein Reactivated by mTOR Inhibition in Head and Neck Cancer. Cancer Res 2019;79:1438–50 [DOI] [PMC free article] [PubMed] [Google Scholar]
- 16.Birsoy K, Wang T, Chen WW, Freinkman E, Abu-Remaileh M, Sabatini DM. An Essential Role of the Mitochondrial Electron Transport Chain in Cell Proliferation Is to Enable Aspartate Synthesis. Cell 2015;162:540–51 [DOI] [PMC free article] [PubMed] [Google Scholar]
- 17.Sullivan LB, Gui DY, Hosios AM, Bush LN, Freinkman E, Vander Heiden MG. Supporting Aspartate Biosynthesis Is an Essential Function of Respiration in Proliferating Cells. Cell 2015;162:552–63 [DOI] [PMC free article] [PubMed] [Google Scholar]
- 18.Liberzon A, Birger C, Thorvaldsdottir H, Ghandi M, Mesirov JP, Tamayo P. The Molecular Signatures Database (MSigDB) hallmark gene set collection. Cell Syst 2015;1:417–25 [DOI] [PMC free article] [PubMed] [Google Scholar]
- 19.Young Richard A. Control of the Embryonic Stem Cell State. Cell 2011;144:940–54 [DOI] [PMC free article] [PubMed] [Google Scholar]
- 20.Takebe N, Harris PJ, Warren RQ, Ivy SP. Targeting cancer stem cells by inhibiting Wnt, Notch, and Hedgehog pathways. Nature Reviews Clinical Oncology 2011;8:97–106 [DOI] [PubMed] [Google Scholar]
- 21.Malta TM, Sokolov A, Gentles AJ, Burzykowski T, Poisson L, Weinstein JN, et al. Machine Learning Identifies Stemness Features Associated with Oncogenic Dedifferentiation. Cell 2018;173:338–54.e15 [DOI] [PMC free article] [PubMed] [Google Scholar]
- 22.Krishnamurthy S, Nör JE. Head and Neck Cancer Stem Cells. J Dent Res 2012;91:334–40 [DOI] [PMC free article] [PubMed] [Google Scholar]
- 23.Seino S, Shigeishi H, Hashikata M, Higashikawa K, Tobiume K, Uetsuki R, et al. CD44(high)/ALDH1(high) head and neck squamous cell carcinoma cells exhibit mesenchymal characteristics and GSK3-dependent cancer stem cell properties. J Oral Pathol Med 2016;45:180–8 [DOI] [PubMed] [Google Scholar]
- 24.Prince ME, Sivanandan R, Kaczorowski A, Wolf GT, Kaplan MJ, Dalerba P, et al. Identification of a subpopulation of cells with cancer stem cell properties in head and neck squamous cell carcinoma. Proc Natl Acad Sci U S A 2007;104:973–8 [DOI] [PMC free article] [PubMed] [Google Scholar]
- 25.Foretz M, Guigas B, Bertrand L, Pollak M, Viollet B. Metformin: from mechanisms of action to therapies. Cell Metab 2014;20:953–66 [DOI] [PubMed] [Google Scholar]
- 26.Vancura A, Bu P, Bhagwat M, Zeng J, Vancurova I. Metformin as an Anticancer Agent. Trends Pharmacol Sci 2018;39:867–78 [DOI] [PMC free article] [PubMed] [Google Scholar]
- 27.Pollak M The effects of metformin on gut microbiota and the immune system as research frontiers. Diabetologia 2017;60:1662–7 [DOI] [PubMed] [Google Scholar]
- 28.Pollak MN. Investigating metformin for cancer prevention and treatment: the end of the beginning. Cancer Discov 2012;2:778–90 [DOI] [PubMed] [Google Scholar]
- 29.Chae YK, Arya A, Malecek MK, Shin DS, Carneiro B, Chandra S, et al. Repurposing metformin for cancer treatment: current clinical studies. Oncotarget 2016;7:40767–80 [DOI] [PMC free article] [PubMed] [Google Scholar]
- 30.Gui DY, Sullivan LB, Luengo A, Hosios AM, Bush LN, Gitego N, et al. Environment Dictates Dependence on Mitochondrial Complex I for NAD+ and Aspartate Production and Determines Cancer Cell Sensitivity to Metformin. Cell Metab 2016;24:716–27 [DOI] [PMC free article] [PubMed] [Google Scholar]
- 31.Cheong JH, Park ES, Liang J, Dennison JB, Tsavachidou D, Nguyen-Charles C, et al. Dual inhibition of tumor energy pathway by 2-deoxyglucose and metformin is effective against a broad spectrum of preclinical cancer models. Molecular cancer therapeutics 2011;10:2350–62 [DOI] [PMC free article] [PubMed] [Google Scholar]
- 32.Madiraju AK, Erion DM, Rahimi Y, Zhang XM, Braddock DT, Albright RA, et al. Metformin suppresses gluconeogenesis by inhibiting mitochondrial glycerophosphate dehydrogenase. Nature 2014;510:542–6 [DOI] [PMC free article] [PubMed] [Google Scholar]
Associated Data
This section collects any data citations, data availability statements, or supplementary materials included in this article.


