

Abstract
Neurons can engage in synchronized oscillatory activity in the gamma-frequency range when responding to sensory stimuli. Both the oscillatory patterning and the synchronization of responses are enhanced with arousal and attention or when the electroencephalogram is activated by electrical stimulation of the mesencephalic reticular formation. Here we show with intracortical application of cholinergic antagonists that the enhancement of gamma oscillations and response synchronization is mediated by acetylcholine and muscarinic receptors. We demonstrate further that coapplication of cholinergic agonists with synchrony-inducing light stimuli causes a lasting increase in the probability that the stimulated cells engage in gamma oscillations and response synchronization. These changes develop slowly over tens of minutes and then persist for many hours. Thus, cholinergic modulation plays a crucial role both in the fast, state-dependent facilitation of gamma oscillations and response synchronization and in use-dependent long-term modifications of cortical dynamics that favor synchronization of responses in the gamma-frequency range.
Keywords: gamma oscillations, response synchronization, cat visual cortex, cholinergic antagonists, cholinergic agonists, mesencephalic reticular formation
Introduction
Evidence suggests that synchronization of neuronal activity is a frequent and functionally relevant phenomenon (Singer, 1999). In cortical structures, synchronization is often attributable to phase locking of oscillatory activity that occurs in distinct frequency bands. Precise synchronization of neuronal discharges, such as occurs in association with oscillations in the beta- and gamma-frequency range has been shown to be involved in functions as diverse as feature integration in perception (Rodriguez et al., 1999), cross-modal integration (Roelfsema et al., 1997), selective attention (Tiitinen et al., 1993; Müller et al., 2000; Fries et al., 2001), short-term memory (Tallon-Baudry et al., 1998), and associative and perceptual learning (Miltner et al., 1999; Gruber et al., 2001, 2002). The degree of synchrony among oscillatory discharges of interconnected neurons has also been identified as a critical variable that controls the occurrence and polarity of Hebbian modifications (Lisman, 1989; Markram et al., 1997). These data suggest that response synchronization plays an important role in cognition and learning. This proposition is supported by the marked state dependency of response synchronization. The millisecond precise synchronization of discharges that is associated with gamma oscillations occurs only during states characterized by an activated electroencephalogram (EEG) (low amplitude, high frequency) and breaks down when the EEG becomes dominated by low-frequency oscillations (Steriade et al., 1996; Herculano-Houzel et al., 1999). Thus, response synchronization is associated with brain states such as arousal and focused attention that support cognition and learning. The mechanisms responsible for activating the EEG involve widespread subcortical systems, including the mesencephalic reticular formation (MRF) (Moruzzi and Magoun, 1949; Dringenberg and Vanderwolf, 1998) and the basal forebrain (Dringenberg and Vanderwolf, 1998). Accordingly, visually induced gamma oscillations and response synchronization can be facilitated by electrical stimulation of the MRF (Munk et al., 1996; Herculano-Houzel et al., 1999). Ascending projections from the MRF do not directly project to the cortex but send fibers to the basal forebrain (Wainer and Mesulam, 1990), which is the major cholinergic source of the entire neocortex (Semba and Fibiger, 1989). This cholinergic projection plays a major role in mediating the modulatory signals to the cortex that lead to arousal (Dringenberg and Vanderwolf, 1998). Other state-controlling systems comprise projections that originate in various nuclei of the brainstem and innervate monosynaptically diencephalic and telencephalic structures (Pare et al., 1988; Smith et al., 1988; Steriade et al., 1988; Dringenberg and Vanderwolf, 1998). In addition, states of cortical activation are modulated by heterogeneous projections from nonspecific thalamic nuclei (for review, see Steriade et al., 1997).
Here we investigate the hypothesis that cholinergic mechanisms play a crucial role in facilitating the following: (1) visually induced oscillations in the gamma-frequency range, (2) the associated precise synchronization of cortical responses, and (3) the related use-dependent long-term modifications of cortical response properties.
Materials and Methods
Anesthesia and recording. Anesthesia was induced with ketamine (Ketanest; 10 mg/kg, i.m.; Parke-Davis, Courbevoie, France) and xylacine (Rompun; 2 mg/kg, i.m.; Bayer, Leverkusen, Germany) and maintained with a mixture of 70% N2O and 30% O2 supplemented by 0.4-0.8% halothane. Heart rate, end-tidal CO2, and temperature were monitored continuously. Paralysis was obtained with pancuronium bromide (Pancuronium; 0.15 mg · kg-1 · hr-1; Organon, Oberschleissheim, Germany). Multi-unit (MU) and local field potential (LFP) responses were recorded in primary visual cortex (A17) with up to six varnish-coated tungsten electrodes placed at different distances (200 μm to 3 mm) from the drug application. EEGs were recorded from small silver ball electrodes placed on the visual cortex. MU activity was bandpass filtered from 1 to 3 kHz, spikes were detected with a Schmitt trigger whose threshold was set to twice the noise level, and time stamps were acquired with a precision of 2 μsec. LFP and EEG signals were bandpass filtered from 5-100 and 1-100 Hz, respectively, and digitized at 1 kHz (1401Plus; Cambridge Electronics Design, Cambridge, UK). To analyze the effects of scopolamine, MU and LFP recordings were obtained from 20 and 23 sites, respectively. To examine the effects of cholinergic agonists, MU and LFP activity was recorded from 22 sites and 14 sites, respectively. These studies were performed in six animals: four animals with agonists and four with scopolamine (two of them with agonist and antagonist application). In two of these animals, the hemisphere contralateral to scopolamine application was also studied (MU activity from five sites; LFPs from six sites). Electrodes were positioned at the same anteroposterior stereotaxic coordinates as in the ipsilateral hemisphere (4-6 mm from the application site). In two animals, MRF stimulation was combined with scopolamine application (MUs and LFPs from 10 sites). Control experiments were performed in three additional animals in which agonists were applied in the absence (MUs from 14 sites; LFPs from 28 sites) or in the presence (MUs from 10 sites; LFP from 16 sites) of visual stimulation.
MRF stimulation. Bipolar concentric stimulation electrodes were bilaterally placed in the MRF at Horsley Clark coordinates A2, H8, L ± 2. Stimuli consisted of trains (60-100 msec) of five constant current pulses (100-165 μsec at 75 Hz, 0.25-2 mA) that were applied 150-300 msec before the onset of visual responses. The location of the electrodes was adjusted to produce maximal facilitation of cortical evoked potentials elicited by electrical stimulation (50 μsec, 1-2 mA) of the optic chiasm (A14.5, H5, L ± 3).
Iontophoresis. Drugs were diluted in distilled water and were applied with seven-barrel pipettes: acetylcholine chloride (2 m, pH 4.5), carbachol (1 m, pH 4), and scopolamine (0.2 m, pH 4). The entire tip diameter was 8-15 μm. Continuous ejection was achieved for 20-50 min at a current of 100-250 nA. Retention currents (15 nA) with opposite sign were used to control drug leakage. Two different pharmacological protocols were used: the first consisted of baseline measurements without and with MRF stimulation and scopolamine application without and with MRF stimulation (every epoch, 300 trials, 50 min) (see Fig. 1); the second consisted of a baseline, followed by two epochs of agonists application (carbachol and/or acetylcholine) and multiple postejection epochs (every epoch, 300 trials, 50 min) (see Fig. 2 A).
Figure 1.
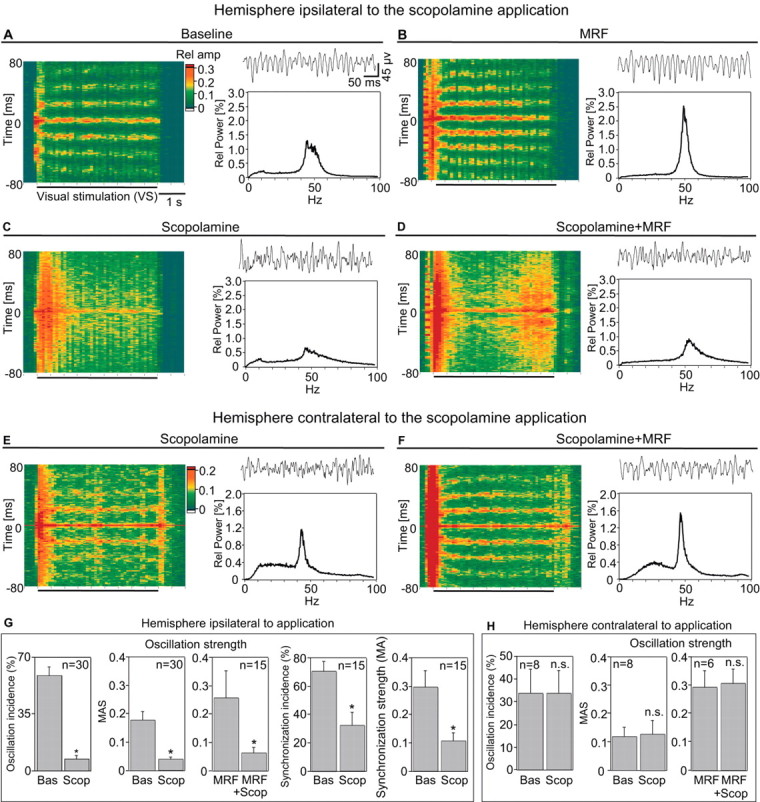
Effects of scopolamine application on spike correlations and LFP power during visual stimulation, without and with MRF stimulation. A-F, Sliding window cross-correlation functions (analysis window, 200 msec; step, 100 msec; amplitude normalized by the number of spikes in each window) computed for 10 consecutive trials (selected at the median of the oscillation strength for every epoch). Visual stimulation lasted 4500 msec, as depicted on the abscissa. Top right, Single-trial LFPs selected from a 500 msec window starting 1000 msec after the beginning of light stimulation. Bottom right, Relative power spectrum of LFPs averaged over 300 trials (50 min). A, Baseline; B, with MRF stimulation; C, scopolamine ejection; D, with MRF stimulation and scopolamine; E, F, simultaneously recorded control responses from the opposite hemisphere. G, H, Group data of the scopolamine (Scop) effect on the incidence and strength (MAS) of gamma oscillations in autocorrelograms and incidence and strength (MA) of spike synchronization in cross-correlograms in the drug-infused (G) and the control (H) hemispheres. Bas, Baseline. Bar plots represent the mean values computed from analyzing n autocorrelograms and cross-correlograms. *p ≤ 0.001. n.s., Not significant.
Figure 2.
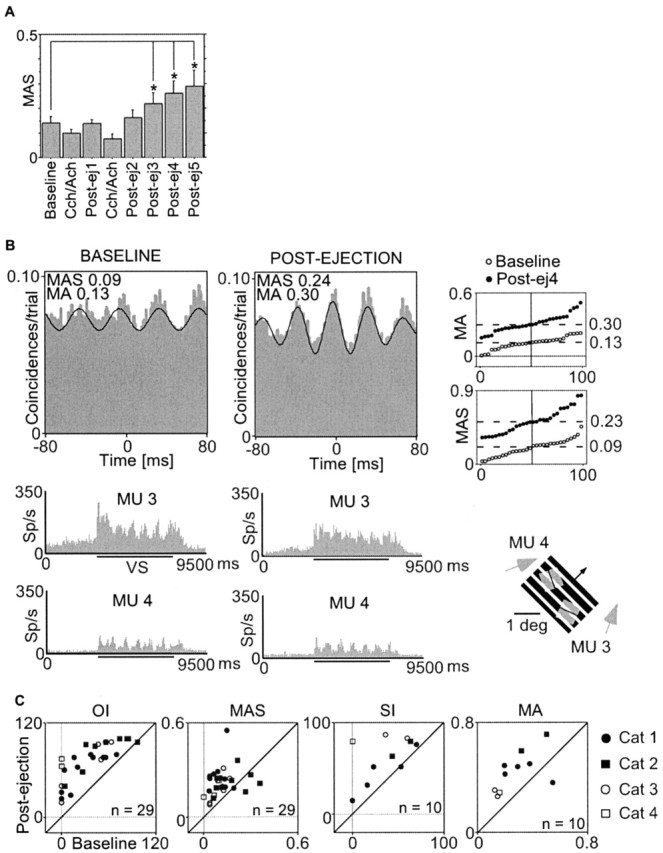
Effects of pairing cholinergic and visual stimulation on MU responses. A, Time course of changes in oscillation strength (MAS) of autocorrelograms (n = 29) averaged from all experiments. Note the progressive increment of oscillatory modulation that becomes significant (*p < 0.001) in the third postejection epoch, 50-100 min after the last pairing sequence. Abscissa, Epochs (300 trials, 50 min) before (baseline), during carbachol-acetylcholine (Cch/Ach), and after conditioning (Postej). B, Effects of conditioning on the strength of gamma oscillations (MAS) and their synchronization (MA). Cross-correlograms (top) and PSTHs (bottom) of MU responses recorded from two sites (MU3 and MU4) in A17 before (left, baseline) and after (right, postejection) pairing cholinergic and visual stimulation. Thin black lines in cross-correlograms correspond to the fitted Gabor functions. Examples are computed from 10 trials and represent the median of the respective distributions shown in the percentile plot (top right), which contains MAS values determined before (○) and after (•) pairing (every dot corresponds to 10 trials). Receptive field positions (gray squares; arrows indicate direction performance) and visual stimulus (oblique grating; arrow indicates direction of motion) are shown below the percentile plot. Sp/s, Spikes per second. C, Summary of incidence and strength of oscillations (OI, MAS) and of synchronization (SI, MA) of MU responses for all experiments. Postejection values (ordinate) are plotted as a function of baseline values (abscissa). Each data point represents the mean value obtained from 16 autocorrelograms and 13 cross-correlograms in the four cats (see legend on the right). For synchronization incidence and strength, three cases were removed because the SI was already 100% in the baseline and did not decline after ejection.
Visual stimulation and data analysis. Moving gratings were used as visual stimulation and were presented on a 21 inch computer monitor at 100 Hz refresh rate. Stimuli were presented for 4500 msec and repeated every 10 sec. For quantitative assessment of correlation functions from MU responses and of power spectra from LFP and EEG recordings, data from 10 consecutive trials were pooled. Analysis was confined to the sustained part of the visual response (200-4500 msec). Autocorrelation and cross-correlation histograms were calculated from individual trials with a resolution of 1 msec and time shifts of ±80 msec. Shuffled cross-correlograms (shift predictors) were routinely computed to test for correlations resulting from stimulus locking. These shift predictors were flat, and hence no correction of the cross-correlograms was required. For quantitative analysis, correlations were fitted by damped cosine (Gabor) functions (König, 1994). This allowed determination of the strength of oscillatory modulation and synchronization from the ratios of the amplitudes of the first satellite peak and the central peak, respectively, over the offset of the fitted function: MAS (modulation amplitude of the first satellite peak) and MA (modulation amplitude of the central peak). A correlogram was considered to reveal significant oscillatory (or synchronized) activity if the first satellite (or central) peak had a Z score >2 and if MAS or MA was ≥0.1. The incidence of oscillation (OI) and synchronization (SI) was expressed as the percentage of responses exhibiting significant oscillations and synchronization, respectively, during baseline and test epochs. Power spectra of LFPs and EEGs were computed with a fast Fourier transform algorithm, normalized for the signal energy between 1 and 120 Hz, and analyzed in six different frequency bands: 1-4 (delta), 4-8 (theta), 8-14 (alpha), 14-21 (beta), 21-48 (low gamma), and 52-70 (high gamma) Hz. Results presented here refer to the theta and lower gamma bands, which showed the most significant changes. For group analysis of MU and LFP responses, mean values from the different postejection epochs were compared with the mean values from the baseline. As onset latency of the delayed effects, we considered the postejection time window in which a significant change was first observed. All comparisons were made between baseline and test epochs of identical duration. Group data were compared by the Wilcoxon signed rank test (Statview version 5.0.1; SAS Institute, Cary, NC).
Results
In nine lightly anesthetized, paralyzed cats, we simultaneously recorded MU activity and LFPs with arrays of microelectrodes and the EEG with silver ball electrodes from primary visual cortex (A17). Visual stimulation was performed with moving gratings covering the receptive fields of all recording sites, and the orientation of stimuli was adjusted to coactivate as many of the recorded neurons as possible. In addition, the MRF was electrically stimulated before the presentation of light stimuli to enhance gamma oscillations and response synchronization and to determine whether this enhancement is mediated by cholinergic receptors. The muscarinic cholinergic antagonist scopolamine or the cholinergic agonists acetylcholine and carbachol were applied intracortically with iontophoresis through multibarrel pipettes in the vicinity of the recording electrodes. We assessed the firing rate with peristimulus time histograms (PSTHs), the oscillatory patterning of responses from the MAS of autocorrelograms, and the synchronization from the MA in cross-correlograms. In addition, we computed the power spectra of LFP signals (see Materials and Methods).
Scopolamine application
As described previously (Gray et al., 1989), light stimuli evoked MU and LFP responses that exhibited an oscillatory patterning in the gamma-frequency range and were synchronized with zero phase lag (Fig. 1A). As shown previously (Munk et al., 1996; Herculano-Houzel et al., 1999), MRF stimulation enhanced this oscillatory patterning and the synchronization (p < 0.05; Wilcoxon signed rank test) of light responses (Fig. 1, compare A, B). This is reflected by an increased regularity and persistence of oscillatory discharges in cross-correlograms computed from MU responses, by greater regularity and amplitude of oscillations in the LFP, and by sharpening of the gamma-band peak in the power spectrum of the LFP. Scopolamine application strongly reduced both the oscillatory patterning and the synchronization of light responses (Fig. 1, compare A, C). Furthermore, it reduced the enhancing effect of MRF stimulation on gamma oscillations and response synchronization (Fig. 1, compare B, D) in both MU and LFP responses. A similar effect could be observed when atropine was applied (Fig. 3 in supplemental material, available at www.jneurosci.org).
Statistical analysis of all experiments (Fig. 1G; see also Fig. 1 in supplemental material, available at www.jneurosci.org) confirmed that scopolamine markedly reduced the incidence and strength of gamma oscillations and response synchronization in light-evoked MU responses. The reduction of the incidence of oscillatory epochs was highly significant for both responses elicited without (p < 0.0001) and with preceding MRF stimulation (p < 0.007). The same was true for the reduction of the strength of oscillations (assessed from the MAS of autocorrelograms) for responses obtained without MRF stimulation (p < 0.0001) and for responses preceded by MRF stimulation (p < 0.0007). This blockade of gamma oscillations was paralleled by an equally significant reduction of response synchronization. Both the incidence and strength of response synchronization (assessed from the MA of cross-correlograms) were significantly reduced during scopolamine application for both responses obtained with (p < 0.0007) and without (p < 0.0007) MRF stimulation. Accordingly, scopolamine also reduced the signal power in the gamma frequency range of the LFP responses (p < 0.0005; n = 17). These effects of scopolamine were restricted to the injected hemisphere (Fig. 1C,D,G), which excludes that the effects were attributable to uncontrolled state fluctuations. MU responses simultaneously recorded in the hemisphere contralateral to drug application showed no effect of scopolamine (p > 0.3) on the incidence and strength of gamma oscillations in responses obtained without and with MRF stimulation (Fig. 1E,F,H). We infer from these results that (1) a steady-state level of acetylcholine is required for the generation of stimulus-induced gamma oscillations and the synchronization of light responses, (2) the facilitatory action of MRF stimulation on these phenomena is mediated by enhanced release of acetylcholine, and (3) the effects are mediated by muscarinic receptors.
Application of cholinergic agonists
To examine whether cholinergic agonists enhance gamma oscillations and response synchronization, we applied acetylcholine and carbachol iontophoretically in conjunction with light stimuli (see Materials and Methods). Unexpectedly, agonists did not cause an immediate enhancement of the oscillatory modulation of MU responses. However, consistent and highly significant effects of pairing cholinergic stimulation with visual evoked responses became manifest 75 ± 25 min (mean ± SD; range, 45-100) after the end of drug ejection and then persisted over many hours (maximal duration measured, 4 hr) (Fig. 2A,B). The strength of the oscillatory patterning of light-evoked MU responses increased on average twofold (Fig. 2B, percentile plot). This facilitation of oscillatory firing in the gamma-frequency range was not accompanied by a modification in the firing rate, as indicated by the PSTHs in Figure 2B. Across all experiments, we observed a twofold increment in incidence and strength of gamma oscillations (p < 0.0001; n = 29), as well as in incidence and strength of synchronization (p < 0.02; n = 10) (Fig. 2C, scatter plots; see also Fig. 2 in supplemental material, available at www.jneurosci.org).
The increase of gamma oscillations after combined visual stimulation and cholinergic stimulation was also evident in the power spectra of the light-induced LFP responses (Fig. 3A). Before pairing, light-induced LFP responses exhibited occasionally substantial power in the gamma-frequency range, but these episodes lasted only for brief sequences of successive responses. During drug ejection, effects were variable, but, in the postejection period, the oscillatory patterning of the responses stabilized in the gamma-frequency range. Thus, the delayed effects of conditioning were similar for MU and LFP responses. In the example shown in Figure 3A, the delay was shorter than for the group mean, but the stabilization of gamma power was in the typical range (see Fig. 8C,E). Across all experiments (Fig. 3B), there was a 35% increase of high-frequency (gamma band) and a 51% reduction of low-frequency (4-8 Hz band) oscillations in light-evoked LFP responses after pairing of cholinergic stimulation and visual stimulation (p < 0.001; n = 14).
Figure 3.
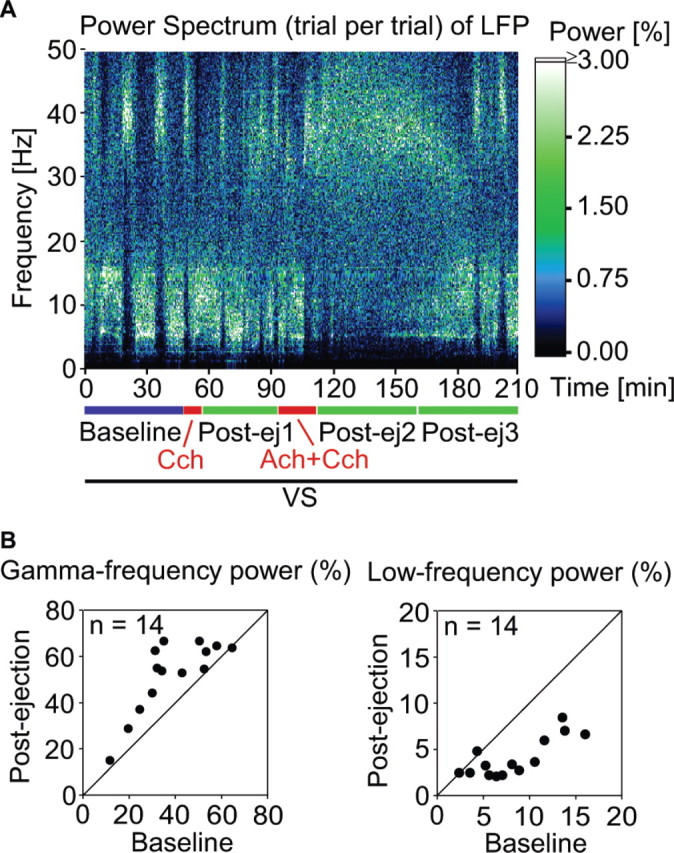
Effects of conditioning on LFP frequency spectra. A, Single trial-based time-frequency plot of relative power in light-evoked LFP responses from one recording site before (baseline), during (Ach+Cch), and after (Post-ej) pairing of cholinergic stimulation with visual stimulation (VS). The relative power in the frequency spectrum is color coded: black and white represent minimum and maximum power, respectively. Frequency resolution is 0.23 Hz. Note the sustained increase of power in the gamma range (here, 30-48 Hz) and the decrease of power in the low-frequency range (here, 4-8 Hz) after pairing cholinergic and visual stimulation (Post-ej2). B, Scatter plot comparing relative gamma-frequency power of LFPs (•; n = 14) before (abscissa) and after (ordinate) conditioning, each point representing the result from one recording site.
Figure 8.
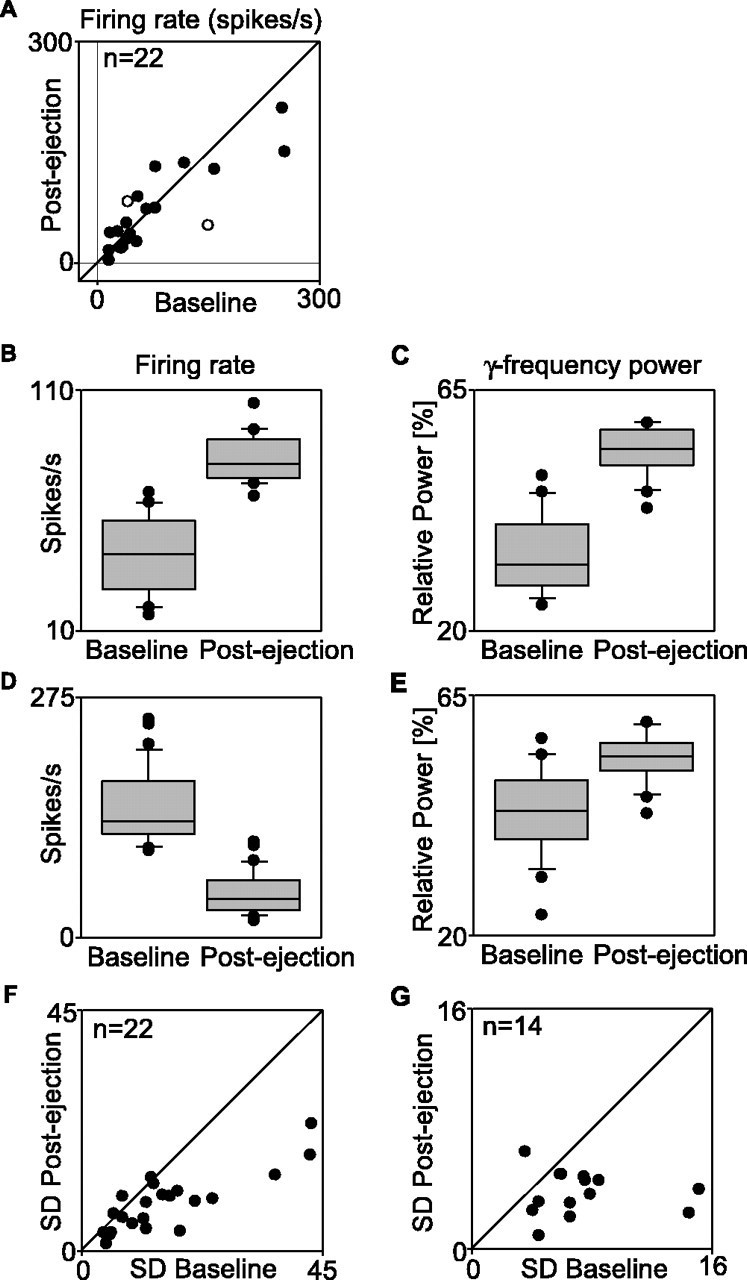
Conditioning effects on the variability of firing rate and of gamma power in LFP responses. A, Averaged firing rate before (abscissa) and after (ordinate) pairing cholinergic and visual stimulation. Each dot corresponds to one recording site. Open circles represent the examples shown in D and F. B-E, Effect of pairing cholinergic and visual stimulation on firing rates (B, D) and gamma power in LFPs (C, E) at two different recording sites (B, C and D, E). Note that firing rate increased at one recording site (B) and decreased at the other (D), although gamma power increased in both cases (C, E). Note also that the SD decreased for firing rates and gamma power in both cases. F, G, Group data comparing the SD of firing rates (F) and of gamma-frequency power of LFPs (G) before (abscissa) and after (ordinate) pairing cholinergic and visual stimulation. n, Number of recording sites.
Synergy between cholinergic and light stimulation
The delayed onset and the long duration of these conditioning effects indicate that they may result from long-term modifications of cortical response properties. To examine whether these modifications depended solely on prolonged light stimulation or on cholinergic stimulation or on the pairing of cholinergic and visual stimulation, we applied light stimuli and agonists in isolation. Prolonged visual stimulation alone neither had a systematic effect on the incidence and strength of oscillations nor on response synchronization. These variables fluctuated in relation with spontaneous changes in cortical activation, but mean values measured in 50-min-long windows remained constant (maximal duration measured, 6 hr; data not shown). This suggests that the lasting modifications were facilitated by the agonists. To examine whether the facilitation required pairing of agonists with light responses, visual stimulation was discontinued in three experiments during application of cholinergic agonists and was resumed only 50-100 min later, which was the delay at which effects were consistently present in experiments with contingent light and cholinergic stimulation (Fig. 4A). In these controls, the incidence and strength of oscillatory responses and the synchronization of discharges were reduced or remained unchanged after agonist application. To ensure that these negative results were not attributable to the state of the animals, we subsequently applied the pairing protocol. In all of these control experiments, pairing cholinergic and visual stimulation led to a delayed and lasting increase of oscillatory modulation of light responses (Fig. 4B). Furthermore, we had one case in which recording stability was sufficient to study the effects of three subsequent protocols at the same recording site (Fig. 4C). We started with unpaired, continued with a paired, and finished with another unpaired protocol. With the first protocol, we observed a reduction, followed by an enhancement, and at last another reduction of gamma oscillations (Fig. 4C). These results indicate that pairing of cholinergic stimulation with visual stimulation leads to lasting changes of cortical response properties that result in an increased probability of cortical neurons to engage in oscillatory firing patterns in the gamma-frequency range and to synchronize their responses to coherent light stimuli with millisecond precision.
Figure 4.
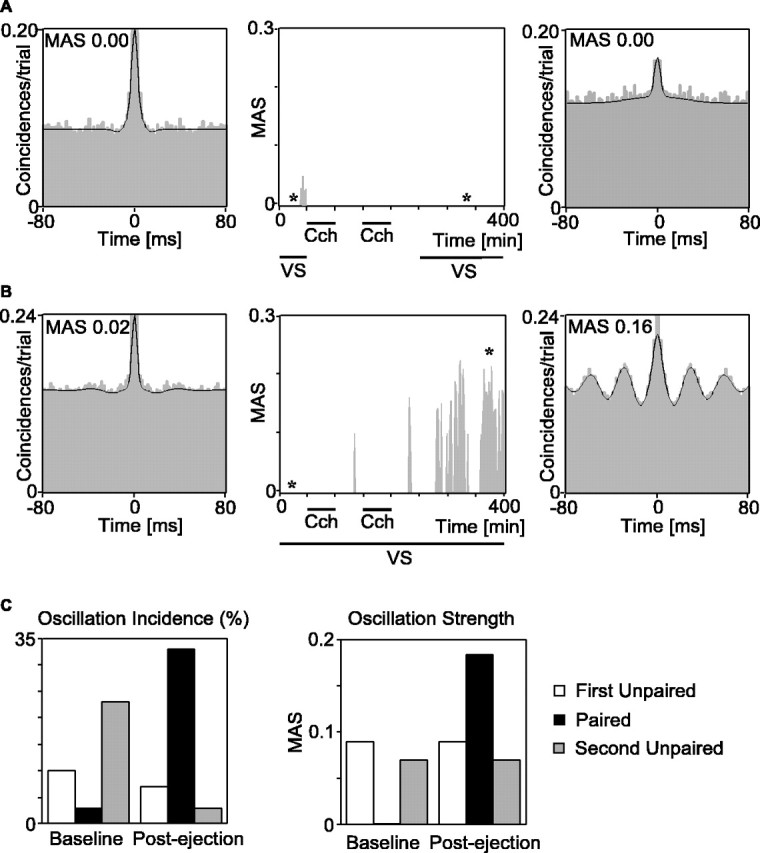
Control experiments. Effects of carbachol (Cch) application without and with visual stimulation (VS) on gamma oscillations in MU responses. A, Autocorrelograms of light-evoked MU responses computed before (left) and after (right) carbachol had been applied twice without visual stimulation. The displayed autocorrelograms are averaged from 10 trials at time points indicated by the asterisks in the central plot, which shows the time course of the oscillatory modulation (MAS). Note the absence of any significant oscillatory modulation before and after cholinergic stimulation. B, Data from the same recording site, obtained before and after carbachol had been applied in conjunction with visual stimulation. Note the massive increase of gamma oscillations (MAS) in the autocorrelograms, starting 75 min after the second conditioning. C, Mean changes in oscillation incidence and strength for a single case for which three subsequent protocols could be obtained. Note that, in both protocols with unpaired visual and cholinergic stimulation, oscillations were weakened, whereas the interleaved protocol with paired stimulation led to a massive increase.
Analysis of LFP responses
The analysis of LFP responses permits assessment of oscillatory activity also in the absence of light stimulation. With MU activity, this is usually not possible because spontaneous activity is low and autocorrelograms and cross-correlograms do not have enough entries for reliable statistical evaluation. Analyzing LFP activity in the absence of light stimuli revealed that agonist application alone did actually have a short-latency effect on oscillatory activity. Agonist application evoked gamma oscillations, but these exhibited lower frequencies than those evoked by light stimuli (Fig. 5A). The mean frequency during agonist application (26.2 ± 0.36 Hz) was significantly lower (p < 0.001; n = 26 LFPs) than in the previous baseline period (37.6 ± 1.10 Hz) (Fig. 5B). Comparison of light-evoked LFP activity before and after applying agonists in the absence of light stimuli revealed that agonist application alone had no enhancing effect on light-evoked gamma oscillations (Fig. 5A). On the contrary, there was now a lasting reduction of gamma activity by 7% (p < 0.005).
Figure 5.
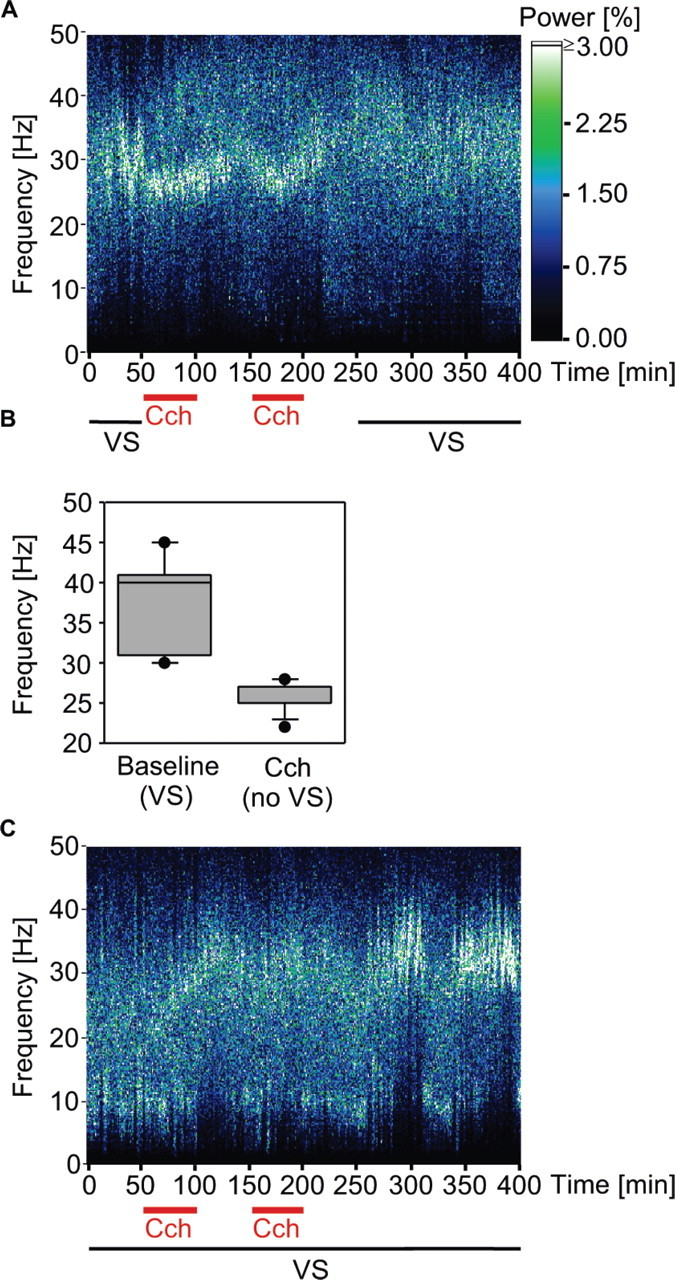
LFP frequency spectra from the same recording site and experimental sequence as in Figure 4. A, Effects of applying carbachol (Cch) without visual stimulation (VS). Note that agonist application induces gamma oscillations in the absence of visual stimulation, the frequency being lower than that of light-induced gamma oscillations. Note also that agonists did not cause a lasting facilitation of gamma oscillations. B, Averaged frequency spectra of LFP oscillations induced by light (baseline) and induced by carbachol application without visual stimulation. Box plots represent median values (line within box), quartiles (top and bottom lines of box), and the 10th and 90th percentiles. C, Effect of applying agonist in conjunction with light stimulation on LFP visual responses. Note the delayed increase of gamma oscillations after conditioning, also correlated with the MU from the same electrode displayed in Figure 4 B.
Subsequent pairing of agonists with visual stimulation at the same recording sites (Fig. 5C) caused a delayed and highly significant increase (23%) in gamma power (p < 0.0001, compared with predrug baseline). Thus, the LFP data confirm the results obtained with MU recordings. The fact that these conditioning effects were visible in LFP responses suggests that changes had occurred in an extended network of cortical units because LFP fluctuations reflect mainly excitatory synaptic currents that become visible only if large numbers of synapses are synchronously active (Mitzdorf and Singer, 1978). This renders it unlikely that the long-term changes observed in the MU responses after conditioning were attributable to uncontrolled changes in the composition of the MU activity.
Conditioning effects and cortical activation
Because the occurrence of light induced gamma oscillations is state dependent (see Introduction), the enhanced disposition of cortical cell populations to engage in synchronous gamma oscillations could have resulted from spontaneous fluctuations of cortical activation that happened to produce lower levels of activation before than after conditioning. Several observations render this possibility unlikely. A reliable measure of global state changes and ensuing fluctuations of cortical activation is the EEG. In the cases shown in Figures 4 and 5, the EEG happened to be similarly activated (p > 0.05) before the period in which cholinergic stimulation was applied alone (fractional gamma power, 6.4 ± 2.0%) and before the period in which cholinergic stimulation was combined with visual stimulation (5.9 ± 2.0%). Thus, global activation levels were similar and, if anything, were higher before than after conditioning. As an additional control, we normalized changes in the oscillation strength (MAS) with the gamma power in the simultaneously recorded EEG and expressed the ratio of MAS/gamma in percentage of the mean baseline value. This normalized index for oscillation strength increased by 57% (p < 0.05; n = 6) after pairing visual stimulation with cholinergic stimulation and decreased by 53% (p < 0.05; n = 7) after cholinergic stimulation without visual stimulation (Fig. 6). Thus, the increase of oscillatory patterning and response synchronization observed after pairing cholinergic and visual stimulation cannot be attributed to fluctuations in global state.
Figure 6.

Conditioning effects on spike oscillations after normalization against EEG power. Oscillation strength (MAS) was normalized for the gamma power in corresponding EEG recordings, and effects were determined after conditioning (Post-ejection) for the three control experiments with carbachol (Cch) application either with (black; n = 6) or without (gray; n = 7) contingent visual stimulation (VS). Error bars indicate 1 SEM. The MAS/gamma ratio of 1 corresponds to the mean of the baseline measurements before conditioning.
There was an indication for a reduced disposition of neurons to engage in synchronized gamma oscillations after cholinergic agonists had been applied in the absence of visual stimulation. We observed a similar effect after pairing-unpairing MRF stimulation with visual stimulation. When MRF was stimulated in conjunction with synchrony-inducing light stimuli, this resulted in a lasting enhancement of synchronization probability and strength, but, when MRF was stimulated alone, response synchronization was found to be reduced when visual stimulation was resumed (our unpublished observations).
Effects of distance between recording and drug application sites
To assess to what extent drug diffusion and clearance times affected the latencies of the action of agonists and antagonists, we measured the strength and latency of drug effects on MU and LFP responses as a function of distance between recording sites and the iontophoresis pipette (Fig. 7). As expected, a clear effect was found for the short-latency effect of scopolamine (Fig. 7A,B) but not for the long-latency effect of conditioning (Fig. 7C,D). Recording sites close to the application site (e.g., the electrode glued to the pipette, ≤200 μm) showed a more rapid (10-30 min) and stronger reduction in gamma oscillations (Fig. 7A). In comparison, at sites placed more distantly (∼2000 μm), the effect built up more slowly and remained smaller (Fig. 7B). At both the nearby and the remote locations, the scopolamine effects outlasted considerably the interval of drug application. Responses recovered to control levels only after 150 min and only with MRF stimulation (Fig. 7A).
Figure 7.

Effect of distance between drug application and recording site. A, B, Scopolamine (Scop) action on oscillation strength (MAS) in autocorrelograms of MU responses at a nearby (A; ≤200 μm) and a remote (B; ∼2000 μm) recording site. MAS reduction was faster and stronger in sites recorded closer to the application site (A) than in sites placed more distant to the scopolamine application (B). * indicates epochs without scopolamine and MRF stimulation. C, D, Enhancement of oscillation strength (MAS) by conditioning at a nearby (C; ≤200 μm) and a remote (D; ∼1500 μm) recording site. Note that latency and strength of gamma oscillations enhancement are similar at both sites. Cch, Carbachol; VS, visual stimulation.
In contrast, no distance dependency was apparent for the delayed effects after conditioning. These effects appeared with the same delay and magnitude at all electrodes and covaried thereafter, most likely attributable to fluctuations in cortical activation. Examples plotted in Figure 7, C and D, show that enhanced gamma oscillations appeared with similar temporal delay and magnitude at two sites, one corresponding to the electrode glued to the pipette (≤200 μm) (Fig. 7C) and the other to an electrode at a distance of ∼1500 μm (Fig. 7D).
Conditioning-dependent changes in firing rate
Analysis of firing rates revealed that the conditioning-dependent increases in oscillatory modulation and synchronization were unrelated to changes in response amplitude (Fig. 8B,D). On average, the discharge rates of preconditioning and postconditioning responses were similar (p > 0.6; n = 22) (Fig. 8A). This confirms previous results that have also shown that there is no systematic relationship between the probability of neurons to engage in synchronous and/or oscillatory firing and the actual discharge rate (Herculano-Houzel et al., 1999).
Previous experiments have shown that the variance of light responses to successive, identical stimuli gets reduced when neurons engage in synchronized gamma oscillations (Herculano-Houzel et al., 1999). To test whether the enhancement of gamma oscillations induced by pairing cholinergic and visual stimulation also lead to a reduction of response variability, we computed the SD of the firing rates (in spikes per second) of successively evoked MU responses and of the gamma power of associated LFP responses before and after pairing. As the examples in Figure 8B-E show, pairing reduced the variance of gamma power (C, E) and discharge rates (B, D) in successively recorded light responses. Both effects were associated with an overall increase in gamma power in LFPs (C, E) but showed no correlation with overall changes in discharge rate (B, D). At the group level (Fig. 8F,G), the SD of gamma power and of firing rates was reduced by 48% (p < 0.005) and 45% (p < 0.0003), respectively.
Discussion
The present results demonstrate two distinct cholinergically mediated effects on gamma oscillations and response synchronization that act with different time constants but are closely related to one another. The effects of scopolamine application indicate that a steady-state activation of muscarinic receptors is a necessary prerequisite for the oscillatory patterning and synchronization of visual responses in the gamma frequency range. Furthermore, the data show that the facilitatory effects that MRF stimulation has on gamma oscillations and response synchronization are abolished by blocking muscarinic receptors. A compatible effect was described for power shifts in EEGs and burst firing as revealed by intracellular recordings from parietal cortex (Steriade et al., 1993). However, the latter study was performed with systemic application of muscarinic and nicotinic antagonists. One possibility is that blockade of muscarinic receptors disabled cortical gamma oscillations and thereby prevented the manifestations of MRF effects that might themselves be mediated by noncholinergic transmitter systems. Candidates are the monoaminergic projections and the glutamatergic activation of noncholinergic cells in the basal forebrain. The other possibility is that the MRF effects are actually mediated by enhanced release of acetylcholine in the cortex. We favor the latter hypothesis for two reasons. First, recent in vitro experiments revealed that carbachol facilitates gamma oscillations in slices of the hippocampus (Fisahn et al., 1998) and cerebral cortex (Buhl et al., 1998). Second, in vivo data show that activation of cholinergic cells in the basal forebrain with neurotensin leads to enhanced gamma activity in the cortical EEG (Cape et al., 2000). These cells are also activated by MRF stimulation via a glutamatergic pathway (Khateb et al., 1997).
The effects of agonist application differed for spontaneous activity and light-evoked responses. The analysis of spontaneous activity in the LFP showed that agonist application without visual stimulation enhanced spontaneous oscillations, which is in agreement with the findings cited above. However, agonist application did not enhance the oscillatory patterning and the synchronization of light-evoked responses as was to be expected from the effects of MRF stimulation. This may have several reasons. First, the widespread and sustained application of cholinergic agonists cannot mimic the specific action of the mixed GABAergic and cholinergic projections from the basal forebrain to the cortex because of unselective activation of both synaptic and extrasynaptic muscarinic and nicotinic receptors at glutamatergic and GABAergic neurons. Another nonexclusive possibility is that the occurrence of gamma oscillations and precise response synchronization require cooperativity among spatially distributed cortical columns and that topically restricted application of cholinergic agonists had not affected a sufficiently large array of neurons. Furthermore, the enhancement of the oscillatory patterning and the synchronization of light-evoked responses may require the concerted action of additional, noncholinergic cofactors. Candidates are the numerous other modulatory systems that affect thalamic transmission and cortical processing and that are activated with arousal and MRF stimulation (for review, see Dringenberg and Vanderwolf, 1998). Finally, it may be considered that the carbachol-induced oscillations interfered with light-induced oscillations. Gamma oscillations are supported essentially by synchronized oscillatory firing of inhibitory interneurons (Whittington et al., 1995), and the oscillatory IPSP activity in turn synchronizes the firing of pyramidal cells (Traub et al., 1997; Buhl et al., 1998). In the present experiments, the frequency of the carbachol-induced oscillations was lower than that of the light-induced oscillations. The rather inconsistent, sometimes inhibitory effects that carbachol had on light-evoked oscillations could thus be attributable to complex, partly inhibitory interference between oscillatory mechanisms with different preferred frequencies (Kopell et al., 2000).
In contrast, pairing cholinergic agonists with light stimuli had a consistent long-term effect that caused a lasting facilitation of light-evoked gamma oscillations and response synchronization. A possible mechanism comprises use-dependent long-term modifications of cortical network properties that favor the oscillatory patterning and synchronization of light-evoked responses in the gamma-frequency range. Both in vitro (Bröcher et al., 1992; Wespatat et al., 2004) and in vivo (Shulz et al., 2000) studies indicate that cholinergic stimulation facilitates use-dependent synaptic modifications (for review, see Weinberger and Bakin, 1998; Rasmusson, 2000). Synaptic modifications are also facilitated by synchronous firing because this enhances cooperativity both between presynaptic excitatory inputs and between presynaptic and postsynaptic activity (Markram et al., 1997). Results from the control experiments indicate that pairing of cholinergic and visual stimulation was a prerequisite for the induction of these long-term modifications. The data also show that this facilitation cannot be mimicked by excess application of cholinergic agonists alone. Therefore, the most parsimonious explanation of the conditioning effects is that cholinergic stimulation facilitated synaptic modifications in circuits that were driven into synchronous oscillatory activity by visual stimulation. The variable and mostly long delays between conditioning and the manifestation of consistent effects can have several reasons. The presence of excess agonists seemed to interfere with the expression of high-frequency oscillations. As the duration of the scopolamine effects indicated, drug clearance was slow after the prolonged application used in these experiments. The delayed appearance of the conditioning effects could thus be attributable to slow clearance of agonists. Another possibility is that the modifications themselves develop slowly. Such delayed manifestations of use-dependent synaptic modifications have been described for the effects of monocular deprivation (Rauschecker and Hahn, 1987; Mioche and Singer, 1989; Frank et al., 2001) and for the enhancement of performance with perceptual learning (Karni and Sagi, 1993).
Associated with the enhanced disposition to engage in synchronous oscillations was a marked reduction in the variability of the light-evoked spiking neuronal responses. It is conceivable that there is a causal relationship between synchronization of oscillatory responses on the one hand and the reduction of response variability on the other hand. In oscillating cells, discharges are confined essentially to the depolarizing peaks of the membrane potential oscillation (Nowak et al., 1997; Azouz and Gray, 2000). Enhanced regularity of oscillations is therefore expected to reduce the variability of discharge rates.
At present, the functional implications of the observed long-term modifications are unclear. Synchronization enhances the saliency of neuronal responses, and the reduction of response variance improves the coherence of population responses. These mechanisms enhance signal-to-noise ratios and augment the stability of distributed codes (for review, see Perez-Orive et al., 2002). It is therefore likely that these long-term changes have important functions in the shaping of network properties that are beneficial for signal processing. One likely possibility is that they contribute to perceptual learning processes. These have been shown to occur in V1 (Karni and Sagi, 1993; Schoups et al., 2001), to require multiple stimulus exposures (Ahissar and Hochstein, 1993, 1997), to develop over long time periods, and to result in improved signal processing (Ahissar and Hochstein, 1993, 1997; Karni and Sagi, 1993; Schoups et al., 2001).
Evidence indicates that cholinergic modulation of cortical activity is essential for a large variety of cognitive processes (Everitt and Robbins, 1997; Sarter and Bruno, 1997). However, it is unclear how exactly the numerous and very heterogeneous effects that acetylcholine has on the different classes of cortical neurons support these cognitive processes. The present data suggest as unifying mechanism the short- and long-term facilitation of oscillations and response synchronization in the gamma-frequency range. Cognitive functions that depend on cholinergic control comprise the ability to focus attention and to retain stimulus features in both short- and long-term memory (Everitt and Robbins, 1997; Sarter and Bruno, 1997). Interestingly, all of these functions have been shown to be associated with enhanced synchronization of responses in the gamma-frequency range (Tiitinen et al., 1993; Tallon-Baudry et al., 1998; Miltner et al., 1999; Müller et al., 2000; Fries et al., 2001; Gruber et al., 2001, 2002), suggesting that these functions depend on response synchronization. Thus, the present data suggest, as one unifying mechanism for the heterogeneous effects of cholinergic hypofunction, a disturbance of both short- and long-term mechanisms that are required for the manifestation and stabilization of gamma oscillations and response synchronization.
Our results predict that pathologies associated with cholinergic hypofunction should be associated with a shift in EEG power spectra toward lower frequencies, with reduced and less precise response synchronization and with impairments of use-dependent plasticity. This should motivate a search for a correlation between EEG abnormalities indicative of impaired gamma oscillations and reduced response synchronization on the one hand and cognitive disturbances such as occur in Alzheimer's disease and are suspected to be associated with cholinergic hypofunction on the other hand.
Footnotes
This work was supported by fellowships from the Alexander-von-Humboldt and Klaus-Tschira Foundations and European Union Grant BMH4-CT 98-5137. We thank Johanna Klon-Lipok for excellent technical assistance, Christiane Kiefert for animal care, and Frank Borchard and Sascha Gotthardt for help with some of the experiments.
Correspondence should be addressed to Matthias H. J. Munk, Abteilung Neurophysiologie, Max-Planck-Institut für Hirnforschung, Deutschordenstraβe 46, D-60528 Frankfurt/Main, Germany. E-mail: munk@mpih-frankfurt.mpg.de.
Copyright © 2004 Society for Neuroscience 0270-6474/04/2410369-10$15.00/0
References
- Ahissar M, Hochstein S (1993) Attentional control of early perceptual learning. Proc Natl Acad Sci USA 90: 5718-5722. [DOI] [PMC free article] [PubMed] [Google Scholar]
- Ahissar M, Hochstein S (1997) Task difficulty and the specificity of perceptual learning. Nature 387: 401-406. [DOI] [PubMed] [Google Scholar]
- Azouz R, Gray CM (2000) Dynamic spike threshold reveals a mechanism for synaptic coincidence detection in cortical neurons in vivo. Proc Natl Acad Sci USA 97: 8110-8115. [DOI] [PMC free article] [PubMed] [Google Scholar]
- Bröcher S, Artola A, Singer W (1992) Agonists of cholinergic and noradrenergic receptors facilitate synergistically the induction of long-term potentiation in slices of rat visual cortex. Brain Res 573: 27-36. [DOI] [PubMed] [Google Scholar]
- Buhl EH, Tamas G, Fisahn A (1998) Cholinergic activation and tonic excitation induce persistent gamma oscillations in mouse somatosensory cortex in vitro. J Physiol (Lond) 513: 117-126. [DOI] [PMC free article] [PubMed] [Google Scholar]
- Cape EG, Manns ID, Alonso A, Beaudet A, Jones BE (2000) Neurotensin-induced bursting of cholinergic basal forebrain neurons promotes gamma and theta cortical activity together with waking and paradoxical sleep. J Neurosci 20: 8452-8461. [DOI] [PMC free article] [PubMed] [Google Scholar]
- Dringenberg HC, Vanderwolf CH (1998) Involvement of direct and indirect pathways in electrocorticographic activation. Neurosci Biobehav Rev 22: 243-257. [DOI] [PubMed] [Google Scholar]
- Everitt BJ, Robbins TW (1997) Central cholinergic systems and cognition. Annu Rev Psychol 48: 649-684. [DOI] [PubMed] [Google Scholar]
- Fisahn A, Pike FG, Buhl EH, Paulsen O (1998) Cholinergic induction of network oscillations at 40 Hz in the hippocampus in vitro. Nature 394: 186-189. [DOI] [PubMed] [Google Scholar]
- Frank MG, Issa NP, Stryker MP (2001) Sleep enhances plasticity in the developing visual cortex. Neuron 30: 275-287. [DOI] [PubMed] [Google Scholar]
- Fries P, Reynolds JH, Rorie AE, Desimone R (2001) Modulation of oscillatory neuronal synchronization by selective visual attention. Science 291: 1560-1563. [DOI] [PubMed] [Google Scholar]
- Gray CM, König P, Engel AK, Singer W (1989) Oscillatory responses in cat visual cortex exhibit inter-columnar synchronization which reflects global stimulus properties. Nature 338: 334-337. [DOI] [PubMed] [Google Scholar]
- Gruber T, Keil A, Muller MM (2001) Modulation of induced gamma band responses and phase synchrony in a paired associate learning task in the human EEG. Neurosci Lett 316: 29-32. [DOI] [PubMed] [Google Scholar]
- Gruber T, Muller MM, Keil A (2002) Modulation of induced gamma band responses in a perceptual learning task in the human EEG. J Cognit Neurosci 14: 732-744. [DOI] [PubMed] [Google Scholar]
- Herculano-Houzel S, Munk MH, Neuenschwander S, Singer W (1999) Precisely synchronized oscillatory firing patterns require electroencephalographic activation. J Neurosci 19: 3992-4010. [DOI] [PMC free article] [PubMed] [Google Scholar]
- Karni A, Sagi D (1993) The time course of learning a visual skill. Nature 365: 250-252. [DOI] [PubMed] [Google Scholar]
- Khateb A, Fort P, Williams S, Serafin M, Jones BE, Mühlethaler M (1997) Modulation of cholinergic nucleus basalis neurons by acetylcholine and N-methyl-d-aspartate. Neuroscience 81: 47-55. [DOI] [PubMed] [Google Scholar]
- König P (1994) A method for the quantification of synchrony and oscillatory properties of neuronal activity. J Neurosci Methods 54: 31-37. [DOI] [PubMed] [Google Scholar]
- Kopell N, Ermentrout GB, Whittington MA, Traub RD (2000) Gamma rhythms and beta rhythms have different synchronization properties. Proc Natl Acad Sci USA 97: 1867-1872. [DOI] [PMC free article] [PubMed] [Google Scholar]
- Lisman J (1989) A mechanism for the Hebb and the anti-Hebb processes underlying learning and memory. Proc Natl Acad Sci USA 86: 9574-9578. [DOI] [PMC free article] [PubMed] [Google Scholar]
- Markram H, Lübke J, Frotscher M, Sakmann B (1997) Regulation of synaptic efficacy by coincidence of postsynaptic APs and EPSPs. Science 275: 213-215. [DOI] [PubMed] [Google Scholar]
- Miltner WH, Braun C, Arnold M, Witte H, Taub E (1999) Coherence of gamma-band EEG activity as a basis for associative learning. Nature 397: 434-436. [DOI] [PubMed] [Google Scholar]
- Mioche L, Singer W (1989) Chronic recordings from single sites of kitten striate cortex during experience-dependent modifications of receptive-field properties. J Neurophysiol 62: 185-197. [DOI] [PubMed] [Google Scholar]
- Mitzdorf U, Singer W (1978) Prominent excitatory pathways in the cat visual cortex (A 17 and A 18): a current source density analysis of electrically evoked potentials. Exp Brain Res 33: 371-394. [DOI] [PubMed] [Google Scholar]
- Moruzzi G, Magoun HW (1949) Brain stem reticular formation and activation of the EEG. Electroencephalogr Clin Neurophysiol 1: 455-473. [PubMed] [Google Scholar]
- Müller MM, Gruber T, Keil A (2000) Modulation of induced gamma band activity in the human EEG by attention and visual information processing. Int J Psychophysiol 38: 283-299. [DOI] [PubMed] [Google Scholar]
- Munk MH, Roelfsema PR, König P, Engel AK, Singer W (1996) Role of reticular activation in the modulation of intracortical synchronization. Science 272: 271-274. [DOI] [PubMed] [Google Scholar]
- Nowak LG, Sanchez-Vives MV, McCormick DA (1997) Influence of low and high frequency inputs on spike timing in visual cortical neurons. Cereb Cortex 7: 487-501. [DOI] [PubMed] [Google Scholar]
- Pare D, Smith Y, Parent A, Steriade M (1988) Projections of brainstem core cholinergic and non-cholinergic neurons of cat to intralaminar and reticular thalamic nuclei. Neuroscience 25: 69-86. [DOI] [PubMed] [Google Scholar]
- Perez-Orive J, Mazor O, Turner GC, Cassenaer S, Wilson RI, Laurent G (2002) Oscillations and sparsening of odor representations in the mushroom body. Science 297: 359-365. [DOI] [PubMed] [Google Scholar]
- Rasmusson DD (2000) The role of acetylcholine in cortical synaptic plasticity. Behav Brain Res 115: 205-218. [DOI] [PubMed] [Google Scholar]
- Rauschecker JP, Hahn S (1987) Ketamine-xylazine anaesthesia blocks consolidation of ocular dominance changes in kitten visual cortex. Nature 326: 183-185. [DOI] [PubMed] [Google Scholar]
- Rodriguez E, George N, Lachaux JP, Martinerie J, Renault B, Varela FJ (1999) Perception's shadow: long-distance synchronization of human brain activity. Nature 397: 430-433. [DOI] [PubMed] [Google Scholar]
- Roelfsema PR, Engel AK, König P, Singer W (1997) Visuomotor integration is associated with zero time-lag synchronization among cortical areas. Nature 385: 157-161. [DOI] [PubMed] [Google Scholar]
- Sarter M, Bruno JP (1997) Cognitive functions of cortical acetylcholine: toward a unifying hypothesis. Brain Res Brain Res Rev 23: 28-46. [DOI] [PubMed] [Google Scholar]
- Schoups A, Vogels R, Qian N, Orban G (2001) Practising orientation identification improves orientation coding in V1 neurons. Nature 412: 549-553. [DOI] [PubMed] [Google Scholar]
- Semba K, Fibiger HC (1989) Organization of central cholinergic systems. Prog Brain Res 79: 37-63. [DOI] [PubMed] [Google Scholar]
- Shulz DE, Sosnik R, Ego V, Haidarliu S, Ahissar E (2000) A neuronal analogue of state-dependent learning. Nature 403: 549-553. [DOI] [PubMed] [Google Scholar]
- Singer W (1999) Neuronal synchrony: a versatile code for the definition of relations? Neuron 24: 49-65, 111-125. [DOI] [PubMed] [Google Scholar]
- Smith Y, Pare D, Deschenes M, Parent A, Steriade M (1988) Cholinergic and non-cholinergic projections from the upper brainstem core to the visual thalamus in the cat. Exp Brain Res 70: 166-180. [DOI] [PubMed] [Google Scholar]
- Steriade M, Pare D, Parent A, Smith Y (1988) Projections of cholinergic and non-cholinergic neurons of the brainstem core to relay and associational thalamic nuclei in the cat and macaque monkey. Neuroscience 25: 47-67. [DOI] [PubMed] [Google Scholar]
- Steriade M, Amzica F, Nunez A (1993) Cholinergic and noradrenergic modulation of the slow (∼0.3 Hz) oscillation in neocortical cells. J Neurophysiol 70: 1385-1400. [DOI] [PubMed] [Google Scholar]
- Steriade M, Amzica F, Contreras D (1996) Synchronization of fast (30-40 Hz) spontaneous cortical rhythms during brain activation. J Neurosci 16: 392-417. [DOI] [PMC free article] [PubMed] [Google Scholar]
- Steriade M, Jones BE, McCormick DA (1997) Thalamus. Organization and function, Vol 1. Oxford: Elsevier. [Google Scholar]
- Tallon-Baudry C, Bertrand O, Peronnet F, Pernier J (1998) Induced gamma-band activity during the delay of a visual short-term memory task in humans. J Neurosci 18: 4244-4254. [DOI] [PMC free article] [PubMed] [Google Scholar]
- Tiitinen H, Sinkkonen J, Reinikainen K, Alho K, Lavikainen J, Naatanen R (1993) Selective attention enhances the auditory 40-Hz transient response in humans. Nature 364: 59-60. [DOI] [PubMed] [Google Scholar]
- Traub RD, Jefferys JG, Whittington MA (1997) Simulation of gamma rhythms in networks of interneurons and pyramidal cells. J Comput Neurosci 4: 141-150. [DOI] [PubMed] [Google Scholar]
- Wainer BH, Mesulam MM (1990) Ascending cholinergic pathways in the rat brain. In: Brain cholinergic systems (Steriade M, Biesold D, eds), pp 65-119. Oxford: Oxford UP.
- Weinberger NM, Bakin JS (1998) Learning-induced physiological memory in adult primary auditory cortex: receptive fields plasticity, model, and mechanisms. Audiol Neurootol 3: 145-167. [DOI] [PubMed] [Google Scholar]
- Wespatat V, Tennigkeit F, Singer W (2004) Phase sensitivity of synaptic modifications in oscillating cells of rat visual cortex. J Neurosci 24: 9067-9075. [DOI] [PMC free article] [PubMed] [Google Scholar]
- Whittington MA, Traub RD, Jefferys JG (1995) Synchronized oscillations in interneuron networks driven by metabotropic glutamate receptor activation. Nature 373: 612-615. [DOI] [PubMed] [Google Scholar]