

ABSTRACT
Background
While the gut microbiota is relatively stable through adulthood, its composition is influenced by various host and environmental factors, including changes in health, gastrointestinal processes (e.g., transit time, gastric acidity), medication use, and diet. The association of habitual diet, in the form of a posteriori–derived dietary patterns, and microbiota composition has not been adequately studied, particularly in older men.
Objective
The objective was to investigate the association of dietary patterns with the composition and diversity of the gut bacterial microbiota in community-dwelling, older men.
Methods
This cross-sectional study included 517 men who were participants in the Osteoporotic Fractures in Men (MrOS) Study (≥65 y of age at baseline in 2000–2002) and who provided a stool sample and completed an FFQ at MrOS Visit 4 in 2014–2016. Dietary patterns were derived by factor analysis. 16S ribosomal RNA target gene sequencing was performed and taxonomy assignments were derived using the Greengenes database. Linear regression and permutational multivariate analysis of variance (PERMANOVA) considered variations in alpha and beta diversity by dietary pattern, and a model that implements a 0-inflated Gaussian distribution of mean group abundance for each taxa (metagenomeSeq) assessed taxonomic variations by dietary pattern.
Results
In multivariable-adjusted models, greater adherence to the Western pattern was positively associated with families Mogibacteriaceae and Veillonellaceae and genera Alistipes, Anaerotruncus, CC-115, Collinsella, Coprobacillus, Desulfovibrio, Dorea, Eubacterium, and Ruminococcus, while greater adherence to the prudent pattern was positively associated with order Streptophyta, family Victivallaceae, and genera Cetobacterium, Clostridium, Faecalibacterium, Lachnospira, Paraprevotella, and Veillonella. The relative abundance of the dominant gut bacterial phyla, Bacteroidetes and Firmicutes, did not differ between participants with greater adherence to the Western pattern, compared with those with greater adherence to the prudent pattern. Dietary patterns were not associated with measures of alpha diversity, but beta diversity measures were significantly associated with both Western and prudent patterns.
Conclusions
We observed significant associations between dietary patterns and measures of gut microbial composition in this sample of community-dwelling, older men.
Keywords: 16S rRNA gene sequencing, alpha diversity, beta diversity, dietary patterns, food-frequency questionnaire, Greengenes database, microbiota, older adults, Osteoporotic Fractures in Men Study
Introduction
The human microbiome is the collection of micro-organisms (i.e., microbiota, including bacteria, viruses, fungi, and parasites) and their genomes and gene products that inhabit the human body. The number of microbes in a healthy human adult is substantial, equaling or surpassing the number of human cells (1). While it has long been known that these microbes are not merely inhabitants of their human hosts, but play an active role in certain body processes, such as metabolism and immunity, the microbiota appears to have an even broader impact on health than was previously realized. In particular, the gut microbiome may influence susceptibility to certain infectious diseases (2), as well as contribute to disorders such as obesity and diabetes (3), rheumatoid arthritis (4), chronic illnesses of the gastrointestinal system (such as Crohn's disease and irritable bowel syndrome) (5), and possibly certain cancers (6). In older adults, there is evidence that the gut microbiome may be related to bone density, structure, and loss (7, 8); body composition, sarcopenia, and frailty (9, 10); cognition (11); and aging, mortality, and longevity (12–14).
While the gut microbiota is relatively stable through adulthood, the composition of the gut microbiota is influenced by various host and environmental factors, including changes in health, gastrointestinal processes (e.g., intestinal transit time), medication use, and diet, as the microbiota plays a functional role in the digestive tract (12, 15–17). Long-term, habitual diet, as assessed by an FFQ, has been associated with the composition of the gut microbiota. Claesson and colleagues (12) used a 147-item FFQ to assess diets in 178 older men and women in Ireland (including those residing both in the community and in long-term residential care facilities), and found that diet diversity was positively associated with diversity of the gut microbiota, a characteristic associated with better health. In a cross-sectional study of more than 10,000 citizen scientists, the number of unique plant species consumed was positively associated with gut microbial diversity (18). Wu and colleagues (19) reported that long-term dietary intake reported by FFQ, but not by a short-term recall questionnaire, was associated with enterotype compositions in healthy adults. For example, the Bacteroides enterotype was highly associated with the intake of animal protein, a variety of amino acids, and saturated fats, suggesting that meat consumption, as in a Western-type diet, characterized this enterotype. Subjects with intakes more characteristic of a vegetarian-type diet showed enrichment in the Prevotella enterotype, as was the case for carbohydrate-based diets. Greater adherence to a Mediterranean-type diet (as assessed with 7-day food records) was associated with beneficial microbiota-related metabolomic profiles in 153 young and middle-aged adults with self-selected habitual diets (20).
While individual foods and nutrients have been studied extensively in relation to chronic disease risk, the relationship between overall diet and disease risk may be more informative because foods typically are eaten in combination, not in isolation (21). Empirically deriving dietary patterns a posteriori has facilitated investigations into the role an overall diet may play in the etiology of chronic diseases (22, 23). Factor analysis, a data-driven exploratory method, assesses dietary patterns in specified groups without preconceived judgments about which foods commonly are consumed together.
Further study of the effect of a habitual diet on the microbiome, including the association of dietary patterns with microbiome composition, is needed across the lifespan. This is especially true for older adults, who experience physiological changes within the gastrointestinal tract (e.g., changes in transit time, gastric acidity, and immune system function) that may influence the gut microbiota. The aim of this study was to investigate the association of dietary patterns with the composition and diversity of the gut bacterial microbiota in community-dwelling older men, including investigating potential differences by race, geographic location, and BMI.
Methods
Participants
Participants were community-dwelling men enrolled in the Osteoporotic Fractures in Men (MrOS) Study (http://mrosdata.sfcc-cpmc.net), the objective of which is to identify risk factors for osteoporosis and fractures in older men. Detailed descriptions of the study design and recruitment for MrOS have been published previously (24, 25). Briefly, MrOS participants were recruited at 6 US clinical centers: Birmingham, AL; Minneapolis, MN; Monongahela Valley, near Pittsburgh, PA; Palo Alto, CA; Portland, OR; and San Diego, CA. Eligibility criteria included men age 65 years or older; the ability to walk without assistance from another person or aid; and no history of bilateral hip replacements. A total of 5994 men were enrolled, and baseline examinations were completed between March 2000 and April 2002. Institutional Review Boards at each participating center approved the study, and all subjects provided written informed consent.
All active MrOS participants were invited to study Visit 4, which took place May 2014 to May 2016. The 1328 participants attending Visit 4 after the initiation of the MrOS microbiota ancillary study also were invited to participate in the microbiota study. Beginning in March 2015, and accounting for 346 men who declined participation, 982 participants from all 6 MrOS clinical centers provided a stool sample for the microbiota study, of which a random sample of 599 participants had microbiota analyses.
Microbiota analysis
Details of the stool sample collection have been described previously (26). Briefly, stool specimens for microbiota analyses were collected by participants at home, following Visit 4, using the OMNIgene•GUT stool/feces collection kit, designed for the self-collection of a consistent volume of stool and the preservation of microbial DNA (OMR-200, DNA Genotek). Participants mailed the stool samples to the MrOS Administrative Center at Oregon Health and Science University (Portland, OR) for initial processing. Upon arrival, samples were immediately checked for adequacy and to ensure that the date and time of collection had been recorded, and then were stored at −80°C. A random subsample of specimens (n = 599) was forwarded to the Alkek Center for Metagenomics and Microbiome Research at Baylor College of Medicine (Houston, TX) for characterization of the gut microbiota (taxonomic profiles) by 16S ribosomal RNA (rRNA) gene sequencing. A total of 589 of these samples (98.3%) were collected within 30 days of Visit 4 (mean ± SD days between stool sample collection and Visit 4 was 3.3 ± 7.8).
Genomic bacterial DNA was extracted from fecal samples using the PowerSoil DNA Isolation Kit (MO BIO Laboratories, Inc.). Extracted DNA was subjected to 16S (v4) rDNA amplification using primers 515F and 806R (26). The 16S rDNA hypervariable region was amplified by polymerase chain reaction and sequenced on the MiSeq platform using the 2 × 250 base pair paired-end protocol (Illumina, Inc.). The read pairs were demultiplexed based on their unique molecular barcodes, and overlapping reads were merged using USEARCH v9.0.2132 (i86linux64).
The 599 samples for this analysis were processed and profiled using the bioBakery 16S workflow with the USEARCH method at 97% clustering and a minimum cluster size of 2 to create operational taxonomic units (OTUs). Reads were truncated to a maximum length of 200 bases and filtered for quality control using a maxEE score of 1, resulting in a total of 27,791,779 reads. Filtered reads were used to generate the OTUs with the UPARSE algorithm. All reads, including those that did not pass filtering, were used when assigning reads to OTUs with USEARCH's global alignment (27). The Greengenes 16S rRNA Gene Database, version 13.8 (28), was used for taxonomy prediction down to the lowest level possible, so that the unfiltered data included 1913 OTUs, of which 163 were classified down to the genus level. The dataset then was filtered to include only OTUs with a minimum of 3 reads in at least 3 samples. The filtered OTU data consisted of 1434 OTUs, classified to 13 phyla, 24 classes, 37 orders, 61 families, and 114 genera. Finally, the OTU data were resampled to have minimum sample depths of 12,783 reads and then filtered to include OTUs with a minimum of 3 reads in at least 3 samples. The rarefied filtered data consisted of 1196 OTUs, of which 95 were classified down to the genus level.
Dietary assessment
The Block 98.2 MrOS FFQ (NutritionQuest), the same brief FFQ that was administered at baseline in MrOS (29, 30), was completed by participants at home within days of Visit 4, within a mean ± SD of 4.6 ± 11.7 days of the stool sample collection. The questionnaire inquired about the intake of 69 individual food items over the previous year and included 13 additional questions about food preparation and low-fat foods that were used to refine nutrient calculations. The FFQ included 9 categories of frequency responses for foods and beverages and 4 categories of portion size responses. A graphic representation of standard portion sizes was included with the questionnaire. In addition, a 1-page supplement to the FFQ was included that inquired about the frequency of consumption and portion sizes (using the same categories) for 9 of the most commonly consumed probiotic foods (e.g., yogurt and probiotic drinks).
Completed FFQs were returned by mail to the home clinical center. FFQs were forwarded in batches to the MrOS Administrative Center, and then to NutritionQuest for analysis using the Block Brief 2000 FFQ nutrient database. The Block group determined the nutrient composition of each reported FFQ using the USDA Database for Standard Reference for Version 12 and the 1994–1996 Continuing Survey of Food Intakes by Individuals database.
Dietary pattern derivation
The derivation of dietary patterns in MrOS participants has been described previously (31). Briefly, using dietary data from the FFQ administered at Visit 4, food groups were constructed using individual food variables, based on nutrient similarities, culinary use, and previous studies. Using factor analysis, a 2-factor solution was retained based on the eigenvalue (scree plot). Final factor loadings were calculated through varimax rotation of the 2 factors on the full sample. All food groups were used in calculating the final factor scores, regardless of loading. We named patterns based on the factor loadings that contributed most highly to each pattern. Factor 1 loaded heavily on processed meats, refined grains, potatoes, eggs, sweets, and salty snacks, and was designated the “Western” pattern. Factor 2 had high factor loadings for fruits, vegetables, nuts, fish, and chicken and turkey without skin and was designated the “prudent” pattern. Adherence to the dietary patterns was divided into quartiles, with Quartile 1 representing the lowest adherence and Quartile 4 representing the highest adherence to the pattern.
Other measurements
Demographic characteristics, along with current smoking status and alcohol use, were obtained through self-administered questionnaires. Current physical activity was assessed with the Physical Activity Scale for the Elderly (PASE) questionnaire (32). Perceived health status was self-reported as “excellent,” “good,” “fair,” “poor,” or “very poor” in response to the question “compared to other people your own age, how would you rate your overall health?” A history of multimorbidity was defined as having at least 2 of the following self-reported health conditions: myocardial infarction, heart failure, stroke, diabetes, chronic obstructive pulmonary disease, cancer, hip fracture, osteoarthritis, rheumatoid arthritis, depression, cognitive impairment, Parkinson's disease, visual impairment, and fall history. Height was measured with Harpenden stadiometers and weight was measured with balance beam or digital scales. BMI was calculated in kg/m2. Antibiotics reported by participants during the visit were entered into an electronic medications inventory (San Francisco Coordinating Center, San Francisco, CA). Each medication was matched to its ingredient(s) based on the Iowa Drug Information Service Drug Vocabulary (College of Pharmacy, University of Iowa, Iowa City, IA) (33).
Statistical analysis
The analytic sample for the present analysis included those with a stool sample, 16S rRNA gene sequencing, and a completed and usable FFQ at Visit 4. A total of 82 participants of the 599 for whom stool samples were collected and 16S rRNA sequencing was completed were excluded for the following reasons: 36 reported antibiotic use within the previous 30 days, 21 reported any consumption of probiotics on the FFQ supplemental page (because of the potential influence of probiotics on the gut microbiota, and the inability to adjust for this in multivariable analyses due to the small number), 5 reported antibiotic and probiotic use, 14 had missing dietary data, and 6 had implausible energy intakes (<400 kcal/d). After exclusions, the final analytic sample was 517 participants (Figure 1).
FIGURE 1.
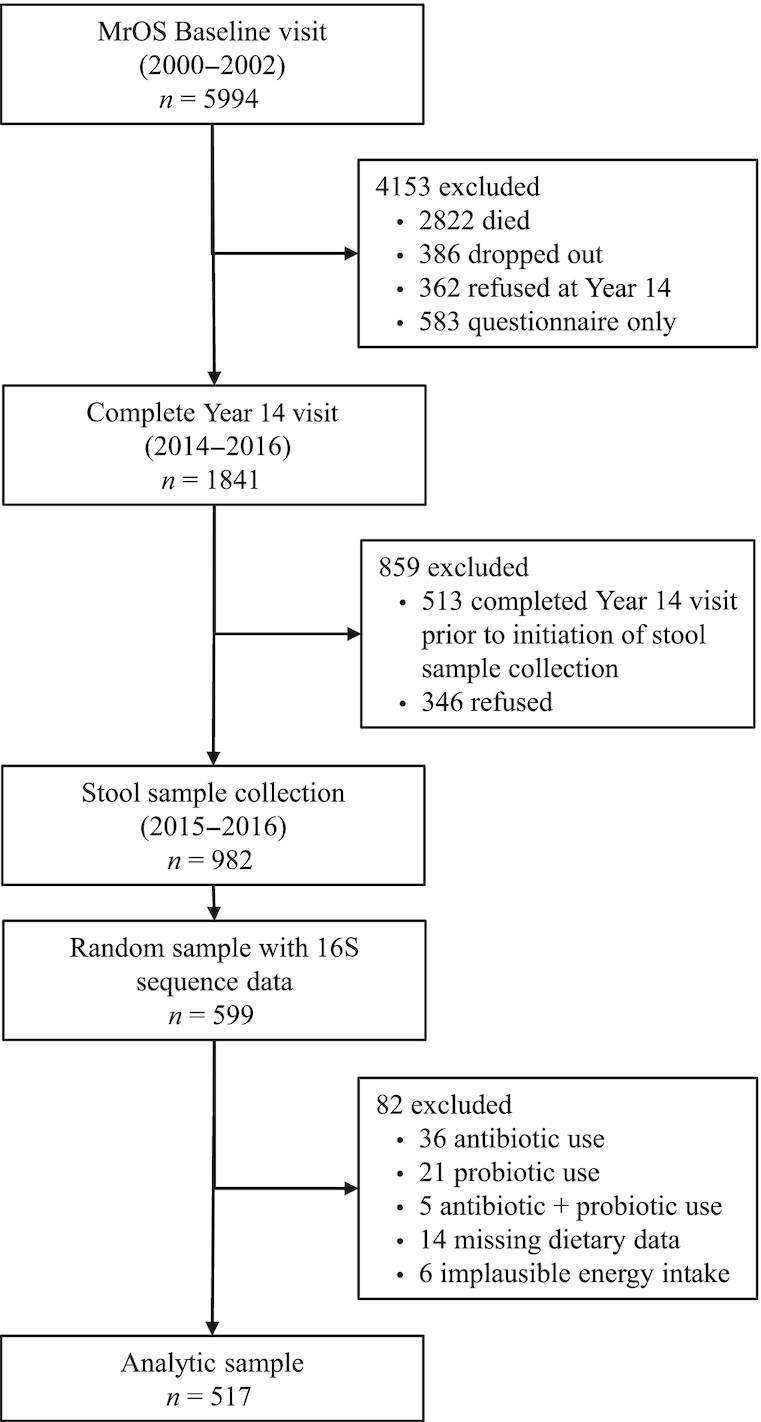
Analytic sample flow diagram. MrOS, Osteoporotic Fractures in Men Study.
In this analysis, the primary outcome variable of interest was the composition of the gut microbiota, while secondary outcomes were alpha and beta diversity of the gut microbiota. Diversity measures for the gut microbial community were estimated based on identified OTUs in the unfiltered data. Alpha (within-person) diversity was assessed by both the Shannon index and inverse Simpson index. The Shannon index is a measure of species diversity, which accounts for both abundance and evenness of the species present, but is sample-size dependent, whereas the inverse Simpson index measures the relative abundance of species, giving more weight to common or dominant species. The association between bacterial alpha diversity and subject phenotypes was assessed with linear regression models (with microbial measures as the dependent variables), adjusted for age, race, clinical center, energy intake, BMI, and library size. Unweighted and weighted UniFrac were used as distance measures on the rarefied and log-transformed data (34), and the resulting distance matrix was reduced using a principal coordinates analysis, following standard conventions in microbiome analyses (35). Unweighted and weighted UniFrac distances characterize phylogenetic differences between organisms using either OTU presence/absence or OTU count information, respectively. Permutational multivariate analysis of variance (PERMANOVA) provided statistical testing for associations of beta diversity and diet phenotypes. It applies dimensionality reduction and iteratively tests associations between blocks of related features (36). To examine the associations between dietary patterns and specific taxa, we first aggregated OTUs by genus level. The taxa were included as outcomes if they had a prevalence greater than 10% and a mean relative abundance of 0.01%. To determine the relationship between the dietary patterns and relative abundance, we used a model that implements a 0-inflated Gaussian distribution of mean group abundance for each taxa (metagenomeSeq) (37). This approach addresses the diverse distributional features across OTUs, including the larger number of 0s for some entities. Multivariable models were additionally adjusted for age, race, clinical center, energy intake, BMI, and library size. False discovery due to multiple comparisons was minimized by using the Benjamini-Hochberg false discovery method. In particular, the correction was done for the metagenomeSeq models, since there was 1 model for each genus-agglomerated OTU. Analyses were done using R version 3.4.4 and the phyloseq (38), vegan (39), and metagenomeSeq (37) packages.
Results
There were 517 men (87.8% non-Hispanic White) in the analytic sample, with a mean ± SD age of 84.3 ± 4.1 years (Tables 1 and 2). A majority of men (59.0%) were at least college graduates, and approximately 42% came from 2 clinical centers: Portland and San Diego. Of the 517 men, 55.9% had a history of smoking, although less than 2% were current smokers. Nearly half of the participants (48.6%) reported regular alcohol intake (defined as ≥1 drink/week), but only 5% reported high alcohol intake (≥2 drinks/day). The mean ± SD BMI was 26.9 ± 3.7 kg/m2. The mean ± SD Shannon index was 3.39 ± 0.61, and the mean ± SD inverse Simpson index was 15.9 ± 9.8.
TABLE 1.
Characteristics of participants by quartile of adherence to the Western dietary pattern1
| Quartile of factor score: Western dietary pattern | ||||||
|---|---|---|---|---|---|---|
| Characteristic | Overall (n = 517) | 1, lowest (n = 130) | 2 (n = 129) | 3 (n = 129) | 4, highest (n = 129) | P value2 |
| Age, y | 84.3 ± 4.1 | 83.9 ± 3.9 | 84.7 ± 4.3 | 84.2 ± 4.1 | 84.3 ± 4.1 | 0.47 |
| Race | 0.15 | |||||
| White | 454 (87.8) | 110 (84.6) | 110 (85.3) | 114 (88.4) | 120 (93.0) | |
| Other | 63 (12.2) | 20 (15.4) | 19 (14.7) | 15 (11.6) | 9 (7.0) | |
| Education | 0.17 | |||||
| <High school | 17 (3.3) | 2 (1.5) | 5 (3.9) | 4 (3.1) | 6 (4.6) | |
| High school graduate | 85 (16.4) | 15 (11.5) | 20 (15.5) | 22 (17.1) | 28 (21.7) | |
| Some college | 110 (21.3) | 26 (20.0) | 27 (20.9) | 26 (20.2) | 31 (24.0) | |
| College graduate | 78 (15.1) | 16 (12.3) | 17 (13.2) | 28 (21.7) | 17 (13.2) | |
| Some graduate school | 65 (12.6) | 22 (16.9) | 19 (14.7) | 10 (7.7) | 14 (10.8) | |
| Graduate degree | 162 (31.3) | 49 (37.7) | 41 (31.8) | 39 (30.2) | 33 (25.6) | |
| Clinical center | 0.007 | |||||
| Birmingham | 67 (13.0) | 14 (10.8) | 12 (9.3) | 21 (16.3) | 20 (15.5) | |
| Minneapolis | 80 (15.5) | 18 (13.8) | 24 (18.6) | 18 (13.9) | 20 (15.5) | |
| Palo Alto | 69 (13.4) | 23 (17.7) | 21 (16.3) | 18 (13.9) | 7 (5.4) | |
| Pittsburgh | 82 (15.9) | 14 (10.7) | 15 (11.6) | 17 (13.2) | 36 (27.9) | |
| Portland | 113 (21.9) | 32 (24.6) | 29 (22.5) | 29 (22.5) | 23 (17.8) | |
| San Diego | 106 (20.5) | 29 (22.3) | 28 (21.7) | 26 (20.2) | 23 (17.8) | |
| Smoking | 0.41 | |||||
| Ever | 289 (55.9) | 71 (54.6) | 77 (59.7) | 65 (50.4) | 76 (58.9) | |
| Never | 228 (44.1) | 59 (45.4) | 52 (40.3) | 64 (49.6) | 53 (41.1) | |
| Alcohol, current | 0.46 | |||||
| Yes | 251 (48.6) | 65 (50.0) | 69 (53.5) | 60 (46.5) | 57 (44.2) | |
| No | 266 (51.4) | 65 (50.0) | 60 (46.5) | 69 (53.5) | 72 (55.9) | |
| PASE score | 124 ± 68 | 122 ± 72 | 126 ± 66 | 122 ± 62 | 129 ± 71 | 0.82 |
| BMI, kg/m2 | 26.9 ± 3.7 | 26.0 ± 3.4 | 26.5 ± 3.6 | 27.4 ± 4.0 | 27.9 ± 3.6 | 0.0001 |
| Self-rated health | 0.10 | |||||
| Excellent/good | 464 (89.7) | 120 (92.3) | 115 (89.2) | 120 (93.0) | 109 (84.5) | |
| Fair/poor/very poor | 53 (10.3) | 10 (7.7) | 14 (10.8) | 9 (7.0) | 20 (15.5) | |
| History of multimorbidity3 | 0.74 | |||||
| Yes | 322 (62.3) | 77 (59.2) | 80 (62.0) | 80 (62.0) | 85 (65.9) | |
| No | 195 (37.7) | 53 (40.8) | 49 (38.0) | 49 (38.0) | 44 (34.1) | |
| Microbial diversity | ||||||
| Shannon | 3.39 ± 0.61 | 3.42 ± 0.66 | 3.43 ± 0.62 | 3.38 ± 0.60 | 3.32 ± 0.57 | 0.48 |
| Inverse Simpson | 15.9 ± 9.8 | 16.9 ± 10.2 | 16.6 ± 10.8 | 15.9 ± 9.8 | 14.3 ± 8.3 | 0.14 |
1Values are shown as means ± SD or n (%). PASE, Physical Activity Scale for the Elderly.
2Derived from either an ANOVA (continuous variables) or Chi square test (categorical variables).
Defined as having ≥2 of the following chronic conditions: myocardial infarction, heart failure, stroke, diabetes, chronic obstructive pulmonary disease, cancer, hip fracture, osteoarthritis, rheumatoid arthritis, depression, cognitive impairment, Parkinson's disease, visual impairment, and fall history.
TABLE 2.
Characteristics of participants by quartile of adherence to the prudent dietary pattern1
| Quartile of factor score: prudent dietary pattern | ||||||
|---|---|---|---|---|---|---|
| Characteristic | Overall, (n = 517) | 1, lowest (n = 130) | 2 (n = 129) | 3 (n = 129) | 4, highest (n = 129) | P value2 |
| Age, y | 84.3 ± 4.1 | 84.1 ± 4.2 | 84.4 ± 3.9 | 84.4 ± 3.9 | 84.2 ± 4.3 | 0.91 |
| Race | 0.26 | |||||
| White | 454 (87.8) | 117 (90.0) | 116 (89.9) | 114 (88.4) | 107 (82.9) | |
| Other | 63 (12.2) | 13 (10.0) | 13 (10.1) | 15 (11.6) | 22 (17.1) | |
| Education | 0.64 | |||||
| <High school | 17 (3.3) | 6 (4.6) | 2 (1.6) | 5 (3.9) | 4 (3.1) | |
| High school graduate | 85 (16.4) | 28 (21.5) | 24 (18.6) | 15 (11.6) | 18 (13.9) | |
| Some college | 110 (21.3) | 28 (21.5) | 29 (22.5) | 26 (20.2) | 27 (20.9) | |
| College graduate | 78 (15.1) | 18 (13.8) | 19 (14.7) | 22 (17.1) | 19 (15.3) | |
| Some graduate school | 65 (12.6) | 9 (6.9) | 19 (14.7) | 19 (14.7) | 18 (3.9) | |
| Graduate degree | 162 (31.3) | 41 (31.5) | 36 (27.9) | 42 (32.6) | 43 (33.3) | |
| Clinical center | 0.10 | |||||
| Birmingham | 69 (13.2) | 16 (12.3) | 21 (16.3) | 13 (10.1) | 17 (13.2) | |
| Minneapolis | 80 (15.3) | 29 (22.3) | 17 (13.2) | 19 (14.7) | 15 (11.6) | |
| Palo Alto | 69 (13.2) | 16 (12.3) | 13 (10.1) | 14 (10.8) | 26 (20.2) | |
| Pittsburgh | 84 (16.1) | 25 (19.2) | 17 (13.2) | 21 (16.3) | 19 (14.7) | |
| Portland | 115 (22.0) | 23 (17.7) | 35 (27.1) | 33 (25.6) | 22 (17.1) | |
| San Diego | 106 (20.3) | 21 (16.2) | 26 (20.2) | 29 (22.5) | 30 (23.3) | |
| Smoking | 0.29 | |||||
| Ever | 291 (55.6) | 76 (58.5) | 79 (61.2) | 65 (50.4) | 69 (53.5) | |
| Never | 232 (44.4) | 54 (41.5) | 50 (38.8) | 64 (49.6) | 61 (46.5) | |
| Alcohol, current | 0.23 | |||||
| Yes | 253 (48.4) | 58 (44.6) | 68 (52.7) | 56 (43.4) | 69 (53.5) | |
| No | 270 (51.6) | 72 (55.4) | 61 (47.3) | 73 (56.6) | 60 (46.5) | |
| PASE score | 124 ± 68 | 120 ± 64 | 125 ± 69 | 126 ± 69 | 127 ± 70 | 0.87 |
| BMI, kg/m2 | 26.9 ± 3.7 | 27.3 ± 3.5 | 27.3 ± 3.6 | 27.1 ± 4.0 | 26.0 ± 3.7 | 0.02 |
| Self-rated health | 0.31 | |||||
| Excellent/good | 467 (89.3) | 114 (87.7) | 121 (93.8) | 116 (89.9) | 113 (87.6) | |
| Fair/poor/very poor | 56 (10.7) | 16 (12.3) | 8 (6.2) | 13 (10.1) | 16 (12.4) | |
| History of multimorbidity3 | 0.03 | |||||
| Yes | 322 (62.3) | 81 (62.3) | 92 (71.3) | 69 (53.5) | 80 (62.0) | |
| No | 195 (37.7) | 49 (37.7) | 37 (28.7) | 60 (46.5) | 49 (38.0) | |
| Microbial diversity | ||||||
| Shannon | 3.39 ± 0.61 | 3.38 ± 0.63 | 3.44 ± 0.59 | 3.36 ± 0.61 | 3.38 ± 0.62 | 0.40 |
| Inverse Simpson | 15.9 ± 9.8 | 15.9 ± 9.8 | 16.8 ± 10.3 | 15.4 ± 10.0 | 15.6 ± 9.4 | 0.65 |
Values are shown as means ± SD or n (%). PASE, Physical Activity Scale for the Elderly.
2Derived from either an ANOVA (continuous variables) or chi-square test (categorical variables).
3Defined as having ≥2 of the following chronic conditions: myocardial infarction, heart failure, stroke, diabetes, chronic obstructive pulmonary disease, cancer, hip fracture, osteoarthritis, rheumatoid arthritis, depression, cognitive impairment, Parkinson's disease, visual impairment, and fall history.
There were statistically significant differences in the proportions of the various clinical centers represented in each quartile of adherence to the Western dietary pattern (Table 1). Participants with the highest adherence to the Western pattern had significantly higher BMIs than men with the lowest adherence to this dietary pattern. Age, race, education, smoking, alcohol use, physical activity (PASE score), self-rated health, history of multimorbidity, and alpha diversity (Shannon and inverse Simpson indices) were not associated with adherence to the Western pattern. Men with the highest adherence to the prudent dietary pattern had a significantly lower mean BMI, compared with men with the lowest adherence to this pattern (Table 2). Age, race, education, clinical center, smoking, alcohol use, physical activity, self-rated health, history of multimorbidity, and alpha diversity (Shannon and inverse Simpson indices) were not associated with adherence to the prudent pattern.
Across all 517 participants, the dominant phyla were Bacteroidetes (46.9%) and Firmicutes (41.7%), with lower contributions from Proteobacteria (6.5%) and Verrucomicrobia (3.3%). The relative abundance of these 4 dominant phyla did not differ significantly between the 2 dietary patterns. The dominant OTUs (with a mean relative abundance of at least 1%) were genus Bacteroides (33.5%), genus Faecalibacterium (8.1%), order Clostridiales (7.9%), family Ruminococcaceae (6.9%), family Lachnospiraceae (5.1%), genus Prevotella (3.9%), genus Ruminococcus (3.9%), genus Parabacteroides (3.8%), genus Akkermansia (3.3%), family Rikenellaceae (2.7%), family Enterobacteriaceae (2.5%), genus Erwinia (1.6%), genus Blautia (1.4%), genus Lachnospira (1.2%), genus Oscillospira (1.2%), and genus Sutterella (1.1%).
Figure 2 shows alpha diversity measures by race, clinical center, and BMI. Participants who were non-Hispanic White had significantly higher alpha diversity indices (both Shannon and inverse Simpson) than those in other race/ethnic groups. Participants from the Minneapolis and Portland clinical centers had significantly higher alpha diversity by both indices, compared with participants from the other clinical centers. There were no significant associations between BMI and either index of alpha diversity. Table 3 shows the crude and adjusted associations between the 2 dietary patterns—Western and prudent—and alpha diversity. There were no statistically significant associations between either index of alpha diversity (Shannon or inverse Simpson) for either pattern in the adjusted models.
FIGURE 2.

Distributions and predictors of alpha diversity measures (n = 517). (A) Distribution of Shannon index: box plots with medians and IQRs are shown by race (P < 0.001), clinical center (P = 0.005), and BMI (P = 0.29). (B) Distribution of inverse Simpson index: box plots with medians and IQRs are shown by race (P = 0.001), clinical center (P = 0.005), and BMI (P = 0.11). P values were derived from an ANOVA. BI, Birmingham; MN, Minneapolis; PA, Palo Alto; PI, Pittsburgh; PO, Portland; SD, San Diego.
TABLE 3.
Associations between dietary patterns and measures of alpha diversity1
| Western dietary pattern | Prudent dietary pattern | |||||
|---|---|---|---|---|---|---|
| Alpha diversity measure | β coefficient | 95% CI | P value2 | β coefficient | 95% CI | P value |
| Shannon | ||||||
| Univariable | −0.037 | −0.090, 0.015 | 0.16 | −0.029 | −0.080, 0.022 | 0.27 |
| Multivariable3 | −0.023 | −0.099, 0.054 | 0.56 | −0.014 | −0.073, 0.045 | 0.64 |
| Inverse Simpson | ||||||
| Univariable | −0.85 | −1.70, −0.01 | 0.05 | −0.62 | −1.44, 0.19 | 0.13 |
| Multivariable | −0.62 | −1.85, 0.61 | 0.32 | −0.45 | −1.40, 0.49 | 0.35 |
1 n = 517.
2Derived from a multiple linear regression.
3Multivariable model adjusted for age, race, clinical center, energy intake, BMI, and library size.
Figure 3 shows the associations between the dietary patterns and beta diversity (weighted and unweighted UniFrac, as assessed by PERMANOVA). In multivariable analyses, both the Western and prudent patterns were significantly associated with both weighted and unweighted UniFrac measures of beta diversity. Men with greater adherence to the Western pattern had slightly lower levels of the second principal component factor, while men with greater adherence to the prudent pattern had slightly higher levels of the second principal component factor, assessed by unweighted UniFrac.
FIGURE 3.

Associations between quartiles of adherence to the Western and prudent dietary patterns and beta diversity PCoA (n = 517). Statistical significances for models: (A) P = 0.029; (B) P = 0.001; (C) P = 0.011; and (D) P = 0.002. Statistical significances for models, adjusted for age, race, clinical center, energy intake, BMI, and library size: (A) P = 0.005; (B) P = 0.001; (C) P = 0.039; and (D) P = 0.004. P values were derived from permutational multivariate analysis of variance (PERMANOVA). PCoA, principal coordinate analysis.
In multiple comparisons–adjusted analyses of specific OTUs, the relative abundances of the families Mogibacteriaceae and Veillonellaceae and genera Alistipes, Anaerotruncus, CC-115, Collinsella, Coprobacillus, Desulfovibrio, Dorea, Eubacterium, and Ruminococcus were significantly positively associated with adherence to the Western pattern after adjustment for age, race, clinical center, energy intake, BMI, and library size, while the relative abundances of orders Clostridiales and Streptophyta, family Anaeroplasmataceae, and genera Coprococcus, Faecalibacterium, Haemophilus, Lachnospira, Paraprevotella, and Prevotella were significantly inversely associated with adherence to the Western dietary pattern (Table 4).
TABLE 4.
Associations between the Western dietary pattern and abundance of specific taxa at the level of genera/operational taxonomic unit1
| Relative abundance among participants with taxon present, % | |||||||
|---|---|---|---|---|---|---|---|
| Taxon | Reference no. | Prevalence, % | Median | IQR | β coefficient2 | False discovery rate–adjusted P value3 | |
| g. Paraprevotella4 | 165118 | 81.8 | 0.006 | 0.003 | 0.656 | −0.81 | 0.006 |
| f. Anaeroplasmataceae | 185593 | 12.6 | 0.002 | 0.002 | 0.004 | −0.78 | <0.001 |
| g. Prevotella | 423264 | 26.9 | 0.002 | 0.002 | 0.004 | −0.48 | 0.020 |
| g. Lachnospira4 | 843553 | 99.6 | 0.83 | 0.30 | 1.60 | −0.47 | 0.004 |
| g. Faecalibacterium4 | 368219 | 100.0 | 7.0 | 3.0 | 11.7 | −0.44 | 0.015 |
| g. Haemophilus | 865469 | 77.8 | 0.021 | 0.006 | 0.083 | −0.44 | 0.027 |
| o. Streptophyta4 | 262379 | 42.6 | 0.006 | 0.003 | 0.015 | −0.40 | <0.001 |
| g. Coprococcus | 359993 | 99.2 | 0.149 | 0.067 | 0.365 | −0.38 | 0.004 |
| o. Clostridiales | 345354 | 100.0 | 6.6 | 3.5 | 11.1 | −0.20 | 0.017 |
| g. Dorea4 | 523542 | 99.6 | 0.146 | 0.078 | 0.270 | 0.25 | 0.023 |
| g. Coprobacillus4 | 587933 | 60.7 | 0.009 | 0.004 | 0.020 | 0.31 | 0.015 |
| f. Mogibacteriaceae | 1108745 | 89.6 | 0.030 | 0.013 | 0.067 | 0.37 | 0.004 |
| g. Anaerotruncus | 315223 | 88.6 | 0.021 | 0.009 | 0.067 | 0.39 | 0.006 |
| g. Collinsella4 | 147071 | 79.9 | 0.050 | 0.022 | 0.096 | 0.41 | 0.002 |
| g. Alistipes | 107044 | 65.6 | 0.027 | 0.009 | 0.081 | 0.47 | 0.006 |
| g. Eubacterium | 514773 | 79.9 | 0.021 | 0.007 | 0.092 | 0.47 | 0.018 |
| f. Veillonellaceae | 225954 | 51.8 | 0.012 | 0.002 | 0.183 | 0.50 | 0.034 |
| g. CC-1154 | 807548 | 36.4 | 0.013 | 0.005 | 0.042 | 0.67 | <0.001 |
| g. Ruminococcus4 | 583398 | 97.9 | 0.099 | 0.029 | 0.283 | 0.67 | <0.001 |
| g. Desulfovibrio4 | 4453773 | 72.5 | 0.093 | 0.006 | 0.322 | 0.71 | <0.001 |
1 n = 517. f., family; g., genus; o., order.
2β Coefficient is log2 fold change estimated with metagenomeSeq. The multivariable model was adjusted for age, race, clinical center, energy intake, BMI, and library size.
3Derived from a modified t test.
4Associated with the prudent dietary pattern, in the opposite direction.
In multiple comparisons–adjusted analyses of specific OTUs, the relative abundances of order Streptophyta, family Victivallaceae, and genera Cetobacterium, Clostridium, Faecalibacterium, Lachnospira, Paraprevotella, and Veillonella were significantly positively associated with adherence to the prudent pattern after adjustment for age, race, clinical center, energy intake, BMI, and library size, while the relative abundances of family Rikenellaceae and genera CC-115, Cloacibacillus, Collinsella, Coprobacillus, Desulfovibrio, Dorea, and Ruminococcus were significantly inversely associated with adherence to the prudent dietary pattern (Table 5). Several taxa were significantly associated with both dietary patterns, in opposing directions.
TABLE 5.
Associations between the prudent dietary pattern and presence/abundance of specific taxa at the level of genera/operational taxonomic unit1
| Relative abundance among participants with taxon present, % | |||||||
|---|---|---|---|---|---|---|---|
| Taxon | Reference no. | Prevalence, % | Median | IQR | β coefficient2 | False discovery rate–adjusted P value3 | |
| g. CC-1154 | 807548 | 36.4 | 0.013 | 0.005 | 0.042 | −0.53 | <0.001 |
| g. Ruminococcus4 | 583398 | 97.9 | 0.099 | 0.029 | 0.283 | −0.46 | <0.001 |
| g. Desulfovibrio4 | 4453773 | 72.5 | 0.093 | 0.006 | 0.322 | −0.39 | 0.025 |
| g. Coprobacillus4 | 587933 | 60.7 | 0.009 | 0.004 | 0.020 | −0.32 | 0.002 |
| f. Rikenellaceae | 357046 | 100.0 | 1.55 | 0.75 | 3.10 | −0.31 | 0.025 |
| g. Cloacibacillus | 3121406 | 22.6 | 0.010 | 0.004 | 0.040 | −0.27 | 0.038 |
| g. Collinsella4 | 147071 | 79.9 | 0.050 | 0.022 | 0.096 | −0.26 | 0.024 |
| g. Dorea4 | 523542 | 99.6 | 0.146 | 0.078 | 0.270 | −0.19 | 0.038 |
| g. Cetobacterium | 828162 | 13.7 | 0.002 | 0.002 | 0.003 | 0.20 | 0.024 |
| g. Clostridium | 558420 | 99.4 | 0.216 | 0.068 | 0.656 | 0.28 | 0.038 |
| o. Streptophyta4 | 262379 | 42.6 | 0.006 | 0.003 | 0.015 | 0.30 | 0.004 |
| g. Lachnospira4 | 843553 | 99.6 | 0.828 | 0.302 | 1.603 | 0.30 | 0.025 |
| f. Victivallaceae | 158404 | 30.0 | 0.034 | 0.009 | 0.109 | 0.31 | 0.038 |
| g. Veillonella | 342427 | 79.5 | 0.020 | 0.006 | 0.074 | 0.32 | 0.025 |
| g. Faecalibacterium4 | 368219 | 100.0 | 7.0 | 3.0 | 11.7 | 0.36 | 0.024 |
| g. Paraprevotella4 | 165118 | 81.8 | 0.006 | 0.003 | 0.656 | 0.57 | 0.024 |
1 n = 517. f., family; g., genus; o., order.
2β Coefficient is log2 fold change, estimated with metagenomeSeq. The multivariable model included age, race, clinical center, energy intake, BMI, and library size.
3Derived from a modified t test.
4Associated with the Western dietary pattern, in the opposite direction.
Discussion
In this study of older, community-dwelling men, several measures of gut microbial composition differed according to the degree of adherence to Western and prudent dietary patterns. In multivariable-adjusted models, greater adherence to the Western pattern was positively associated with families Mogibacteriaceae and Veillonellaceae and genera Alistipes, Anaerotruncus, CC-115, Collinsella, Coprobacillus, Desulfovibrio, Dorea, Eubacterium, and Ruminococcus, while greater adherence to the prudent pattern was positively associated with order Streptophyta, family Victivallaceae, and genera Cetobacterium, Clostridium, Faecalibacterium, Lachnospira, Paraprevotella, and Veillonella. The relative abundance of the dominant gut bacterial phyla—Bacteroidetes and Firmicutes—did not differ between participants with greater adherence to the Western pattern, compared with those with greater adherence to the prudent pattern. Dietary patterns were not associated with measures of alpha diversity, but beta diversity measures were significantly associated with both Western and prudent patterns in multivariable-adjusted analyses.
This study addresses several gaps in the microbiome literature. There is a paucity of studies of the gut microbiota in generally healthy, community-dwelling, older adults, and we know of no published data on diet and the gut microbiota in a similar cohort of older men. Physiological changes in the gastrointestinal tract that occur with aging make studying diet and gut microbiota in older persons important relative to other age cohorts. For example, increased gut transit time, a higher prevalence of atrophic gastritis leading to decreased acid production, and compromised intestinal mucosal immune system function with aging all can potentially influence gut microbiota composition and diversity in older adults (40). In a study of 83 older, community-dwelling men and women in Ireland as part of the ELDERMET consortium, the most common gut genera were Coprococcus and Roseburia (12), while the most common gut genera in MrOS participants were Bacteroides, Faecalibacterium, and Clostridiales.
The Human Microbiome Project was designed to generate population-representative data, but its 300 participants were aged 18–40 years (41). Several large European studies have included a broad age range (17, 42). The gut microbiota appears to remain relatively stable through adulthood, but may meaningfully change in older age (e.g., decreased microbial diversity), perhaps reflecting changes in diet, physiology, and medication use (12, 15–17), which motivates the focused study of older adults. Intervention studies have shown that short-term changes in diet can alter the gut microbiota (15), and several short-term, randomized, controlled feeding studies in humans have shown that increasing the amounts of specific foods in the diet (e.g., broccoli and other cruciferous vegetables, whole grains, walnuts, almonds, and pistachios) resulted in significant and potentially beneficial changes in the composition of the gut microbiota (43–48). There have been relatively few observational studies of longer-term diets. Cross-population studies have documented appreciable variation in the gut microbial community structure, which may reflect differences in diet, along with numerous other environmental or cultural differences between studied populations (14, 49–51).
Our findings are consistent with previous studies showing associations between diet and gut microbial community composition. In a cross-sectional analysis of 98 healthy volunteers in the United States, Wu et al. (19) assessed diet with both an FFQ, a measure of usual diet, and a 24-hour diet recall and examined differences across 2 dominant microbial clusters (enterotypes), characterized by a relatively higher abundance of either Prevotella or Bacteroides. The authors examined a large number of specific dietary components, and we cannot directly compare our dietary patterns results with their results. However, in Wu et al. (19), the Prevotella enterotype was positively associated with the dietary intake of carbohydrates, which is in line with our finding that the genus Prevotella was positively associated with the prudent dietary pattern, a higher-carbohydrate pattern. However, while in Wu et al. (19) the Bacteroides enterotype was positively associated with animal fat and protein, characteristic of a Western diet, Bacteroides was not associated with the Western dietary pattern in our study.
In contrast, David et al. (15) observed taxa-specific changes in a short-term dietary intervention. Specifically, they demonstrated that a 5-day dietary intervention with plant-based or animal-based diets rapidly and reproducibly altered the composition of the gut microbiota in 10 subjects who were 21–33 years of age (15). The intervention diets were designed for large macronutrient composition differences, with 22% fat, 10% protein, and 68% carbohydrate in the plant-based diet and 70% fat, 30% protein, and 0.6% carbohydrates in the animal-based diet. Differences across the MrOS dietary patterns were much less pronounced. In the Western (prudent) dietary patterns, the percentages of energy from each macronutrient in the lowest and highest quartiles, respectively, were: fat: 29% and 42% (40% and 33%); protein: 17% and 15% (15% and 17%); and carbohydrates: 57% and 45% (47% and 53%) (31). Still, despite the more modest dietary differences in our observational study, several taxa-specific associations were consistent with results from the intervention study. For example, in David et al. (15), the meat-based diet induced increases in several taxonomic groups, including Alistipes and Ruminococcus, both of which were positively associated with the Western dietary pattern in MrOS. Faecalibacterium, which decreased when participants consumed the meat-based diet in David et al. (15), was negatively associated with the Western pattern and positively associated with the prudent pattern in MrOS. In David et al. (15), unspecified genera within Lachnospiraceae were both increased and decreased on the meat-based diet. In MrOS, members of Lachnospiraceae were similarly differently associated with Western and prudent patterns, with Dorea positively associated with the Western pattern and inversely associated with the prudent pattern, and Lachnospira inversely associated with the Western pattern and positively with the prudent pattern.
Taxa-specific results were consistent with biologic expectations, with respect to current knowledge of the bacterial metabolisms of dietary components. For example, Faecalibacterium is a known butyrate producer from nondigestible polysaccharides in the diet (52). A higher presence of Alistipes, resistant to bile, is consistent with a greater presence in higher-fat diets (53). Desulfovibrio is a proteobacteria involved in the fermentation of sulfate-containing amino acids, consistent with our findings of a positive association with the Western dietary pattern and an inverse association with the prudent dietary pattern (54). Prevotella utilizes fiber and was inversely associated with the Western dietary pattern (55).
We observed significant differences in alpha diversity by MrOS clinical center. Geographical differences in gut microbiota composition and diversity is an understudied area, but differences in the gut microbiota were detected in 4 geographically distinct districts in Japan by Andoh and colleagues (56). In a recent review of potential influences on the human microbiome, Gupta et al. (57) noted that geography might influence gut microbiota composition and diversity through such factors as differences in the food supply, adaptive immunity, and local environmental exposures.
This study included several notable strengths, including a large sample of community-dwelling older men. To the best of our knowledge, this is the first investigation into the association of dietary patterns and the gut microbiota focusing on older men, who have not been well represented in previous studies of the microbiome and diet. Study participants were comprehensively characterized, including a previously completed collection of stool specimens, comprehensive assessment of habitual dietary intake, and rigorous derivation of dietary patterns from reported intake on FFQs through a factor analysis. We were able to control for multiple potential confounders. There were, however, limitations of the study that should be noted. While the present study is larger than many of the previous studies relating diet with the microbiota, there are still issues concerning sample size, potentially limiting power to detect meaningful effects. Other limitations include the cross-sectional observational design, precluding the determination of causality. Although it may seem logical that diet would affect the gut microbiota, it is conceivable that gut microbiota might have influenced dietary intake. Medications other than antibiotics were not accounted for, and the possibility of selection bias and residual confounding cannot be eliminated. The generalizability of our results is limited to community-dwelling, generally healthy, older men. Also, the cohort was mostly non-Hispanic White men with significant differences in alpha diversity noted by race/ethnicity, thus leaving open the potential for effect modification by race/ethnicity. Thus, future investigations are needed to determine associations between dietary patterns and microbiome parameters, with larger samples and/or more variation in phenotype. We did not have data on the times of day meals were consumed in relation to the collection of stool samples, which may influence bacterial abundances (58). The present study was limited to 16S profiling, thus limiting the interpretation, with further study necessary to identify taxa down to genus and species and the assessment of function through whole-metagenomic sequencing and metabolite measures. The use of medications that potentially can influence the composition and diversity of the gut microbiota, including metformin, proton pump inhibitors, and statins (59, 60), was not assessed in this analysis. Finally, measurement error in dietary assessment, a known issue with FFQs, may have limited our ability to detect associations, as such error is likely to be non-differential with respect to alpha and beta diversity; thus, effect estimates would be biased toward the null. The brief FFQ used in MrOS may well underestimate energy intake, and thus would be inappropriate for assessing absolute intakes of specific nutrients (including energy), but would be sufficient for assessing dietary patterns.
In conclusion, we observed significant associations between measures of gut microbial composition and dietary patterns. Our data advance current lines of research by providing results on usual diets in a sample of community-dwelling older men. Future research examining how the gut microbiota might possibly serve as an intermediate linking diet to clinical outcomes, such as fractures, bone mineral density, and falls, will be important. Several of our results replicate findings from previous publications relating the gut microbiota and diet, and are consistent with expectations based on the microbial metabolism of dietary carbohydrates and amino acids. These data support the relevance of diet to the gut microbiota in community-dwelling, older men.
Acknowledgments
The authors’ responsibilities were as follows—JMS, LL: designed and conducted the research; LL, NFF: analyzed the data; JMS: had primary responsibility for the final content; and all authors: wrote the paper, contributed substantially to the interpretation of data and the drafting or critical revision of the manuscript for important intellectual content, and read and approved the final manuscript. Author disclosures: JMS, RD, AJJ, NFF, KM, KEE, NEL, ESO, DMK, JMZ, and LL, no conflicts of interest.
Notes
This study was supported by grants from the National Institutes of Health through support from the National Institute on Aging, the National Institute of Arthritis and Musculoskeletal and Skin Diseases, the National Center for Advancing Translational Sciences, and the National Institutes of Health Roadmap for Medical Research (grant numbers U01 AG027810, U01 AG042124, U01 AG042139, U01 AG042140, U01 AG042143, U01 AG042145, U01 AG042168, U01 AR066160, and UL1 TR000128).
Abbreviations used: MrOS, Osteoporotic Fractures in Men; OTU, operational taxonomic unit; PASE, Physical Activity Scale for the Elderly; PERMANOVA, permutational multivariate analysis of variance; rRNA, ribosomal RNA.
References
- 1. Sender R, Fuchs S, Milo R. Revised estimates for the number of human and bacteria cells in the body. PLOS Biol. 2016;14:e1002533. [DOI] [PMC free article] [PubMed] [Google Scholar]
- 2. Honda K, Littman DR.. The microbiome in infectious disease and inflammation. Annu Rev Immunol. 2012;30:759–95. [DOI] [PMC free article] [PubMed] [Google Scholar]
- 3. Chen X, Devaraj S.. Gut microbiome in obesity, metabolic syndrome, and diabetes. Curr Diab Rep. 2018;18:129. [DOI] [PubMed] [Google Scholar]
- 4. Scher JU, Abramson SB.. The microbiome and rheumatoid arthritis. Nat Rev Rheumatol. 2011;7:569–78. [DOI] [PMC free article] [PubMed] [Google Scholar]
- 5. Parekh PJ, Balart LA, Johnson DA. The influence of the gut microbiome on obesity, metabolic syndrome and gastrointestinal disease. Clin Transl Gastroenterol. 2015;6:e91. [DOI] [PMC free article] [PubMed] [Google Scholar]
- 6. Goodman B, Gardner H.. The microbiome and cancer. J Pathol. 2018;244:667–76. [DOI] [PubMed] [Google Scholar]
- 7. Sjogren K, Engdahl C, Henning P, Lerner UH, Tremaroli V, Lagerquist MK, Backhed F, Ohlsson C. The gut microbiota regulates bone mass in mice. J Bone Miner Res. 2012;27:1357–67. [DOI] [PMC free article] [PubMed] [Google Scholar]
- 8. Ohlsson C, Engdahl C, Fak F, Andersson A, Windahl SH, Farman HH, Movérare-Skrtic S, Islander U, Sjögren K. Probiotics protect mice from ovariectomy-induced cortical bone loss. PLOS One. 2014;9:e92368. [DOI] [PMC free article] [PubMed] [Google Scholar]
- 9. Bindels LB, Delzenne NM. Muscle wasting: the gut microbiota as a new therapeutic target?. Int J Biochem Cell Biol. 2013;45:2186–90. [DOI] [PubMed] [Google Scholar]
- 10. Bleau C, Karelis AD, St-Pierre DH, Lamontagne L. Crosstalk between intestinal microbiota, adipose tissue and skeletal muscle as an early event in systemic low-grade inflammation and the development of obesity and diabetes. Diabetes Metab Res Rev. 2015;31:545–61. [DOI] [PubMed] [Google Scholar]
- 11. Davidson GL, Cooke AC, Johnson CN, Quinn JL. The gut microbiome as a driver of individual variation in cognition and functional behaviour. Philos Trans R Soc Lond B Biol Sci. 2018;373:pii: 20170286. [DOI] [PMC free article] [PubMed] [Google Scholar]
- 12. Claesson MJ, Jeffery IB, Conde S, Power SE, O'Connor EM, Cusack S, Harris HM, Coakley M, Lakshminarayanan B, O'Sullivan O et al.. Gut microbiota composition correlates with diet and health in the elderly. Nature. 2012;488:178–84. [DOI] [PubMed] [Google Scholar]
- 13. Kinross J, Nicholson JK. Gut microbiota: dietary and social modulation of gut microbiota in the elderly. Nat Rev Gastroenterol Hepatol. 2012;9:563–4. [DOI] [PubMed] [Google Scholar]
- 14. Yatsunenko T, Rey FE, Manary MJ, Trehan I, Dominguez-Bello MG, Contreras M, Magris M, Hidalgo G, Baldassano RN, Anokhin AP et al.. Human gut microbiome viewed across age and geography. Nature. 2012;486:222–7. [DOI] [PMC free article] [PubMed] [Google Scholar]
- 15. David LA, Maurice CF, Carmody RN, Gootenberg DB, Button JE, Wolfe BE, Ling AV, Devlin AS, Varma Y, Fischbach MA et al.. Diet rapidly and reproducibly alters the human gut microbiome. Nature. 2014;505:559–63. [DOI] [PMC free article] [PubMed] [Google Scholar]
- 16. Xu Z, Knight R.. Dietary effects on human gut microbiome diversity. Br J Nutr. 2015;113:Suppl:S1–5. [DOI] [PMC free article] [PubMed] [Google Scholar]
- 17. Zhernakova A, Kurilshikov A, Bonder MJ, Tigchelaar EF, Schirmer M, Vatanen T, Mujagic Z, Vila AV, Falony G, Vieira-Silva S et al.. Population-based metagenomics analysis reveals markers for gut microbiome composition and diversity. Science. 2016;352:565–9. [DOI] [PMC free article] [PubMed] [Google Scholar]
- 18. McDonald D, Hyde E, Debelius JW, Morton JT, Gonzalez A, Ackerman G, Aksenov AA, Behsaz B, Brennan C, Chen Y et al.. American gut: An open platform for citizen science microbiome research. mSystems. 2018;3:e00031–18. [DOI] [PMC free article] [PubMed] [Google Scholar]
- 19. Wu GD, Chen J, Hoffmann C, Bittinger K, Chen YY, Keilbaugh SA, Bewtra M, Knights D, Walters WA, Knight R et al.. Linking long-term dietary patterns with gut microbial enterotypes. Science. 2011;334:105–8. [DOI] [PMC free article] [PubMed] [Google Scholar]
- 20. De Filippis F, Pellegrini N, Vannini L, Jeffery IB, La Storia A, Laghi L, Serrazanetti DI, Di Cagno R, Ferrocino I, Lazzi C et al.. High-level adherence to a Mediterranean diet beneficially impacts the gut microbiota and associated metabolome. Gut. 2016;65:1812–21. [DOI] [PubMed] [Google Scholar]
- 21. Hu FB, Rimm E, Smith-Warner SA, Feskanich D, Stampfer MJ, Ascherio A, Sampson L, Willett WC. Reproducibility and validity of dietary patterns assessed with a food-frequency questionnaire. Am J Clin Nutr. 1999;69:243–9. [DOI] [PubMed] [Google Scholar]
- 22. Newby PK, Tucker KL. Empirically derived eating patterns using factor or cluster analysis: a review. Nutr Rev. 2004;62:177–203. [DOI] [PubMed] [Google Scholar]
- 23. Van Horn L. Eating pattern analysis: the whole is more than the sum of its parts. J Am Diet Assoc. 2011;111:203. [DOI] [PubMed] [Google Scholar]
- 24. Blank JB, Cawthon PM, Carrion-Petersen ML, Harper L, Johnson JP, Mitson E, Delay RR. Overview of recruitment for the Osteoporotic Fractures in Men study (MrOS). Contemp Clin Trials. 2005;26:557–68. [DOI] [PubMed] [Google Scholar]
- 25. Orwoll E, Blank JB, Barrett-Connor E, Cauley J, Cummings S, Ensrud K, Lewis C, Cawthon PM, Marcus R, Marshall LM et al.. Design and baseline characteristics of the Osteoporotic Fractures in Men (MrOS) study – a large observational study of the determinants of fracture in older men. Contemp Clin Trials. 2005;26:569–85. [DOI] [PubMed] [Google Scholar]
- 26. Abrahamson M, Hooker E, Ajami NJ, Petrosino JF, Orwoll ES. Successful collection of stool samples for microbiome analyses from a large community-based population of elderly men. Cont Clin Trial Comm. 2017;7:158–62. [DOI] [PMC free article] [PubMed] [Google Scholar]
- 27. McIver LJ, Abu-Ali G, Franzosa EA, Schwager R, Morgan XC, Waldron L, Segata N, Huttenhower C. bioBaker: a meta'omic analysis environment. Bioinformatics. 2018;34:1235–7. [DOI] [PMC free article] [PubMed] [Google Scholar]
- 28. The Greengenes Database Consortium. Greengenes: the 16S rRNA gene database and tools. [Internet]. Available from: http://greengenes.lbl.gov. [Google Scholar]
- 29. Boucher B, Cotterchio M, Kreiger N, Nadalin V, Block T, Block G. Validity and reliability of the Block98 food-frequency questionnaire in a sample of Canadian women. Public Health Nutr. 2006;9:84–93. [DOI] [PubMed] [Google Scholar]
- 30. Johnson BA, Herring AH, Ibrahim JG, Siega-Riz AM. Structured measurement error in nutritional epidemiology; Applications in the Pregnancy, Infection, and Nutrition (PIN) study. J Am Stat Assoc. 2007;102:856–66. [DOI] [PMC free article] [PubMed] [Google Scholar]
- 31. Rogers TS, Harrison S, Judd S, Orwoll ES, Marshall LM, Shannon J, Langsetmo L, Lane NE, Shikany JM; Osteoporotic Fractures in Men (MrOS) Study Research Group. Dietary patterns and longitudinal change in hip bone mineral density among older men. Osteoporos Int. 2018;29:1135–45. [DOI] [PMC free article] [PubMed] [Google Scholar]
- 32. Washburn RA, Smith KW, Jette AM, Janney CA. The Physical Activity Scale for the Elderly (PASE): Development and evaluation. J Clin Epidemiol. 1993;46:153–62. [DOI] [PubMed] [Google Scholar]
- 33. Pahor M, Chrischilles EA, Guralnik JM, Brown SL, Wallace RB, Carbonin P. Drug data coding and analysis in epidemiologic studies. Eur J Epidemiol. 1994;10:405–11. [DOI] [PubMed] [Google Scholar]
- 34. Lozupone C, Knight R.. UniFrac: A new phylogenetic method for comparing microbial communities. Appl Environ Microbiol. 2005;71;8228–35. [DOI] [PMC free article] [PubMed] [Google Scholar]
- 35. Morgan XC, Huttenhower C.. Chapter 12: Human microbiome analysis. PLoS Comput Biol. 2012;8:e1002808. [DOI] [PMC free article] [PubMed] [Google Scholar]
- 36. Kelly BJ, Gross R, Bittinger K, Sherrill-Mix S, Lewis JD, Collman RG, Bushman FD, Li H. Power and sample-size estimation for microbiome studies using pairwise distances and PERMANOVA. Bioinformatics. 2015;31:2461–8. [DOI] [PMC free article] [PubMed] [Google Scholar]
- 37. Paulson JN, Stine OC, Bravo HC, Pop M. Differential abundance analysis for microbial marker-gene surveys. Nat Methods. 2013;10:1200–2. [DOI] [PMC free article] [PubMed] [Google Scholar]
- 38. McMurdie PJ, Holmes S.. phyloseq: an R package for reproducible interactive analysis and graphics of microbiome census data. PLOS One. 2013;8:e61217. [DOI] [PMC free article] [PubMed] [Google Scholar]
- 39. Oksanen J, Blanchet FG, Friendly M, Kindt R, Legendre P, McGlinn D, Minchin PR, O'Hara RB, Simpson GL, Solymos P et al.. Vegan: community ecology package [Internet]. Version 2.5–3. Available from: https://CRAN.R-project.org/package=vegan. [Google Scholar]
- 40. An R, Wilms E, Masclee AAM, Smidt H, Zoetendal EG, Jonkers D. Age-dependent changes in GI physiology and microbiota: Time to reconsider?. Gut. 2018;67:2213–22. [DOI] [PubMed] [Google Scholar]
- 41. Human Microbiome Project Consortium. Structure, function and diversity of the healthy human microbiome. Nature. 2012;486:207–14. [DOI] [PMC free article] [PubMed] [Google Scholar]
- 42. Falony G, Joossens M, Vieira-Silva S, Wang J, Darzi Y, Faust K, Kurilshikov A, Bonder MJ, Valles-Colomer M, Vandeputte D et al.. Population-level analysis of gut microbiome variation. Science. 2016;352:560–4. [DOI] [PubMed] [Google Scholar]
- 43. Kaczmarek JL, Liu X, Charron CS, Novotny JA, Jeffery EH, Seifried HE, Ross SA, Miller MJ, Swanson KS, Holscher HD. Broccoli consumption affects the human gastrointestinal microbiota. J Nutr Biochem. 2019;63:27–34. [DOI] [PMC free article] [PubMed] [Google Scholar]
- 44. Li F, Hullar MAJ, Schwarz Y, Lampe JW. Human gut bacterial communities are altered by addition of cruciferous vegetables to a controlled fruit- and vegetable-free diet. J Nutr. 2009;139:1685–91. [DOI] [PMC free article] [PubMed] [Google Scholar]
- 45. Vanegas SM, Meydani M, Barnett JB, Goldin B, Kane A, Rasmussen H, Brown C, Vangay P, Knights D, Jonnalagadda S et al.. Substituting whole grains for refined grains in a 6-wk randomized trial has a modest effect on gut microbiota and immune and inflammatory markers of healthy adults. Am J Clin Nutr. 2017;105:635–50. [DOI] [PMC free article] [PubMed] [Google Scholar]
- 46. Holscher HD, Guetterman HM, Swanson KS, An R, Matthan NR, Lichtenstein AH, Novotny JA, Baer DJ. Walnut consumption alters the gastrointestinal microbiota, microbially derived secondary bile acids, and health markers in healthy adults: A randomized controlled trial. J Nutr. 2018;148:861–7. [DOI] [PMC free article] [PubMed] [Google Scholar]
- 47. Holscher HD, Taylor AM, Swanson KS, Novotny JA, Baer DJ. Almond consumption and processing affects the composition of the gastrointestinal microbiota of healthy adult men and women: A randomized controlled trial. Nutrients. 2018;10:126. [DOI] [PMC free article] [PubMed] [Google Scholar]
- 48. Ukhanova M, Wang X, Baer DJ, Novotny JA, Fredborg M, Mai V. Effects of almond and pistachio consumption on gut microbiota composition in a randomised cross-over human feeding study. Br J Nutr. 2014;111:2146–52. [DOI] [PubMed] [Google Scholar]
- 49. De Filippo C, Cavalieri D, Di Paola M, Ramazzotti M, Poullet JB, Massart S, Collini S, Pieraccini G, Lionetti P. Impact of diet in shaping gut microbiota revealed by a comparative study in children from Europe and rural Africa. Proc Natl Acad Sci USA. 2010;107:14691–6. [DOI] [PMC free article] [PubMed] [Google Scholar]
- 50. Schnorr SL, Candela M, Rampelli S, Centanni M, Consolandi C, Basaglia G, Turroni S, Biagi E, Peano C, Severgnini M et al.. Gut microbiome of the Hadza hunter-gatherers. Nat Commun. 2014;5:3654. [DOI] [PMC free article] [PubMed] [Google Scholar]
- 51. Rothschild D, Weissbrod O, Barkan E, Kurilshikov A, Korem T, Zeevi D, Costea PI, Godneva A, Kalka IN, Bar N et al.. Environment dominates over host genetics in shaping human gut microbiota. Nature. 2018;555:210–15. [DOI] [PubMed] [Google Scholar]
- 52. Louis P, Flint HJ.. Diversity, metabolism and microbial ecology of butyrate-producing bacteria from the human large intestine. FEMS Microbiol Lett. 2009;294:1–8. [DOI] [PubMed] [Google Scholar]
- 53. Rautio M, Eerola E, Jalava J, Jousimies-Somer H. Phylogenetic description of a bile-resistant anaerobic pigmented Gram-negative bacillus, probably conforming to a new genus and species. Rev Med Microbiol. 1997;8:S103. [Google Scholar]
- 54. Heidelberg JF, Seshadri R, Haveman SA, Hemme CL, Paulsen IT, Kolonay JF, Eisen JA, Ward N, Methe B, Brinkac LM et al.. The genome sequence of the anaerobic, sulfate-reducing bacterium Desulfovibrio vulgaris Hildenborough. Nat Biotechnol. 2004;22:554–9. [DOI] [PubMed] [Google Scholar]
- 55. Dodd D, Moon YH, Swaminathan K, Mackie RI, Cann IK. Transcriptomic analyses of xylan degradation by Prevotella bryantii and insights into energy acquisition by xylanolytic bacteroidetes. J Biol Chem. 2010;285:30261–73. [DOI] [PMC free article] [PubMed] [Google Scholar]
- 56. Andoh A, Kobayashi T, Kuzuoka H, Susuki Y, Matsui T, Nakamura S, Matsumoto T, Fujiyama Y, Bamba T. Data mining analysis of terminal restriction fragment length polymorphism shows geographical differences in the human gut microbiota. Biomed Rep. 2013;1:559–62. [DOI] [PMC free article] [PubMed] [Google Scholar]
- 57. Gupta VK, Paul S, Dutta C. Geography, ethnicity or subsistence-specific variations in human microbiome composition and diversity. Front Microbiol. 2017;8:1162. [DOI] [PMC free article] [PubMed] [Google Scholar]
- 58. Kaczmarek JL, Musaad SMA, Holscher HD. Time of day and eating behaviors are associated with the consumption and function of the human gastrointestinal microbiota. Am J Clin Nutr. 2017;106:1220–31. [DOI] [PubMed] [Google Scholar]
- 59. Wen L, Duffy A. Factors influencing the gut microbiota, inflammation, and type 2 diabetes. J Nutr. 2017;147(Suppl):1468S–75S. [DOI] [PMC free article] [PubMed] [Google Scholar]
- 60. Imhann F, Vila AV, Bonder MJ, Manosalva AGL, Koonen DPY, Fu J, Wijmenga C, Zhernakova A, Weersma RK. The influence of proton pump inhibitors and other commonly used medication on the gut microbiota. Gut Microbes. 2017;8:351–8. [DOI] [PMC free article] [PubMed] [Google Scholar]