

SUMMARY
Heterotrimetic G proteins consist of four subfamilies (GS, Gi/O, Gq/11, and G12/13) that mediate signaling via G-protein-coupled receptors (GPCRs), principally by receptors binding Gα C termini. G-protein-coupling profiles govern GPCR-induced cellular responses, yet receptor sequence selectivity determinants remain elusive. Here, we systematically quantified ligand-induced interactions between 148 GPCRs and all 11 unique Gα subunit C termini. For each receptor, we probed chimeric Gα subunit activation via a transforming growth factor-α (TGF-α) shedding response in HEK293 cells lacking endogenous Gq/11 and G12/13 proteins, and complemented G-protein-coupling profiles through a NanoBiT-G-protein dissociation assay. Interrogation of the dataset identified sequence-based coupling specificity features, inside and outside the transmembrane domain, which we used to develop a coupling predictor that outperforms previous methods. We used the predictor to engineer designer GPCRs selectively coupled to G12. This dataset of fine-tuned signaling mechanisms for diverse GPCRs is a valuable resource for research in GPCR signaling.
In Brief
A large-scale functional interaction study reveals how GPCRs engage with subsets of G(alpha) proteins and outlines characteristic predictive of these associations.
Graphical Abstract
INTRODUCTION
G-protein-coupled receptors (GPCRs), one of the largest protein superfamilies, are key mediators linking extracellular ligands to downstream signals and are the most common targets for pharmaceutical drug development (Hauser et al., 2017, 2018). Ligand binding induces conformational changes in GPCRs that then lead to intracellular binding by particular heterotrimeric G-protein complexes, each consisting of Gα, Gβ, and Gγ subunits, where distinct Gα subunits specify both GPCR interactions and the transduction of particular downstream signaling events (Wettschureck and Offermanns, 2005). The human genome encodes 16 Gα genes that are grouped into four subfamilies Gαs, Gαi/o, Gαq/11, and Gα12/13 that capture broad properties of downstream signaling (e.g., adenylyl cyclase activation by Gαs) (Wettschureck and Offermanns, 2005). In general, each of the hundreds of mammalian GPCRs couple with more than one G protein giving each a distinct coupling profile (Harding et al., 2018), or signature, which evokes a unique cellular response. Determining these GPCR profiles is critical to understanding their biology and pharmacology.
Pharmaceutical interest in GPCRs has prompted many efforts during the last decades to determine both their ligands and signaling (Hauser et al., 2018). Among approximately 360 non-sensory GPCR genes encoded in the human genome, one-third are still labeled as orphans to reflect the fact that either ligands and/or signaling are unknown (Harding et al., 2018). Previous efforts to uncover signaling profiles have been laborious and not standardized yet tended to identify only the subfamily-level signaling outcome (e.g., Ca2+, cAMP, inositol phosphate, Rho activation), rather than the specific Gα subunit binding event (Thomsen et al., 2005). Although this has led a collection of data on GPCR ligands and signaling exemplified in the IUPHAR/BPS Guide to Pharmacology (GtoPdb) (Harding et al., 2018), these databases have issues with mixed quality of G-protein-coupling data as well as the lack of “negative” coupling information. Certain G proteins are still comparatively understudied in terms of their GPCR partners, particularly G12/13, which signal principally through Rho GTPases. Moreover, for the majority of well-studied receptors, only the primary (i.e., the most prominent) coupling is known, with secondary couplings known only for a minority. Yet, this G-protein-coupling information is limited to binary (primary coupling and not stated) or tertiary (primary, secondary couplings, and not stated) scoring and fails to provide quantitative data sufficient to aid successful analyses, for example of GPCR residues involved in G-protein-coupling selectivity.
Efforts to predict coupling on the basis of sequence features have been made to complement the absence of a complete picture of G-protein signaling (Sgourakis et al., 2005b; Yabuki et al., 2005). For G12/13, owing to limited availability of signaling assays, coupling information is incomplete. In addition, for orphan GPCRs, which lack pharmacological compounds to activate receptors, an accurate signaling prediction is desired to investigate not only coupling information, but also putative ligands. Although many methods have been employed, previous researches generally sought to identify broad sequence properties at particular sites on the sequences that are indicative of a particular coupling subgroup. These methods have met with mixed success and with exceptionally poor performances for G12/13.
Recent structures of GPCRs in complex with G proteins (Carpenter et al., 2016; Draper-Joyce et al., 2018; García-Nafria et al., 2018a, 2018b; Kang et al., 2018; Koehl et al., 2018; Rasmussen et al., 2011) have revealed novel insights into G-protein coupling, including sequence determinants, and the flexibility of critical contact points (e.g., transmembrane helix 6, TM6) regulating G-protein access (Kang et al., 2018; Koehl et al., 2018). In particular, the C-terminal tail (Helix 5) of the Gα subunit predominates at the interface with a GPCR, typically accounting for ~70% of the interacting surface (Flock et al., 2017; Rasmussen et al., 2011). This is consistent with earlier mutagenesis studies, which also highlight the importance of this region. Chimeric Gα subunits, where 4–6 C-terminal residues are interchanged, can show swapped coupling selectivities: for example, the chimera Gαq/i1, with a Gαq backbone and a Gαi1 C terminus, has been used to monitor Gi signaling (Conklin et al., 1993).
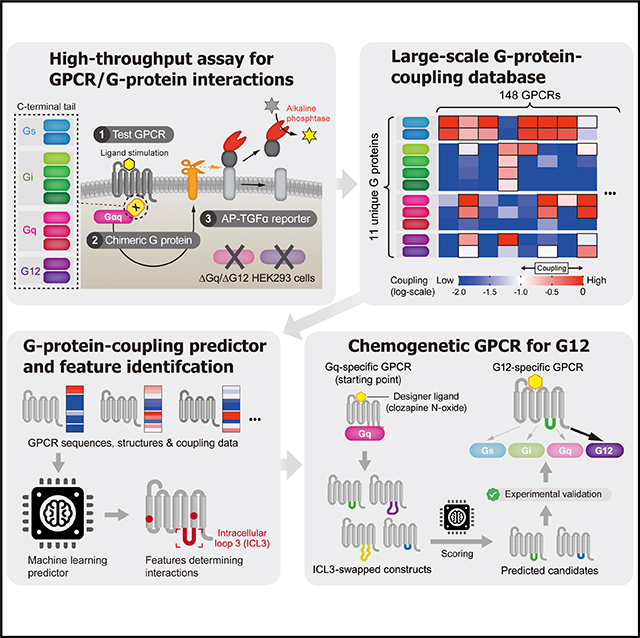
Despite many advances in the understanding of GPCRs, the mechanisms by which they specifically signal through G proteins remain poorly understood (Koehl et al., 2018). This could be greatly enhanced by systematic screens of multiple, diverse GPCRs against a complete set of G proteins. Here, we exploited an experimentally derived dataset of GPCR/G-protein pairings, where we assessed coupling via chimeric G-protein-mediated responses of transforming growth factor-α (TGF-α) release. The extensive dataset provides new insights into the spectrum of coupling for 148 diverse receptors and enabled us to devise a highly accurate computational approach to predict coupling from sequence, which outperforms previous methods. The dataset, prediction method, and associated analysis provides new insights into features determining specificity, which we used to design the first G12-specifc engineered (chemogenetic) receptors that respond to a synthetic ligand.
RESULTS
Gq/11- and G12/13-Dependent TGF-α Shedding Responses
To evaluate G-protein coupling, we exploited a TGF-α shedding assay (Figure 1A), which we showed previously to be a robust, high-throughput means to measure accumulated GPCR signals (Inoue et al., 2012). In the assay, we detect ADAM17-induced ectodomain shedding of alkaline phosphatase-fused TGF-α (AP-TGF-α) and subsequent release into conditioned media. We previously observed that Gq/11- or G12/13-coupled receptors induce this process (Inoue et al., 2012), which we first tested using a panel of HEK293 cells lacking one or both of the Gq/11 and the G12/13 subfamilies (hereafter denoted as ΔGq, ΔG12 and ΔGq/ ΔG12; Figure 1A) (Devost et al., 2017; Schrage et al., 2015). We tested GPCRs (Figure 1B) that are reported to couple with either Gq/11 (CHRM1 and HRH1 [Harding et al., 2018]) or G12/13 (LPAR6 and PTGER3 [Kihara et al., 2014; Sugimoto and Narumiya, 2007]) or both (GALR2 and GHSR [Harding et al., 2018]). TGF-α shedding responses of the Gq/11-coupled receptors and the G12/13-coupled receptors were diminished in ΔGq and ΔG12 cells, respectively, while the responses were retained in cells lacking uncoupled G proteins. In the receptors coupling to both, the TGF-α shedding responses remained in ΔGq and ΔG12 cells. For all tested GPCRs, TGF-α shedding responses were completely abolished in ΔGq/ΔG12 cells nor could Gs- or Gi/o-coupled receptors induce TGF-α shedding responses (Data S1, Gαq (ΔC) conditions). Small interfering RNA (siRNA)-mediated knockdown experiments in the parental HEK293 cells confirmed involvement of Gq/11 and G12/13 in the TGF-α shedding response (Figure S1). Thus, this is clear evidence that the TGF-α shedding assay selectively measures Gq/11 and/or G12/13 signaling.
Figure 1. Chimeric G-Protein-Based TGF-α Shedding Assay to Probe Interaction between an Active GPCR and a C-Terminal Tail of a Gα Subunit.

(A) Mechanism of the TGF-α shedding assay. Gq/11- and/or G12/13-coupled receptors induce activation of a membrane-bound metalloprotease ADAM17, which is endogenously expressed in HEK293 cells, and subsequent ectodomain shedding of the alkaline phosphatase-fused TGF-α (AP-TGF-α) reporter construct. AP-TGF-α release into conditioned media is quantified through a colorimetric reaction. Parental HEK293 cells and cells devoid of the Gαq/11 subunits (ΔGq), the Gα12/13 subunits (ΔG12), or the Gαq/11/12/13 subunits (ΔGq/ΔG12) were used in the TGF-α shedding assay.
(B) Blunted TGF-α shedding response in the HEK293 cells devoid of the Gq/11 and the G12/13 subfamilies. GPCRs known to couple with G12/13 (LPAR6 and PTGER3), Gq/11 (CHRM1 and HRH1), and both (GALR2 and GHSR) were examined for ligand-induced TGF-α shedding responses in the parental HEK293 cells or the indicated G-protein-deficient cells. Symbols and error bars represent mean and SEM, respectively, of 3–6 independent experiments with each performed in triplicate.
(C) Chimeric G-protein-based TGF-α shedding assay in ΔGq/ΔG12 cells. A test GPCR is expressed in ΔGq/ΔG12 cells together with one of 11 chimeric Gα subunits harboring C-terminal 6-amino acid substitution and restoration of ligand-induced AP-TGF-α release response is measured. Note that there are 11 unique C-terminal sequences for the 16 human Gα subunits (the C-terminal 6-amino acid sequences of Gαi1, Gαi2, Gαt1, Gαt2, and Gαt3 and those of Gαq and Gα11 are identical; also see Figures S2A–S2C) and that the invariant leucine is encoded at the −7 position. The C-terminally truncated Gαq construct (Gαq (ΔC)) is used fora negative control.
(D) Representative data for the chimeric G-protein-based assay. TBXA2R was expressed with one of the 11 Gαq constructs or the Gαq (ΔC) and treated with titrated concentration of a ligand (U-46619). AP-TGF-α release responses were fitted to a sigmoidal concentration-response curve (upper panels). G-protein coupling is scored as logarithmic values of relative intrinsic activity (RAi), which is defined as a relative Emax/EC50 value normalized by the highest value. Symbol size is proportional to Emax, which reflects fitting quality. During data processing, a concentration-response curve that failed to converge or had an Emax value of less than 3% AP-TGF-α release, or a RAi value of less than 0.01 was defined as LogRAi value of −2. Data for the concentration-response curves are from a representative experiment (mean ± SD of triplicate measurements). Each LogRAi plot denotes a single experiment and bars and error bars represent mean and SEM, respectively (n = 4).
See also Figures S1 and S2 and Data S1, S2, and S3.
To exclude the possibility that the blunted AP-TGF-α release signal was caused by loss of GPCR expression, we compared surface expression levels of epitope-tagged GPCRs among parental, ΔGq, ΔG12, and Gq/ΔG12 cells using a flow cytometry. All tested GPCRs (FLAG-ADRB1, FLAG-HRH1, and FLAG-DRD1) were equally expressed in the parental as well as the G-protein-knockout (KO) cells (Figure S2A).
Chimeric G-Protein-Based Signaling Assay
We exploited the above assay system, and the previously identified importance of the Gα subunit C-terminus, to develop the TGF-α shedding assay to assess binding of G proteins to any GPCR of interest. Specifically, we constructed chimeric Gα subunits where the native 6-amino acid C-termini of members from the Gαq/11 and the Gα12/13 families were substituted with those from other human Gα subunits (Figures 1C and S2A–S2C) and expressed them together with a test GPCR in the signaling-silenced 0394Gq/DG12 cells (Figure 1C). The resulting downstream signals measured by the TGF-α shedding assay should thus reflect the true binding events between any GPCR and its G-protein counterparts (Figure 1D).
We tested a series of chimeric Gα subunits for their ability to induce the TGF-α shedding response. Specifically, we constructed chimeric Gα subunits with the same C-terminal tail, but a different backbone (Figures S2D and S2E), using members of the Gq/11 (Gαq, Gα11, Gα14, and Gα16 subunits) and the G12/13 (Gα12 and Gα13 subunits) subfamilies. We expressed each chimeric Gα subunit (C-terminal Gαi1 or Gαs chimeras) together with a test GPCR (Gi/o-coupled DRD2 or Gs-coupled PTGER2, respectively) and stimulated the cells with an agonist. We found that the Gαq backbone was the most efficacious in inducing TGF-α shedding response (%AP-TGF-α release response) for both receptors (Figures S2D and S2E); we thus chose this backbone for all subsequent experiments.
We generated chimeric Gαq subunits for each of the 11 unique C-terminal hexapeptides, which cover all of the 16 human Gα subunits (Figures 1C and S2A–S2C; the C-terminal 6-amino acids are identical for Gαi1, Gαi2, Gαt1, Gαt2, and Gαt3; and for Gαq and Gα11), and one negative control lacking the tail (Gαq ΔC). The 11 Gαq chimeras were equally expressed in ΔGq/ΔG12 cells (Figure S2F). Transfected cells were harvested and seeded in a 96-well plate and stimulated with or without titrated concentrations of a GPCR ligand (typically, 12 points in total). AP-TGF-α release signals over titrated concentrations were fitted with a sigmoidal concentration-response curve, from which EC50 and Emax (an amplitude of ligand-induced response) values were obtained. For each chimeric Gα condition, an Emax/EC50 value was normalized by the maximum Emax/EC50 value among the 11 Gα chimeras (e.g., Gαq C terminus for TBXA2R; Figure 1D). This gave a relative, dimensionless Emax/EC50 value (relative intrinsic activity, RAi [Ehlert et al., 1999]), which was then base-10 log-transformed (LogRAi) and used as G-protein-coupling indices. With our pre-determined threshold criteria (STAR Methods), LogRAi ranged from −2 to 0 (100-fold in linear range). The assay produced robust, reproducible results as evidenced by well-clustered plots across independent experiments (Figure 1D; Data S1). By using a similar approach (restoration of a chimeric Gα subunit in G-protein-KO cells), we performed a Gs-based cAMP assay in Gs-deficient (ΔGs) HEK293 cells and confirmed that LogRAi values obtained from the Gαs backbone and the Gαq backbone were well correlated in prostanoid receptors (Figures S2I–S2K; Data S2; r2 = 0.74 ± 0.16, n = 7), which show distinct G-protein-coupling profiles (Sugimoto and Narumiya, 2007; Woodward et al., 2011).
As above, we measured cell-surface expression of GPCRs by flow cytometry to exclude GPCR expression level effects (Figure S1F). Except for a modest increase in the conditions with the chimeric Gαq/13 co-expression, expression levels of N-terminal FLAG epitope-tagged GPCRs (FLAG-ADRB1 and FLAG-HRH1) were almost equal among cells co-expressing any of the Gα chimeras.
The NanoBiT-G-Protein Dissociation Assay
To complement the chimeric G-protein-based TGF-α shedding assay, we established an additional assay in which dissociation of the Gα subunit from the Gβγ subunits, a critical process of G-protein activation, is measured via a luciferase complementation system. Bioluminescence resonance energy transfer (BRET) between a Renilla luciferase-inserted Gα subunit and a GFP10-fused Gβ or Gγ subunit was previously developed to measure Gα-Gβγ dissociation (Galés et al., 2005). Here, we replaced the BRET pair with a split luciferase (NanoLuc Binary Technology; NanoBiT) (Dixon et al., 2016). Specifically, we inserted a large fragment (LgBiT) of the NanoBiT into the helical domain (between the αA and the αB helices) of a Gα subunit (Gα-Lg) and fused a small fragment (SmBiT) to the N-terminus of Gβ or Gγ subunit (Sm-Gβ or Sm-Gγ) (Data S3). We confirmed that Gαs-Lg retained a Gs signaling function by measuring adenylyl cyclase-activating activity in ΔGs cells upon Gs-coupled-receptor stimulation (Figures S2G and S2H). We generated a series of Gα-Lg, Sm-Gβ, and Sm-Gγ subunits (Data S3) and optimized a combination (STAR Methods). When expressed together in cells, these constructs form a heteromer possessing a complemented enzyme, whose luciferase activity is measurable upon loading with coelenterazine (CTZ), a substrate of the luciferase (Figure S3A). GPCR ligand stimulation triggers dissociation of Gα-Lg from Sm-Gβ/Gγ, making the real-time dissociation response detectable (Figure S3B). The NanoBiT-G-protein assay demonstrated highly reproducible dissociation signals across independent experiments and was minimally affected by preincubation time with CTZ (Figure S3F). Comparison of NanoBiT-G-protein dissociation signals with the chimeric G-protein-based assay for eight prostanoid receptors showed a moderately strong correlation (r2 ≥ 0.5) across all of the four G-protein subfamilies (Figures S3F and S3G).
Ligand Biased G-Protein Signaling
Since the chimeric G-protein-based assay recognize a ligand-activated conformation of a GPCR, we assessed whether it could also detect ligand bias among different G-protein subfamilies. An angiotensin II (Ang II) analog, [Sar1, Ile4,8]-Angiotensin II (SII), was shown to induce Gi/o over Gq/11 as compared with Ang II in cells expressing AGTR1 (Saulière et al., 2012). We performed the assay using Ang II and SII (Figure S1G) and calculated coupling scores for Ang II-induced LogRAi and SII-induced LogRAi (Figure S1H). If SII behaves as a balanced agonist across G proteins, LogRAi plots obtained from Ang II and SII would be linearly aligned. Our results recapitulated the Gi-bias of SII (Saulière et al., 2012) and further showed that SII was biased toward G12 over Gq as compared with the reference ligand (Ang II). These findings were backed up by the NanoBiT-G-protein assay (Figure S11).
Hundreds of Known and New Couplings
Using the chimeric G-protein-based assay, we profiled coupling across 148 human GPCRs (Figure 2; Tables S1A and S1B), which represent ~80% of liganded class A GPCRs. Whenever possible, we used endogenous ligands; when ligands were unstable (e.g., thromboxane A2 for TBXA2R) and/or endogenous ligands were not yet identified, we chose available synthetic ligands (U-46619 for TBXA2R and MDL29951 for GPR17).
Figure 2. Signatures of G-Protein Coupling Determined by the Chimeric G-Protein-Based Assay.

Heatmap of the LogRAi values for the 148 receptors of the chimeric G-protein-based assay. Cell colors range from blue (LogRAi = −2) to red (LogRAi = 0). Receptors and G proteins are rearranged according to the dendrogram of the full linkage clustering of the distance matrix calculated from the coupling profiles. Receptor gene symbols are colored according to family membership as reported in GtoPdb.
We compared coupling data from the chimeric G-protein-based assay with that of GtoPdb. For each of the four G-protein subfamilies, we defined positive coupling if any member of the subfamily scored LogRAi ≥ −1 and negative coupling if all of the members scored LogRAi < −1 (Figures 3A and 3B). Receiver operating curve (ROC) analysis gives area under the curve (AUC) = 0.78 (Figure S4A) when considering high-confidence known coupling data and suggested a threshold of LogRAi ≥ −1.0 (optimizing true positive rate [TPR] while minimizing false positive rate [FPR]; STAR Methods; Table S1D) for defining true couplings. The assay also showed other broad similarities to GtoPdb, including Gi/o being the most common, and G12/13 the least (Figures 3C and 3D). We also recapitulated that the majority of receptors coupled to only one G-protein, which does not change greatly with altered LogRAi thresholds (Figure S4C), though as expected there is greater coupling promiscuity at lower values. In addition, both GtoPdb and our data (at various LogRAi stringencies) suggest Gi/o subunits to be the most specific, always displaying the highest fraction of exclusively bound receptors, with G12/13 being the most promiscuous (Figures 3C, S4B, and S4D). A total of 39 promiscuous receptors are reported to couple to members of all four G-protein families (Figure 4C); however, promiscuity decreases as a function of the LogRAi threshold (Figures S4E and S4F). Overall, the dataset shows an excellent agreement with known couplings (Figure 3D), with more than 88% of reported couplings reproduced for three classes (i.e., Gi/o, Gq/11, and G12/13).
Figure 3. Comparison of G-Protein Coupling between the Chimeric G-Protein-Based Assay and GtoPdb, and Validation of G12/13 Signaling for the Newly Characterized GPCRs.

(A) Classification of the LogRAi scores and its comparison with GtoPdb. An example heatmap of LogRAi scores for the eight prostanoid receptors is shown, with a LogRAi cutoff of −1 to binary-classify the data into coupled (red-to-white; Y) or uncoupled (blue-to-white) classes. G-protein coupling from GtoPdb (subfamily levels) is overlaid.
(B) Combined binary coupling/non-coupling data for each of the four G-protein subfamilies.
(C) Venn diagrams with the numbers of receptors coupled to each G-protein subfamily in the chimeric G-protein-based assay (LogRAi ≥ −1).
(D) Venn diagrams of receptor couplings to the four G-protein families according to the chimeric G-protein-based assay (LogRAi ≥ −1)and GtoPdb.
(E) GPCRs that were identified as being coupled with G12/13 by the chimeric G-protein-based assay were examined for their ability to engage and activate native, endogenous G12/13 in HEK293 cells. A test GPCR was expressed in the parental, ΔGq, ΔG12, and ΔGq/ΔG12 cells along with the AP-TGF-α reporter construct, but not with a chimeric Gα subunit, and its ligand-induced response was assessed. Note that, in all of the tested GPCRs, AP-TGF-α release response occurred in ΔGq cells but was completely silenced in ΔGq/ΔG12 cells, showing induction of G12/13 signaling. Symbols and error bars represent mean and SEM, respectively, of 3–6 independent experiments with each performed in triplicate.
See also Figures S4 and S5 and Tables S1.
Figure 4. Development of G-Protein-Coupling Predictor.

(A) Workflow of the procedure: features are extracted from sub-alignments of coupled and uncoupled receptors to a particular G protein; features are used to generate a training matrix, which is employed to train a logistic regression model through a 5-fold cross-validation procedure.
(B) The final model is tested on reported couplings not previously seen during training and compared to PredCouple.
(C) Highly confident predicted couplings (coupling probability >0.9) for 61 class A GPCRs lacking information about transduction from both GtoPdb or the chimeric G-protein-based TGF-α shedding assay (black) versus receptors with experimental coupling information (gray).
As seen in previous studies (Flock et al., 2017; Horn et al., 2000; Rodriguez et al., 2010), we found no correlation between sequence and coupling similarities, either performing pairwise comparisons on the whole set or intra-family (Figures 2 and S4G). Moreover, both extremes are evident: receptor pairs with low sequence similarity can have similar couplings and close homologs from the same family can show large differences (see prostanoid receptors; Figures 3A and 3B). Our exploration of 11 distinct G proteins also reveals key differences among G-protein subfamilies in terms of their coupling preferences, which essentially reflects sequence similarity of the last 6 C-terminal amino acids (Figures 2 and S2C). For instance, several receptor families show overall coupling preferences for specific classes, like Opioid and Dopamine receptors for Gi/o, or Prostanoid and Adrenoceptors for Gs; in contrast others show more coupling promiscuity, like Endothelin, Ghrelin, and Proteinase-activated receptors (Figure 2; Data S1). The great utility of our dataset is immediately clear. There are entire groups of poorly annotated (in GtoPdb) receptors that are well represented in our dataset, including ten GPCRs (Table S1C) such as protease-activated receptors and P2Y receptors (P2RY10 and P2RY12), where the latter is a major target of antiplatelet agents, with roles in platelet aggregation (Dorsam and Kunapuli, 2004) and bleeding disorders (Patel et al., 2014). While P2RY10 displays specificity for both the Gi/o and the G12/13 subfamily members, we find P2RY12 to be specific for Gi/o (Tables S1B and S1C). Elsewhere, GPR132, recently emerged as a mediator of breast carcinoma metastasis (Chen et al., 2017), shows a previously unreported coupling promiscuity (Table S1B).
In general, more than half of the couplings detected (160/292, 55%) have not previously been reported (Figure 3D). As expected, the biggest proportion of new couplings are G12/13 where our data make up 57% of all known couplings of this type (15 out of 26 reported G12/13 couplings in GtoPdb, which also considers non-class A GPCRs). To validate that newly identified G12/13 couplings indeed reflect capability of endogenous G12/13 activation, and not artifacts of chimeric Gα subunit overexpression, we assessed TGF-α shedding responses in ΔGq cells (Figures 1A and 1B). We tested eight GPCRs (AGTR1, CNR1, EDNRA, F2RL2, PTGER1, PTGFR, TACR1, and TBXA2R), in which G12/13 coupling was not registered in GtoPdb but was detected by the chimeric G-protein-based assay. We found that all of them induced TGF-α shedding responses in ΔGq cells and that the signals were completely silenced in ΔGq/ΔG12 cells (Figure 3E). To assess a more proximal signaling event to G12/13 activation, we generated a NanoBiT-RhoA sensor (Figures S5A–S5C; STAR Methods) and found that all of tested GPCRs that were newly identified as G12/13-coupled receptors (Figure 3E), when overexpressed in HEK293 cells, induced RhoA activation (Figure S5D). We also found that thrombin activated RhoA, presumably by activating its receptors (F2L, F2RL2, and/or F2RL3) that were endogenously expressed in PC-3 and MDA-MB-231 cells (Figure S5E). In HN12 cells and Cal27 cells, a RhoA pull-down assay showed that CP-55940 (CP; likely via CNR1, but not CNR2; Figure S5E) and Ang II induced activation of RhoA (Figure S5F). Together, these data demonstrate that the G12/13-coupled receptors identified by the chimeric G-protein-based assay induce RhoA activation at both overexpression and endogenous expression levels.
To test whether apparent unchanged TGF-α shedding responses in ΔG12 cells as compared with those in the parental cells (AGTR1 and EDNRA) arose from enhanced or compensated Gq/11 signaling in ΔG12 cells, we analyzed G-protein expressions and performed a Ca2+ mobilization assay and a NanoBiT-IP3 assay (Figure S6; STAR Methods), both of which selectively measure Gq/11 signaling (Figures S6C and S6F). Expression levels of Gαq and Gα11 were unchanged in ΔG12 cells, nor was that of Gα13 in ΔGq cells (Figure S6A). Both Ca2+ and IP3 responses in ΔG12 cells were comparable to those in the parental cells (Figures S6C and S6G). Thus, TGF-α shedding responses in ΔG12 and ΔGq cells are an accurate reflection of Gq/11 and G12/13 signaling.
Sequence Features Indicative of Coupling Specificity
We used a statistical model to identify sequence features associated with each of the eleven couplings determined above (all details given in STAR Methods). Briefly, we used sequence alignments for each coupling group to define residues and more general compositional features (e.g., C-terminal or IC3 length, charge distributions, etc.) found to be statistically associated to coupling for each G protein. These were used to train and test a machine learning (Logistic regression) predictor (Figure 4A) and identify the features most predictive for each G protein.
Our predictor performs better than another available approach (PredCouple) (Sgourakis et al., 2005a) in predicting known couplings not used during training for all coupling groups, but particularly for G12/13, which is expected since few data were available to train such predictors previously (Figure 4B; Tables S2A and S2C). Note that same predictor trained only with known couplings from GtoPdb (Harding et al., 2018) performed worse (Figure 4B; Table S2D) as might be expected. Using a stricter LogRAi cutoff to define coupling groups led to a general decrease in performance during the testing phase, except for Gi/o (Figures S7A–S7C). The poorer performance, for the Gs subfamily, which also shows a poorer overlap between the chimeric G-protein-based assay and GtoPdb (Figure 3D), is probably a consequence of the fact that the chimeric system does not capture all sequence determinants emerging for Gs coupling (Carpenter et al., 2016; García-Nafria et al., 2018a; Rasmussen et al., 2011). Nevertheless, this tool can be exploited to illuminate the transduction mechanisms of less-characterized receptors. Indeed, for the 61 receptors (21% of 286 class A GPCRs) lacking coupling information from either GtoPdb or the chimeric G-protein-based assay (Table S1C), we predict a prevalence of Gs followed by Gq/11 and G12/13 couplings, the latter contrasting with the smallest fraction among experimental couplings (Figure 4C; Table S2E). For example, P2RY8 is readily predicted to be coupled to G12/13 (Table S2E), being consistent with a report of mutual exclusive mutations in lymphomas between the P2RY8 and the GNA13 genes, which implies a putative functional link (Muppidi et al., 2014).
The model identified different combinations of sequence features important for each coupling group (Figure 5). After training, different weights are assigned to each feature in the logistic function to achieve optimal prediction performances, thus highlighting the most relevant determinants for each coupling (Figure 5; STAR Methods). Significant features are more abundant at the cytosolic side of the receptor (Figures 6A and 6B; Table S3A) including many at the known G-protein-binding interface (e.g., transmembrane helix 3 [TM3], TM5, TM6, and intracellular loop 3 [ICL3]), but also within the core of the structure, mainly contributing to a contact network (Venkatakrishnan et al., 2016) and could thus mediate specific conformational differences required to accommodate a particular G-protein (Figure 6).
Figure 5. Featured Residues in GPCRs Involved in G-Protein-Coupling Selectivity.

(A) Comparison of significant coupling features weights for the 11 G proteins (bottom), interface contacts of 6 available GPCR-G-protein complexes (central) and 7TM domain position conservation (top). On the bottom panel are all the features (columns) that are found to be statistically significant (p < 0.05) for at least one coupling group (rows). Each cell is colored based on coefficient of the given feature in the decision function of the corresponding coupling group (i.e., weight), with negative and positive values colored red and green respectively. Coupling features at 7TM domain with significantly different amino acid distributions are characterized by two values, representing the weights of the bitscores obtained from the coupled (top sub-cell) and not coupled (bottom sub-cell) hidden Markov modes (HMMs) for each G protein. Insertions (i.e., positions present only in the coupled subset) or deletions (i.e., positions present only in the uncoupled subset) are indicated with a gray “+” and “−.” Black/gray boxes in the center show contacts mediated by the last 6 amino acids of C-terminal helix 5 of Gα subunits (black) and contacts mediated by the other positions of Gα subunits (gray). Top bars shows conservation profiles for PFAM 7tm_1 positions obtained by calculating the information content from HMM positions bit scores (Wheeler et al., 2014).
(B) 2D cartoons of the 7TM topology indicating the regions contributing to the features. ICL, intracellular loop; ECL, extracellular loop; TM, transmembrane helix.
(C) Significant coupling feature weights for the 11 G proteins (same color codes as in A) of extra-7TM features of ICL3 and C terminus, including length and amino-acid composition.
See also Figures S4 and S7 and Table S3.
Figure 6. Functional Analysis of Residues Linked to Coupling Selectivity.

(A) Upper panel: distribution of coupling feature fractions for extra- and intra-7TM portions. The formers comprise the 7TM helical bundle only, while the latters include the N and C termini, extra- and intra-cellular loops (ECLs and ICLs); lower panel: distribution of the coupling feature fractions within transmembrane sectors (i.e., EC, extracellular; TM, transmembrane; IC, intracellular). Extra- and intracellular portions are defined by ECL and ICL regions plus 5 helical positions preceding and following them (see Tables S3A and S3C).
(B) Distribution of the fractions of coupling significant features outside of the 7TM bundle.
(C) Distribution of coupling feature fractions (relative to the total number of positions of the same class) within functional sites (i.e., mediating either ligand/G-protein binding or intra-molecular contacts).
(D) Graph representing intra-molecular contacts within 7TM helices. Each helix is represented by a node, whose diameter is proportional to the number of helix positions mediating contacts in the contact network derived from active-like structures and whose color (red scale) is proportional to the number of significant coupling features present in the corresponding region. Edges represent contacts between 7TM helices, where width is proportional to the number of contacts in the active-like contact network, while color scale (gray) is proportional to the similarity degree (calculated as a Jaccard index) between contacts mediated in the active- and inactive-like contact networks.
(E) 3D cartoons of the ADRB2-GNAS complex (PDB: 3SN6) (Rasmussen et al., 2011) with side chains of coupling features at G-protein-binding sites depicted as red surfaces. Network drawings were done through Cytoscape (https://cytoscape.org/). A representative coupling feature at intra-molecular contacts sites (i.e., position 3.40) is depicted as a red sphere mediating one of the shortest paths linking the ligand and G-protein-binding pockets (wheat sticks and spheres). The ligand and GNAS (Gαs) are depicted as cyan and pale-yellow surfaces, respectively. 3D drawing was generated through pymol (https://pymol.org/).
Surprisingly, only a few significant positions (12 of 51 or 23%) overlap with residues lying directly at known GPCR/G-protein interfaces (Figures 5A and 6C; Table S3A). These include ICL3, TM5, and TM6 positions associated with Gi/o missing from Gs (e.g., 5.61, ICL3:174, 191–194) that are likely responsible for specificity (Draper-Joyce et al., 2018; García-Nafria et al., 2018b). Several other positions (11, 21%) are immediately adjacent to direct contacts, suggesting they could nevertheless affect these interfaces (Table S3B). This is logical as some of the contacting positions are typically highly conserved across GPCRs (e.g., the DRY or NPxxY motifs). Overall, the majority (or 90%) of significant positions within the 7TM bundle mediate intra- or inter-protein contacts with either G proteins or ligands. The majority of significant positions (29, 57% of the total) appear to mediate active-like state specific intramolecular contacts, which we uncovered by comparing functional state specific contact networks (i.e., active-like and inactive-like) from three-dimensional (3D) structures (Figures 6C–6E, Tables S3A and S3B; STAR Methods). Helices TM3, TM5, and TM6 undergo major rewiring of their intramolecular contacts upon receptor activation and display the highest content of significant coupling features in the active-like network (Figure 6D). This further stresses their role as master regulators of receptor activation and G-protein recognition (Koehl et al., 2018). Residues previously described as universal mediators of receptor activation (Venkatakrishnan et al., 2016) participate to this network as either endpoints (6.37) or mediators (3.46 and 7.53) of the shortest paths linking the ligand and G-protein-binding pockets (Figures S7D and S7E; Table S3B; STAR Methods).
Several other features lie within regions outside the 7TM bundle, particularly in the ICL3 or C-terminal regions (Figures 5C, 6A, and 6B), that are not usually visible in experimental structures (with the exception of ICL3 in some Gi/o complexes), but which nevertheless play critical roles in signaling (Venkatakrishnan et al., 2014). There is broadly an equal contribution of positions from within or outside of the 7TM bundle across all families, with a greater prevalence of the outside positions for the G12/13 subfamily (Figures 6A and 6B).
Data-Driven Design of a G12-Specific DREADD
The prominent roles for ICL3, and to a lesser extent the C terminus, for G12/13-coupled receptors, where length and electrostatic charge are predicted to be important for coupling (Figures 5B and 5C), together with the lack of structure and tools for probing G12/13 signaling prompted us to develop a new chemogenetic receptor for studying G12/13 coupling. DREADDs are engineered receptors that permit spatial and temporal control of G-protein signaling in vivo, being thus of great use in studying and manipulating signaling (Urban and Roth, 2015; Wess et al., 2013). DREADDs derived from the muscarinic acetylcholine (ACh) receptors are widely used in combination with clozapine N-oxide (CNO), a synthetic, biologically inert ligand. To date, DREADDs coupling to Gs, Gi/o, and Gq/11 (M3D-Gs, M4D, and M3D, respectively) have been developed (Armbruster et al., 2007; Guettier et al., 2009), but there is not yet a G12/13-coupled DREADD available, which we sought to design using our predictor.
The design of M3D-Gs involved a strategy of substituting both ICL2 and ICL3 of the Gq/11-coupled M3D with those of Gs-coupled β1AR (Guettier et al., 2009). In our analysis, a major feature contributing to G12/13 coupling was ICL3, followed by the C-terminal tail (Figures 5C and 6B). We thus explored whether these features would be sufficient to induce such signaling in M3D. We first predicted the probability of G12 coupling for M3D chimeras containing ICL3 swapped from all other GPCRs alone or in combination with C-terminal stretches (Figures 7 and S7F). Among all possible GPCR constructs (144 ICL3-swapped chimeras and 144 dual ICL3/C terminus chimeras), we selected the top 10 predictions of each chimera type (13 GPCRs in total by excluding overlaps and selecting representative constructs when multiple members from one GPCR were predicted) leading to 26 constructs (Figure 7A). We functionally screened G12-coupling activity of the M3D-based chimeras using two assays. In the first, the chimera construct was expressed together with the AP-TGF-α reporter in ΔGq cells, in which G12 signaling is selectively detectable (Figure 3E). We measured TGF-α shedding response upon CNO or ACh stimulation. Among the 26 constructs screened, chimeras with the GPR183-derived ICL3 substitution (M3D-GPR183/ICL3) and the GPR132-derived ICL3 substitution (M3D-GPR132/ICL3) showed significant G12 signaling (p values <0.05) (Figure 7B). ACh did not induce detectable G12 signaling in any of the tested constructs (Figure 7B). In the second assay, the chimera construct was expressed together with NanoBiT-G12 (in combination with Sm-Gγt1) in the parental HEK293 cells and stimulated with CNO. As a counter experiment, we used NanoBiT-Go since our preliminary experiment indicated a minor coupling of some chimeras to Go. NanoBiT-G12 screening identified four constructs (M3D-GPR183/ICL3, M3D-GPR132/ICL3, M3D-P2RY10/ICL3, and M3D-NMBR/ICL3) that were significantly (p < 0.05) coupled to G12 and not to Go (Figure 7C). One construct (M3D-LTB4R2/ICL3) induced both G12 and Go coupling with a higher Go dissociation signal. In both assays, dually swapped ICL3/C-terminus chimeras showed negligible G12 signaling, which was in part attributable to lower surface expression of these constructs (Figure 7D).
Figure 7. Generation of G12-Coupled Designer GPCRs.

(A) Scheme of generating and assessing ICL3 or ICL3/C terminus-swapped constructs from Gq/11-coupled M3D. Based on the predictor scoring of 288 constructs from 144 GPCRs (Figure S7F), we selected 13 GPCRs and made 26 constructs.
(B–D) Functional screening of M3D-derived chimeric constructs. G12 signaling of the constructs assessed by the TGF-α shedding assay in the ΔGq cells treated with 10 μM clozapine N-oxide (CNO) or10 μM acetylcholine (ACh) (B). Activation of G12 and Go was measured by the NanoBiT-G-protein dissociation assay with 10 μM CNO (C). Gα12-Lg or Gαo-Lg was co-expressed with Sm-Gγt1 (Data S3). Changes in decreased luminescent signals are inversely plotted in the y axis. (C). Surface expression of the M3D-derived chimeric constructs was assessed by a flow cytometry using an anti-FLAG epitope-antibody, followed by a fluorescently labeled secondary antibody (D). Symbols and error bars represent mean and SEM, respectively, of 4–8 independent experiments with each performed in duplicate or triplicate. *p < 0.05; **p < 0.01; ***p < 0.001 (two-way ANOVA, followed by Sidak’s multiple comparison tests).
(E) Lack of G13 activation by the new DREADD constructs. Dissociation signals of the NanoBiT-G13 protein were assessed by using 10 μM CNO (M3D-GPR183/ICL3 and M3D-GPR132/ICL3) and 1 μM U-46619 (TBXA2R). Symbols and error bars represent mean and SEM, respectively, of 3–11 independent experiments with each performed in duplicate.
(F) Concentration-response curves for G-protein activation by DREADD constructs. Previously established DREADDs (Gq/11-coupled M3D, Gi/o-coupled M4D, and Gs-coupled M3D-Gs) and the newly generated DREADDs (M3D-GPR183/ICL3 and M3D-GPR132/ICL3) were profiled for their G-protein coupling using representative members (Gs, Gi1, Gq, and G13) of the 4G-protein subfamilies. Symbols and error bars represent mean and SEM, respectively, of 3–12 independent experiments with each performed in duplicate. For each DREADD, parameters for the most efficaciously coupled G protein are shown in bottom of the panel. See also Figure S7.
We then evaluated selectivity of G-protein coupling for the two candidate constructs using the NanoBiT-G-protein dissociation assay with titrated CNO concentrations. As controls, we compared with previously established muscarinic DREADDs (M3D, M4D, and M3D-Gs) (Armbruster et al., 2007; Guettier et al., 2009). We tested representative NanoBiT-G-proteins (Gs, Go, Gq, and G12) from the four subfamilies. The NanoBiT-G-protein assay correctly measured primary coupling of the three established DREADDs (M3D, M4D, and M3D-Gs for Gq, Go, and Gs, respectively; Figure 7E). M3D-GPR183/ICL3 and M3D-GPR132/ICL3 constructs showed robust G12 dissociation signals, while dissociations of the other G-proteins were much lower than those of G12. None of the DREADD constructs induced significant NanoBiT-G13 dissociation (Figure 7E). The EC50 values of CNO for each primary-coupling G-protein were in a submicromolar range (0.1–1 μM) for all of the DREADDs (Figure 7F). Thus, the constructs M3D-GPR183/ICL3 and M3D-GPR132/ICL3 are new G12-selective DREADDs.
DISCUSSION
The extensive dataset provided here greatly expands known GPCR/G-protein couplings and provides better resolution by considering all 11 specific human G proteins rather than subfamilies. The assays, the resource, and accompanying predictor (available at http://gpcr.russelllab.org/) can be used for a host of biological and pharmaceutical applications. For example, the TGF-α shedding assay, applied to AGTR1, demonstrates the promise to develop sub-G-protein-biased ligands (i.e., discriminating one G-protein signaling from another), which have recently attracted attention because of their potential for therapeutic-signal-targeted medicine with reduced on- target side effects (Violin et al., 2014). Most importantly, the extensive dataset provides the first coupling information for many receptors (e.g., protease-activated or P2Y receptors), shows differences in G proteins in the same family (e.g., prostanoid receptors), and, in particular, identifies dozens of receptors coupled to the previously understudied G12/13 (Rho signaling).
The G12/13 subfamily remains challenging to study owing to lack of well-established methods for assessing signaling. The TGF-α shedding assay combined with ΔGq cells is an excellent platform for selective measurement of G12/13 signaling with high robustness and throughput and in the future will enable precise characterization of receptors and their ligands. Other assays developed in this study (the chimeric G-protein-based TGF-α shedding assay, the NanoBiT-G-protein dissociation assay and the NanoBiT-RhoA sensor) will also be useful for cross-validating results. G12/13 signaling is also implicated in immune processes and various diseases (Herroeder et al., 2009; Suzuki et al., 2009), including receptors S1PR2 and P2RY8 in B cell lymphoma (Muppidi et al., 2014; O’Hayre et al., 2016). Agonists for G12/13-coupled receptors in lymphocytes can attenuate immune responses and antagonists could potentially boost them, both of which offer attractive possibilities for future therapies. A list of the expanded members of G12/13-coupled receptors identified here will provide a basis for such drug development. Indeed, some of our newly identified G12/13-coupled GPCRs (e.g., CNR1, FFAR1, GHSR, GPR35, HRH2, HTR2C) are already targets for agonists approved as therapeutics (Hauser et al., 2017), suggesting additional possibilities for drug repurposing. Transgenic mice expressing our new G12-coupled DREADD could help to explore G12 signaling and ultimately develop such therapies.
Integrating this large GPCR/G-protein dataset with information about protein sequence and structure has identified numerous insights into how receptors selectively interact with G proteins. Several recent structures have provided insights into the complex landscape governing GPCR coupling specificity, which is complicated by multiple factors including conformational plasticity, kinetics, ligand biasing, and G-protein pre-association (Capper and Wacker, 2018). While previous efforts successfully identified sequence and structural features that determine coupling selectivity in G proteins (i.e., the barcode) (Flock et al., 2017), a systematic identification of receptor determinants is still lacking (Flock et al., 2017; Horn et al., 2000; Wong, 2003). Our analysis identifies several features that agree with what is already known. Generally, TM3, TM5, and TM6 have the greatest number of predicted coupling features, which is partly backed up by recent biophysical (Van Eps et al., 2018) and structural studies (Carpenter et al., 2016; Draper-Joyce et al., 2018; García-Nafria et al., 2018a, 2018b; Kang et al., 2018; Koehl et al., 2018; Rasmussen et al., 2011), suggesting the importance of ICL2, TM5, ICL3, and TM6 in determining complementarity to the G-protein barcode (Flock et al., 2017).
One potential issue with the results presented here is the use of chimeric Gα subunits, where only the 6 C-terminal amino acids are used to assess ligand-induced GPCR activation. This necessarily misses contributions of the remaining (backbone) region of the Gα subunits, which are known to contribute to GPCR interaction (Carpenter et al., 2016; Draper-Joyce et al., 2018; García-Nafria et al., 2018a; Kang et al., 2018; Koehl et al., 2018; Rasmussen et al., 2011). However, the good agreement with known couplings (Figure 3D) suggests that these effects are not predominating. Moreover, relative contributions (or synergistic effects) of C terminus and backbone to coupling selectivity seem to differ among GPCRs (Figure 4A). Ultimately, an extensive G-protein-coupling dataset considering native α subunit sequences will naturally provide a more complete view of coupling determinants.
One would expect naively that coupling determinants would only lie at the interface between G proteins and receptors and that a few simple sequence changes would account for selectivity. Decades of sequence gazing have failed to find such simple explanations as have long been seen, for example, in enzyme/substrate specificity (Hannenhalli and Russell, 2000). Recent receptor/G-protein complexes suggest that additional features outside the interface, such as an internal network of polar contacts, induce a greater rigidity of TM6 and lead to a preference of Gi/o over Gs (Kang et al., 2018; Koehl et al., 2018). Many of our predicted sequence features away from the interface indeed participate in intra-molecular contact networks linking ligand and G-protein-binding sites, which broadly agrees with this notion and is supported by other contact-network analyses (Angelova et al., 2011; Venkatakrishnan et al., 2013, 2016). We speculate that these features allow allosteric and dynamic control of a G-protein-binding interface of GPCRs possibly by stabilizing a specific intermediate state of a receptor/G-protein complex. We also find a general tendency for TM5, ICL3, and TM6 insertions in Gi/o-coupled and deletions in Gs-coupled receptors, which broadly agrees with the notion that the bulkier side-chains of the Gs C-terminus can only be accommodated by larger and more flexible crevices found in Gs-specific receptors (Figure 7A) (García-Nafria et al., 2018a; Kang et al., 2018).
We predicted many G-protein-coupling features to lie outside of the 7TM bundle. For example, ICL3 contains features for G12/13 coupling, the importance of which is verified by the successful generation of ICL3-swapped DREADDs. G12/13 is the receptor class where we predict the smallest number of significant features overlapping with G-protein interface residues (Figures 5A and 6C) and the greatest fraction of features outside the 7TM bundle, particularly in ICL3 (Figure 6A). Since the ICL3 is typically disordered (i.e., lacks a pre-defined structure), it is possible that the fewer specific couplings observed for G12/13 receptors (Figure 3C) are a consequence of the lack of well-defined contact points in the receptor structure. Since (non G12/13) G-protein/GPCR complex structures show limited but nevertheless G-protein-class-specific interactions between ICL3 and flanking amino acid residues (i.e., TM5/ICL3 for Gs and ICL3/TM6 for Gi/o complexes; Figure 5A), we speculate that G12/13 receptors might also engage in ICL3 and Helix 5 in the Gα subunit-specific interactions that are likely different from Gs or Gi/o (or that an ICL3-Helix 5 interaction occurs during an intermediate state).
This study has demonstrated the power of integrating a new, powerful assay with systematic data analysis to provide new insights in molecular mechanism. With the extensive analysis, we devised both biological and computational tools that will advance understanding of how cells respond to extracellular signals. Integrating our resource with other datasets, such as genomic sequencing, transcriptomics, proteomics, metabolomics, and/or by considering other members of GPCRs mediated pathways, will provide new means to quantify downstream signaling in normal and pathological conditions and provide considerable possibilities for new therapies and personalized medicine.
STAR★METHODS
CONTACT FOR REAGENT AND RESOURCE SHARING
Further information and requests for resources and reagents should be directed to and will be fulfilled upon reasonable request by the Lead Contact, Asuka Inoue (iaska@tohoku.ac.jp).
EXPERIMENTAL MODEL AND SUBJECT DETAILS
Cells and transfection
HEK293A cells (Female origin; Thermo Fisher Scientific) and their derivative G-protein-deficient HEK293 cells were maintained in Dulbecco’s Modified Eagle Medium (DMEM 2, Nissui Pharmaceutical) supplemented with 10% fetal bovine serum (GIBCO, Thermo Fisher Scientific) and penicillin-streptomycin-glutamine (complete DMEM). Generation and characterization of the ΔGq HEK293 cells, in which null mutations were introduced into the GNAQ and the GNA11 genes by a CRISPR-Cas9 system (Schrage et al., 2015) and thus their functional products are lacking, the ΔG12 HEK293 cells (lacking functional products of the GNA12 and the GNA13 genes), the ΔGq/ΔG12 HEK293 cells (lacking those of the GNAQ, the GNA11, GNA12 and the GNA13 genes) (Devost et al., 2017) and the ΔGs HEK293 cells (lacking those of the GNAS and the GNAL genes) (Stallaert et al., 2017) were described previously. The cells were regularly tested for mycoplasma contamination using a MycoAlert Mycoplasma Detection Kit (Lonza).
Transfection was performed by using a lipofection reagent, Lipofectamine® 2000 Reagent (Thermo Fisher Scientific), or polyethylenimine (PEI) solution (Polyethylenimine “Max,” Polysciences). Typically, HEK293 cells were seeded in a 6-well culture plate at cell density of 2 × 10⁵ cells ml−1 in 2 mL of the complete DMEM and cultured for one day in a humidified 37°C incubator with 5% CO2. Seeding density for the ΔG12 cells and the ΔGq/ΔG12 cells were increased to 2.5 × 10⁵ cells ml−1 owing to slower growth of the cells than the parent HEK293 cells and the ΔGq cells. For Lipofectamine® 2000 transfection, a transfection mixture was prepared by mixing plasmid solution diluted in 250 μl of Opti-MEM (Life Technologies) and Lipofectamine® 2000 solution (2.5 μl) in 250 μl of Opti-MEM. For PEI transfection, a transfection solution was mixed by combining plasmid solution diluted in 100 μl of Opti-MEM and 4 μl of 1 mg ml−1 PEI solution in 100 μl of Opti-MEM. Both Lipofectamine® 2000 and the PEI transfection gave almost identical transfection efficiency in our culture condition. The transfected cells were further incubated for one day before subjected to an assay as described below.
MDA-MB-231 cells (female origin) and PC-3 cells (male origin) were maintained in in RPMI 1640 (Nissui Pharmaceutical) supplemented with 5% fetal bovine serum and penicillin-streptomycin-glutamine. MDA-MB-231 cells and PC-3 cells were seeded in a 10-cm culture dish at cell density of 2 × 10⁵ cells ml−1 in 10 mL of the media and cultured for one day in the incubator. Transfection was performed by using 20 μL of Lipofectamine® 2000 transfection reagent. The transfected cells were incubated for one day before subjected to the NanoBiT-RhoA assay as described below.
HN12 cells (female origin) and Cal27 cells (male origin), which were characterized as part of a head and neck cancer cell oncogenome effort (Martin et al., 2014) and obtained from this NIH cell collection, were maintained in DMEM supplemented with 10% FBS (Sigma-Aldrich).
METHOD DETAILS
Plasmids
Only human GPCRs and human Gα subunits were used in this study. An open reading frame of each full-length GPCR was cloned into pCAGGS expression plasmid (a kind gift from Dr. Jun-ichi Miyazaki at Osaka University, Japan) or pcDNA3.1 expression plasmid. Except when otherwise specified, GPCR sequences were devoid of epitope tags. The GPCRs examined for this study (148 GPCRs) originated from a previous GPCR library (109 GPCRs) (Inoue et al., 2012) and an extended list of GPCR families (39 GPCRs). In our library, we covered all of the members for selected GPCR families. We note that there are 8 GPCRs (AGTR2, GPBAR1, GPER, GPR18, HTR5A, MC2R, NPBWR2 and PTGDR2) that were unresponsive in the chimeric G-protein-based TGF-α shedding assay (data not shown) and thus were not included in the G-protein-coupling dataset.
Full-length, untagged Gα subunits were cloned into the pCAGGS plasmid. Chimeric Gα subunits, in which the C-terminal 6 amino acids were substituted, were generated with PCR-amplified fragments using synthesized oligonucleotides encoding swapped C-terminal sequences. A C-terminally truncated Gαq subunit, which lacked the 7 amino acids (note that the −7 position is identical among all of the Gα subunits), was used as a negative control for the chimeric-G-protein-based TGF-α shedding assay. Inserted sequences were verified by Sanger sequencing (Fasmac). Codon-optimized AP-TGF-α cloned into the pCAGGS plasmid was used in this study. Amino acid sequences for the AP-TGF-α construct and the chimeric Gα subunits are listed in Data S3.
M3D and M4D (Armbruster et al., 2007) were generated by introducing the two mutations (Y3.33C and A5.46G), which alter ligand specificity from ACh to CNO, in human CHRM3 (corresponding to Y149C and A239G) and CHRM4 (Y113C and A203G), respectively, by using an NEBuilder HiFi DNA Assembly system (New England Biolabs) and cloned into the pcDNA3.1 vector with N-terminal FLAG-epitope (DYKDDDDK) tag. ICL3-substituted M3D chimeras were constructed by the NEBuilder system with PCR-amplified fragments using synthesized oligonucleotides encoding swapped ICL3 sequences. Dual ICL3- and C-terminally-substituted M3D chimeras were generated by assembling PCR-amplified fragments with synthesized oligonucleotides for C-terminal sequences. The substituted ICL3 and C-terminus correspond to nucleotide positions of 778–1455 and 1633–1770 of the CHRM3 ORF. A coding sequence for M3D-Gs (Guettier et al., 2009) was human codon-optimized and gene-synthesized by Genscript and inserted into pcDNA3.1 with the N-terminal FLAG-epitope tag. Throughout the study, we used the same N-terminally FLAG-tagged DREADD constructs for functional assays and expression analysis. DNA sequences and translated amino acid sequences for the DREADDs are shown in Data S3.
For NanoBiT-G-proteins, the large fragment (LgBiT) of the NanoBiT luciferase was inserted into the helical domain of human Gα subunit (Gα-Lg) flanked by 15-amino acid flexible linkers (GGSGGGGSGGSSSGG) and the small fragment (SmBiT) was N-terminally fused to human Gβ subunit (Sm-Gβ) or human Gγ subunit (Sm-Gγ) with the 15-amino acid linker. A coding sequence for the Gα-Lg was human codon-optimized and gene-synthesized by Genscript and inserted into pcDNA3.1 plasmid. To construct a coding sequence for the Sm-Gβ and the Sm-Gγ, oligonucleotides encoding the N-terminal SmBiT-linker (Fasmac) and PCR-amplified fragment of full-length Gβ (Gβ1, Gβ3 or Gβ5) or Gγ (Gγ2 or Gγt1) were assembled by using the NEBuilder system and cloned into the pCAGGS vector. Coding sequences for untagged Gβ1 and Gγ2 were inserted into pcDNA3.1 vector. Coding sequences for RIC8A and RIC8B (isoform 2) were cloned into pCAGGS vector. Amino acid sequences for the NanoBiT-G-proteins are listed in Data S3.
For generation of the NanoBiT-RhoA sensor, we replaced firefly luciferase fragments of previously described RhoA constructs (Leng et al., 2013) with the NanoBiT fragments. Specifically, LgBiT and SmBiT were N-terminally fused to human RhoA (residues 2–193) and the GTPase-binding domain (GBD) of human PKN1 (residues 13–112), a RhoA effector, respectively, with the 15-amino acid linker. A coding sequence for RhoA and PKN1-GBD was human codon-optimized and gene-synthesized by Genscript and inserted into the pCAGGS plasmid by following a similar method as described in the NanoBiT-G-protein construction. Amino acid sequences for the NanoBiT-RhoA constructs (Lg-RhoA and Sm-PKN1) are listed in Data S3.
Similarly, to construct the NanoBIT-IP3 sensor, we exchanged firefly luciferase fragments of a previously described IP3 construct (Ataei et al., 2013) with the NanoBiT fragments. Specifically, LgBiT and SmBiT were fused to N-terminus and C-terminus, respectively, of IP3-binding core domain (IBC) of human type 2 IP3 receptor (Gene symbol ITPR2; residues 225–604), flanked by the 15-amino acid linker. A coding sequence for ITPR2-IBC was human codon-optimized and gene-synthesized by Genscript, and inserted into the pCAGGS plasmid by following the above-described method. An amino acid sequence for the NanoBiT-IP3 sensor (Lg-IP3R2-Sm) is listed in Data S3.
TGF-α shedding assay
The TGF-α shedding assay was performed as described previously (Inoue et al., 2012) with minor modifications. Plasmid transfection was performed in a 6-well plate with a mixture of 500 ng AP-TGF-α-encoding plasmid, 200 ng GPCR-encoding plasmid with or without 100 ng Gα-encoding plasmid (per well, hereafter). After 1-day culture, the transfected cells were harvested by trypsinization, pelleted by centrifugation at 190 g for 5 min and washed once with Hank’s Balanced Salt Solution (HBSS) containing 5 mM HEPES (pH 7.4). After centrifugation, the cells were resuspended in 6 mL of the HEPES-containing HBSS. We note that trypsinization and following washing procedure resulted in a higher signal-to-background TGF-α shedding response as compared with harvesting cells without trypsin (EDTA only). The cell suspension was seeded in a 96-well culture plate (cell plate) at a volume of 90 μl (per well hereafter) and incubated for 30 min in a 5% CO2 incubator at 37°C. The cells were treated with a GPCR ligand (10X, diluted in HBSS containing 5 mM HEPES (pH 7.4) and 0.01% (w/v) bovine serum albumin (BSA, fatty acid-free and protease-free grade; Serva)). After spinning the cell plates, conditioned media (80 μl) was transferred to an empty 96-well plate (conditioned media (CM) plate). AP reaction solution (10 mM p-nitrophenylphosphate (p-NPP), 120 mM Tris–HCl (pH 9.5), 40 mM NaCl, and 10 mM MgCl2) was dispensed into the cell plates and the CM plates (80 μl). Absorbance at 405 nm (Abs405) of the plates was measured, using a microplate reader (SpectraMax 340 PC384, Molecular Devices), before and after 1-h or 2-h incubation at room temperature. Ligand-induced AP-TGF-α release was calculated as described previously. Unless otherwise noted, spontaneous AP-TGF-α release signal, which varies from 8%–30% of total AP-TGF-α expression depending on transfected conditions, was subtracted from ligand-induced AP-TGF-α release signal. Using the Prism 7 software (GraphPad Prism), the AP-TGF-α release signals were fitted to a four-parameter sigmoidal concentration-response curve, from which EC50 and Emax values were obtained. GPCRs and ligands used in this study is listed in Table S1A.
Calculation of G-protein-coupling score
We used a factor known as the relative intrinsic activity (RAi) (Ehlert et al., 1999) to calculate scores for G-protein coupling. For each sigmoidal curve of chimeric Gα-expressed condition, we divided a maximal response (Emax) by a potency (EC50) and normalized an Emax/EC50 value to a maximum value among 11 chimeric Gα curves. The resulting dimensionless, relative Emax/EC50 (defined as RAi) parameter was then logarithmically (base 10) transformed to give a LogRAi value used to quantify coupling. To minimize the occurrence of outliers arising from experimental variations, especially for weak AP-TGF-α release signal, we set two thresholds. As a first threshold, a Gα chimera condition in which Emax was smaller than 3% AP-TGF-α release or a concentration-response curve did not converge, was regarded as RAi value of 0. As a second threshold, RAi value smaller than 0.01 was set as0.01. Thus, a LogRAi values range from −2 to 0 and for the bioinformatics analyses, we used mean values of LogRAi (n = 3–6; for details of each GPCRs, see Table S1A and Data S1).
NanoBiT-G-protein dissociation assay
Plasmid transfection was performed in a 6-well plate with a mixture of 100 ng Gα-Lg-encoding plasmid, 500 ng Sm-Gβ-encoding plasmid, 500 ng untagged Gγ2-encoding plasmid, 200 ng GPCR-encoding plasmid with or without 100 ng RIC8-encoding plasmid (per well, hereafter). Unless otherwise stated, the combination of following plasmid mixtures was used: Gαs-Lg, Sm-Gβ1, Gγ2 and RIC8B for NanoBiT-Gs; Gαi1-Lg, Sm-Gβ5 and Gγ2 for NanoBiT-Gi1; Gαi2-Lg, Sm-Gβ3 and Gγ2 for NanoBiT-Gi2; Gαi3-Lg, Sm-Gβ3 and Gγ2 for NanoBiT-Gi3; Gαo-Lg, Sm-Gβ1 and Gγ2 for NanoBiT-Go; Gαq-Lg, Sm-Gβ1 Gγ2 and RIC8A for NanoBiT-Gq; Gα12-Lg, Sm-Gβ1 Gγ2 and RIC8A for NanoBiT-G12; Gα13-Lg, Sm-Gβ1 Gγ2 and RIC8Afor NanoBiT-G13. For G12-coupled DREADD screening experiment, the combination of following plasmid mixture was used: Gα12-Lg, Gβ1, Sm-Gγt1 and RIC8Afor NanoBiT-G12; Gαo-Lg, Gβ1 and Sm-Gγt1 for NanoBiT-Go. After 1-day culture, the transfected cells were harvested with 1 mL of 0.53 mM EDTA-containing Dulbecco’s PBS (D-PBS), followed by addition of 2 mL the HEPES-containing HBSS. The cells were pelleted by centrifugation at 190 g for 5 min and resuspended in 2 mL of the 0.01% BSA- and 5 mM HEPES (pH 7.4)-containing HBSS (assay buffer). The cell suspension was seeded in a 96-well culture white plate (Greiner Bio-One) at a volume of 80 μl (per well hereafter) and loaded with 20 μl of 50 μM coelenterazine (Carbosynth) solution diluted in the assay buffer. After 2-h incubation with coelenterazine at room temperature, background luminescent signals were measured using a luminescent microplate reader (SpectraMax L, Molecular Devices). We note that incubation time with coelenterazine can be shortened, but an effect of baseline drift should be taken into account (Figures S6C–S6E). Test compound (6X, diluted in the assay buffer) was manually added to the cells (20 μl). Luminescent signals were measured 3–5 min after ligand addition and divided by the initial count. The ligand-induced signal ratio was normalized to that treated with vehicle. The consequent fold-change values were fitted to a four-parameter sigmoidal concentration-response described above.
NanoBiT-RhoA assay
Plasmid transfection in HEK293 cells was performed by using a mixture of 100 ng Lg-RhoA plasmid, 500 ng Sm-PKN1 plasmid and 200 ng GPCR plasmid (per well in a 6-well plate). For transfection in MDA-MB-231 cells and PC-3 cells, 1.5 μg Lg-RhoA plasmid and 7.5 μg of Sm-PKN1 plasmid were used (per 10-cm dish). The transfected cells were harvested, seeded in a white 96-well plate and loaded with 10 μM CTZ in the same manner described in the NanoBiT-G-protein dissociation assay. After measuring an initial luminescent signal, test compounds were added to the cells. Then, 3–5 min later, luminescent signals were measured and fold- change values were plotted as described above.
NanoBiT-IP3 sensor assay
Plasmid transfection was performed by using a mixture of 1 μg Lg-IP3R2-Sm plasmid and 200 ng GPCR plasmid (per well in a 6-well plate). The transfected cells were harvested, seeded in a white 96-well plate and loaded with 10 μM CTZ in the same manner described in the NanoBiT-G-protein dissociation assay. After measuring an initial luminescent signal, test compounds were added to the cells. Then, 5–10 min later, luminescent signals were measured and fold-change values were plotted as described above.
siRNA transfection
Stealth siRNA duplexes against mRNA encoding Gαq, Gα11, Gα12, Gα13 and TACE (gene symbols, GNAQ, GNA11, GNA12, GNA13 and ADAM17, respectively) and Stealth negative control were purchased from Life Technologies. Target sequences and manufacturer’s catalog numbers are as follows: GNAQ (#1), 5′-GGAGAGAGUGGCAAGAGUACGUUUA-3′, GNAQHSS104236; GNAQ (#2), 5′-CCCUUUGACUUACAAAGUGUCAUUU-3′, GNAQHSS104237; GNA11 (#1), 5′-CCGGCAUCAUCGAGUACCCUU UCGA-3′, GNA11HSS178464; GNA11 (#2), 5′-GCAUCAGUACGUCAGUGCCAUCAAG-3′, GNA11HSS104213; GNA12 (#1), 5′-CCAAGGGAAUUGUGGAGCAUGACUU-3′, GNA12-HSS178466; GNA12 (#2), 5′-CCAUCGUCAACAACAAGCUCUUCUU-3′, GNA12MSS204749; GNA13 (#1), 5′-CAGAAGCCCUUAUACCACCACUUCA-3′, GNA13-HSS173827; GNA13 (#2), 5′-GCAGCCCAAGGAAUGGUGGAAACAA-3′, GNA13-HSS116479; ADAM17, 5′-CAGAAUCGUGUUGACAGCAAAGAAA-3′, ADAM17-HSS186181. siRNA constructs for the GNA12 (#1), the GNA13 (#1) and the ADAM17 genes were described previously and validated (Inoue et al., 2012).
HEK293 cells were seeded in a 6-well culture plate at cell density of 1 × 10⁵ cells ml−1 in 2 mL of the complete DMEM and incubated for 1 day. Transfection of siRNA transfection was performed by using Lipofectamine® RNAiMAX (Thermo Fisher Scientific) according to the manufacturer instructions (final siRNA concentration of 10 nM and 2 μL (per well in a 6-well plate) of Lipofectamine® RNAiMAX). After 1-day incubation, media were replaced and transfection of plasmids encoding AP-TGF-α and GPCR was performed as described above. The resulting cells were subjected to the TGF-α shedding assay.
Quantitative real-time PCR analysis
Total RNA from siRNA-transfected HEK293 cells was prepared using a GenElute Mammalian Total RNA Miniprep Kit (Sigma-Aldrich). Total RNA was reverse-transcribed using High-Capacity cDNA RT Kits (Applied Biosystems) according to manufacturer instructions. Real-time quantitative PCRs were performed with SYBR Premix Ex Taq (Takara Bio) and monitored by ABI Prism 7300 (Applied Biosystems). Standard plasmids ranging from 102–108 copies per well were used to quantify the absolute number of transcripts of cDNA samples. The numbers of transcripts were normalized to the number of GAPDH in the same sample and expressed as relative values to that in control siRNA-transfected cells. Primers were as follows: GNAQ, 5′-ACCGAATGGAGGAAAGCAAGG-3′ and 5′-CATCTCTCTGGGGTCCATCATATTC-3′; GNA11, 5′-CAGCGAATACGACCAAGTCC-3′ and 5′-ACCAGGGGTAGGTGATGATG-3′; GNA12, 5′-GAGGGATTCTGGCATCAGG-3′ and 5′-CGATCCGGTCCAAGTTGTC-3′; GNA13, 5′-CCTGGATAACTTGGATAAACTT GG-3′ and 5′-TTCATGGATGCCTTTGGTG-3′; GAPDH, 5′-GCCAAGGTCATCCATGACAACT-3′ and 5′-GAGGGGCCATCCACAG TCTT-3′.
Western blot
The parental HEK293 cells and a panel of the G-protein-KO HEK293 cells (ΔGq, ΔG12 and ΔGq/ΔG12 cells) in growth phase were harvested and approximately 1 × 10⁶ cells were lysed in 500 μL of SDS-PAGE sample buffer (62.5 mM Tris-HCl (pH 6.8), 50 mM dithiothreitol, 2% SDS, 10% glycerol and 4 M urea) containing 1 mM EDTA and 1 mM phenylmethylsulfonyl fluoride. Cell lysates were homogenized with a hand-held ultrasonic homogenizer (Microtech) and proteins were denatured at 95°C for 5 min. The lysates were loaded and separated on a 12.5% polyacrylamide SDS-gel. After electrophoresis, the gel was blotted to a nitrocellulose membrane. The blotted membrane was blocked with 5% skim milk-containing blotting buffer (10 mM Tris-HCl (pH 7.4), 190 mM NaCl and 0.05% Tween 20), immunoblot with primary (1 μg ml−1) and secondary antibodies (1:2000 dilution). Primary antibodies used in this study were anti-Gαq antibody (goat polyclonal; Abcam, ab128060), anti-Gα11 antibody (mouse monoclonal, clone D-6; Santa Cruz Biotechnologies, sc-390382), anti-Gα13 antibody (rabbit monoclonal, clone EPR5436; Abcam, ab128900) and anti-α-tubulin antibody (mouse monoclonal, clone DM1A; Santa Cruz Biotechnologies, sc-32293). We note that by using cell lysates overexpressing Gα subunits, the anti-Gαq antibody and the anti-Gα13 antibody were validated to be specific, but the anti-Gα11 antibody reacted with both Gαq and Gα11 (data not shown), and thus we labeled immuno-reactive bands as Gαq/11. Secondary antibodies were conjugated with horseradish peroxidase (HRP) and were anti-goat IgG antibody (American Qualex, A201PS), anti-mouse IgG (GE Healthcare, NA9310) and anti-rabbit IgG (GE Healthcare, NA9340). Membrane were soaked with a commercial chemiluminescent reagent (ImmunoStar® Zeta, FujiFilm Wako Pure Chemicals) or in-house reagent (100 mM Tris-HCl (pH 8.5), 50 mg ml−1 Luminol Sodium Salt HG (FujiFilm Wako Pure Chemicals), 0.2 mM p-Coumaric acid and 0.03% (v/v) of H2O2). and a chemiluminescence image was acquired with a LAS-4000 (FujiFilm) and analyzed with Multi Gauge ver. 3.0 (FujiFilm).
Flow cytometry
Plasmid transfection was performed in a 12-well plate with volumes of 500 ng plasmid encoding N-terminally FLAG epitope-tagged GPCR with or without 250 ng Gα-encoding plasmid. The transfected cells were harvested by adding 300 μl of 0.53 mM EDTA-containing D-PBS, followed by 300 μl of 5 mM HEPES (pH 7.4)-containing Hank’s Balanced Salt Solution (HBSS). The cell suspension was dispensed in a 96-well V-bottom plate (200 μl per well, two wells per sample). After centrifugation at 700 g for 1 min, the cells were washed once with D-PBS and pelleted. Cell pellets were suspended in 2% goat serum- and 2 mM EDTA-containing D-PBS (blocking buffer; 100 μl per well) and incubated for 30 min on ice. After centrifugation at 700 g for 1 min, the cells were stained with anti-FLAG epitope tag monoclonal antibody (Clone 1E6, FujiFilm Wako Pure Chemicals; 10 mg ml−1 in the blocking buffer; 50 μl per well) for 30 min on ice. After rinse with D-PBS, cells were labeled with a goat anti-mouse IgG secondary antibody conjugated with Alexa Fluor 488 (Thermo Fisher Scientific; 10 μg ml−1 dilution in the blocking buffer; 25 μl per well) for 15 min on ice. The cells were washed once with D-PBS, resuspended in 100 μl of 2 mM EDTA-containing-D-PBS and filtered through a 40 μm filter. The fluorescently labeled cells (approximately 20,000 cells per sample) were analyzed by an EC800 flow cytometer (Sony). Fluorescent signal derived from Alexa Fluor 488 was recorded in an FL1 channel and flow cytometry data were analyzed by a FlowJo software (FlowJo). Values of mean fluorescence intensity (MFI) were used for quantification.
GloSensor cAMP assay
Plasmid transfection was performed in a 6-well plate with a mixture of 1 μg Glo-22F cAMP biosensor-encoding pCAGGS plasmid (gene synthesized with codon optimization by Genscript), 200 ng AVPR2-encoding plasmid and 100 ng of Gαs-Lg-encoding plasmid or native Gαs-encoding plasmid. After 1-day incubation, the transfected cells were harvested with 0.53 mM EDTA-containing D-PBS, centrifuged at 190 g for 5 min and suspended in 0.01% BSA- and 5 mM HEPES (pH 7.4)-containing HBSS (vehicle; 0.6 mL per well). The cells were seeded in a half-area white 96-well plate (Greiner Bio-one; 30 μL per well) and loaded with D-luciferin potassium solution (10 μL of 8 mM solution per well; FujiFilm Wako Pure Chemical, Japan). After 2 h incubation in the dark at room temperature, the plate was read for its initial luminescent count (integration time of 1 s per well; Spectramax L, Molecular Devices, Japan). The cells were treated with vehicle, arginine vasopressin (Peptide Institutes, Japan) or 10 μM forskolin (FujiFilm Wako Pure Chemical, Japan) (10 μL of 5X solution per well). Kinetics values were measured on the plates for 20 min and expressed as fold-change values. To obtain a concentration-response curve, fold-change luminescent signals at 10-min after compound addition were normalized to that in forskolin-treated condition. Using the Prism 7 software (GraphPad Prism), the cAMP signals were fitted to a four-parameter sigmoidal concentration-response curve, from which EC50 values were obtained.
For the chimeric Gs-based cAMP assay, ΔGs cells were transfected with a mixture of 1 μg Glo-22F plasmid, 200 ng GPCR plasmid and 100 ng chimeric Gαs plasmid containing the backbone of human Gαs subunit (short isoform, residues 1–374) and a substitution of C-terminal 6-amino acids. Amino acid sequences for the Glo-22F cAMP sensor and the chimeric Gαs subunits are listed in Data S3. The transfected cells were harvested, seeded in the half-area 96-well plate, loaded with D-luciferin and stimulated with a GPCR ligand in the same manner as described above. Scores of G-protein-coupling values (RAi) were calculated as described in the TGF-α shedding assay section.
Active RhoA pulldown assay
HN12 cells and Cal27 cells were cultured to 50% confluency, and then serum starved overnight. To induce RhoA activation, cells were treated with 5 μM LPA, 1 μM Ang II, or 10 μM CP-55940 for 5 min. Active RhoA levels were measured using the RhoA Pull-Down Activation Assay Biochem Kit (bead pull-down format; Cytoskeleton) following the manufacturer instruction using a modified lysis buffer (50 mM Tris-HCl (pH 7.2), 500 mM NaCl, 10 mM MgCl2, 0.1% SDS, 1% NP-40). Briefly, after stimulation, samples were lysed and protein concentrations were quantified using DC Protein Assay (BioRad). Samples were adjusted to the same concentration with lysis buffer and 500 μg of each protein lysate was added to 15 μL GST-tagged Rhotekin-RBD bound to Sepharose beads. Samples were incubated while rocking at 4°C for 1.5 h. Beads were then washed, eluted in Laemmli sample buffer, and analyzed by western blot using a mouse monoclonal anti-RhoA antibody (Cytoskeleton).
Ca2+ mobilization assay
Plasmid transfection was performed in the parental, ΔGq and ΔG12 HEK293 cells by using GPCR-encoding plasmid (AGTR1 or EDNRA; 5 μg per 10-cm culture dish). After one-day incubation, the transfected cells were harvested with trypsinization. After centrifugation, the cells were suspended in serum-free DMEM at a cell concentration of 5 × 10⁵ cells ml−1, and 40 μl (per well hereafter) of the cell suspension seeded in a half-area, clear-bottom black plate. The cells were further incubated in the incubator for one day. After loading 40 μl of a Ca2+ indicator (FLIPR Calcium 5 Assay Kit, Molecular Devices) according to manufacturer instructions in the presence of 2.5 mM probenecid for 1 h in the incubator, the cell plate was placed in a fluorescence microplate reader (FlexStation 3, Molecular Devices). Fluorescent signal was measured with automated pipetting of test ligands (20 μL of 5X compounds). Fluorescent signals from 40 to 55 s after ligand addition were averaged and normalized to an initial count and expressed as a relative value to vehicle treatment.
Comparison of data from the chimeric G-protein-based assay with known couplings
We performed Receiver Operating Characteristic (ROC) analysis to compare the chimeric G-protein-based TGF-α shedding assay results to primary or secondary couplings from GtoPdb (Harding et al., 2018), defined as binary classifiers. We defined the optimal LogRAi cutoff as that maximizing the True Positive Rate (TPR, or sensitivity) while minimizing the True Negative Rate (TNR, or 1-specificity). We defined positives as GtoPdb couplings reported in at least 3 references, and negatives as the couplings that were never reported for these more studied receptors. We obtained a value close to −1 as the optimal LogRAi cutoff considering all G proteins altogether (Figure S7; Table S1D), which we then considered as a lower and upper confidence bound for positively and negatively coupled receptors.
Sequence-based coupling-determinant features
We first generated a multiple sequence alignments (MSAs) of the 144 Class A GPCR sequences (Data S4) using HMMalign from the HMMer package (Eddy, 1998), using the 7tm_1 Pfam (Finn et al., 2016) Hidden Markov Model (HMM). As in a previously described procedure (Hannenhalli and Russell, 2000), we subdivided the pool of receptor sequences into positively and negatively coupled to a given G protein using the optimal LogRAi cutoff as a lower and upper bound. These sub-alignments were used to build corresponding HMM profiles through hmmbuild (http://www.hmmer.org/), leading to 22 HMMs (coupled versus uncoupled for 11 G proteins).
From coupled and uncoupled HMM profiles for each G protein, we then extracted alignment positions present in both HMM models and showing statistically different distributions (Wilcoxon’s signed-rank test; p value ≤ 0.05) of the 20 amino acid bit scores (Figure 4A). We also considered those alignment positions with consensus columns (i.e., those having a fraction of residues, as opposed to gaps, equal or greater than the hmmbuild’s symfrac parameter, using default value of 0.5) present in either of HMM models. In details, if a consensus column was present only in the HMM profile of either the coupled or uncoupled groups, we labeled it as insertion or deletion, respectively. As additional features, we also included length and amino acid composition of the N- and C-termini (N-term and C-term) and the extra- and intra-cellular loops (ECLs and ICLs). For every G protein, only statistically significant (p value < 0.05; Wilcoxon’s rank-sum test) features were considered.
To identify each positions within the alignment, we employed the Ballesteros/Weinstein scheme (Weinstein, 1995), using the consensus secondary structure from the 7tm_1 HMM model to number residues within helices in a consecutive way (Table S3C). Most conserved positions within each helix were defined according to GPCRDB (https://www.gpcrdb.org) (Isberg et al., 2017). We adjusted the B/W numberings for TM6, which we started at position 6.25 (domain position 200) instead of 6.31 (domain position 206), according to visual inspections of recent G protein-GPCRs complexes. If a position lies on an extra-7TM region (e.g., ECLs or ICLs), we use the corresponding label plus the corresponding Pfam domain consecutive numbering in parenthesis.
G-protein-coupling predictor
We implemented a predictor for G-protein coupling by using a logistic regression classifier, or Log-reg classifier, available from the scikit-learn package (https://scikit-learn.org) (Pedregosa et al., 2011) The possible outcomes in log-reg are modeled using a logistic function, with L1 or L2 based regularization. In this study we used L2 penalized form of log-reg. The target value is expected to be a linear combination of the given features. This property of log-reg can also be exploited to study the weights of its features.
As an optimization problem, binary class L2 penalized logistic regression minimizes the following cost function:
| (1) |
where X denotes a vector of feature variables, w ∈ is the weight vector, c ∈ is the intercept, C is inverse of regularization strength (positive float), y takes values in {−1, 1} at trial i and n is the number of trials conducted.
We used the liblinear method as the optimization algorithm as shown to be optimal for relatively small datasets (https://www.csie.ntu.edu.tw/~cjlin/liblinear/).
Training and cross validation
We used 7TM domain positions and compositional features for the ICL3 and C-term, which prevail over other extra-7TM domain features, to create a training matrix. In case of significant positional features, two-bit scores (derived from the positive and negative HMMs for a given G protein) are returned for the corresponding amino acid found at a given position in the input GPCR sequence (Figure 4A). In case a position was found to be present in either positive or negative HMMs, the single bit score, derived from the respective HMM, was returned. If for any GPCR, no amino acid was present at the given position, it was assigned the highest bit scores from the both models, implying the least conserved scores.
All the features were scaled to the range [0, 1]. Feature scaling aids not only in converging the algorithm faster but also helps in assessing the feature relevance (Dou et al., 2012). A grid search was performed over a stratified 5-fold cross validation (CV) to select the best value of C (inverse of the regularization strength) over a range of [1e-02,1e05]. In a stratified 5-fold CV, the training matrix is divided randomly into 5 equal sub-matrices, preserving the ratio of positive (coupling) and negative (non-coupling) GPCRs. During each fold, one of the sub matrix is treated as the validation set and the remaining four as the training set.
We assessed the performance of our predictor using standard metrics (MCC, ACC, PRE, REC, SPE, AUC, F1M; Table S2A). The parameters showing the best Area Under the Curve (AUC) of the Receiver Operating Curve (ROC) were chosen to create models for every G protein (Table S2A).
The number of positive (coupling) GPCRs were either more (eg: in GNAI1/3) or less (eg: in GNAS) than the number of negative (noncoupling) GPCRs. Such an imbalance would make the predictor biased to any one of the two classes. In order to counter this problem, the parameter class_weight was set to balanced in the log-reg classifier function. By default, all the classes have same weight. However, by setting the class_weight as balanced, the values of the column with classes (coupling/uncoupling) are used to automatically adjust the weights inversely proportional to their frequencies in the training matrix. To ensure minimal variance due to random division of the training matrix during the cross validation, the aforementioned experiment was repeated ten times for every G-protein group and the standard deviation was recorded. The feature weights were extracted as described elsewhere (Dou et al., 2012) from the trained models and are critical to understand the relative importance of different features (Figure 4).
Besides performing the above-said steps at LogRAi cutoff of −1.0, we also created models at LogRAi cutoffs −0.5 and −0.1. As it can be seen in Figure S7A, for most of the G proteins, −1.0 turns out to be the best LogRAi cutoff during cross-validation (using MCC as the selection criteria).
Randomized training test
In order to assess over-fitting, we performed a randomization test (Salzberg, 1997). For every G protein, the original labels of the training matrix were replaced with randomly determined labels, while preserving the ratio of number of positive (coupling) and negative (non-coupling) GPCRs. Performance using the randomization training set was lower than that of actual training set (Table S2B), implying that our strategy is insensitive to the data training set.
Test set to benchmark predictor performance
To benchmark our method and compare it with Pred Couple (Sgourakis et al., 2005b), a web-server available to predict GPCR-G-protein coupling, we extracted all the GPCRs from GtoPdb that are present in neither the chimeric G-protein-based TGF-α shedding assay nor in Pred Couple’s training set, thus obtaining a list of 86 unseen GPCRs (Data S4). As mentioned above, one of the major limitations of GtoPdb is the absence of a definite true negative set, thus, the best measure to compare our predictor with that of Pred Couple is recall, also known as sensitivity or the true positive rate. Since both GtoPdb and Pred Couple provide coupling information at the G-protein family level, we combined the performance of individual G-protein predictors based on their families to compare the performance of our method with Pred-Couple. For example: if a given GPCR was predicted to couple to at least one of the G proteins of a family, it was annotated as coupling to that G-protein family. The combinations of our predictors at the family level outperformed Pred-Couple over the test set (Table S2C). The individual G-protein predictors’ and their combined (G-protein family level) performance over the Test set at different LogRAi cutoffs are reported in Tables S2A and S2B and Figures S7A and S7C, respectively.
To further check the predictor’s performance, we trained and tested an additional predictor using exactly the same procedure as reported above using GtoPdb coupling information instead of the TGF-α shedding assay (Figure 4A; Table S2D).
Functional classification of coupling features through 3D structure analysis
We identified functional positions as those mediating inter- and intra-molecular contacts, i.e., whenever at least one pair of atoms, from either a residue-residue or residue-ligand interface, was found spatially closer than 5Å. We analyzed 246 3D structures, representing 51 members of the GPCR Class A (PFAM: 7tm_1) family using PDB-Swissprot-PFAM correspondences available from SIFT (as of July 2018) (Velankar et al., 2013).
To define GPCR-ligand contact sites, we restricted our analysis only to GPCR putative ligands as defined in GtoPdb (Harding et al., 2018). We performed similarity searches between GtoPdb and PDB ligands using topological fingerprints from RDKit (http://www.rdkit.org/) generated from SMILES descriptors and we considered only the best matching GtoPdb ligand for a given PDB component. All the protein residues mediating contacts were mapped to protein sequence position using alignments between Uniprot canonical sequences and corresponding PDB generated through Blast (Altschul et al., 1990). Note that through this procedure we considered contacts mediated by the equivalent residues from different structures only once, thus avoiding overcounting due to PDB redundancy. We then mapped the amino acids found in contact with putative ligands on the PFAM multiple sequence alignments (MSA). Based on available GPCR-G-protein complexes (PDB: 3SN6, 5G53, 6D9H, 6GDG, 6DDE, 6DDF, 6CMO and 6D9H) we similarly identified the residues forming the receptor-G-protein interaction interface by using a distance cutoff of 6.5Å to define atompairs forming inter-residue contacts.
Similarly to methods employed to decipher the activation mechanisms of GPCRs (Angelova et al., 2011; Venkatakrishnan et al., 2016; Venkatakrishnan et al., 2013) and other signaling molecules (Papaleo et al., 2016; Raimondi et al., 2013a; Raimondi et al., 2013b; Seeber et al., 2015), we also inspected the network of intramolecular contacts using the same thresholds as above and we similarly mapped the identified positions on Class A 7TM MSA. We then defined a consensus contact network by considering the sequence positions (nodes) found in contact (edges) in at least 50% of the analyzed sequences. We performed network analysis through igraph (Csardi and Nepusz, 2006), defining as hub nodes having a degree of at least 4. We generated functional state consensus networks by grouping available structures using ligand classification from GtoPdb (i.e., agonist or antagonist/inverse agonist) or functional classification directly available from the protein databank (i.e., active or inactive), thus defining active-like (i.e., agonist-bound/active) or inactive-like (i.e., antagonist-bound/inactive) states (Table S3D). Structures where this classification was not possible were discarded.
We calculated the shortest paths connecting positions forming the consensus ligand and G-protein-binding interfaces within active- and inactive-like networks through the Dijkstra algorithm (Dijkstra, 1959) from igraph. Active-state specific shortest paths were defined as those characterized by having either endpoints, or intermediate connectivity residues, exclusive to active-like state contact network.
Predictions of G12-coupled DREADD chimeric sequences
In order to predict mutant sequences with enhanced G12/13 coupling capabilities, we started from the available DREADD coupled with Gq/11 (M3D) and Gi/o (M4D) (Armbruster et al., 2007). We generated chimeric sequences by swapping on these backbones the ICL3 and C-term sequence stretches derived from each receptor of the chimeric G-protein-based assay panel (148 GPCRs). We first aligned the receptor sequences, including M3D and M4D, to the PFAM 7tm_1 HMM model. We defined ICL3 as the MSA region comprised within HMM positions 173–205, and the C-term as the MSA portion starting after 7tm_1 HMM end (i.e., position 268). We then created M3D and M4D chimeras by exchanging their ICL3 and C-term sequences with the corresponding sequences from each receptor tested in the chimeric G-protein-based TGF-α shedding assay. We generated 296 chimeric sequences by swapping the ICL3 alone or in combination with the C-termini.
We then predicted the coupling probability to GNA12/GNA13 for each chimeric sequence, ranking them according to their relative coupling probability (i.e., ΔPred_Coup = Pred_CoupDREADD_MUT-Pred_CoupDREADD). We selected the top 10 chimeric sequences for experimental validation.
QUANTIFICATION AND STATISTICAL ANALYSIS
Statistical analyses were performed using GraphPad Prism 7 software and methods are described in the legends of the figures. In flow cytometry experiments, approximately 20,000 cells were measured for their fluorescent signals and data were analyzed by FlowJo software. Mean fluorescent intensity was used for quantification of cell surface GPCR expression. Representation of symbols and error bars is described in the ligands. Symbols are either mean values of indicated numbers of independent experiments or data-point from single experiment. Error bars denote SEM or SD. Concentration-response curves were fitted to all data by the Nonlinear Regression: Variable slope (four parameter) in the Prism 7 tool. Liner regression and representation of 90% confidence bands were performed by the Prism 7 tool. For multiple comparison analysis in the flow cytometry data and G12-DREADD generation, two-way ANOVA and following Dunnet’s test and Sidak’s test, respectively, was used.
DATA AND SOFTWARE AVAILABILITY
The Python code used for the predictor is available on GitHub (https://github.com/raimondifranc/gpcr_coupling_predictor). Heat-maps in Figure 2 and 5 were generated using scipy (https://www.scipy.org/) and matplotlib python libraries (https://matplotlib.org/).
ADDITIONAL RESOURCES
We have created an accessible resource for interrogating the data generated by the G-protein-based assay and a tool for online predictions of coupling based on sequences available at http://gpcr.russelllab.org/. The GPCR/G-protein interactions with a score LogRAi ≥ −1 have been annotated and are accessible in the SIGNOR database (https://signor.uniroma2.it/downloads.php).
Supplementary Material
KEY RESOURCES TABLE.
| REAGENT or RESOURCE | SOURCE | IDENTIFIER |
|---|---|---|
| Antibodies | ||
| Anti DYKDDDDK tag antibody (mouse monoclonal, clone 1E6) | FujiFilm Wako Pure Chemicals | Cat# 012–22384; RRID: AB_10659717 |
| Goat anti-mouse IgG secondary antibody conjugated with Alexa Fluor 488 | Thermo Fisher Scientific | Cat# A28175; RRID: AB_2536161 |
| Anti-Gαq antibody (goat polyclonal) | Abcam | Cat# ab128060; RRID: AB_11145302 |
| Anti-Gα11 antibody (mouse monoclonal, clone D-6; recognizing Gαq and Gα11) | Santa Cruz Biotechnologies | Cat# sc-390382; RRID: AB_2715558 |
| Anti-Gα13 antibody (rabbit monoclonal, clone EPR5436) | Abcam | Cat# ab128900; RRID: AB_11142234 |
| Anti-α-tubulin antibody (mouse monoclonal, clone DM1A) | Santa Cruz Biotechnologies | Cat# sc-32293; RRID: AB_628412 |
| Anti-goat IgG secondary antibody conjugated with horseradish peroxidase (HRP) | American Qualex | A201PS |
| Anti-mouse IgG secondary antibody conjugated with horseradish peroxidase (HRP) | GE Healthcare | Cat# NA9310; RRID: AB_772193 |
| Anti-rabbit IgG secondary antibody conjugated with horseradish peroxidase (HRP) | GE Healthcare | Cat# NA9340; RRID: AB_772191 |
| Anti-RhoA antibody (mouse monoclonal) | Cytoskeleton | Cat# ARH04; RRID: AB_2728698 |
| Bacterial and Virus Strains | ||
| SCS1 Supercompetent Cells | Agilent Technologies | 200231 |
| Biological Samples | ||
| Fetal bovine serum | Thermo Fisher Scientific | 10270–106 |
| Fetal bovine serum (for HN12 cells and Cal27 cells) | Sigma-Aldrich | F2442 |
| Goat serum | Nippon Bio-test Laboratories | 0208–01 |
| Skim milk power | FUJIFILM Wako Pure Chemical | 198–10605 |
| Chemicals, Peptides, and Recombinant Proteins | ||
| Lipofectamine 2000 | Thermo Fisher Scientific | 11668–019 |
| Lipofectamine RNAiMax | Thermo Fisher Scientific | 13778–150 |
| Polyethylenimine (PEI) Max, (Mw 40,000) | Polysciences | 24765–1 |
| Opti-MEM | Thermo Fisher Scientific | 31985–070 |
| HEPES | Sigma-Aldrich | H3375 |
| EDTA solution | Thermo Fisher Scientific | 15575–020 |
| p-nitrophenylphosphate, disodium salt | FUJIFILM Wako Pure Chemical | 145–02344 |
| Trypsin | Thermo Fisher Scientific | 27250–018 |
| Bovine serum albumin | SERVA Electrophoresis | 11945 |
| Coelenterazine | Carbosynth | EC14031 |
| D-luciferin, potassium salt | FUJIFILM Wako Pure Chemical | 126–05116 |
| 2-oxo-glutaric acid | FUJIFILM Wako Pure Chemical | 117–00081 |
| 7α,25-dihydroxycholesterol | Cayman Chemical | 11032 |
| 9-HODE | Cayman Chemical | 38400 |
| Acetylcholine | Sigma-Aldrich | A6625 |
| Adenosine | FUJIFILM Wako Pure Chemical | 011–24593 |
| ADP | FUJIFILM Wako Pure Chemical | 015–13241 |
| Angiotensin II | Peptide Institute | 4001-v |
| Apelin | Cayman Chemical | 13523 |
| ATP | FUJIFILM Wako Pure Chemical | 017–21511 |
| BAM-22P | Anygen | AGP-8605 |
| Bombesin | Peptide Institute | 4086-v |
| Bradykinin | Peptide Institute | 4002-v |
| Capric acid | FUJIFILM Wako Pure Chemical | 041–23256 |
| CAY10583 | Cayman Chemical | 10012424 |
| CCK-Octapeptide | Peptide Institute | 4100-v |
| Cortistatin-14 | Peptide Institute | 4329-v |
| CP-55940 | Cayman Chemical | 90084 |
| Dopamine | FUJIFILM Wako Pure Chemical | 040–15433 |
| Dynorphin A | Peptide Institute | 4080-v |
| Endothelin-1 | Peptide Institute | 4198 s |
| fMLP | Peptide Institute | 4066-v |
| Galanin | Abgent | SP2781a |
| Galanin (rat) | Peptide Institute | 4244-v |
| Gastric Inhibitory Peptide | Abgent | SP3260a |
| GSK1292263 | AdooQ BioScience | A10439–10 |
| Histamine | FUJIFILM Wako Pure Chemical | 087–03553 |
| Iloprost | Cayman Chemical | 18215 |
| Isoproterenol | Sigma-Aldrich | I6504 |
| Kisspeptin-10 | Peptide Institute | 4389-v |
| Leukotriene B4 | Cayman Chemical | 20110 |
| Leukotriene D4 | Cayman Chemical | 20310 |
| Leuprolide | GenScript | RP17321 |
| Lysophosphatidic acid | Avanti Polar Lipids | 857130 |
| Lysophosphatidylinositol | Avanti Polar Lipids | 850105 |
| Lysophosphatidylserine | Avanti Polar Lipids | 858143 |
| Lysyl-Bradykinin | Peptide Institute | 4008-v |
| MCH | Peptide Institute | 4369-v |
| MDL 29951 | Cayman Chemical | 16266 |
| Melatonin | FUJIFILM Wako Pure Chemical | 135–17113 |
| Methionine-Enkephalin | Peptide Institute | 4042-v |
| Methionine-Enkephalin | Peptide Institute | 4042-v |
| MK-0677 | Cayman Chemical | 18003 |
| Motilin | GenScript | RP10527 |
| Neurokinin A | Peptide Institute | 4154-v |
| Neurokinin B | Peptide Institute | 4317-v |
| Neuromedin B | Peptide Institute | 4152-v |
| Neuromedin-U25 | Peptide Institute | 4490-v |
| Neuropeptide FF | GenScript | RP10470 |
| Neuropeptide W-30 | Abgent | SP2086a |
| Nociceptin | Peptide Institute | 4318-v |
| Norepinephrine | Sigma-Aldrich | N5785 |
| Orexin-A | Peptide Institute | 4346 s |
| Oxytocin | Peptide Institute | 4084-v |
| PACAP27 | Peptide Institute | 4231-v |
| PAF | Avanti Polar Lipids | 878110 |
| Palmitic acid | FUJIFILM Wako Pure Chemical | 165–00102 |
| PAR1 peptide | Peptide Institute | PAR-3665-PI |
| PAR2 peptide | Peptide Institute | PAR-3664-PI |
| Parathyroid Hormone | Peptide Institute | 4068 s |
| Prolactin-Releasing Peptide-20 | Anygen | AGP-8642 |
| Propionic acid | FUJIFILM Wako Pure Chemical | 163–04726 |
| Prostaglandin D2 | Cayman Chemical | 12010 |
| Prostaglandin E2 | Cayman Chemical | 14010 |
| Prostaglandin F2α | Cayman Chemical | 16010 |
| Serotonin | FUJIFILM Wako Pure Chemical | 321–42341 |
| Somatostatin | Peptide Institute | 4023-v |
| Sphingosine 1-phosphate | Cayman Chemical | 62570 |
| Substance P | Peptide Institute | 4014-v |
| Thrombin | Sigma-Aldrich | T4648 |
| TIP39 | Peptide Institute | 4479 s |
| TUG 891 | Tocris Bioscience | 4601 |
| U-46619 | Cayman Chemical | 16450 |
| UDP | FUJIFILM Wako Pure Chemical | 212–00861 |
| UDP-Glucose | FUJIFILM Wako Pure Chemical | 214–00941 |
| Urotensin II | Abgent | SP2662a |
| Vasopressin | Peptide Institute | 4085-v |
| WKYMVM | Anygen | AGP-8694 |
| Zaprinast | Cayman Chemical | 10010421 |
| α-MSH | Peptide Institute | 4057-v |
| SII | Peptide Institute | 4476-v |
| Clozapine N-oxide | Tocris Bioscience | 4936 |
| Ki16425 | AdooQ BioScience | A10501 |
| JTE-013 | Cayman Chemical | 10009458 |
| Forskolin | FUJIFILM Wako Pure Chemical | 067–02191 |
| DMEM | Nissui | 05919 |
| Penicillin G | Sigma-Aldrich | P3032 |
| Streptomycin | Thermo Fisher Scientific | 11860–038 |
| Probenecid | FUJIFILM Wako Pure Chemical | 162–26112 |
| ImmunoStar Zeta | FUJIFILM Wako Pure Chemical | 291–72401 |
| Angiotensin II (for RhoA pulldown assay) | Sigma-Aldrich | A9525 |
| CP-55940 (for RhoA pulldown assay) | Sigma-Aldrich | C1112 |
| Lysophosphatidic acid (for RhoA pulldown assay) | Sigma-Aldrich | L7260 |
| Luminol Sodium Salt HG | FUJIFILM Wako Pure Chemical | 123–04021 |
| Critical Commercial Assays | ||
| PrimeSTAR HS DNA Polymerase | Takara Bio | R010B |
| NEBuilder HiFi DNA Assembly Master Mix | New England BioLabs | E2621X |
| NucleoBond Xtra Midi Plus | Macherey-Nagel | 740412.50 |
| PureYield Plasmid Miniprep System | Promega | A1222 |
| MycoAlert Mycoplasma Detection Kit | Lonza | LT07–118 |
| High-Capacity cDNA Reverse Transcription Kits | Thermo Fisher Scientific | 4368814 |
| SYBR Premix Ex Taq | Takara Bio | RR041A |
| FLIPR Calcium 6 Assay Kit | Molecular Devices | N/A |
| RhoA Pull-Down Activation Assay Biochem Kit | Cytoskeleton | BK036 |
| DC Protein Assay | BioRad | 5000112 |
| Experimental Models: Cell Lines | ||
| Human: HEK293 cells (parental HEK293) | Inoue et al., 2012 | N/A |
| ΔGq HEK293 cells | Schrage et al., 2015 | CL1 |
| ΔG12 HEK293 cells | Devost et al., 2017 | CL3 |
| ΔGq/ΔG12 HEK293 cells | Devost et al., 2017 | CL4–1 |
| ΔGs HEK293 cells | Stallaert et al., 2017 | CL4 |
| MDA-MB-231 cells | ATCC | HTB26 |
| PC-3 cells | ATCC | CRL1435 |
| HN12 cells | NIH cell collection | N/A |
| Cal27 cells | NIH cell collection | N/A |
| Oligonucleotides | ||
| siRNA targeting sequence: GNAQ (#1) 5′-GGAGAGAGUGGCAAGAGUACGUUUA-3′ | Thermo Fisher Scientific | GNAQHSS104236 |
| siRNA targeting sequence: GNAQ (#2) 5′-CCCUUUGACUUACAAAGUGUCAUUU-3′ | Thermo Fisher Scientific | GNAQHSS104237 |
| siRNA targeting sequence: GNA11 (#1) 5′-CCGGCAUCAUCGAGUACCCUUUCGA-3′ | Thermo Fisher Scientific | GNA11HSS178464 |
| siRNA targeting sequence: GNA11 (#2) 5′-GCAUCAGUACGUCAGUGCCAUCAAG-3′ | Thermo Fisher Scientific | GNA11HSS104213 |
| siRNA targeting sequence: GNA12 (#1) 5′-CCAAGGGAAUUGUGGAGCAUGACUU-3′ | Thermo Fisher Scientific | GNA12-HSS178466 |
| siRNA targeting sequence: GNA12 (#2) 5′-CCAUCGUCAACAACAAGCUCUUCUU-3′ | Thermo Fisher Scientific | GNA12MSS204749 |
| siRNA targeting sequence: GNA13 (#1) 5′-CAGAAGCCCUUAUACCACCACUUCA-3′ | Thermo Fisher Scientific | GNA13-HSS173827 |
| siRNA targeting sequence: GNA13 (#2) 5′-GCAGCCCAAGGAAUGGUGGAAACAA-3′ | Thermo Fisher Scientific | GNA13-HSS116479 |
| siRNA targeting sequence: ADAM17 5′-CAGAAUCGUGUUGACAGCAAAGAAA-3′ | Thermo Fisher Scientific | ADAM17-HSS186181 |
| Stealth siRNA control | Thermo Fisher Scientific | 12935113 |
| qPCR Primers for the GNAQ gene: 5′-ACCGAATGGAGGAAAGCAAGG-3′ 5′-CATCTCTCTGGGGTCCATCATATTC-3′ | This paper | N/A |
| qPCR Primers for the GNA11 gene: 5′-CAGCGAATACGACCAAGTCC-3′ 5′-ACCAGGGGTAGGTGATGATG-3′ | This paper | N/A |
| qPCR Primers for the GNA12 gene: 5′-GAGGGATTCTGGCATCAGG-3′ 5′-CGATCCGGTCCAAGTTGTC-3 | This paper | N/A |
| qPCR Primers for the GNA13 gene: 5′-CCTGGATAACTTGGATAAACTTGG-3′ 5′-TTCATGGATGCCTTTGGTG-3′ | This paper | N/A |
| qPCR Primers for the GAPDH gene: 5′-GCCAAGGTCATCCATGACAACT-3′ 5′-GAGGGGCCATCCACAGTCTT-3′ | This paper | N/A |
| Recombinant DNA | ||
| Human GPCR-encoding plasmids library | Inoue et al., 2012 and this study | N/A |
| AP-TGF-α (codon-optimized) | Inoue et al., 2012 | N/A |
| Chimeric Gα subunits | Inoue et al., 2012 and this study | N/A |
| NanoBiT-G-proteins | This study | N/A |
| NanoBiT-RhoA sensor | This study | N/A |
| NanoBiT-IP3 sensor | This study | N/A |
| M3D | This study | N/A |
| M4D | This study | N/A |
| M3D-Gs (codon-optimized) | This study | N/A |
| ICL3-swapped M3D constructs | This study | N/A |
| ICL3- and C-terminus-swapped M3D constructs | This study | N/A |
| M3D-GPR183/ICL3 | This study | N/A |
| M3D-GPR132/ICL3 | This study | N/A |
| Glo-22F (codon-optimized) | This study | N/A |
| Software and Algorithms | ||
| PyMol, Version 1.7.2 | N/A | https://pymol.org |
| Cytoscape, Version 3.5 | N/A | https://cytoscape.org/ |
| GraphPad Prism, Version 7 | GraphPad | N/A |
| Soft Max Pro, Version 7 | Molecular Devices | N/A |
| FlowJo software, Version 10 | FlowJo | N/A |
| Multi Gauge, Version 3.0 | Fujifilm | N/A |
| HMMER3, Version 3.1b2 | Eddy, Bioinformatics,1998 | http://www.hmmer.org/ |
| Numpy, Version 1.11 | N/A | http://www.numpy.org/ |
| Scipy, Version 0.18 | N/A | https://www.scipy.org |
| scikit-learn, Version 0.18 | Pedregosa et al., 2011 | https://www.scikit-learn.org |
| igraph, Version 0.7 | Csardi and Nepusz, 2006 | https://igraph.org/python/ |
| Other | ||
| 96W clear plate for cells | Greiner Bio-one | 655180 |
| 96W clear plate for conditioned media | Greiner Bio-one | 655101 |
| 96W white plate | Greiner Bio-one | 655083 |
| 96W white plate, half-area | Greiner Bio-one | 675083 |
| 96W black plate, half-area, clear-bottom | Greiner Bio-one | 675986 |
| Absorbance microplate reader | Molecular Devices | SpectraMax 340PC384 |
| Microplate stacker | Molecular Devices | StakMax |
| Luminescence microplate reader | Molecular Devices | SpectraMax L |
| Multi-mode, auto-pipetting microplate reader | Molecular Devices | FlexStation 3 |
| Flow cytometer | Sony | EC800 |
| Chemiluminescence imager | Fujifilm | LAS-4000 |
| An online resource for the G-protein-coupling data and the prediction tool | This study | gpcr.russelllab.org |
Highlights.
Large datasets of quantitative coupling between 148 human GPCRs and 11 G proteins
Identification of GPCR sequence-encoded features underlying G-protein selectivity
A powerful predictor for scoring G-protein coupling from a given GPCR sequence
Data-driven engineering of G12-selective designer GPCRs
ACKNOWLEDGMENTS
We thank Frederick J. Ehlert at University of California, Irvine and Sudarshan Rajagopal at Duke University for helpful comments on analyses of the chimeric G-protein-based assay; Michel Bouvier at University of Montreal for discussion on G-protein profiling; members of the laboratory at Tohoku University for plasmid preparation; Ayumi Inoue at Tohoku University for flow cytometry analyses. This work was supported by JSPS KAKENHI grant 17K08264 (A.I.); Japan Science and Technology Agency (JST), PRESTO JPMJPR1331 (A.I.); and the PRIME JP17gm5910013 (A.I.) and the LEAP JP17gm0010004 (A.I. and J.A.) from the Japan Agency for Medical Research and Development (AMED). N.A. is supported by training grants from the National Institute of General Medical Sciences (NIGMS) T32GM007752 and the National Science Foundation (NSF) DGE-1650112. J.S.G. is supported by relevant grants from the National Cancer Institute (NCI) R33CA225291 and U54CA209891; and the National Institute of Dental and Craniofacial Research (NIDCR) U01DE028227. F.R., G.S., and R.B.R. are supported by the Cell Networks Excellence initiative of the Germany Research Foundation (DFG). R.B.R. is part of the DFG SFB/TPR186 Molecular Switches in the Spatio-Temporal Control of Cellular Signal Transmission and the BMBF German Network for Bioinformatics (de.NBI). F.R. was additionally supported by an Alexander Von Humboldt post-doctoral fellowship (F.R.) and a Michael J. Fox Foundation research grant (F.R. and R.B.R.).
Footnotes
DECLARATION OF INTERESTS
A.I., F.R., J.A., and R.B.R. have filed a patent application related to this work.
SUPPLEMENTAL INFORMATION
Supplemental Information can be found online at https://doi.org/10.1016/j.cell.2019.04.044.
REFERENCES
- Altschul SF, Gish W, Miller W, Myers EW, and Lipman DJ (1990). Basic local alignment search tool. J. Mol. Biol 215, 403–410. [DOI] [PubMed] [Google Scholar]
- Angelova K, Felline A, Lee M, Patel M, Puett D, and Fanelli F (2011). Conserved amino acids participate in the structure networks deputed to intramolecular communication in the lutropin receptor. Cell. Mol. Life Sci 68, 1227–1239. [DOI] [PMC free article] [PubMed] [Google Scholar]
- Armbruster BN, Li X, Pausch MH, Herlitze S, and Roth BL (2007). Evolving the lock to fit the key to create a family of G protein-coupled receptors potently activated by an inert ligand. Proc. Natl. Acad. Sci. USA 104, 5163–5168. [DOI] [PMC free article] [PubMed] [Google Scholar]
- Ataei F, Torkzadeh-Mahani M, and Hosseinkhani S (2013). A novel luminescent biosensor for rapid monitoring of IP3 by split-luciferase complementary assay. Biosens. Bioelectron 41, 642–648. [DOI] [PubMed] [Google Scholar]
- Capper MJ, and Wacker D (2018). How the ubiquitous GPCR receptor family selectively activates signalling pathways. Nature 558, 529–530. [DOI] [PubMed] [Google Scholar]
- Carpenter B, Nehmé R, Warne T, Leslie AG, and Tate CG (2016). Structure of the adenosine A(2A) receptor bound to an engineered G protein. Nature 536, 104–107. [DOI] [PMC free article] [PubMed] [Google Scholar]
- Chen P, Zuo H, Xiong H, Kolar MJ, Chu Q, Saghatelian A, Siegwart DJ, and Wan Y (2017). Gpr132 sensing of lactate mediates tumor-macrophage interplay to promote breast cancer metastasis. Proc. Natl. Acad. Sci. USA 114, 580–585. [DOI] [PMC free article] [PubMed] [Google Scholar]
- Conklin BR, Farfel Z, Lustig KD, Julius D, and Bourne HR (1993). Substitution of three amino acids switches receptor specificity of Gq alpha to that of Gi alpha. Nature 363, 274–276. [DOI] [PubMed] [Google Scholar]
- Csardi G, and Nepusz T (2006). The igraph software package for complex network research. InterJournal Complex Systems 1695. http://igraph.org. [Google Scholar]
- Denker BM, Schmidt CJ, and Neer EJ (1992). Promotion of the GTP-liganded state of the Go alpha protein by deletion of the C terminus. J. Biol. Chem 267, 9998–10002. [PubMed] [Google Scholar]
- Devost D, Sleno R, Pétrin D, Zhang A, Shinjo Y, Okde R, Aoki J, Inoue A, and Hébert TE (2017). Conformational Profiling of the AT1 Angiotensin II Receptor Reflects Biased Agonism, G Protein Coupling, and Cellular Context. J. Biol. Chem 292, 5443–5456. [DOI] [PMC free article] [PubMed] [Google Scholar]
- Dijkstra E (1959). A note on two problems in connexion with graphs. Numer. Math 1, 269–271. [Google Scholar]
- Dixon AS, Schwinn MK, Hall MP, Zimmerman K, Otto P, Lubben TH, Butler BL, Binkowski BF, Machleidt T, Kirkland TA, et al. (2016). NanoLuc Complementation Reporter Optimized for Accurate Measurement of Protein Interactions in Cells. ACS Chem. Biol 11, 400–408. [DOI] [PubMed] [Google Scholar]
- Dorsam RT, and Kunapuli SP (2004). Central role of the P2Y12 receptor in platelet activation. J. Clin. Invest 113, 340–345. [DOI] [PMC free article] [PubMed] [Google Scholar]
- Dou Y, Wang J, Yang J, and Zhang C (2012). L1pred: a sequence-based prediction tool for catalytic residues in enzymes with the L1-logreg classifier. PLoS ONE 7, e35666. [DOI] [PMC free article] [PubMed] [Google Scholar]
- Draper-Joyce CJ, Khoshouei M, Thal DM, Liang YL, Nguyen ATN, Furness SGB, Venugopal H, Baltos JA, Plitzko JM, Danev R, et al. (2018). Structure of the adenosine-bound human adenosine A1 receptor-Gi complex. Nature 558, 559–563. [DOI] [PubMed] [Google Scholar]
- Eddy SR (1998). Profile hidden Markov models. Bioinformatics 14, 755–763. [DOI] [PubMed] [Google Scholar]
- Ehlert FJ, Griffin MT, Sawyer GW, and Bailon R (1999). A simple method for estimation of agonist activity at receptor subtypes: comparison of native and cloned M3 muscarinic receptors in guinea pig ileum and transfected cells. J. Pharmacol. Exp. Ther 289, 981–992. [PubMed] [Google Scholar]
- Finn RD, Coggill P, Eberhardt RY, Eddy SR, Mistry J, Mitchell AL, Potter SC, Punta M, Qureshi M, Sangrador-Vegas A, et al. (2016). The Pfam protein families database: towards a more sustainable future. Nucleic Acids Res. 44 (D1), D279–D285. [DOI] [PMC free article] [PubMed] [Google Scholar]
- Flock T, Ravarani CNJ, Sun D, Venkatakrishnan AJ, Kayikci M, Tate CG, Veprintsev DB, and Babu MM (2015). Universal allosteric mechanism for Gα activation by GPCRs. Nature 524, 173–179. [DOI] [PMC free article] [PubMed] [Google Scholar]
- Flock T, Hauser AS, Lund N, Gloriam DE, Balaji S, and Babu MM (2017). Selectivity determinants of GPCR-G-protein binding. Nature 545, 317–322. [DOI] [PMC free article] [PubMed] [Google Scholar]
- Galés C, Rebois RV, Hogue M, Trieu P, Breit A, Hébert TE, and Bouvier M (2005). Real-time monitoring of receptor and G-protein interactions in living cells. Nat. Methods 2, 177–184. [DOI] [PubMed] [Google Scholar]
- García-Nafría J, Lee Y, Bai X, Carpenter B, and Tate CG (2018a). Cryo-EM structure of the adenosine A2A receptor coupled to an engineered heterotrimeric G protein. eLife 7, 7. [DOI] [PMC free article] [PubMed] [Google Scholar]
- García-Nafría J, Nehmé R, Edwards PC, and Tate CG (2018b). Cryo-EM structure of the serotonin 5-HT1B receptor coupled to heterotrimeric Go. Nature 558, 620–623. [DOI] [PMC free article] [PubMed] [Google Scholar]
- Guettier JM, Gautam D, Scarselli M, Ruiz de Azua I, Li JH, Rosemond E, Ma X, Gonzalez FJ, Armbruster BN, Lu H, et al. (2009). A chemical-genetic approach to study G protein regulation of beta cell function in vivo. Proc. Natl. Acad. Sci. USA 106, 19197–19202. [DOI] [PMC free article] [PubMed] [Google Scholar]
- Hannenhalli SS, and Russell RB (2000). Analysis and prediction of functional sub-types from protein sequence alignments. J. Mol. Biol 303, 61–76. [DOI] [PubMed] [Google Scholar]
- Harding SD, Sharman JL, Faccenda E, Southan C, Pawson AJ, Ireland S, Gray AJG, Bruce L, Alexander SPH, Anderton S, et al. ; NC-IUPHAR (2018). The IUPHAR/BPS Guide to PHARMACOLOGY in 2018: updates and expansion to encompass the new guide to IMMUNOPHARMACOLOGY. Nucleic Acids Res. 46 (D1), D1091–D1106. [DOI] [PMC free article] [PubMed] [Google Scholar]
- Hauser AS, Attwood MM, Rask-Andersen M, Schiöth HB, and Gloriam DE (2017). Trends in GPCR drug discovery: new agents, targets and indications. Nat. Rev. Drug Discov 16, 829–842. [DOI] [PMC free article] [PubMed] [Google Scholar]
- Hauser AS, Chavali S, Masuho I, Jahn LJ, Martemyanov KA, Gloriam DE, and Babu MM (2018). Pharmacogenomics of GPCR Drug Targets. Cell 172, 41–54. [DOI] [PMC free article] [PubMed] [Google Scholar]
- Herroeder S, Reichardt P, Sassmann A, Zimmermann B, Jaeneke D, Hoeckner J, Hollmann MW, Fischer KD, Vogt S, Grosse R, et al. (2009). Guanine nucleotide-binding proteins of the G12 family shape immune functions by controlling CD4+ T cell adhesiveness and motility. Immunity 30, 708–720. [DOI] [PubMed] [Google Scholar]
- Horn F, van der Wenden EM, Oliveira L, IJzerman AP, and Vriend G (2000). Receptors coupling to G proteins: is there a signal behind the sequence? Proteins 41, 448–459. [DOI] [PubMed] [Google Scholar]
- Inoue A, Ishiguro J, Kitamura H, Arima N, Okutani M, Shuto A, Higashiyama S, Ohwada T, Arai H, Makide K, and Aoki J (2012). TGFα shedding assay: an accurate and versatile method for detecting GPCR activation. Nat. Methods 9, 1021–1029. [DOI] [PubMed] [Google Scholar]
- Insel PA, and Ostrom RS (2003). Forskolin as a tool for examining adenylyl cyclase expression, regulation, and G protein signaling. Cell. Mol. Neurobiol 23, 305–314. [DOI] [PMC free article] [PubMed] [Google Scholar]
- Isberg V, Mordalski S, Munk C, Rataj K, Harpsøe K, Hauser AS, Vroling B, Bojarski AJ, Vriend G, and Gloriam DE (2017). GPCRdb: an information system for G protein-coupled receptors. Nucleic Acids Res. 45, 2936. [DOI] [PMC free article] [PubMed] [Google Scholar]
- Kang Y, Kuybeda O, de Waal PW, Mukherjee S, Van Eps N, Dutka P, Zhou XE, Bartesaghi A, Erramilli S, Morizumi T, et al. (2018). Cryo-EM structure of human rhodopsin bound to an inhibitory G protein. Nature 558, 553–558. [DOI] [PMC free article] [PubMed] [Google Scholar]
- Kihara Y, Maceyka M, Spiegel S, and Chun J (2014). Lysophospholipid receptor nomenclature review: IUPHAR Review 8. Br. J. Pharmacol 171, 3575–3594. [DOI] [PMC free article] [PubMed] [Google Scholar]
- Koehl A, Hu H, Maeda S, Zhang Y, Qu Q, Paggi JM, Latorraca NR, Hilger D, Dawson R, Matile H, et al. (2018). Structure of the μ-opioid receptor-Gi protein complex. Nature 558, 547–552. [DOI] [PMC free article] [PubMed] [Google Scholar]
- Leng W, Pang X, Xia H, Li M, Chen L, Tang Q, Yuan D, Li R, Li L, Gao F, and Bi F (2013). Novel split-luciferase-based genetically encoded biosensors for noninvasive visualization of Rho GTPases. PLoS ONE 8, e62230. [DOI] [PMC free article] [PubMed] [Google Scholar]
- Martin D, Abba MC, Molinolo AA, Vitale-Cross L, Wang Z, Zaida M, Delic NC, Samuels Y, Lyons JG, and Gutkind JS (2014). The head and neck cancer cell oncogenome: a platform for the development of precision molecular therapies. Oncotarget 5, 8906–8923. [DOI] [PMC free article] [PubMed] [Google Scholar]
- Muppidi JR, Schmitz R, Green JA, Xiao W, Larsen AB, Braun SE, An J, Xu Y, Rosenwald A, Ott G, et al. (2014). Loss of signalling via Gα13 in germinal centre B-cell-derived lymphoma. Nature 516, 254–258. [DOI] [PMC free article] [PubMed] [Google Scholar]
- O’Hayre M, Inoue A, Kufareva I, Wang Z, Mikelis CM, Drummond RA, Avino S, Finkel K, Kalim KW, DiPasquale G, et al. (2016). Inactivating mutations in GNA13 and RHOA in Burkitt’s lymphoma and diffuse large B-cell lymphoma: a tumor suppressor function for the Gα13/RhoA axis in B cells. Oncogene 35, 3771–3780. [DOI] [PMC free article] [PubMed] [Google Scholar]
- Papaleo E, Saladino G, Lambrughi M, Lindorff-Larsen K, Gervasio FL, and Nussinov R (2016). The Role of Protein Loops and Linkers in Conformational Dynamics and Allostery. Chem. Rev 116, 6391–6423. [DOI] [PubMed] [Google Scholar]
- Patel YM, Lordkipanidzé M, Lowe GC, Nisar SP, Garner K, Stockley J, Daly ME, Mitchell M, Watson SP, Austin SK, and Mundell SJ (2014). A novel mutation in the P2Y12 receptor and a function-reducing polymorphism in protease-activated receptor 1 in a patient with chronic bleeding. J. Thromb. Haemost 12, 716–725. [DOI] [PubMed] [Google Scholar]
- Pedregosa F, Varoquaux G, Gramfort A, Michel V, Thirion B, Grisel O, Blondel M, Prettenhofer P, Weiss R, Dubourg V, et al. (2011). Scikit-learn: Machine Learning in Python. J. Mach. Learn. Res 12, 2825–2830. [Google Scholar]
- Raimondi F, Felline A, Portella G, Orozco M, and Fanelli F (2013a). Light on the structural communication in Ras GTPases. J. Biomol. Struct. Dyn 31, 142–157. [DOI] [PubMed] [Google Scholar]
- Raimondi F, Felline A, Seeber M, Mariani S, and Fanelli F (2013b). A Mixed Protein Structure Network and Elastic Network Model Approach to Predict the Structural Communication in Biomolecular Systems: The PDZ2 Domain from Tyrosine Phosphatase 1E As a Case Study. J. Chem. Theory Comput 9, 2504–2518. [DOI] [PubMed] [Google Scholar]
- Rasmussen SG, DeVree BT, Zou Y, Kruse AC, Chung KY, Kobilka TS, Thian FS, Chae PS, Pardon E, Calinski D, et al. (2011). Crystal structure of the β2 adrenergic receptor-Gs protein complex. Nature 477, 549–555. [DOI] [PMC free article] [PubMed] [Google Scholar]
- Rodriguez GJ, Yao R, Lichtarge O, and Wensel TG (2010). Evolution-guided discovery and recoding of allosteric pathway specificity determinants in psychoactive bioamine receptors. Proc. Natl. Acad. Sci. USA 107, 7787–7792. [DOI] [PMC free article] [PubMed] [Google Scholar]
- Salzberg SL (1997). On Comparing Classifiers: Pitfalls to Avoid and a Recommended Approach. Data Min. Knowl. Discov 1, 317–328. [Google Scholar]
- Saulière A, Bellot M, Paris H, Denis C, Finana F, Hansen JT, Altié MF, Seguelas MH, Pathak A, Hansen JL, et al. (2012). Deciphering biased-agonism complexity reveals a new active AT1 receptor entity. Nat. Chem. Biol 8, 622–630. [DOI] [PubMed] [Google Scholar]
- Schrage R, Schmitz AL, Gaffal E, Annala S, Kehraus S, Wenzel D, Büllesbach KM, Bald T, Inoue A, Shinjo Y, et al. (2015). The experimental power of FR900359 to study Gq-regulated biological processes. Nat. Commun 6, 10156. [DOI] [PMC free article] [PubMed] [Google Scholar]
- Seeber M, Felline A, Raimondi F, Mariani S, and Fanelli F (2015). WebPSN: a web server for high-throughput investigation of structural communication in biomacromolecules. Bioinformatics 31, 779–781. [DOI] [PubMed] [Google Scholar]
- Sgourakis NG, Bagos PG, and Hamodrakas SJ (2005a). Prediction of the coupling specificity of GPCRs to four families of G-proteins using hidden Markov models and artificial neural networks. Bioinformatics 21, 4101–4106. [DOI] [PubMed] [Google Scholar]
- Sgourakis NG, Bagos PG, Papasaikas PK, and Hamodrakas SJ (2005b). A method for the prediction of GPCRs coupling specificity to G-proteins using refined profile Hidden Markov Models. BMC Bioinformatics 6, 104. [DOI] [PMC free article] [PubMed] [Google Scholar]
- Sievers F, Wilm A, Dineen D, Gibson TJ, Karplus K, Li W, Lopez R, McWilliam H, Remmert M, Söding J, et al. (2011). Fast, scalable generation of high-quality protein multiple sequence alignments using Clustal Omega. Mol. Syst. Biol 7, 539. [DOI] [PMC free article] [PubMed] [Google Scholar]
- Stallaert W, van der Westhuizen ET, Schönegge AM, Plouffe B, Hogue M, Lukashova V, Inoue A, Ishida S, Aoki J, Le Gouill C, and Bouvier M (2017). Purinergic Receptor Transactivation by the β2-Adrenergic Receptor Increases Intracellular Ca2+ in Nonexcitable Cells. Mol. Pharmacol 91,533–544. [DOI] [PubMed] [Google Scholar]
- Sugimoto Y, and Narumiya S (2007). Prostaglandin E receptors. J. Biol. Chem 282, 11613–11617. [DOI] [PubMed] [Google Scholar]
- Suzuki N, Hajicek N, and Kozasa T (2009). Regulation and physiological functions of G12/13-mediated signaling pathways. Neurosignals 17, 55–70. [DOI] [PMC free article] [PubMed] [Google Scholar]
- Thomsen W, Frazer J, and Unett D (2005). Functional assays for screening GPCR targets. Curr. Opin. Biotechnol 16, 655–665. [DOI] [PubMed] [Google Scholar]
- Urban DJ, and Roth BL (2015). DREADDs (designer receptors exclusively activated by designer drugs): chemogenetic tools with therapeutic utility. Annu. Rev. Pharmacol. Toxicol 55, 399–417. [DOI] [PubMed] [Google Scholar]
- Van Eps N, Altenbach C, Caro LN, Latorraca NR, Hollingsworth SA, Dror RO, Ernst OP, and Hubbell WL (2018). Gi and Gs-coupled GPCRs show different modes of G-protein binding. Proc. Natl. Acad. Sci. USA 115, 2383–2388. [DOI] [PMC free article] [PubMed] [Google Scholar]
- Velankar S, Dana JM, Jacobsen J, van Ginkel G, Gane PJ, Luo J, Oldfield TJ, O’Donovan C, Martin MJ, and Kleywegt GJ (2013). SIFTS: Structure Integration with Function, Taxonomy and Sequences resource. Nucleic Acids Res. 41, D483–D489. [DOI] [PMC free article] [PubMed] [Google Scholar]
- Venkatakrishnan AJ, Deupi X, Lebon G, Tate CG, Schertler GF, and Babu MM (2013). Molecular signatures of G-protein-coupled receptors. Nature 494, 185–194. [DOI] [PubMed] [Google Scholar]
- Venkatakrishnan AJ, Flock T, Prado DE, Oates ME, Gough J, and Madan Babu M (2014). Structured and disordered facets of the GPCR fold. Curr. Opin. Struct. Biol 27, 129–137. [DOI] [PubMed] [Google Scholar]
- Venkatakrishnan AJ, Deupi X, Lebon G, Heydenreich FM, Flock T, Miljus T, Balaji S, Bouvier M, Veprintsev DB, Tate CG, et al. (2016). Diverse activation pathways in class A GPCRs converge near the G-protein-coupling region. Nature 536, 484–487. [DOI] [PMC free article] [PubMed] [Google Scholar]
- Violin JD, Crombie AL, Soergel DG, and Lark MW (2014). Biased ligands at G-protein-coupled receptors: promise and progress. Trends Pharmacol. Sci 35, 308–316. [DOI] [PubMed] [Google Scholar]
- Waterhouse AM, Procter JB, Martin DM, Clamp M, and Barton GJ (2009). Jalview Version 2-a multiple sequence alignment editor and analysis workbench. Bioinformatics 25, 1189–1191. [DOI] [PMC free article] [PubMed] [Google Scholar]
- Weinstein JBH (1995). Integrated methods for the construction of three-dimensional models and computational probing of structure-function relations in G protein-coupled receptors. Methods Neurosci. 25, 366–428. [Google Scholar]
- Wess J, Nakajima K, and Jain S (2013). Novel designer receptors to probe GPCR signaling and physiology. Trends Pharmacol. Sci 34, 385–392. [DOI] [PMC free article] [PubMed] [Google Scholar]
- Wettschureck N, and Offermanns S (2005). Mammalian G proteins and their cell type specific functions. Physiol. Rev 85, 1159–1204. [DOI] [PubMed] [Google Scholar]
- Wheeler TJ, Clements J, and Finn RD (2014). Skylign: a tool for creating informative, interactive logos representing sequence alignments and profile hidden Markov models. BMC Bioinformatics 15, 7. [DOI] [PMC free article] [PubMed] [Google Scholar]
- Wong SK (2003). G protein selectivity is regulated by multiple intracellular regions of GPCRs. Neurosignals 12, 1–12. [DOI] [PubMed] [Google Scholar]
- Woodward DF, Jones RL, and Narumiya S (2011). International Union of Basic and Clinical Pharmacology. LXXXIII: classification of prostanoid receptors, updating 15 years of progress. Pharmacol. Rev 63, 471–538. [DOI] [PubMed] [Google Scholar]
- Yabuki Y, Muramatsu T, Hirokawa T, Mukai H, and Suwa M (2005). GRIFFIN: a system for predicting GPCR-G-protein coupling selectivity using a support vector machine and a hidden Markov model. Nucleic Acids Res. 33, W148–W153. [DOI] [PMC free article] [PubMed] [Google Scholar]
Associated Data
This section collects any data citations, data availability statements, or supplementary materials included in this article.
Supplementary Materials
Data Availability Statement
The Python code used for the predictor is available on GitHub (https://github.com/raimondifranc/gpcr_coupling_predictor). Heat-maps in Figure 2 and 5 were generated using scipy (https://www.scipy.org/) and matplotlib python libraries (https://matplotlib.org/).