

Abstract
Movement triggered by sensory stimuli requires that the networks generating the motor commands receive an adequate driving input, which, in general, is a transformed version of the initial sensory signal. We investigated the nature of this transformation in a task in which monkeys categorize the speed of tactile stimuli as either low or high, reaching for one of two pushbuttons to indicate their choice. Extracellular recordings from primary motor cortex revealed two types of neurons selective for the speed categories: ones that fire at higher rates for low versus high speeds, and others that do the opposite. These differential responses are task-specific; no firing rate modulation was seen when identical arm movements were triggered by visual cues or when stimuli were delivered passively. Analyses using decoding and modeling techniques produced two main results. First, the neurons accurately encode the chosen category; an observer measuring their responses can exhibit a psychophysical performance during categorization identical to the monkey’s. Second, by analyzing separately the trials in which hits and errors were scored, it is possible to distinguish purely sensory activity from activity exclusively related to arm motion. The recorded responses did not match either of these alternatives but were consistent with a model in which the category-tuned neurons are the link between the output of the sensory categorization process and the motor command used to indicate the animal’s decision. Thus, the observed activity seems to encode a preprocessed version of the sensory stimulus and to participate in driving the arm motion.
Keywords: primary motor cortex, primary somatosensory cortex, sensorimotor transformations, categorization, tactile motion, decoding, modeling
A large body of evidence has accumulated establishing that primary motor cortex (M1, area 4) is involved in the control of voluntary movements (Evarts, 1981;Georgopoulos, 1995). Neuronal activity in this area strongly correlates with the parameters of arm motion, such as force and direction (Georgopoulos et al., 1988, 1992; Schwartz et al., 1988; Johnson et al., 1996), and with the geometry and mechanics of the joints (Thach, 1978; Caminiti et al., 1990, 1991; Werner et al., 1991; Scott and Kalaska, 1997). Activity in M1 related to sensory events or cues has been reported too (Lamarre et al., 1983; Martin and Ghez, 1985). Using paradigms that involve the manipulation of sensory information as well as the execution of arm movements, other studies have uncovered complex responses not uniquely related to motor performance but instead reflecting either sensory processing or intermediate sensorimotor representations (Alexander and Crutcher, 1990; Crutcher and Alexander, 1990; Hocherman and Wise, 1991; Mountcastle et al., 1992; Ashe et al., 1993; Riehle et al., 1994; Pellizzer et al., 1995; Shen and Alexander, 1997; Zhang et al., 1997). If well characterized, the stimulus-related signals at the sensorimotor interface should provide insight into the nature of the neural computations implemented to solve a behavioral task, especially when compared with representations of the sensory stimuli at earlier stages. These studies have demonstrated the participation of M1 in visuospatial and sensory- and task-related processing. However, to investigate the general problem of how sensory stimuli are mapped onto motor responses, it might be useful to impose an intermediate computation between the input and output stages of the process, so that these are strongly dissociated.
What kind of input drives the activity of motor cortical neurons during sensory-guided reaching? The present experiments address this question. Such input must be derived from the sensory stimulus detected by the monkey and should thus correlate with it or with some transformed version of it. We used a paradigm in which monkeys classify the speed of a probe moving across the tip of one finger and press one of two switches to indicate which category, low or high, was chosen (Romo et al., 1996). The input signal, motion speed, is varied systematically. The output of the task, the arm movement, does not depend directly on the stimulus but on a function of the stimulus, its category, which the monkey has to compute to obtain a reward. Therefore, the following questions can be posed. First, is there a neuronal signal in M1 that correlates with speed category? In other words, is there a neural representation of the monkey’s decision in M1? Second, its existence is assumed simply because the monkey’s choice has to be communicated to the motor networks, but is it possible to show that such activity is involved in triggering or directing limb movements? Here we report on M1 neurons that respond to tactile motion only when the animal categorizes such a stimulus. We first describe the paradigm, neuronal responses found, and control experiments. This is followed by analytical results that (1) quantify the relationship between measured activity and psychophysical performance and (2) suggest a functional role for these neurons as an intermediate step between the categorization process and the arm movement command.
MATERIALS AND METHODS
Categorization paradigm. The study was performed on four male monkeys, Macaca mulatta, 4.5–6 kg. The task and related procedures are similar to those described previously by Romo et al. (1996, 1997) and Merchant et al. (1997). The monkey sat on a primate chair with its head fixed. The left hand was restrained through a half-cast and kept in a palm-up position. The right hand operated an immovable key (elbow joint at ∼90°) and two pushbuttons in front of the animal, 25 cm away from the shoulder and at eye level. The centers of the switches were located 7 and 10.5 cm to the right of the midsagittal plane. In all trials the monkey first placed the right hand on the key and later projected it to one of the switches.
Stimuli were delivered by a custom-built tactile stimulator (Romo et al., 1993b) with a 2 mm round tip. They were applied to the glabrous skin of the distal segments of fingers 2–4 of the left, restrained hand. The probe was oriented perpendicular to the skin and traversed a constant distance of 6.5 mm in a fixed direction, distal to proximal, and with a constant force of 20 gm. It moved at one of 10 speeds between 12 and 30 mm/sec, and the monkey had to indicate whether the speed was low (12, 14, 16, 18, or 20 mm/sec) or high (22, 24, 26, 28, or 30 mm/sec) by projecting the right hand to one of the pushbuttons. Correct categorization was rewarded with a drop of liquid. Low speeds correspond to the medial button, and high speeds correspond to the lateral one. Hence the speeds were of two types, low or high, and the arm movements were also of two types, medial or lateral. Each animal took ∼1.5 months of training to achieve a 75–90% correct performance level. However, before the M1 recordings all monkeys had worked on the task for at least 2 additional months. Animals were handled according to institutional standards that meet or exceed those of the National Institutes of Health and Society for Neuroscience.
The sequence of events at each trial was as follows: the probe was lowered and indented the skin, and the monkey had to react to the indentation by placing its right hand on the immovable key within 1 sec; after a variable delay period between 1 and 4.5 sec, the probe started moving (ON) at one of the 10 speeds; after the probe stopped moving (OFF) the monkey released the key (KR) in a time not exceeding 600 msec and projected the free hand to one of the target switches in <500 msec; if the selected category was the correct one, the animal received a reward. The time elapsed between the end of probe motion and the onset of arm movement (OFF to KR), when the animal released the key, is the reaction time. The time elapsed between the key release and the target switch interruption is the movement time.
Because we were interested in finding motor cortical activity related to sensory events, it was crucial to minimize or eliminate modulatory effects arising from the well known dependence on arm movement direction (Schwartz et al., 1988; Georgopoulos et al., 1986, 1988,1989) or on parameters that covary with it. The setup was thus arranged to filter out the classic directionally tuned responses. The distance between target switches was 3.5 cm, and these were 18 cm away from the immovable key. Thus the difference between medial and lateral movements was ∼11°. On average, the directional cells reported by Schwartz et al. (1988, their Fig. 13) fire at frequencies that range between ∼5 and 25 spikes/sec, corresponding to their antipreferred and preferred directions, respectively. Therefore, on average, directional cells modulate their firing rates by ∼20 spikes/sec when movement direction changes by 180°. The expected effect of an 11° change in direction is thus on the order of 1 spike/sec. Under these conditions some activity related to arm motion may be expected, but it should be practically identical for the two arm movements.
Visual instruction task. A simpler task, in which the same arm movements were triggered by visual cues, was used as a control (Romo et al., 1997). Trials in this test started with the probe touching the skin and one of the target switches being illuminated (ON), after which the monkey had to hold the immovable key. Then, after a variable delay period during which the light was kept on, the light was turned off, and the probe was simultaneously lifted (OFF); the monkey was rewarded for pressing the previously illuminated button. In this case the probe tip was lowered and raised but did not move across the skin. Arm movements in this situation were identical to those in the categorization task but were cued by visual stimuli.
Muscle activity. To evaluate the consistency with which arm movements were performed, electromyographic (EMG) activity was continuously monitored through Teflon-coated, stainless steel wires chronically implanted in the right arm. Every day M1 neurons were recorded simultaneously with the extensor digitorum communis, the biceps brachii, or the triceps brachii. In separate sessions, these and additional muscles from the shoulder, neck and trunk were also recorded, along with activity from the forearm and arm muscles of the left side. Muscles ipsilateral to the responding arm studied in these extra sessions were the anterior and lateral deltoids, the thoracic paraspinal, and the suprascapular and infrascapular trapezius (seeMerchant et al., 1997, their Fig. 2). EMGs were filtered, rectified, and converted into digital pulses representing multiunit activity. For the traces in Figure 2, this multiunit activity was used to construct histograms. First, spike counts, averaged over several trials, were computed for every 5 msec bin and were divided by the bin size to obtain instantaneous firing rates. These raw histograms were then smoothed by convolution with a Gaussian function of unit area and SD ς = 5.25 bins = 26.25 msec. The final smoothed histograms may also be interpreted as muscle spike densities (the original analog signals might have served as continuous indicators of muscle activity but unfortunately were not saved).
Fig. 2.

Muscle activity during the categorization task. The three rows correspond to three muscles recorded in different sessions: extensor digitorum communis (EDC), biceps brachii (BIC), and triceps brachii (TRI). All trials were aligned with arm movement onset, i.e., with key release (KR), indicated by thecontinuous vertical lines. The dashed lines indicate the average probe movement offset (OFF). The target switches were reached at ∼230 msec after KR. From the muscle spike trains recorded in each trial, smoothed histograms were constructed. Eachtrace represents a mean smoothed histogram averaged over ∼10 trials. Only correct categorizations were considered here. In each panel, five traces have been superimposed. These correspond to the five speeds that are associated with the same arm movement, medial (left column) or lateral (right column). The traces are comparable to the histograms shown in Figures 3B and 4B. Activity rises ∼50 msec before key release and is similar for the two movements.
Neuronal responses. Neuronal activity from M1 was recorded extracellularly from the left hemispheres of the four macaque monkeys by using glass-coated platinum–iridium microelectrodes (2–3 MΩ). On all recording sessions, acceptable penetration sites were first identified. The criterion was that, throughout the penetration track (maximum depth of 2000 μm), neurons were found that responded both during the task and to passive movements of the right arm. The passive responses had to be related to shoulder and elbow joints; when they were associated with wrist and finger movements the penetration was discarded. If these conditions were met, then other neurons with different characteristics but recorded in the same penetration were also studied and considered in the analysis.
For all recorded neurons, tuning curves were obtained by calculating the mean firing rate and SD as a function of speed (see Figs.3C, 4C, filled symbols and error bars). We define fi(s) and ςi(s) as the mean firing rate and SD, respectively, of neuron i at speed s, wheres takes any of the 10 values between 12 and 30 mm/sec that were used. Firing rates were computed by counting the spikes in each of three possible periods of activation: during stimulation, during the reaction time, and during movement. Mean values and SDs were obtained by considering a number of trials, typically 10, for each speed. A neuron was considered differential or category-tuned if it passed two tests: (1) a Kruskal-Wallis test to determine whether its mean firing rate was significantly (p < 0.05) modulated by speed, and (2) a Wilcoxon test to determine whether the mean firing rates for the low and high categories were significantly (p < 0.01) different (Siegel and Castellan, 1988). For neurons that responded differentially in more than one of the three periods, only activity during the reaction time was considered in the analysis. For neurons that had phasic responses or long latencies, a window with a fixed 210 msec length (after the latency) was used instead of the full duration of the activation period.
Fig. 3.

Responses of a neuron in primary motor cortex (M1) selective for low speeds. A, Spike rasters recorded during the tactile categorization task. This cell is activated during the reaction time, between stimulus offset and key release, and fires at higher rates for low speeds. Stimulus speed is indicated on the left. Each rowcorresponds to one trial. For each speed, 10 trials are shown in order of increasing reaction time. Small dots correspond to action potentials, and large symbols correspond to behavioral events: stimulus onset (ON), stimulus offset (OFF), and release of the behavioral key (KR), in that order. For clarity, the times at which the monkey pressed the target switches are not shown; they occur ∼230 msec after KR. Stimulation time varies with speed, because the distance traversed by the probe was kept constant.B, Instantaneous firing rate histograms for the data shown in A. Spike counts in each 10 msec bin were averaged over trials and smoothed using a Gaussian window (see Materials and Methods). The long vertical line indicates stimulus offset. The scale bar applies to all histograms.C, Mean firing rate during the reaction time (OFF to KR) as a function of stimulus speed. Each point is the average over the 10 corresponding trials shown in A; error bars indicate ±1 SD. For the sigmoidal fit (Eq. 1) the following parameters were used:A1 = 6.2; A2 = 21.0; s0 = 20.8; w = −0.72. Firing rate units are spikes per second.
Fig. 4.

Responses of a neuron in M1 that is selective for high speeds. The same labels and conventions as in Figure 3 apply. The following parameters were used for the sigmoidal fit:A1 = 7.6; A2 = 27.8; s0 = 20.1; w = 0.64.
Firing rate histograms for individual neurons were similar to those constructed for muscle activity. The mean spike count, averaged over a number of trials, was computed every 10 msec. The counts were divided by the bin size, and the resulting firing rate histogram was then smoothed by convolution with a Gaussian function of unit area and SD ς = 2.75 bins = 27.5 msec.
In some of the figures, sigmoidal functions were used to fit the data of mean firing rate versus speed. The following equation was used:
| Equation 1 |
where s is the stimulus speed,A1 and A2 are the minimum and maximum values of R, respectively,s0 is the value at which r = (A1 + A2)/2, andw determines the slope of the function. These fits were used only for display purposes, to show that the differential neurons behave like switches; they were not used in the analyses.
Response latencies for individual trials were computed using a procedure similar to the Poisson spike train analysis developed byHanes et al. (1995) (Thompson et al., 1996). First, the mean firing rate of a neuron during the whole trial was computed. Then, for all clusters of n consecutive spikes, the probability of the neuron firing that cluster was computed assuming a Poisson spike generation process with a constant rate equal to the measured mean rate. Clusters with rates above the mean and with probability below a predetermined criterion were considered part of the activation period. The first cluster to fall below the criterion determined the onset of activity, or latency. Similarly, the last cluster falling below the criterion determined the offset of activity. The two parameters,n and the criterion, could be adjusted for each cell so that a desired condition was satisfied, for example, that the resulting distribution of latencies, considering all trials, had minimum variance.
Anatomical study. Recording microelectrodes were inserted through a stainless steel chamber placed above M1. Electrode penetrations were made into the arm region, as determined by the neurophysiological criteria described above. Records were kept of the coordinates with respect to the edges of the chamber, where thin wires (125 μm), like those used for the microelectrodes, were inserted and used as guide points. In the final recording sessions, microlesion marks were made at several depths by passing negative current through the electrode tip (10 μA for 20 sec). Blocks of the left hemispheres containing the central and arcuate sulci were sectioned every 50 μm and stained with cresyl violet. The penetrations were then located with respect to the guide points and microlesions, using the micrometer readings. Figure 1 shows a composite of all penetration sites at which differential neurons were found; they have been projected onto one of the brains studied. Penetrations were confined to the anterior bank and crown of the central sulcus, medial to the level of the genu of the arcuate sulcus and lateral to the precentral dimple.
Fig. 1.

Lateral view of the left cerebral cortex of monkey 3 indicating recording sites. Dots correspond to microelectrode penetration sites in which differential responses were found for the four animals studied. Penetrations were located in the arm region of the primary motor cortex. AS, Arcuate Sulcus; CS, central sulcus; IPS, intraparietal sulcus.
Simulation and decoding methods. In all computer simulations, the responses of a population of Ncategory-tuned neurons were generated multiple times. On a given iteration, corresponding to one trial of the categorization task, the firing rate of neuron i is given by
| Equation 2 |
where s is the stimulus speed, εi and η are uncorrelated Gaussian random variables with zero mean and unit variance, and ρ is the mean pairwise correlation coefficient between the neurons. The square brackets indicate rectification: [x]+ = 0 if x < 0 and [x]+ = x otherwise; this guarantees that no negative rates are produced. Herefi(s) is the same measured quantity described above; it corresponds to the tuning curve of neuroni, obtained by counting the recorded spikes in the activation period of the neuron and averaging over trials (see Neuronal responses). Similarly, ςi(s) corresponds to the previously measured SD. For each neuron and each speed, these two quantities are fixed. In contrast, the values of the Gaussian variables εi and η are renewed in each iteration. Notice, however, that η is the same for all neurons. Gaussian random variables are generated by the computer according to a standard algorithm (Press et al., 1992): a set of uniformly distributed values, produced by a random number generator, are mathematically transformed such that the resulting quantities have a Gaussian distribution. The notation {ri} refers to a set ofN firing rates from N neurons simulated according to the above equation.
For each neuron, this model (Eq. 2) produces firing rates that vary from one iteration to another but that are statistically indistinguishable from the experimentally measured ones (if the implicit assumption of Gaussian statistics is correct, which was true for most neurons tested). To see this, consider the angle brackets, 〈〉, to indicate average value or expectation at a fixed speed. Then, to state mathematically that εi has zero mean and unit variance corresponds to 〈εi〉 = 0 and 〈εi2〉 = 1. Similarly, 〈εiη〉 = 0 indicates that εi and η are independent. From this and Eq. 2 it follows that, for each speed s, the mean of the simulated firing rates of neuron i is 〈ri〉 =fi(s), and its variance is 〈(ri −fi(s))2〉 = ςi2(s). The quantities ρ and η allow the effect of neuron–neuron correlations to be considered in a simplified manner. For each speed, the correlation coefficient (Pearson’s r) between the simulated responses of neuronsi and j is:
| Equation 3 |
By definition, ρ varies between −1 and 1. In most simulations it is set to zero, except when the effects of correlations are explicitly investigated. This model for correlated fluctuations is essentially identical to the one used by Britten et al. (1992).
Decoding methods coupled to computer simulations were used (Salinas and Abbott, 1994, 1995; Sanger 1996) to construct neuronal performance curves directly comparable to the psychometric data that quantify the monkeys’ behavior. We refer to these as neurometric curves. When decoding, a set of N firing rates from N neurons tuned to some quantity x is used to construct an estimatexest of the true value that x had when the rates were (simultaneously) measured. A decoding method is a particular recipe to combine the N rates with previous knowledge about the firing statistics of the neurons to generatexest. Signal detection theory has been used previously to compare psychophysical behavior and expectedbehavior—xest is never actually computed—based on the optimal processing of individual neuronal responses (Britten et al., 1992; Shadlen et al., 1996; Thompson et al., 1996; Merchant et al., 1997; Romo et al., 1997). We chose decoding techniques instead because they provide, on a trial by trial basis, a real construct that, unlike the signal detection method, is not limited to single neurons and can be applied to neuronal populations. The estimates produced by decoding may also approximate ideal performance quite closely.
Forty neurons, 20 selective for low and 20 selective for high speeds, had at least eight trials per speed and were included in the decoding analysis. Their simulated responses, {ri}, were used, rather than their true responses, because this allows large numbers of trials to be generated as if all neurons had been recorded simultaneously. In the computer, an iteration of the decoding procedure runs as follows: a speed is selected, and the responses of Nneurons chosen randomly from the population of 40 are generated according to Eq. 2; then the N firing rates are fed into a decoding method, which produces an estimate of the speed category, and finally the estimated category is compared with the category that the selected speed belonged to, resulting in either a hit or an error. After several thousand iterations the fraction of correct categorizations as a function of speed, i.e., the neurometric curve, is obtained.
Two entirely different decoding techniques were used: the maximum likelihood method and the comparison method. By Bayes’ theorem the probability that the category was C, given the set of firing rates {ri}, is:
| Equation 4 |
The maximum likelihood approach (Salinas and Abbott, 1994, 1995;Sanger, 1996) chooses as the estimated the category, high or low, that which maximizes the above expression with respect to C. In our case P(C) = 1/2, andP({ri}) is independent ofC, so onlyP({ri}‖C), a measured quantity, needs to be maximized. To constructP({ri}‖C), Gaussian statistics and independence between neurons were assumed. Based on the Gaussian hypothesis, the probability that the single neuroni fired at a rate ri, given that the speed was s, is:
| Equation 5 |
where fi(s) and ςi(s) are the measured mean firing rate and SD of neuron i, respectively. Additional corrections may be included to take into account that ri cannot be negative; commonly the impact of these corrections is small. Assuming independence between neurons, the probability of observing a set of firing rates {ri}, given that the speed wass, is simply the product of the individual probabilities:
| Equation 6 |
Maximizing this expression with respect to s gives the most probable speed. The estimated category can be set as the category to which the most probable speed belongs. Alternatively, one can average all the probabilitiesP({ri}‖s) for speeds belonging to a given category:
| Equation 7 |
where P(s‖C) = 1/5 for all the speeds that belong to category C, andP(s‖C) = 0 for those values ofs that do not belong to C. To find the estimated category one needs to determine which of the two values,C = low or C = high, maximizes Equation7, having substituted Equations 5 and 6 into it. This is the procedure that was used in the simulations. The only parameter in the maximum likelihood method is the number of decoded neurons, N.
The comparison decoding method is essentially the same strategy reported previously in studies of visual motion discrimination (Britten et al., 1992; Shadlen et al., 1996). In the corresponding simulations, two quantities are computed based on the N synthetic firing rates {ri}: the sum of all the firing rates of neurons that are selective for low speeds,SL, and the sum of the firing rates of those selective for high speeds, SH. The two sums or pooled signals are then compared, and the estimated categoryC is:
| Equation 8 |
The constant c is included to compensate for overall differences in firing rates across the two populations (see Fig 5; note the average values at 20 mm/sec). The value used, c = 0.58, was chosen to optimize the match between psychometric and neurometric performance. This comparison rule is akin to a winner-take-all network with only two competing units (Hertz et al., 1991). When the category-tuned neurons are assumed to trigger a movement, the procedure is identical, except thatSL > cSH corresponds to a medial movement, and SL <cSH corresponds to a lateral one. Notice that, from the algorithmic point of view, decoding the speed category and generating an arm movement are exactly the same. The difference is a matter of interpretation, but it is worth stating; in the first case an observer estimates the speed category from the neuronal activity, whereas in the second case the same activity drives a network that produces an arm movement; the network itself acts as the decoder, because each speed category corresponds to a movement.
RESULTS
Motor performance
Throughout the experiments, the key-to-switch movements performed by the monkeys were highly stereotyped; the animals could even perform the task in total darkness. This observation was confirmed by continuously monitoring at least one muscle of the right arm; neuronal recordings were usually accompanied by muscle recordings. Figure2 illustrates the activity of the three muscles that were frequently monitored. Each of the five traces in each panel represents an average of ∼10 trials during which the same stimulus speed was used. The responses to medial and lateral movements are very similar, particularly during the onset of activity, which occurs ∼50 msec before the key release. Separate experiments in which these and other muscles were studied gave similar results (see Materials and Methods; Merchant et al., 1997, their Fig. 2). Differences in muscle activity between the two movements were always small, and activity was hardly ever detected earlier than 50 msec before the onset of arm movement. The regularity of motor performance was also reflected in the reaction and movement times, which averaged 372 ± 35 (SD) and 229 ± 41 msec, respectively. These quantities showed minimal variations from day to day.
Neuronal responses
All recordings in this study were confined to the arm region of M1, as determined by neurophysiological criteria explained in Materials and Methods. Figure 1 shows the loci of all electrode penetrations in which differential responses were found, which included almost all penetration sites. Additionally, the experimental setup was arranged so that the arm movements to the two target switches were as similar as possible, to minimize the modulation caused by directional tuning (Schwartz et al., 1988; Georgopoulos et al., 1986, 1988, 1989). As expected, a large majority of the total of 477 recorded neurons responded but did so irrespective of stimulus speed or movement direction. In other words, the activity of most neurons was modulated by the task in some way, but this modulation did not change as a function of speed. More than half of these responsive but nontuned cells increased their firing rate during the reaction time and/or during the arm motion (n = 249). About one-fifth of the neurons (n = 101) displayed intense preparatory activity starting after the hand was placed on the key and usually stopping at the onset of probe movement (Tanji and Evarts, 1976;Alexander and Crutcher, 1990). Some other neurons were active exclusively during stimulation (n = 32) or started firing during stimulation and sustained the discharge throughout the reaction or movement periods (n = 24).
Apart from these nontuned neurons, 71 (14.9%) did respond differentially, typically reacting much more intensely to one of the two speed categories versus the other. They were thus of two types: selective for low and selective for high speeds. Examples are shown in Figures 3 and4. About half of the category-tuned neurons (n = 32) responded only during the reaction time, between the end of stimulation and the onset of hand–arm movement. Others were active also (n = 7) or exclusively (n = 12) during stimulation, and some others were active also (n = 5) or exclusively (n = 15) while the movement was executed. It should be noted that none of these units responded when the experimenter displaced the monkey’s arm passively. The firing rates as functions of stimulus speed typically have sigmoidal shapes (Figs. 3C,4C), which are most evident when the responses of several neurons selective for the same speed category are averaged, as was done in Figure 5. These plots show that, on average, the differential modulation is fairly strong, on the order of 15–20 spikes/sec. The curves behave like complementary switches, with graded changes at ∼20 mm/sec and saturating at the extremes. Indeed the data points are very well fit by sigmoidal functions. In contrast, speed tuning in the primary sensory area is altogether different. Neurons in the primary somatosensory cortex (S1) respond to the same tactile stimuli in two ways: their firing rates either increase linearly with speed or stay constant, but above baseline, for all speeds (Romo et al., 1996) (E. Salinas and R. Romo, unpublished results). The results described below suggest that the differential responses in M1 act as a sensorimotor interface.
Fig. 5.

Mean firing rates for the two populations of category-tuned neurons. Top, The tuning curves of 20 neurons selective for low speeds (as in Fig. 3C) were averaged. Error bars indicate ±1 SD with respect to the 20 means. Thecontinuous line is a fit to Equation 1 with the following parameters: A1 = 5.6;A2 = 22.5; s0 = 20.5; w = −1.6. Bottom, Average tuning curve for 20 neurons selective for high speeds. Thecontinuous line was fitted with the following parameters: A1 = 12.1;A2 = 30.4; s0 = 20.1; w = 1.1.
Forty-two category-tuned neurons were tested in a control experiment in which the monkeys made identical movements toward the target switches but were guided by visual cues. Only 13 neurons gave responses that were significantly different for the two movements (Wilcoxon,p < 0.01), whereas 17 responded nonselectively, and 12 did not increase their firing rates above baseline. Therefore, more than two-thirds of the differential neurons drastically changed their behavior when the categorization process was absent, but the same movements were triggered by another sensory modality. Figure6 shows an example. During categorization, this neuron fired at ∼40 and 18 spikes/sec for its preferred and nonpreferred categories, respectively. In contrast, during the visually cued task the neuron always fired at ∼5 spikes/sec, very close to baseline. Afterward this unit was tested again in the categorization task and again showed a strong preference for low speeds.
Fig. 6.

Neuronal responses during categorization and during the visual instruction task. The spike rasters inA and the histograms in Bdepict the responses of a neuron that is selective for low speeds during the categorization task; they are similar to those in Figure 3.C, Spike rasters for the same neuron tested in the visual control task, during which the animal made identical arm movements to the target switches, medial (M) and lateral (L), but no categorization took place. Large symbols indicate events: light off and key release, in that order. D, Firing rate histogram for the data shown in C. The neuron was first tested in the categorization task (100 trials), then in the visual task (40 trials), and again during categorization (100 trials). The histograms in B andD are based on all the data collected; they represent 20 trials per class. The scale bar applies to all histograms.E, Mean firing rates for all medial and lateral movements made during categorization (black bars) and during the visual task (gray bars). Error bars indicate 1 SD. Firing rate units are spikes per second. The strong differential activity seen during categorization disappears when the same movements are triggered by visual cues.
In another control situation the tactile stimuli were delivered passively. The stimuli were identical to those used during categorization, but the animal’s key was removed, and the movements of its right arm were restricted. None of the five category-tuned neurons tested responded in this condition (Wilcoxon, p > 0.34). An example is shown in Figure 7. For this cell, 100 categorization trials were run first, followed by 100 passive trials, followed by a second block of categorization trials. During passive stimulation the neuron fired very weakly at all speeds, as opposed to the intense, selective activity exhibited while categorizing. These tests show that the majority of the responses were not only stimulus-specific but also task-specific. As a comparison, note that S1 neurons responded identically in the passive and categorization conditions (Romo et al., 1996).
Fig. 7.

Neuronal responses during categorization and during passive stimulation. Left, Instantaneous firing rate histograms for a neuron selective for low speeds during categorization. Stimulus speed is indicated on the left. Here trials have been aligned with stimulus onset (ON), indicated by the long, vertical line, rather than with stimulus offset (OFF). Right, Responses of the same neuron when identical tactile stimuli were delivered but the monkey’s key was removed and its arm movements were restricted. In this condition the cell does not respond. This neuron did not respond in the visual instruction task either. The histograms for categorization are based on 20 trials per speed, 10 before and 10 after the passive test. The histograms for passive stimulation are based on 10 trials per speed. The scale bar applies to all plots.
Neuronal versus behavioral performance
The psychophysical performance exhibited by the monkeys during the recording sessions can be compared with the performance expected solely on the basis of a population of category-tuned neurons. Decoding techniques were used to construct neurometric performance curves from the recorded activity. These curves represent the average accuracy with which an observer can determine the speed category at a given trial, given only two pieces of information: the set of category-tuned responses (e.g., firing rates) at that trial and some previous characterization of the response statistics of the neurons. In our case, this characterization corresponds to the tuning curves and SDs of the cells (as in Figs. 3C, 4C). To decode we first used the maximum likelihood method, which under certain assumptions is statistically optimal (Salinas and Abbott, 1994, 1995;Sanger, 1996). Figure 8 compares psychometric and neurometric performance. Figure 8Ashows the performance of the monkeys averaged over all trials in which the 40 category-tuned neurons included in this analysis were recorded. The curve is not symmetric; categorization at 20 mm/sec is noticeably worse than at 22 mm/sec, and a large drop in performance occurs between 18 and 20 mm/sec. In Figure 8B, open symbols represent the accuracy obtained by decoding from a single, selected neuron. Based on the responses of this single neuron, the observer performs with an accuracy close to that of the animal itself. This interesting phenomenon has been pointed out and discussed before (Britten et al., 1992, 1996; Rieke et al., 1996; Shadlen et al., 1996).Filled symbols correspond to the accuracy forn = 1 averaged over the 40 neurons. On average, the performance of a single neuron is actually quite lower than that of the monkeys. Notice, however, that the shapes of this curve and the psychometric one are not too different. The major discrepancy is a vertical shift between them, which suggests that a good match might be achieved by including more neurons. This is confirmed in Figure8C, which shows the average decoding accuracy usingn = 4 neurons. The curve is similar to the one forn = 1 but is shifted upward. It agrees very closely with the psychometric curve; in particular it correctly replicates its asymmetry.
Fig. 8.

Comparison between psychometric and neurometric performance. A, Psychophysical performance of the monkeys in the categorization task. Behavioral performance is quantified by the fraction of correct categorizations as a function of stimulus speed. For comparison, the same data are indicated bydashed lines in the rest of the plots. The results in the other panels were obtained from the analysis of 40 category-tuned neurons. Each point in A represents ∼500 trials from the sessions in which the 40 neurons were recorded.Connecting lines are drawn only to guide the eye. The rest of the curves represent the expected performance of an observer that measures the responses of the category-tuned neurons and estimates or decodes from them the speed category. B, Accuracy in categorization based on decoding of a single selected neuron (open circles) and based on one neuron on average over the population of 40 cells (filled circles). At each trial, speed category was estimated from one simulated response by using the maximum likelihood algorithm. For the average curve, a neuron was selected randomly in each iteration; for the single-neuron curve the same neuron was selected every time. Points are based on 50,000 iterations. The large number guarantees that the computed averages are close to the true averages. C, Average accuracy in categorization based on four category-tuned neurons and obtained with the maximum likelihood method. In each iteration, the category was estimated from the responses of four randomly chosen neurons. Points are based on 50,000 iterations.D, Average accuracy in categorization based on 19 category-tuned neurons and obtained with the comparison method (Eq. 8,c = 0.58). Points are based on 100,000 iterations. When the observer combines the responses of several neurons, he can perform the task almost exactly as the monkeys.
To prove that this agreement does not depend critically on an optimal decoding or readout, we also used an entirely different, much simpler approach that we call the comparison method. It is based on computing and comparing two quantities, SL andSH, which are the sums of all of the responses of neurons selective for low and high speeds, respectively. A similar two-pool strategy was used by Britten et al. (1992) and Shadlen et al. (1996) to compare psychophysical and neuronal population performance in a visual motion discrimination task. The fraction of correct categorizations obtained with this method, forn = 19, is shown in Figure 8D. The match between this curve and the psychometric one is as good as with maximum likelihood. The excellent agreement indicates that the differential responses encode the speed category with the same precision as the animal itself. They are representations of the category that require no further processing. Indeed, the firing rates of S1 neurons either increase linearly with speed or stay constant for all speeds (Romo et al., 1996), and the similarly decoded curves do not agree with the monkey’s performance with either method. In particular, the curve for n = 1 is much smoother, totally lacking the characteristic triangular shape at ∼20 mm/sec (Salinas and Romo, unpublished results).
These results can be affected by correlations in the firing fluctuations of the neuronal population (Britten et al., 1992; Zohary et al., 1994; Shadlen et al., 1996). Parameter ρ in Eq. 2 represents the mean pairwise correlation coefficient between the neurons and was used to evaluate the effect of these correlations (in previous simulations ρ = 0). In this case it is useful to consider the category-tuned neurons selective for low and high speeds as belonging to two distinct neuronal pools, such that within-pool correlations, i.e., between neurons selective for the same categories, may be different from across-pool correlations, i.e., between neurons selective for different categories. In general, introducing small pairwise correlation coefficients (ρ ≈ 0.05) always had a minimal impact on the results. When correlations across pools were identical to those within pools, even fairly large values were tolerated. For example, with ρ = 0.25 the points in Figure 8Dchanged by an average of 0.5%, with a maximum of 2.2%. In contrast, for ρ = 0.25, neuronal performance did degrade appreciably when neurons belonging to different pools were not correlated (for these simulations each pool required its own, independent variable η in Eq.2). However, a good match with the psychophysics could still be obtained by increasing N. In the computational studies of visual motion discrimination, two neuronal pools were also included, and across-pool correlations were considered to be zero (Shadlen et al., 1996). Although the correlations among differential neurons were not measured, our simulation results suggest that their impact depends on how they are distributed across functional units and on precisely how these units interact. A similar point has been raised by Lee et al. (1998) regarding directionally tuned neurons.
Analysis of latencies
The times of onset of increased neuronal activity, or latencies, were measured on individual trials for 33 category-tuned neurons that responded during the stimulation and/or reaction periods. These times were obtained with respect to three events in the task that served as zero time references: probe movement onset (ON), probe movement offset (OFF), and arm movement onset (KR). If the responses are tightly linked to one of these events, then the latency distribution in which that event was the reference should exhibit significantly smaller variance than the other two distributions (Hanes et al., 1995). This should be particularly evident in the categorization paradigm, because stimulation times changed with speed—to keep the distance traversed by the probe constant. The times of neuronal activity offset were analyzed similarly. As a first check on these methods, they were applied to the muscle recordings. As expected, all responses were found to be time-locked to KR. Considering all the data in Figure 2, on average the muscles reacted 54 ± 35 (SD) msec before the key release. As a further check, the technique was applied to 12 nontuned neurons that clearly increased their activity during stimulation but did so very similarly for all speeds. Their firing rates started rising shortly after ON. For 11 of these cells the method determined that activity onset was indeed time-locked to ON (F tests,p < 0.01), in agreement with visual inspection of the spike rasters. On average, these neurons increased their firing rates 86 ± 49 msec after the probe started moving. In contrast, when applied to the 33 differential neurons, the method detected only two units (one shown in Fig. 7) with onsets and offsets time-locked to ON, three units with onsets and offsets time-locked to KR, and one unit with only offset time-locked to KR (F tests,p < 0.01). For the rest of the neurons the variances of the latency distributions for the three events considered were not significantly different. Therefore, although some differential neurons (15 of 71) increased their activity only during the arm movements, these results suggest that many of them were not uniquely synchronized with sensory or motor events and were probably involved in intermediate types of processes.
Analysis of error patterns
For each speed category, the monkeys made movements to both switches, one direction corresponding to correct and the other to incorrect categorizations. Therefore, for each neuron, mean firing rates may be computed separately for the four combinations of speed category and movement direction (low–medial, high–medial, high–lateral, and low–lateral). This results in a hit–error pattern of four elements. These patterns can be compared with those expected from purely sensory or purely motor-related neurons; idealized versions of these are shown in Figure 9. The two-letter labels indicate category (low, L; high,H) and movement direction (medial, M; lateral, L), in that order. LM corresponds to low speed and medial movement, and so on. Errors belong to theHM and LL classes; hits fall in the LMand HL classes. Ideal sensory neurons are expected to modulate their firing rates exclusively as functions of the stimulus, irrespective of the arm movement. They should not show differences either between the LM and LL classes or between the HM and HL classes. On the other hand, the responses of ideal motor neurons are expected to correlate exclusively with arm movement, irrespective of the stimulus; no differences are expected either between the LM and HM classes or between the HL and LL classes. For later reference, we define the following notation for these differences:
| Equation 9 |
where ΔMOV represents the differences in firing rate between hits and errors for the same movements, ΔCATrepresents the differences in firing rate between hits and errors for the same speed category, and FLM is the mean firing rate for class LM, etc. To rephrase what was stated above, for ideal sensory neurons ΔCAT should be zero, and ΔMOV should be nonzero, with similar magnitudes in the two combinations. For ideal motor neurons exactly the opposite is expected.
Fig. 9.

Mean firing rates in hit and error trials expected from idealized sensory- and motor-related neurons. Each of the four hit–error patterns shown consists of four mean firing rates, sorted according to speed category (low or high) and arm movement (medial or lateral). The four category–movement combinations are low–medial (LM), high–medial (HM), high–lateral (HL), and low–lateral (LL); LM and HL correspond to hit trials, and HM and LL correspond to error trials. Ideal sensory neurons responding differentially during the categorization task should do so in relation to the speed category, irrespective of the arm movement, whereas ideal motor units should correlate exclusively with the arm movement, irrespective of the category.
From the experimental data, mean firing rates were computed for the four category–movement combinations. For each category-tuned neuron only combinations with at least seven trials were included in the analysis; neurons with less than seven trials in the two error classes were excluded. This left a total of 18 neurons. Figure10 (black bars) shows the resulting hit–error patterns of four of them. They systematically deviate from the idealized templates shown in Figure 9. The largest difference in rate is between the two hit classes, LM andHL, and the firing rates for error classes, HMand LL, are in between. This was typical of the full sample. Only two neurons had patterns fully consistent with those of ideal motor units. For these, the two terms of ΔCAT and the difference between hit classes were significant (t test,p < 0.05), whereas the ΔMOV terms and the difference between error classes were not. All other neurons had combinations of significant and nonsignificant rate differences that matched none of the idealized patterns of Figure 9.
Fig. 10.

Mean firing rates in hit and error trials for four category-tuned neurons. The x-axis indicates the four category–movement combinations; labels are explained in Figure 9. Each panel corresponds to one neuron. Thetop two were classified as selective for low speeds, and the bottom two were classified as selective for high speeds. Black bars correspond to the experimentally measured rates. For each neuron, each bar, corresponding to a given category–movement combination, was computed by averaging the firing rate of the neuron over all trials in which that combination occurred. Gray bars indicate the predictions from a model in which the evoked activity of the category-tuned neurons drives the motion of the hand–arm, according to the relative values of the summed responses SL andSH. The same parameters as in Figure8D were used: n = 19;c=0.58. Error bars indicate 1 SD.
A model of the functional role of differential activity
Both the analysis of errors and of latencies failed to identify activity exclusively related to sensory or motor aspects of the task. To explore whether the differential responses play an intermediate sensorimotor role, a model was constructed in which the category-tuned neurons react to the stimulus, exactly as measured from their tuning curves, and the evoked responses are then converted into an arm movement. The model is a straightforward extension of the comparison decoding method. The output of the decision process is converted into a motor action by assuming that the two pooled signals,SL and SH, drive the directional neurons in M1, such that when SL> cSH the movement is medial, and whenSL < cSH it is lateral. This comparison rule acts like a winner-take-all network with two output units (Hertz et al., 1991). From a computer simulation of this model, a neuron-specific hit–error pattern can be obtained, exactly as done for the real data. In each cycle of the simulation, a speed is selected, and the responses of N neurons are simulated;SL and SH are computed, and a movement is produced according to the comparison rule; finally, a hit is scored when either the category is low and the resulting movement is medial or the category is high and the movement is lateral; otherwise an error is scored. For each neuron, its simulated firing rate at a given iteration is used to update its mean for the corresponding category–movement combination that resulted in that iteration. The predicted patterns can be compared with the measured ones.
The gray bars in Figure 10 are the results from the model. The agreement with the measured patterns is extremely good, considering that the results for each neuron are based on the dynamics of the whole population. It should be stressed that these areparameter-free predictions, because the only adjustable quantities in the model, N and the constant c, were fixed at the values used for Figure 8D, which best matched the psychometric curve. The predicted patterns involve noad hoc fitting whatsoever. In Figure11 the measured differences in mean firing rates between hit and error trials, ΔMOV and ΔCAT, have been plotted against the values predicted by the model. If the recorded neurons behaved like ideal sensory units, the points for ΔCAT would cluster around the y = 0 line, and those for ΔMOV would be systematically larger in magnitude than the predictions. Alternatively, if the neurons behaved like ideal motor units, the opposite would be true; the ΔMOV points would be close to zero, irrespective of the predictions, whereas the ΔCATpoints would deviate toward larger magnitude values. Most of the points in the graph fall close to the diagonal line. The obvious outliers are marked with asterisks and belong to the two neurons mentioned earlier, which resembled idealized, motor-related units. When these points are excluded, the best fit line is very near the diagonal.
Fig. 11.

Measured versus predicted differences in firing rate between hit and error classes for a population of 18 category-tuned neurons. Filled squares indicate differences in mean firing rate between hit and error trials for the same speed category, ΔCAT (Eq. 9). Open symbols indicate differences in mean firing rate between hit and error trials for the same movement, ΔMOV. All differences were computed from the predicted and measured hit–error patterns, like those shown in Figure 10. For idealized sensory- or motor-related neurons, half of the points should cluster around they = 0 line, and the other half should have magnitudes larger than predicted. Asterisks correspond to data from the 2 neurons that behaved like idealized motor units (Fig. 9). The continuous line corresponds to a linear least squares fit of all points, excluding those marked withasterisks; the slope is 0.95. Most neurons behave according to the model, firing in relation to both sensory and motor events in the task.
These results demonstrate that the variations in firing rate observed between hits and errors, i.e., across stimulus–response combinations, can be explained by assuming that the neural machinery in charge of generating the arm movements reads out the motion instruction from the activity of the category-tuned neurons. Although the comparison rule was used as the basis for the model, actually predicted hit–error patterns can be generated by interpreting the output of anydecoding method as the movement direction rather than the speed category. This is equivalent to assuming that the category-tuned responses drive the motor reaction with an efficiency equal to that of the particular decoding method but without specifying how the readout is implemented at the circuit level. The comparison model is simple and suggests a network implementation that, as discussed below, is relatively plausible from a biological standpoint. In simulations in which the movement direction was generated by the maximum likelihood estimate, the results were similar to those of Figures 10 and 11. Thus the crucial property of the model is that it converts the stimulus into a movement by using the characterized responses as an intermediate step.
DISCUSSION
In the paradigm used, the speed of a tactile stimulus is classified as either low or high, and the decision is indicated by pressing either a medial or a lateral switch with the hand contralateral to the stimulus. We described a small fraction, approximately one-seventh, of the neurons in M1 contralateral to the moving arm that fire differentially during the task. It is highly unlikely that this activity is associated with muscle precontraction, because the EMG traces were consistently flat during most of the activation periods and did not show large differences across movements. The modulation is not an artifact caused by biases in the reaction times either, because these were very regular and almost identical for low and high speeds [376 ± 34 (SD) and 368 ± 41 msec, respectively). Proprioceptive input is also excluded, because none of the cells responded when the animal’s arm was displaced passively. And although eye movements were not controlled in this study, it seems that they do not influence the activity of M1 neurons (Mushiake et al., 1997).
We considered the observed firing rate modulation with respect to two alternatives: that it is the result of selectivity for speed category (sensory hypothesis), or that it is related to preference for an arm movement (motor hypothesis). The results of control experiments and data analyses indicate that, in fact, it relates to both sensory and motor components of the task. We review the evidence supporting this conclusion. (1) When the animals performed the same arm movements toward the target switches but were guided by visual cues, only one-third of the tested neurons maintained their differential activity. This persistent modulation was, in several cases, noticeably weaker than during categorization. Thus for two-thirds of the neurons the measured modulation was entirely conditional on categorization. The categorization process was specifically required, because neither the stimuli alone nor passive movements of the monkey’s arm evoked a response. This argues in favor of a sensory-derived input driving the category-tuned neurons. However, those that did respond in the visual task, together with the two that did not fit the comparison model, suggest that some neurons covary mostly with the arm movements. These neurons are also surprising, because the magnitude of their differential activity for movements differing by ∼11° is, on average, slightly smaller that the mean modulation across 180° for classic directional neurons (Schwartz et al., 1988). Hence it is possible that a small fraction of M1 neurons have directional tuning properties much narrower than reported previously. These cells would be easy to miss in directional paradigms sampling at large angle steps. (2) When speed category was estimated from the simulated responses of category-tuned neurons, the resulting neurometric curves matched the monkeys’ performance extremely accurately. Thus the measured tuning curves, which are the basis for the simulations, encode the output of the categorization process very precisely. In future studies, it will be of interest to explore how the neurometric estimates change in time when the temporal dynamics of the neurons are taken into account (seeZhang et al., 1997). (3) Analysis of the latencies on a trial by trial basis was unable to reveal any consistent correlation between the onset or offset of neuronal activity and the timing of sensory and motor events in the task. This is interpreted as meaning that neuronal firing was related to both aspects of the task. (4) The differences in firing rate between error and hit trials were not consistent with either of the idealized alternatives but were in agreement with a model in which the differential responses are used by downstream networks to generate the arm movement command. According to this model, the differential neurons are selective for the speed categories, but because their activity has an impact on the motor output, their firing rates correlate with both category and movement.
As mentioned previously, the exact mechanism by which category-tuned neurons participate in the command to move the arm is not crucial for the results, as long as they do contribute to arm movement generation. However, the model based on the relative magnitude of two pooled signals provides a specific implementation that is biologically plausible. The main requirement is that neurons in a downstream layer compare the two signals and react to the larger one. This computation can be readily performed by a biological neural network under fairly general conditions, which M1 seems to satisfy. Modeling studies have shown that some networks may exhibit competitive dynamics such that two inputs of different magnitudes spread over two subpopulations in the network will produce only a single peak of activity, centered on those neurons receiving the strongest input (Kopecz, 1995; Salinas and Abbott, 1996). The essential condition for this competition to occur is that similarly tuned neurons excite each other and differently tuned neurons inhibit each other, and inferred synaptic connections between M1 directional neurons appear to have this form (Georgopoulos et al., 1993).
Our results are consistent with previous work describing sensory, motor, and complex activity in M1 (Alexander and Crutcher, 1990;Crutcher and Alexander, 1990; Hocherman and Wise, 1991; Riehle et al., 1994; Shen and Alexander, 1997; Zhang et al., 1997). These studies used promovement versus antimovement paradigms in which motor reactions were triggered by visual stimuli, and demonstrated a rich repertoire of responses, many of them not exclusively associated with the parameters of arm motion. In particular, Shen and Alexander (1997) and Zhang et al. (1997) found activity that correlated with the visuospatial location of the targets (sensory component), as well as activity that reflected the current instruction given at each trial. However, as pointed out by Shen and Alexander (1997), rather than the physical location of the target, the sensory component might have reflected the initial or default target of limb movement. In the present work, a categorization process was inserted as an intermediate step between the sensory encoding stage and movement execution. In contrast to the visuomotor studies, we did not observe purely sensory activity, in the sense that no neurons were found that directly encoded the metrics of the stimulus. The differential responses are, strictly speaking, not sensory. They do not encode stimulus speed per se; they encode a function, a transformed version of it. From the tuning curves it is impossible to resolve speeds near the range limits, 12 and 30 mm/sec, and their sigmoidal form is in sharp contrast with the initial representation of the motion signal found in S1 (Romo et al., 1996) (Salinas and Romo, unpublished results). The category-tuned neurons are more similar to those reported neurons that correlate with the current instruction and that are thus task-dependent. Using the flutter submodality, Mountcastle et al. (1992) found similar differential activity in M1; however, in that work task dependence was not tested. The results of the present modeling studies suggest not only that these responses are complex, i.e., neither purely sensory- nor purely motor-related, but also that their functional role is to link the sensory categorization process and the motor command. The complex activity observed in visuospatial tasks may play an analogous role: to shift from an initial sensory representation of target location to a final motor representation (Shen and Alexander, 1997; Zhang et al., 1997).
In S1, no responses that decrease with speed have been recorded (Romo et al., 1996) (Salinas and Romo, unpublished observations). Nevertheless, S1 is essential for the animals to be able to categorize (Zainos et al., 1997). Hence, by the time it reaches M1, the neural representation of the motion signal has been dramatically modified. The categorization task can thus be viewed as a sequence of transformations or recodings such that the original stimulus representation is translated into a form interpretable by the motor apparatus (Fig.12). The final form of the code might also provide a substrate for the perceptual experience associated with the task and may be primarily determined by one processing step in a localized cortical area, as has been argued by Britten et al. (1992,1996), Shadlen and Newsome (1996), and Shadlen et al. (1996) with regard to area MT, in the case of visual motion discrimination. Therefore, although the category-tuned neurons reflect the animal’s performance very accurately, it is unlikely that they participate directly in the decision-making process. Rather, they probably constitute a copy of the output of the sensory categorization process that is relayed to M1 only when the decision needs to be expressed through an arm movement. A common input requiring no major adjustment to the code would explain why category-tuned responses similar to those described here have also been found in other motor-related areas (Romo et al., 1993a, 1997; Merchant et al., 1997). This would also explain why most differential responses appear after the end of stimulation; only after the actual categorization process takes place can the decision information reach M1 (see also the latencies for differential activity reported by Mountcastle et al., 1992).
Fig. 12.
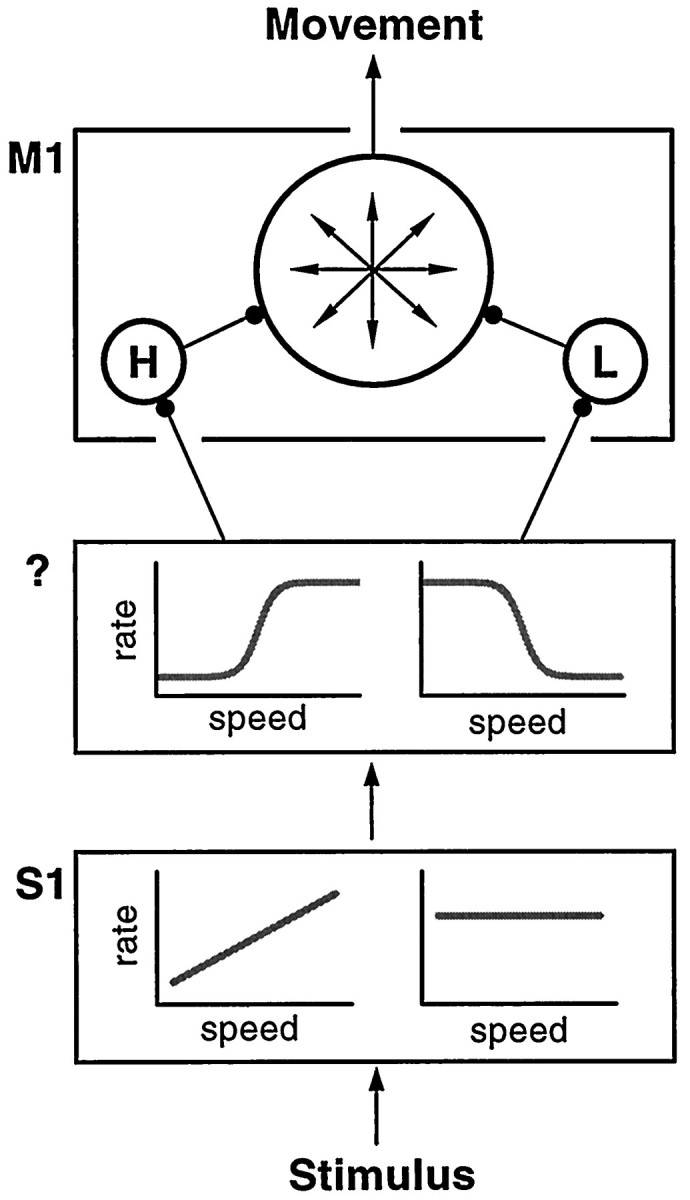
Proposed model of information flow in the categorization task. The tactile stimulus evokes activity in primary somatosensory cortex (S1), which is essential for the categorization process (Zainos et al., 1997). Responses inS1 either increase linearly with speed or are the same for all speeds. Additionally, they are identical during categorization and during passive stimulation (Romo et al., 1996). This activity is transformed into sigmoidal responses that encode the speed category, in an unidentified area (?) (although this could also happen in a distributed manner). This information is relayed to the motor networks to indicate the animal’s decision, giving rise to the M1 neurons selective for low (L) and high (H) speeds. These interact with the rest of the M1 circuitry to generate an arm movement toward the appropriate location.
The small proportion of category-tuned neurons found in M1 (approximately one in seven) and their proposed functional role are consistent with an idea proposed by Georgopoulos and collaborators (Lukashin et al., 1994; Georgopoulos, 1995). They suggested that M1 may be thought of as functionally divided in two parts: a large, general-purpose network involved in all kinds of movements, and other, small, specialized subnetworks that may, under certain circumstances, control the large network (Lukashin et al., 1994; Georgopoulos, 1995). They specifically identified subnetworks involved in the recall and execution of memorized movements (Ashe et al., 1993). Our findings suggest that the category-tuned neurons may belong to another type of task-specific control subnetwork, which converts preprocessed tactile information into arm movements.
Footnotes
The research of R. Romo was supported in part by an International Research Scholars Award from the Howard Hughes Medical Institute and grants from Dirección General de Asuntos del Personal Académico–Universidad Nacional Autónoma de México, Consejo Nacional de Ciencia y Tecnología, and Fundación Miguel Alemán A. C. We thank H. Merchant for help in organizing the database, A. Zainos for assistance during the recording sessions, and S. Méndez for taking care of the monkeys. We also thank L. F. Abbott for helpful comments and discussions.
Correspondence should be addressed to Emilio Salinas, Instituto de Fisiología Celular, Universidad Nacional Autónoma de México, Apartado Postal 70-253, 04510 México D. F., México.
REFERENCES
- 1.Alexander GE, Crutcher MD. Neural representation of the target (goal) of visually guided arm movements in three motor areas of the monkey. J Neurophysiol. 1990;64:164–178. doi: 10.1152/jn.1990.64.1.164. [DOI] [PubMed] [Google Scholar]
- 2.Ashe J, Taira M, Smyrnis N, Pellizzer G, Georgakopoulos T, Lurito JT, Georgopoulos AP. Motor cortical activity preceding a memorized movement trajectory with an orthogonal bend. Exp Brain Res. 1993;95:118–130. doi: 10.1007/BF00229661. [DOI] [PubMed] [Google Scholar]
- 3.Britten KH, Shadlen MN, Newsome WT, Movshon JA. The analysis of visual motion: a comparison of neuronal and psychophysical performance. J Neurosci. 1992;12:4745–4765. doi: 10.1523/JNEUROSCI.12-12-04745.1992. [DOI] [PMC free article] [PubMed] [Google Scholar]
- 4.Britten KH, Newsome WT, Shadlen MN, Celebrini S, Movshon JA. A relationship between behavioral choice and the visual responses of neurons in macaque MT. Vis Neurosci. 1996;13:87–100. doi: 10.1017/s095252380000715x. [DOI] [PubMed] [Google Scholar]
- 5.Caminiti R, Johnson PB, Urbano A. Making arm movements within different parts of space: dynamical aspects on the primate motor cortex. J Neurosci. 1990;10:2039–2058. doi: 10.1523/JNEUROSCI.10-07-02039.1990. [DOI] [PMC free article] [PubMed] [Google Scholar]
- 6.Caminiti R, Johnson PB, Galli C, Ferraina S, Burnod Y. Making arm movements within different parts of space: the premotor and motor cortical representations of a coordinate system for reaching to visual targets. J Neurosci. 1991;11:1182–1197. doi: 10.1523/JNEUROSCI.11-05-01182.1991. [DOI] [PMC free article] [PubMed] [Google Scholar]
- 7.Crutcher MD, Alexander GE. Movement-related neuronal activity selectively coding either direction or muscle pattern in three motor areas of the monkey. J Neurophysiol. 1990;64:151–163. doi: 10.1152/jn.1990.64.1.151. [DOI] [PubMed] [Google Scholar]
- 8.Evarts EV. Role of motor cortex in voluntary movements in primates. In: Brooks VB, editor. Handbook of physiology, Sec 1, Vol 2. American Physiological Society; Baltimore: 1981. pp. 1083–1020. [Google Scholar]
- 9.Georgopoulos AP. Current issues in directional motor control. Trends Neurosci. 1995;18:506–510. doi: 10.1016/0166-2236(95)92775-l. [DOI] [PubMed] [Google Scholar]
- 10.Georgopoulos AP, Schwartz A, Kettner RE. Neuronal population coding of movement direction. Science. 1986;233:1416–1419. doi: 10.1126/science.3749885. [DOI] [PubMed] [Google Scholar]
- 11.Georgopoulos AP, Kettner RE, Schwartz A. Primate motor cortex and free arm movements to visual targets in three-dimensional space. II. Coding of the direction of movement by a neuronal population. J Neurosci. 1988;8:2928–2937. doi: 10.1523/JNEUROSCI.08-08-02928.1988. [DOI] [PMC free article] [PubMed] [Google Scholar]
- 12.Georgopoulos AP, Lurito JT, Petrides M, Schwartz A, Massey JT. Mental rotation of the neuronal population vector. Science. 1989;243:234–236. doi: 10.1126/science.2911737. [DOI] [PubMed] [Google Scholar]
- 13.Georgopoulos AP, Ashe J, Smyrnis N, Taira M. The motor cortex and the coding of force. Science. 1992;256:1692–1695. doi: 10.1126/science.256.5064.1692. [DOI] [PubMed] [Google Scholar]
- 14.Georgopoulos AP, Taira M, Lukashin A. Cognitive neurophysiology of the motor cortex. Science. 1993;260:47–52. doi: 10.1126/science.8465199. [DOI] [PubMed] [Google Scholar]
- 15.Hanes DP, Thompson KG, Schall JD. Relationship of presaccadic activity in frontal eye field and supplementary eye field to saccade initiation in macaque: Poisson spike train analysis. Exp Brain Res. 1995;103:85–96. doi: 10.1007/BF00241967. [DOI] [PubMed] [Google Scholar]
- 16.Hertz J, Krogh A, Palmer RG. Introduction to the theory of neural computation. Addison-Wesley; New York: 1991. [Google Scholar]
- 17.Hocherman S, Wise SP. Effects of hand movement path on motor cortical activity in awake, behaving rhesus monkeys. Exp Brain Res. 1991;83:285–302. doi: 10.1007/BF00231153. [DOI] [PubMed] [Google Scholar]
- 18.Johnson PB, Ferraina S, Bianchi L, Caminiti R. Cortical networks for visual reaching: physiological and anatomical organization of frontal and parietal lobe arm regions. Cereb Cortex. 1996;6:102–119. doi: 10.1093/cercor/6.2.102. [DOI] [PubMed] [Google Scholar]
- 19.Kopecz K. Saccadic reaction times in gap/overlap paradigms: a model based on integration of intentional and visual information on neural, dynamic fields. Vision Res. 1995;35:2911–2925. doi: 10.1016/0042-6989(95)00066-9. [DOI] [PubMed] [Google Scholar]
- 20.Lamarre Y, Busby L, Spidalieri G. Fast ballistic arm movements triggered by visual, auditory and somesthetic stimuli in the monkey. I. Activity of precentral cortical neurons. J Neurophysiol. 1983;50:1343–1358. doi: 10.1152/jn.1983.50.6.1343. [DOI] [PubMed] [Google Scholar]
- 21. Lee D, Port NL, Kruse W, Georgopoulos AP. Neuronal population coding: multielectrode recordings in primate cerebral cortex. Strategies in the study of biological neural networks Eichenbaum H, Davis J. 1998. Wiley; New York, in press. [Google Scholar]
- 22.Lukashin AV, Wilcox GL, Georgopoulos AP. Overlapping neural networks for multiple motor engrams. Proc Natl Acad Sci USA. 1994;91:8651–8654. doi: 10.1073/pnas.91.18.8651. [DOI] [PMC free article] [PubMed] [Google Scholar]
- 23.Martin JH, Ghez C. Task-related coding of stimulus and response in cat motor cortex. Exp Brain Res. 1985;57:427–442. doi: 10.1007/BF00237829. [DOI] [PubMed] [Google Scholar]
- 24.Merchant H, Zainos A, Hernández A, Salinas E, Romo R. Functional properties of primate putamen neurons during the categorization of tactile stimuli. J Neurophysiol. 1997;77:1132–1154. doi: 10.1152/jn.1997.77.3.1132. [DOI] [PubMed] [Google Scholar]
- 25.Mountcastle VB, Atluri P, Romo R. Selective output-discriminative signals in the motor cortex of waking monkeys. Cereb Cortex. 1992;2:277–294. doi: 10.1093/cercor/2.4.277. [DOI] [PubMed] [Google Scholar]
- 26.Mushiake H, Tanatsugu Y, Tanji J. Neuronal activity in the ventral part of premotor cortex during target-reach movement is modulated by direction of gaze. J Neurophysiol. 1997;78:567–571. doi: 10.1152/jn.1997.78.1.567. [DOI] [PubMed] [Google Scholar]
- 27.Pellizzer G, Sargent P, Georgopoulos AP. Motor cortical activity in a context-recall task. Science. 1995;269:702–705. doi: 10.1126/science.7624802. [DOI] [PubMed] [Google Scholar]
- 28.Press WH, Flannery BP, Teukolsky SA, Vetterling WT. Numerical recipes in C, Ed 2. Cambridge UP; New York: 1992. [Google Scholar]
- 29.Riehle A, Kornblum S, Requin J. Neuronal coding of stimulus-response association rules in the motor cortex. NeuroReport. 1994;5:2462–2464. doi: 10.1097/00001756-199412000-00014. [DOI] [PubMed] [Google Scholar]
- 30.Rieke F, Warland D, de Ruyter van Steveninck R, Bialek W. Spikes: exploring the neural code. MIT; Cambridge, MA: 1996. [Google Scholar]
- 31.Romo R, Ruiz S, Crespo P, Zainos A, Merchant H. Representation of tactile signals in primate supplementary motor area. J Neurophysiol. 1993a;70:2690–2694. doi: 10.1152/jn.1993.70.6.2690. [DOI] [PubMed] [Google Scholar]
- 32.Romo R, Ruiz S, Crespo P, Hsiao SS. A tactile stimulator for studying motion processing in the somatic sensory system of primates. J Neurosci Methods. 1993b;46:139–146. doi: 10.1016/0165-0270(93)90149-l. [DOI] [PubMed] [Google Scholar]
- 33.Romo R, Merchant H, Zainos A, Hernández A. Categorization of somesthetic stimuli: sensorimotor performance and neuronal activity in primary somatic sensory cortex of awake monkeys. NeuroReport. 1996;7:1273–1279. [PubMed] [Google Scholar]
- 34.Romo R, Merchant H, Zainos A, Hernández A. Categorical perception of somesthetic stimuli: psychophysical measurements correlated with neuronal events in primate medial premotor cortex. Cereb Cortex. 1997;7:317–326. doi: 10.1093/cercor/7.4.317. [DOI] [PubMed] [Google Scholar]
- 35.Salinas E, Abbott LF. Vector reconstruction from firing rates. J Comput Neurosci. 1994;1:89–107. doi: 10.1007/BF00962720. [DOI] [PubMed] [Google Scholar]
- 36.Salinas E, Abbott LF. Transfer of coded information from sensory to motor networks. J Neurosci. 1995;15:6461–6474. doi: 10.1523/JNEUROSCI.15-10-06461.1995. [DOI] [PMC free article] [PubMed] [Google Scholar]
- 37.Salinas E, Abbott LF. A model of multiplicative neural responses in parietal cortex. Proc Natl Acad Sci USA. 1996;93:11956–11961. doi: 10.1073/pnas.93.21.11956. [DOI] [PMC free article] [PubMed] [Google Scholar]
- 38.Sanger TD. Probability density estimation for the interpretation of neural population codes. J Neurophysiol. 1996;76:2790–2793. doi: 10.1152/jn.1996.76.4.2790. [DOI] [PubMed] [Google Scholar]
- 39.Schwartz A, Kettner RE, Georgopoulos AP. Primate motor cortex and free arm movements to visual targets in three-dimensional space. I. Relations between single cell discharge and direction of movement. J Neurosci. 1988;8:2913–2927. doi: 10.1523/JNEUROSCI.08-08-02913.1988. [DOI] [PMC free article] [PubMed] [Google Scholar]
- 40.Scott SH, Kalaska JF. Reaching movements with similar hand paths but different arm orientations. I. Activity of individual cells in motor cortex. J Neurophysiol. 1997;7:826–852. doi: 10.1152/jn.1997.77.2.826. [DOI] [PubMed] [Google Scholar]
- 41.Shadlen MN, Newsome WT. Motion perception: seeing and deciding. Proc Natl Acad Sci USA. 1996;93:628–633. doi: 10.1073/pnas.93.2.628. [DOI] [PMC free article] [PubMed] [Google Scholar]
- 42.Shadlen MN, Britten KH, Newsome WT, Movshon JA. A computational analysis of the relationship between neuronal and behavioral responses to visual motion. J Neurosci. 1996;16:1486–1510. doi: 10.1523/JNEUROSCI.16-04-01486.1996. [DOI] [PMC free article] [PubMed] [Google Scholar]
- 43.Shen L, Alexander GE. Neural correlates of a spatial sensory-to-motor transformation in primary motor cortex. J Neurophysiol. 1997;77:1171–1194. doi: 10.1152/jn.1997.77.3.1171. [DOI] [PubMed] [Google Scholar]
- 44.Siegel A, Castellan B., Jr . Nonparametric statistics for the behavioral sciences, Ed 2. McGraw Hill; New York: 1988. [Google Scholar]
- 45.Tanji J, Evarts EV. Anticipatory activity of motor cortex neurons in relation to direction of an intended movement. J Neurophysiol. 1976;39:1062–1068. doi: 10.1152/jn.1976.39.5.1062. [DOI] [PubMed] [Google Scholar]
- 46.Thach WT. Correlation of neural discharge with pattern and force of muscular activity, joint position, and direction of intended next movement in motor cortex and cerebellum. J Neurophysiol. 1978;41:654–676. doi: 10.1152/jn.1978.41.3.654. [DOI] [PubMed] [Google Scholar]
- 47.Thompson KG, Hanes DP, Bichot NP, Schall JD. Perceptual and motor processing stages identified in the activity of macaque frontal eye field neurons during visual search. J Neurophysiol. 1996;76:4040–4055. doi: 10.1152/jn.1996.76.6.4040. [DOI] [PubMed] [Google Scholar]
- 48.Werner W, Bauswein E, Fromm C. Static firing rates of premotor and primary motor cortical neurons associated with torque and joint position. Exp Brain Res. 1991;86:293–302. doi: 10.1007/BF00228952. [DOI] [PubMed] [Google Scholar]
- 49.Zainos A, Merchant H, Hernández A, Salinas E, Romo R. Role of primary somatic sensory cortex in the categorization of tactile stimuli: effects of lesions. Exp Brain Res. 1997;115:357–360. doi: 10.1007/pl00005704. [DOI] [PubMed] [Google Scholar]
- 50.Zhang J, Riehle A, Requin J, Kornblum S. Dynamics of single neuron activity in monkey primary motor cortex related to sensorimotor transformation. J Neurosci. 1997;17:2227–2246. doi: 10.1523/JNEUROSCI.17-06-02227.1997. [DOI] [PMC free article] [PubMed] [Google Scholar]
- 51.Zohary E, Shadlen MN, Newsome WT. Correlated neuronal discharge rate and its implications for psychophysical performance. Nature. 1994;370:140–143. doi: 10.1038/370140a0. [DOI] [PubMed] [Google Scholar]