Abstract
Cerebral infarction (CI) and intracerebral hemorrhage are lethal cerebrovascular diseases, sometimes sharing similar clinical manifestations but with distinct therapeutic strategies. Delayed treatment usually resulted in poor prognosis. A timely diagnosis report is highly warranted especially in emergency. One hundred twenty‐nine CI patients, 73 intracerebral hemorrhage (ICH) patients, and 98 controls were enrolled in this study. A direct injection mass spectrometry metabolomics approach was adopted using dried blood spot samples. This targeted metabolomics analysis focused on absolute quantitation of 23 amino acids, 26 carnitine/carnitine esters, and 22 calculated ratios parameters. Compared to the normal control group, CI and ICH showed distinct metabolite changes, respectively. For stroke differentiation, Tyr, C5‐OH/C0, Cit, Asn, Pro, Val, Arg/Orn, Leu, and Val/Phe were elevated in the CI group. On the contrary, C5:1, Phe/Tyr, (C0 + C2 + C3 + C16 + C18:1)/Cit, and Met/Leu were of lower levels in the CI group. Using regression model based on some of the above‐mentioned parameters, 79.07% of stroke patients from a new set could be definitely confirmed. This study proved the targeted metabolomics analysis was a promising tool for rapid and timely stroke differentiation.
Keywords: stroke, mass spectrometry, metabolomics
Introduction
Stroke has become the second leading cause of death and the third reason of disability in the adult worldwide 1, 2. Basically, stroke can be of ischemic and hemorrhagic origins. The former is usually referred to cerebral infarction (CI), which is caused by the local brain–blood circulation obstacle and results in ischemia, hypoxia, and, most frequently, local necrosis 3. The latter is represented by intracerebral hemorrhage (ICH) and is closely related to cerebral vascular sclerosis lesions and usually brings about higher mortality compared to CI. These two attacks cover more than 95% of the total incidence and, of which, 87% are ischemic strokes 4. Although incidence of stroke decreases in the developed countries, the annual attack of stroke in the United States, for example, is still about 0.78 million accompanied by one of five to one of four death rate 1. What makes things worse is that mortality of strokes is still increasing in the undeveloped regions 5, 6.
Nearly all the strokes are sudden attacks and neither the occurrence of CI nor the attack of ICH preceded by a specific aura. Owning to the sensitivity of brain to hypoxia and the limited regeneration ability of neurons, therapeutic window for stroke is very narrow (approximately several hours) 7. Delayed stroke treatment contributes to higher mortality and disability, leading to poor prognosis 2. In the undeveloped areas, stroke mortality can even approach to 85%. Therapies for ischemic and hemorrhagic strokes differ greatly and sometimes are opposite. Although their pathological origins are distinct, ischemic and hemorrhagic strokes often share some clinical manifestations in common, such as hemiplegia, aphasia, and other neurological deficits. Currently, image‐based strategies are the prevailing clinical manners to diagnose strokes. Computer tomography (CT) scan can achieve relatively accurate diagnosis (∼85%) of hemorrhagic stroke, but it cannot detect stroke within 6 hr of onset. CT scan discernable infarct lesions may appear until 12–24 hr after stroke 7. Magnetic resonance imaging (MRI) has some advantages to CT scan, but, in some circumstance, several patient‐related factors preclude the application of MRI, such as loss of consciousness, vomiting, and agitation 8. Additionally, MRI is not cost‐effective and it is usually not easily accessed in the undeveloped areas 9. Occasionally, lumbar puncture and cerebrospinal fluid (CSF) analysis is helpful 10. Both the patients and the physicians are reluctant to accept the invasive operations. Although angiography is a good method to diagnose and differentiate ischemic and hemorrhagic strokes, this time‐consuming method is not an applicable solution in emergency.
In order to make a precise and immediate stroke diagnosis, some serum biomarkers had been explored. Most of them are proteins relevant to vascular injury, metabolic changes, oxidative stress, and inflammation. Owing to their limited specificities, most of them are not well accepted in clinics 7. Besides the macromolecules, there are many fluctuating small molecule metabolites depending upon specific physiological or pathological status. Since the advancement of metabolomics, researchers had tried to find small metabolite markers for stroke diagnosis in a more efficient way. Metabolomics is a newly emerged concept that addresses to quantitative and qualitative analyses of the whole metabolites (metabolome) in a specific system (tissue or biofluid) in a holistic view. Metabolome is thought to be phenotype‐specific and metabolomics analysis has been widely employed in disease stratification, biomarker discovery, and drug toxicity evaluation 11, 12, 13. Current metabolomics research is primarily based on chromatography–mass spectrometry (MS) and nuclear magnetic resonance (NMR) platform. Through liquid chromatography coupled to MS (LC–MS) analysis, folic acid, cysteine, S‐adenosyl homocysteine, and oxidized glutathione were proved to be valuable in CI diagnosis 14. Additionally, a lysophosphatidylcholine (LysoPC(20:4)) was even reported to be utilized to predict stroke reoccurrence 15. For clinical concerns, a rapid stroke diagnosis is highly appreciated. Chromatography separation improved the metabolite discriminating ability, but at the expense of increased analysis time. Venous blood samples are the routine sample type for clinical chemistry analysis, but separating blood cells from plasma or serum is also a time‐consuming procedure. Dried blood spot (DBS) samples had been widely used in newborn screening 16, 17, therapeutic drug monitoring 18, and targeted blood metabolite analysis 19, 20. Sampling and preprocessing DBS is very simple. In this regard, a direct injection MS metabolomics analysis was performed using DBS samples collected from CI and ICH patients in this study. The aim of this research was to seek CI and ICH relevant metabolites against normal individuals. Additionally, weather DBS‐targeted metabolomics analysis could be used to differentiate CI from ICH would also be discussed.
Materials and Methods
Clinical Samples
One hundred twenty‐nine CI patients, 73 ICH patients, and 98 age‐ and gender‐matched healthy volunteers from The First Affiliated Hospital of Liaoning Medical University were enrolled in this study. Detailed information is given in Table 1. Informed consent forms were signed by all the participants and the study was carried out in accordance with the Guide of Hospital Ethics Committee of The First Affiliated Hospital of Liaoning Medical University. DBS samples were collected by fingertip puncture less than 12 hr after stroke attacks. Patients with food intake within 2 hr before sampling were excluded. After dried at room temperature, the DBS filter paper was stored at 4°C in a sealed plastic bag individually.
Table 1.
Information of the Patients and the Health Controls
| CI patients | ICH patients | Healthy controls | |
|---|---|---|---|
| No. of subjects | 129 | 73 | 98 |
| Age (median, range) | 58.08, 31–80 | 58.08, 34–84 | 56.07, 32–80 |
| Male | 37 (28.68%) | 22 (30.14%) | 30 (30.61%) |
| Female | 92 (71.32%) | 51 (69.86%) | 68 (69.39%) |
Chemicals
HPLC‐grade acetonitrile (ACN) and HPLC‐grade water were obtained from Thermo Fisher (Waltham, MA). Acetyl chloride and 1‐butanol were purchased from Sigma‐Aldrich (St. Louis, MO). Labeled amino acid internal standards (catalog number: NSK‐A) containing 12 stable isotope‐labeled amino acids and labeled eight carnitine internal standards (catalog number: NSK‐B) for absolute quantification were obtained from Cambridge Isotope Laboratories (Andover, MA). Every 1 ml pure methanol was added to NSK‐A and NSK‐B individually. These dissolved isotope standards were mixed together and stored at 4°C as stock solution. For metabolite extraction, the stock solution was diluted 100‐folds as working solution. Two‐level quality control (QC) amino acids and carnitines mixed standards were purchased from Chromsystems (Grafelfing, Germany). The QC samples were processed as real samples and randomly inserted in the real sample analysis queue.
Sample Preparation
A paper disc of 3 mm in diameter was punched from the DBS filter paper (equivalent to 3.2 μl whole blood), placed into a well in Millipore MultiScreen HV 96‐well plate (Tullagreen, Ireland), and subjected to metabolite extraction. Briefly, every 100 μl of working solution was dispensed into one‐well containing a DBS disc. The plate was gently shaken for 20 min at room temperature and centrifuged at 1,500 × g for 2 min to collect the filtrate into a new flat‐bottom 96‐well plate. For each plate, every two low‐level and every two high‐level QC control sample solutions were randomly allocated into four blank wells and analyzed as real samples to monitor the stability of the MS analysis. The filtrate and QC solutions were subjected to drying by pure nitrogen gas at 50°C. Each dried sample was derivatized in 60 μl 1‐butanol and acetyl chloride mixture (90:10, v/v) at 65°C for 20 min. The derivatized solutions were dried by pure nitrogen gas at 50°C again. Every 100 μl mobile phase solution was added into each well prior to metabolomics analysis.
Metabolomics Analysis
Direct injection MS analysis was performed on AB SCIEX 4000 QTrap system (Framingham, MA) equipped with an electrospray ionization (ESI) source and scanned in positive mode. The injected sample volume was 20 μl. The mobile phase was a mixture of 80% ACN aqueous solution. The elution program was initiated with 0.2 ml/min, decreased to 0.01 ml/min within 0.08 min, and kept constant until to 1.5 min. Then, the flow rate increased to 0.2 ml/min within 0.01 min and held for another 0.5 min. The MS ion spray voltage was set to 4.5 kV. Pressures of ion source gas 1 and gas 2 were all 35 psi. Curtain gas pressure was 20 psi. Auxiliary gas temperature was kept at 350°C. The detected metabolites, scan modes, and scan parameters were in accordance with the previous report 21. The raw data were collected by Analyst v1.6.0 software (AB Sciex) and quantification of individual metabolites was accomplished by ChemoView 2.0.2 software (AB Sciex) against different isotope standards. The calculated ratios are described elsewhere 21. For each stroke group, screening differential metabolites against the normal controls was conducted by using algorithm of significant analysis of microarrays (SAM) 22. Student's t‐test was additionally used to ascertain the significance (with P < 0.05). For CI and ICH discrimination, 80% of randomly selected samples from each group were compared. Differential parameters were subjected to stepwise regression analysis. Diagnostic ability of the potential markers was evaluated by area under the receiver operating characteristic (ROC) curve (AUC). The leftover 20% case samples in each group were used as testing set to evaluate the diagnosis precision of the regression model. All statistical analysis was conducted by using MINITAB v16.0 software (State College, PA).
Results
Initially, all the stroke samples are mixed together and subjected to separation using principal component analysis. But, the separation failed (data not shown). We thought that mixing the two stroke groups might complicate the data sets and resulted in the inability of group discrimination using limited components.
Next, we separately compared each stroke group with the normal control in order to find the differentially changed metabolites by SAM screening. After thorough Student's t‐test confirmation, five parameters were found to be of different blood levels between CI and the control groups (Fig. 1). They were Ala, Cit, C5‐OH, and two C5‐OH related ratio parameters. Notably, these parameters were all increased due to the onset of CI. As of the ICH, two carnitine‐related parameters were affected (Fig. 2). Similar to the CI situation, these two parameters were also increased in ICH group. What should be mentioned was that the affected metabolites by ICH and CI were totally different, indicating the distinct pathological progress of ischemic and hemorrhagic strokes.
Figure 1.
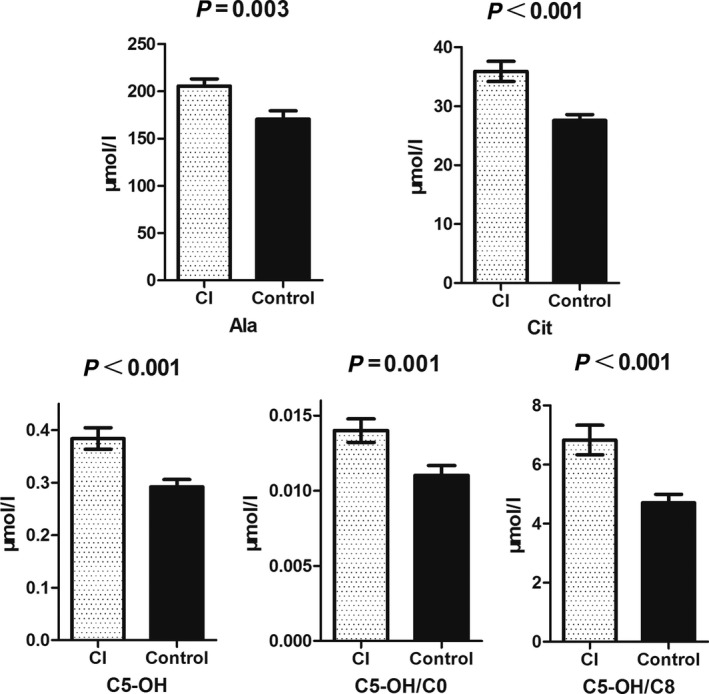
SAM analysis results of the CI and control samples. Parameters affected by CI were all increased in the blood.
Figure 2.
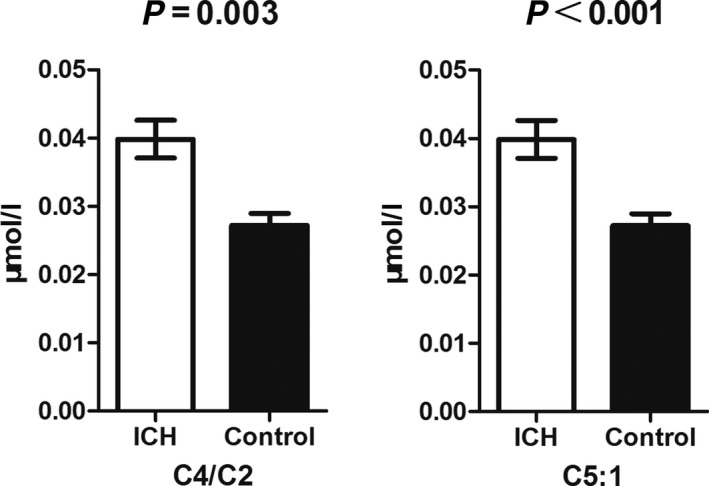
SAM analysis results of the ICH and control samples. Only two parameters were increased by ICH attack.
In order to explore whether the adopted targeted metabolomics analysis could be of any assistance in aiding CI and ICH differentiation, we compared the relevant absolute quantitation and calculated ratio values only using 80% randomly selected samples from each population. This led us to find seven metabolites and six calculated ratios were significantly different between the two groups. Tyr, C5‐OH/C0, Cit, Asn, Pro, Val, Arg/Orn, Leu, and Val/Phe were elevated in the CI group (Fig. 3). On the contrary, C5:1, Phe/Tyr, (C0 + C2 + C3 + C16 + C18:1)/Cit, and Met/Leu were of lower levels in the CI group (Fig. 4).
Figure 3.
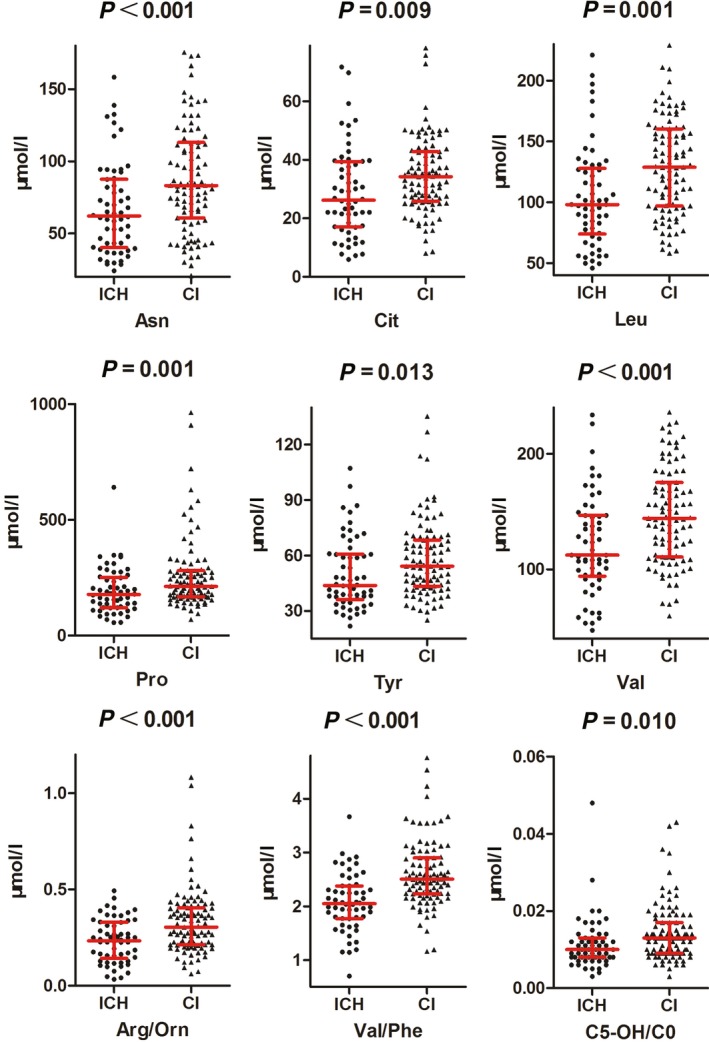
Statistical analysis of the metabolomics data of CI and ICH. Nine parameters were elevated in CI group compared to ICH group. Most of them were amino acids.
Figure 4.
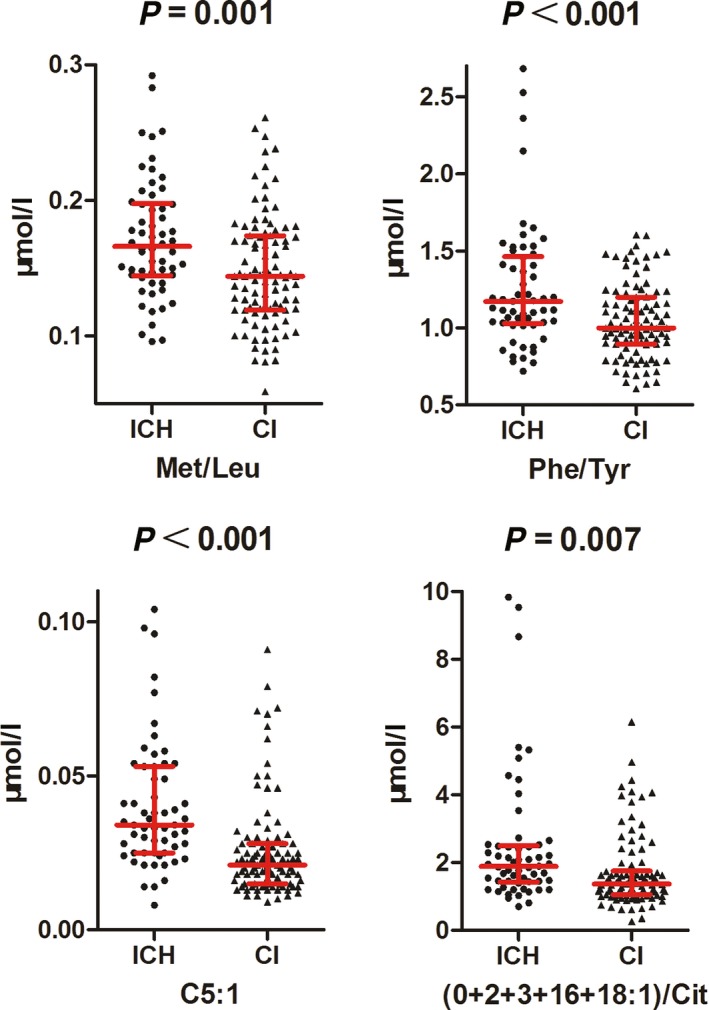
Statistical analysis of the metabolomics data of CI and ICH. Four parameters were decreased in CI group compared to ICH group. Most of them were calculated ratios.
In view of clinical utilization, these 13 parameters were further processed through a stepwise regression analysis (both alpha to enter and remove were set to 0.15) to construct a model for CI and ICH differentiation. The final model (P < 0.001) included five parameters, Asn, C5:1, Arg/Orn, Val/Phe, and (C0 + C2 + C3 + C16 + C18:1)/Cit. ROC curve analysis indicated a diagnosis ability with sensitivity of 77.6% and specificity of 84.8% with an optimal cutoff value of 0.434 (Fig. 5). This curve generated an AUC value of 0.873, which implied the acceptability of the regression model in view of clinical application. Further tested by the remaining 20% stroke patients, diagnosis accuracy of this statistic model approached to 79.07%.
Figure 5.
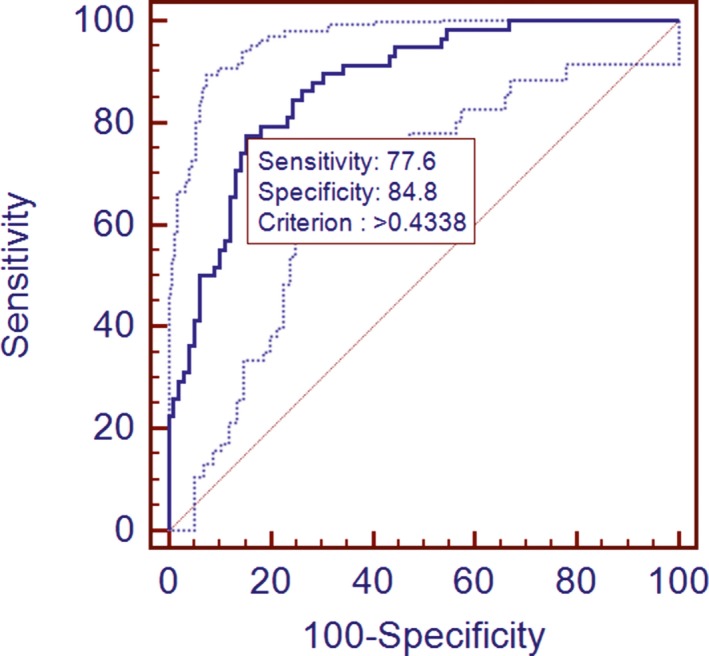
ROC analysis of the regression model based on the results of CI and ICH comparison. Only 80% samples of each group were used.
Discussion
Great effort has been taken to develop stroke diagnosis biomarkers. But the encouraging results are still limited. Heterogeneous pathophysiologies and mechanisms not only complicate stroke clinical manifestations, but also bring about tremendous difficulty in universal biomarker validation 23. Thus, our initial attempt to analyze stroke groups with control group using unsupervised method in a combined manner failed. In fact, even for pure CI and normal population discrimination, a supervised method was necessary 14. Through an alternative supervised method analysis, we found that Ala and Cit increased in CI patients (Fig 1). Ala could increase brain carnosine content 24, which exerted neuroprotective effects by attenuating autophage taking place in ischemic damaged brain 25. Similarly, Cit supplementation was also demonstrated to be neuroprotective through modulating nitric oxide generation 26. Coincidently, these two mechanisms were all involved in rescuing mitochondrial functions, indicating that mitochondrial damage might be a very early event in ischemic stroke and an early sensitive response to hypoxia 27. The increased Ala and Cit in CI were thought to be the protective response of the body in acute phase. It would be helpful if the changes of the two metabolites could be monitored dynamically using time serial samples. The other three parameters affected by CI were all related to C5‐OH acylcarnitine. C5‐OH was thought to be a proapoptotic factor 28. The roles of C5‐OH in stroke are elusive currently, but carnitine is an indispensable shutter for fatty acid β‐oxidation in mitochondria. Thus, these changed carnitine esters might mirror the impaired mitochondrial oxidation functions. It was very interesting that the affected carnitine esters were confined to short‐chain carnitines but not the long‐chain ones. Collectively, CI‐related metabolite markers were closely related to mitochondrial metabolism.
Increased C4/C2 usually indicated the short‐chain acyl‐CoA dehydrogenase (SCAD) deficiency. Except SCAD, elevated C5:1 could also be the results of β‐ketothiolase deficiency. It had been reported that SCAD deficiency could be observed in pathological cardiomyocytes, but not in physiological cardiomyocytes 29. Additionally, this deficiency was closely related to the deactivation of peroxisome proliferator‐activated receptor α (PPARα) 29. Up to now, we still could not find any hint to link the above‐mentioned changes with ICH (Fig. 2). Platelet plays key roles in ICH pathology. Platelet dysfunction means worse outcomes of patients suffering from ICH. Activated platelets augmented PPARα mRNA expression in human umbilical endothelial cells 30. Except the fact that these esters are linked to mitochondrial oxidation functions, it also implied that ICH might have something to do with SCAD‐related pathological progress.
Although the great advance in stroke diagnosis, differentiation of ischemic and hemorrhagic strokes is still a real challenge especially in emergency. Our metabolomics analysis showed that most of the elevated metabolites in the CI patient blood were amino acids as compared to ICH patients (Fig. 3). Only two calculated amino acid ratios increased in the ICH group (Fig. 4). This finding indicated that amino acid metabolism was differentially perturbated by CI and ICH occurrence.
In order to test if the differentially changed parameters could be used to differentiate stroke types, a regression model was constructed. This model only contained two absolute quantitation metabolites, Asn and C5:1 carnitine ester. The other three parameters were two amino acid ratios and a ratio of combined carnitine esters versus Cit. The model showed an AUC of 0.873 (Fig. 5) and could precisely predict 79.07% of the 40 stroke patients from an independent set. That meant, for differentiation of ischemic and hemorhagic strokes, quantifying six amino acids and six carnitine metabolites should be helpful.
In this study, we aimed to find a rapid and sensitive method to help differentiate ischemic and hemorrhagic strokes with respect to metabolomics analysis. To circumvent the time consuming chromatography separation, we selected the direct injection MS analysis. For simplifying the sample collection procedure, we paid attention to the DBS sample type. Integrating both advantages, the whole performance could be finished in several minutes, and was a promising alternative in emergency. Limited by the sample and the targeted metabolite amount, the prediction accuracy was not very high enough. The upcoming study will be conducted in larger population and using time serial samples to gain more insight into the substantial difference between CI and ICH.
Acknowledgment
This work was supported by the National Natural Science Foundation of China (81372695).
Grant sponsor: National Natural Science Foundation of China; Grant number: 81372695.
References
- 1. Petrea RE, Beiser AS, Seshadri S, Kelly‐Hayes M, Kase CS, Wolf PA. Gender differences in stroke incidence and poststroke disability in the Framingham heart study. Stroke 2009;40:1032–1037. [DOI] [PMC free article] [PubMed] [Google Scholar]
- 2. O'Donnell MJ, Xavier D, Liu L, et al. Risk factors for ischaemic and intracerebral haemorrhagic stroke in 22 countries (the INTERSTROKE study): A case‐control study. Lancet 2010;376:112–123. [DOI] [PubMed] [Google Scholar]
- 3. Leppala JM, Virtamo J, Fogelholm R, Albanes D, Heinonen OP. Different risk factors for different stroke subtypes: Association of blood pressure, cholesterol, and antioxidants. Stroke 1999;30:253–2540. [DOI] [PubMed] [Google Scholar]
- 4. Lloyd‐Jones D, Adams RJ, Brown TM, et al. Heart disease and stroke statistics–2010 update: A report from the American Heart Association. Circulation 2010;121:e46–e215. [DOI] [PubMed] [Google Scholar]
- 5. Krishnamurthi RV, Feigin VL, Forouzanfar MH, et al. Global and regional burden of first‐ever ischaemic and haemorrhagic stroke during 1990–2010: Findings from the Global Burden of Disease Study 2010. Lancet Glob Health 2013;1:e259–e281. [DOI] [PMC free article] [PubMed] [Google Scholar]
- 6. Feigin VL, Forouzanfar MH, Krishnamurthi R, et al. Global and regional burden of stroke during 1990–2010: Findings from the Global Burden of Disease Study 2010. Lancet 2014;383:245–254. [DOI] [PMC free article] [PubMed] [Google Scholar]
- 7. Miao Y, Liao JK. Potential serum biomarkers in the pathophysiological processes of stroke. Expert Rev Neurother 2014;14:173–185. [DOI] [PMC free article] [PubMed] [Google Scholar]
- 8. Singer OC, Sitzer M, du Mesnil de RR, Neumann‐Haefelin T. Practical limitations of acute stroke MRI due to patient‐related problems. Neurology 2004;62:1848–1849. [DOI] [PubMed] [Google Scholar]
- 9. Kim BJ, Kang HG, Kim HJ, et al. Magnetic resonance imaging in acute ischemic stroke treatment. J Stroke 2014;16:131–145. [DOI] [PMC free article] [PubMed] [Google Scholar]
- 10. Fiebach JB, Schellinger PD, Jansen O, et al. CT and diffusion‐weighted MR imaging in randomized order: Diffusion‐weighted imaging results in higher accuracy and lower interrater variability in the diagnosis of hyperacute ischemic stroke. Stroke 2002;33:2206–2210. [DOI] [PubMed] [Google Scholar]
- 11. Nicholson JK, Lindon JC, Holmes E. “Metabonomics”: Understanding the metabolic responses of living systems to pathophysiological stimuli via multivariate statistical analysis of biological NMR spectroscopic data. Xenobiotica 1999;29:1181–1189. [DOI] [PubMed] [Google Scholar]
- 12. Nicholson JK, Connelly J, Lindon JC, Holmes E. Metabonomics: A platform for studying drug toxicity and gene function. Nat Rev Drug Discov 2002;1:153–161. [DOI] [PubMed] [Google Scholar]
- 13. Shyur LF, Yang NS. Metabolomics for phytomedicine research and drug development. Curr Opin Chem Biol 2008;12:66–71. [DOI] [PubMed] [Google Scholar]
- 14. Jiang Z, Sun J, Liang Q, et al. A metabonomic approach applied to predict patients with cerebral infarction. Talanta 2011;84:298–304. [DOI] [PubMed] [Google Scholar]
- 15. Jove M, Mauri‐Capdevila G, Suarez I, et al. Metabolomics predicts stroke recurrence after transient ischemic attack. Neurology 2015;84:36–45. [DOI] [PMC free article] [PubMed] [Google Scholar]
- 16. Guthrie R, Susi A. A simple phenylalanine method for detecting phenylketonuria in large populations of newborn infants. Pediatrics 1963;32:338–343. [PubMed] [Google Scholar]
- 17. Therrell BL, Adams J. Newborn screening in North America. J Inherit Metab Dis 2007;30:447–465. [DOI] [PubMed] [Google Scholar]
- 18. Berm EJ, Brummel‐Mulder E, Paardekooper J, Hak E, Wilffert B, Maring JG. Determination of venlafaxine and O‐desmethylvenlafaxine in dried blood spots for TDM purposes, using LC‐MS/MS. Anal Bioanal Chem 2014;406:2349–2353. [DOI] [PubMed] [Google Scholar]
- 19. Duthaler U, Keiser J, Huwyler J. LC‐MS/MS method for the determination of two metabolites of tribendimidine, deacylated amidantel and its acetylated metabolite in plasma, blood and dried blood spots. J Pharm Biomed Anal 2015;105:163–173. [DOI] [PubMed] [Google Scholar]
- 20. Shah NM, Hawwa AF, Millership JS, Collier PS, McElnay JC. A simple bioanalytical method for the quantification of antiepileptic drugs in dried blood spots. J Chromatogr B Analyt Technol Biomed Life Sci 2013;923–924:65–73. [DOI] [PubMed] [Google Scholar]
- 21. Wang Q, Sun T, Cao Y, Gao P, Dong J, Fang Y, Fang Z, Sun X, Zhu Z. A dried blood spot mass spectrometry metabolomic approach for rapid breast cancer detection. Onco Targets Ther 2006;9:1389–1398. [DOI] [PMC free article] [PubMed] [Google Scholar]
- 22. Tusher VG, Tibshirani R, Chu G. Significance analysis of microarrays applied to the ionizing radiation response. Proc Natl Acad Sci USA 2001;98:5116–5121. [DOI] [PMC free article] [PubMed] [Google Scholar]
- 23. Kim SJ, Moon GJ, Bang OY. Biomarkers for stroke. J Stroke 2013;15:27–37. [DOI] [PMC free article] [PubMed] [Google Scholar]
- 24. Hoffman JR, Ostfeld I, Stout JR, Harris RC, Kaplan Z, Cohen H. Beta‐alanine supplemented diets enhance behavioral resilience to stress exposure in an animal model of PTSD. Amino Acids 2015. [DOI] [PMC free article] [PubMed] [Google Scholar]
- 25. Baek SH, Noh AR, Kim KA, et al. Modulation of mitochondrial function and autophagy mediates carnosine neuroprotection against ischemic brain damage. Stroke 2014;45:2438–2443. [DOI] [PMC free article] [PubMed] [Google Scholar]
- 26. El‐Hattab AW, Emrick LT, Williamson KC, Craigen WJ, Scaglia F. The effect of citrulline and arginine supplementation on lactic acidemia in MELAS syndrome. Meta Gene 2013;1:8–14. [DOI] [PMC free article] [PubMed] [Google Scholar]
- 27. Sayre NL, Chen Y, Sifuentes M, Stoveken B, Lechleiter JD. Purinergic receptor stimulation decreases ischemic brain damage by energizing astrocyte mitochondria. Adv Neurobiol 2014;11:121–150. [DOI] [PubMed] [Google Scholar]
- 28. Ferrara F, Bertelli A, Falchi M. Evaluation of carnitine, acetylcarnitine and isovalerylcarnitine on immune function and apoptosis. Drugs Exp Clin Res 2005;31:109–114. [PubMed] [Google Scholar]
- 29. Huang J, Xu L, Huang Q, et al. Changes in short‐chain acyl‐coA dehydrogenase during rat cardiac development and stress. J Cell Mol Med 2015. [DOI] [PMC free article] [PubMed] [Google Scholar]
- 30. Wu YQ, Chen XS, Chai JB. The involvement of the CD40‐CD40L pathway in activated platelet‐induced changes in HUVEC COX‐2 and PPARalpha expression. Inflammation 2012;35:1184–1190. [DOI] [PubMed] [Google Scholar]


