

Abstract
One of the major characteristics of hyperglycemic states such as type 2 diabetes is increased reactive oxygen species (ROS) generation. Since mitochondria are a major source of ROS, it is vital to understand the involvement of these organelles in the pathogenesis of ROS-mediated conditions. Therefore, we investigated mitochondrial function and ROS production in cerebral blood vessels of 21-wk-old Zucker diabetic fatty obese rats and their lean controls. We have previously shown that in the early stages of insulin resistance, and short periods of type 2 diabetes mellitus, only mild differences exist in mitochondrial function. In the present study, we examined mitochondrial respiration, mitochondrial protein expression, and ROS production in large-surface cerebral arteries. We used 21-wk-old animals exposed to peak glucose levels for 7 wk and compared them with our previous studies on younger diabetic animals. We found that the same segments of mitochondrial respiration (basal respiration and proton leak) were diminished in diabetic groups as they were in younger diabetic animals. Levels of rattin, a rat humanin analog, tended to decrease in the diabetic group but did not reach statistical significance (P = 0.08). Other mitochondrial proteins were unaffected, which might indicate the existence of compensatory mechanisms with extension of this relatively mild form of diabetes. Superoxide levels were significantly higher in large cerebral vessels of diabetic animals compared with the control group. In conclusion, prolonged dietary diabetes leads to stabilization, rather than deterioration, of metabolic status in the cerebral circulation, despite continued overproduction of ROS.
NEW & NOTEWORTHY We have characterized for the first time the dynamics of mitochondrial function during the progression of type 2 diabetes mellitus with regard to mitochondrial respiration, protein expression, and reactive oxygen species production. In addition, this is the first measurement of rattin levels in the cerebral vasculature, which could potentially lead to novel treatment options.
Keywords: cerebral arteries, cerebral microvessels, mitochondria, reactive oxygen species, rattin
INTRODUCTION
One of the major factors accompanying hyperglycemic states such as type 2 diabetes mellitus (T2DM) is increased production of reactive oxygen species (ROS) (41). Mitochondria are one of the main sources of ROS. During hyperglycemic conditions, mitochondrial-generated ROS can lead to various complications of diabetes, such as microvascular and macrovascular abnormalities (4, 41). In addition, ROS can be especially damaging to cells during energy-compromised states. These findings led to studies on the diverse roles of mitochondria during diabetes, some of which suggested impaired mitochondrial metabolism and function as an underlying cause of T2DM (22, 29, 31). Other studies argued that if the impaired mitochondrial function leads to development of T2DM, it should be present in the early insulin-resistant stages (10). However, these studies found no significant differences between insulin-resistant and control groups regarding mitochondrial respiration and/or content (10, 18, 23).
Considering that the majority of T2DM complications are due to micro- and macroangiopathies, data on mitochondrial function in blood vessels, especially the cerebral vasculature, is very limited. Previous studies from our laboratory showed diminished mitochondrial-dependent vasodilatory responses in major cerebral blood vessels of insulin-resistant, prediabetic rats (19, 20). We have also shown that pharmacological blood flow stimulators (bicuculline, bradykinin, and N-methyl-d-aspartate) do not have significantly different effects on local cortical microcirculation in insulin-resistant rats compared with controls (16).
We further investigated mitochondrial function in the cerebral vasculature of insulin-resistant Zucker obese rats. Zucker obese rats have increased plasma insulin levels but normal fasting blood glucose levels and normal blood pressure, which is a similar metabolic profile to the human prediabetes condition (8, 9). In the early stages of insulin resistance, we found no significant differences in mitochondrial respiration and protein expression between insulin-resistant and control groups but found that ROS levels were significantly higher in the insulin-resistant group (25). We further analyzed these parameters in young rats with a fully developed but relatively short duration of T2DM. These cerebral arteries exhibited a decrement in several components of mitochondrial respiration (basal respiration and proton leak) as well as lower levels of mitochondrial protein, total manganese superoxide dismutase (MnSOD) and voltage-dependent anion channel (VDAC). As in the insulin-resistant group, superoxide levels were significantly higher in the diabetic group (24).
In the present study, we extended our inquiry by investigating the mitochondrial dynamics in major cerebral arteries and intracortical microvessels of 21-wk-old Zucker diabetic fatty lean (ZDFL 21) and obese (ZDFO 21) rats consuming a high-fat diet. We measured mitochondrial respiration in freshly isolated major cerebral arteries, analyzed mitochondrial protein expression in cerebral microvessels, and measured superoxide levels in cerebral arteries of ZDFL and ZDFO rats. We hypothesized that longer periods of T2DM in older, 21-wk-old ZDFL and ZDFO rats would lead to further deterioration of mitochondrial function compared with younger diabetic animals.
MATERIALS AND METHODS
All the protocols involving animal use were approved by the Institutional Animal Care and Use Committee of Tulane University School of Medicine and complied with the National Institutes of Health guidelines. The Department of Comparative Medicine provided animal care. In this study, ZDFO 21 and their lean controls (ZDFL 21) were used. Animals were obtained from Charles River Laboratories (Wilmington, MA). Thirty animals from each group were used; n represents number of individual measurements. Animals were kept on 12-h:12-h light-dark cycles with food and available ad libitum.
ZDFO rat model.
This model has been widely used as a model of T2DM. When kept on a Purina 5008 diet, male ZDFO rats exhibit signs of T2DM around 6–7 wk of age as well as a number of other conditions, including hyperglycemia, obesity, insulin resistance, and hyperinsulinemia. Hyperglycemia reaches peak levels between 10 and 12 wk of age and remains at an average level of <30 mmol/L (3, 24, 33).
Blood glucose level measurements.
We took blood samples from the aortas of deeply anesthetized animals and measured glucose levels using a Contour glucometer (Contour Next EZ Glucometer, Bayer, Germany). Blood glucose levels (in mmol/L) are expressed as means ± SD.
Isolation of major cerebral arteries and intracortical microvessels.
We used freshly isolated major cerebral arteries and intracortical microvessels as described previously (24, 25, 32, 36). In short, following deep anesthesia by 5% isoflurane (VetOne, Boise, ID), animals were decapitated, and major surface arteries were removed, cleaned, and used for mitochondrial respiration measurements and ROS measurements. After removal of large-surface arteries, we isolated the intracortical microvessels. Cortex was separated from the rest of the brain tissue and then homogenized. Afterward, a series of centrifugations (1,000 g for 10 min followed by 4,400 g for 15 min) using 17.5% dextran (64–76 kDa, Sigma-Aldrich, St. Louis, MO) with filtrations through graduated pore-sized meshes (first through 300-μm mesh, then 70-μm mesh) was completed, resulting in microvessel pellets consisting of arterioles, venules, and capillaries. These microvessels were used for protein expression analysis. All procedures were done on ice or at 4°C.
Mitochondrial respiration measurement.
The Seahorse XFe24 extracellular flux analyzer (Agilent Technologies, Santa Clara, CA) was used to determine levels of mitochondrial respiration in major cerebral arteries by measuring oxygen consumption rate (OCR). OCR is widely accepted as an indicator of mitochondrial respiration (2, 12, 15). We have previously demonstrated successful use of the Seahorse analyzer on freshly isolated cerebral arteries (24, 25, 32). In short, freshly isolated cerebral arteries were placed into the wells of an XFe24 islet capture microplate (Agilent Technologies) which was filled with an assay medium (XF assay medium, Agilent Technologies) containing 5.0 mM/L glucose and 2 mM/L pyruvate. Plates were kept in an incubator at 37°C for 20 min. Following incubation, the microplate was placed in the Seahorse analyzer to determine oxygen and hydrogen concentration in the medium surrounding the arteries using special hydrogen- and oxygen-sensitive fluorophores, thus calculating OCR. After measuring baseline levels, plated arteries were exposed to chemicals, which allowed for calculation of the mitochondrial respiration components basal respiration, proton leak, maximal respiration, spare respiratory capacity, and nonmitochondrial respiration. This sequence consists of adding 2 μM/L oligomycin, then 1 μM/L carbonyl cyanide 4-(trifluoromethoxy) phenylhydrazone, and finally 1.5 μM/L antimycin plus 1.5 μM/L rotenone. OCR data were normalized to arterial protein concentration (expressed in pM·min−1·μg−1).
Electron spin resonance studies.
We used electron spin resonance spectroscopy (ESR) to measure levels of superoxide, the major type of ROS. These levels were measured in the cerebral arteries of ZDFL and ZDFO rats as described previously (20, 24, 25). In short, we used a 1-hydroxy-3-methoxycarbonyl-2,2,5,5-tetramethyl-pyrrolidine spin probe for superoxide level measurement. We dissolved diethyldithiocarbamate (2.5 μmol/L) and deferoxamine (25 μmol/L) in ice-cold Krebs HEPES buffer under nitrogen gas bubbling. Then, artery samples from each group were placed in microtubules containing 200 μmol/L 1-hydroxy-3-methoxycarbonyl-2,2,5,5-tetramethyl-pyrrolidine solution of Krebs HEPES buffer with deferoxamine and diethyldithiocarbamate and incubated at 37°C for 60 min. After incubation, we placed the vessel samples in 1-mL syringes and froze them in liquid nitrogen. Afterward, frozen samples were placed into a finger dewar (Noxygen Science Transfer & Diagnostics, Elzach, Germany) for measurement. The finger dewar was then placed in an X-band EMX Series ESR Spectrometer (Bruker Biospin, Karlsruhe, Germany), and ESR spectra were obtained. The following ESR settings were used to determine time-dependent ROS formation: center field, 1.99 g; microwave power, 20 mW; modulation amplitude, 2 G; sweep time, 10 s; number of scans, 10; and field sweep, 60 G. All of the results were normalized to microvessel protein concentration and expressed as arbitrary units.
Western blot analysis.
We harvested proteins from cerebral microvessels as described previously (20, 24, 25, 32). Vessels were homogenized in ice-cold NP40 lysis buffer (Invitrogen, Frederick, MD) containing protease and phosphatase inhibitor cocktails (cat. nos. P8340 and P2850, respectively; Sigma-Aldrich). After homogenization, samples were centrifuged, and the supernatant was used for protein expression analysis. We determined protein concentration using Pierce BCA protein assay (Thermo Scientific, Rockford, IL). Afterward, proteins were separated via gel-electrophoresis on a 4–20% SDS-PAGE gradient gel and 10% tris-tricine gel (for rattin antibody) and then transferred to a polyvinylidene difluoride membrane. After blocking with casein blocking buffer (cat. no. 92740200, LI-COR, Lincoln, NE), membranes were washed and incubated overnight at 4°C with the following primary antibodies: total dynamin-related protein-1 at 1:1,000 dilution (80 kDa; cat. no. 611112, BD Transduction Laboratories, San Jose, CA); anti-VDAC at 1:1,000 dilution (32 kDa; cat. no. 4866S, Cell Signaling Technology, Danvers, MA); anti-Complex II Fp subunit I at 1:1,000 dilution (70 kDa; cat. no. 459200, Invitrogen); anti-Complex III subunit I core at 1:1,000 dilution (53 kDa; cat. no. 459140, Invitrogen); ATP synthase Complex V subunit alpha at 1:500 dilution (50 kDa; cat. no. 459240, Invitrogen); anti-SOD2 (acetyl K68) (acetylated MnSOD) at 1:500 dilution (24 kDa, cat. no. ab137037, Abcam, Cambridge, MA); anti-rattin (humanin-like) antibody at 1:250 dilution (25 kDa; cat. no. NB300–246, Novus Biologicals, Littleton, CO); total endothelial nitric oxide synthase (teNOS) at 1:500 dilution (140 kDa; cat. no. 610297, BD Transduction Laboratories); and the eNOS Ser1176 phosphorylated form (peNOS) at 1:500 dilution (140 kDa; cat. no. 9571, Cell Signaling Technology). β-Actin at 1:5,000 dilution (42 kDa; cat. no. A5441, Sigma-Aldrich) was used as loading control. Following incubation with primary antibodies, membranes were washed and incubated with the following secondary antibodies: anti-rabbit IgG at 1:2,500 dilution (cat. no. 7074S, Cell Signaling Technology) or goat anti-mouse IgG at 1:5,000 dilution (cat. no. 7076P2, Cell Signaling Technology). We used chemiluminescence (LumiGLO, Gaithersburg, MD) and autoradiography to visualize immunobands. ImageJ software was used to analyze the optical density of the bands and normalize it to corresponding β-actin bands.
Data analysis and statistics.
Results were expressed as means ± SD. The number of independent measurements is indicated by n. GraphPad Prism software version 5.03 (GraphPad Software, San Diego, CA) was used to analyze the data. After normal distribution was confirmed, we used an unpaired t test for data analysis. We considered P < 0.05 as statistically significant.
RESULTS
Animal weight and blood glucose levels.
The ZDFO 21 group exhibited significantly higher blood glucose values (31.98 ± 2.418 vs. 10.14 ± 2.26 mmol/L, n = 30, P < 0.05) (Fig. 1A) and body weight (421.4 ± 29.08 g vs. 366.3 ± 28.79 g, n = 30, P < 0.05) (Fig. 1B) compared with their lean controls.
Fig. 1.

Blood glucose levels and weight of 21-wk-old Zucker diabetic fatty lean (ZDFL 21) and obese rats (ZDFO 21). A: blood glucose levels assessed by random blood glucose test were significantly higher in the ZDFO 21 group. n = 60; *P < 0.05 (ZDFL 21 vs. ZDFO 21). B: ZDFO 21 rats exhibited significantly higher body weight compared with lean controls. n = 60; *P < 0.05 (ZDFL 21 vs. ZDFO 21).
Mitochondrial respiration measurements.
The mitochondrial profile of large cerebral arteries in 21-wk-old animals (Fig. 2) showed a clear difference. Analysis of individual mitochondrial respiration showed changes in basal respiration and proton leak (Fig. 3). Basal respiration and proton leak were significantly higher in ZDFL 21 compared with ZDFO 21 (144.6 ± 58.59 vs. 102.0 ± 49.27 pM·min−1·μg−1 protein, n = 20, P < 0.05 and 114.6 ± 57.40 vs. 71.41 ± 37.27 pM·min−1·μg−1 protein, n = 20, P < 0.05, respectively) (Fig. 3, B and E). Other components of mitochondrial and nonmitochondrial respiration were not significantly different between the groups (Fig. 3).
Fig. 2.
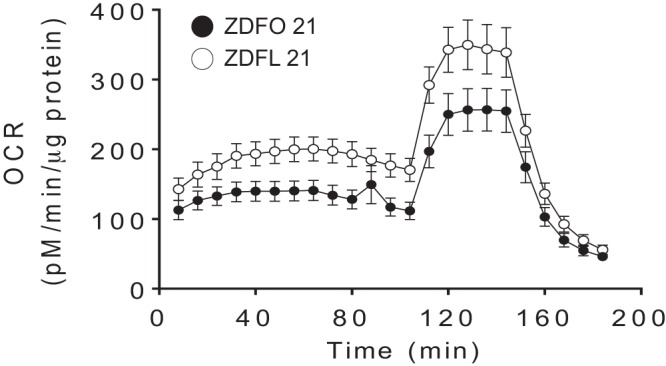
Mitochondrial respiration profile of large cerebral arteries from 21-wk-old Zucker diabetic fatty lean (ZDFL 21) and obese (ZDFO 21) rats. Data are expressed as means ± SD; n = 20 per group. OCR, oxygen consumption rate.
Fig. 3.

Mitochondrial respiration components of the large cerebral arteries from 21-wk-old Zucker diabetic fatty lean (ZDFL 21) and obese (ZDFO 21) rats. The following mitochondrial bioenergetic parameters are shown: nonmitochondrial respiration (A), basal respiration (B), maximal respiration (C), spare respiratory capacity (D), proton leak (E), and ATP production (F). Data are expressed as means ± SD; n = 20 per group. *P < 0.05 (ZDFL 21 vs. ZDFO 21). OCR, oxygen consumption rate.
Protein expression.
Microvessels of ZDFL 21 and ZDFO 21 rats were tested for selected mitochondrial and nonmitochondrial proteins (total dynamin-related protein-1, peNOS, teNOS, acetylated MnSOD, VDAC, Complex II, Complex III, Complex V, and rattin). Investigated protein levels showed no difference between groups (Figs. 4 and 5). Rattin levels were higher in lean animals; however, statistical significance was not reached (P = 0.08).
Fig. 4.

Mitochondrial and nonmitochondrial protein expression in cerebral microvessels of 21-wk-old Zucker diabetic fatty lean (ZDFL 21) and obese (ZDFO 21) rats. The following representative Western blots and summary data are shown: total dynamin-related protein-1 (tDRP; 80 kDa) (A), voltage-dependent anion channel (VDAC; 32 kDa) (B), Complex II (70 kDa) (C), Complex III (53 kDa) (D), Complex V (50 kDa) (E), and acetylated manganese superoxide dismutase (MnSOD), 24 kDa (F). Data are expressed as means ± SD; n = 16 per group. L, lean; O, obese.
Fig. 5.

Protein expression of endothelial nitric oxide synthase (eNOS), its phosphorylated form (peNOS), the ratio of the 2, and protein expression of rattin in cerebral microvessels of 21-wk-old Zucker diabetic fatty lean (ZDFL 21) and obese (ZDFO 21) rats. The following representative Western blots and summary data are shown: peNOS (140 kDa) (A), teNOS (140 kDa) (B), peNOS/teNOS (C), and rattin (25 kDa) (D). Data are expressed as means ± SD; n = 16 per group. #P = 0.08. L, lean; O, obese.
Superoxide production in cerebral arteries.
Large cerebral surface vessels exhibited significantly higher superoxide values compared with their lean controls. The ESR signal showed around twofold higher values in the obese group (46,036 ± 38,515 vs. 20,151 ± 15,261, n = 18, P < 0.05) (Fig. 6).
Fig. 6.
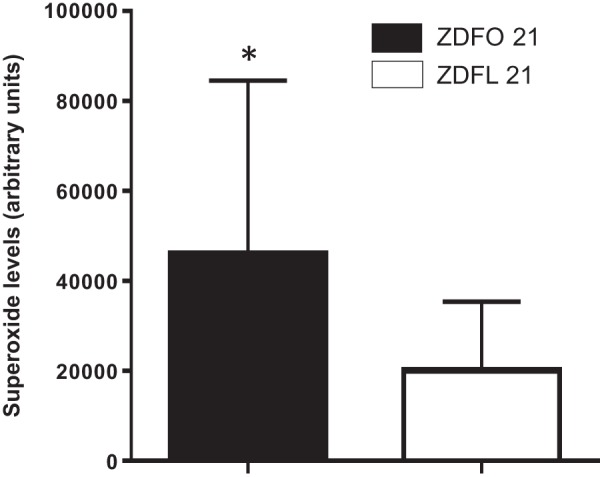
Superoxide levels in large cerebral arteries of 21-wk-old Zucker diabetic fatty lean (ZDFL 21) and obese (ZDFO 21) rats. Superoxide levels were significantly increased in the arteries of the ZDFO 21 group compared with the ZDFL 21 group. n = 18. *P < 0.05 (ZDFL 21 vs. ZDFO 21).
DISCUSSION
Insulin resistance, obesity, hypertension, and other components of the metabolic syndrome represent one of the biggest public health burdens worldwide. A major pathophysiological component by which these conditions cause organ damage is vascular impairment. Oxidative stress, endothelial cell dysfunction, and continuous inflammation all contribute to these angiopathies and present possible therapeutic targets (5, 6, 11, 37). In this study, we directly examined mitochondrial respiration, protein expression, and superoxide production in the cerebral vasculature of ZDFO 21 rats with prolonged T2DM. We chose this time point for our experiments based on the metabolic profile data from the manufacturer as well as previous studies. At this age, animals were exposed to maximal hyperglycemia for ~10 wk. After that time point, there is a slight decline in glycemia level. At this point we believe that the aging is not a factor, but rather the continuous stable high glucose levels (3, 34). We found that mitochondrial respiration in diabetic animals is impaired with regard to basal mitochondrial respiration and proton leak. We found no differences in mitochondrial protein expression in animals at this stage of the disease, and although rattin levels were higher in the lean group, statistical significance was not reached (P = 0.08). We have shown that superoxide levels are significantly higher in the large cerebral vessels of obese rats. This is consistent with previously published results.
Although the role of mitochondria in pathophysiology of T2DM has been investigated in a number of studies, it remains unclear whether mitochondrial impairment precedes or follows the onset of diabetes (10, 16, 18, 22, 23, 26, 29, 31, 35, 41). We have previously shown that in the early stages of insulin resistance, mitochondrial-mediated vasodilation is impaired in the cerebral vasculature (19–21). Also, we have demonstrated that reactive oxygen production plays a crucial role in these processes because antioxidant treatment restores major vasodilatory responses (7–9). It has been shown that mitochondrial uncoupling directly correlates with life longevity (40). Although aging is not the main factor investigated in these experiments, an additional 7 wk of exposure to increased ROS levels cannot be ruled out as a significant contributor to reported findings (25, 27, 36). We proceeded to directly examine mitochondrial respiration, mitochondrial and relevant nonmitochondrial protein expression, as well as superoxide production in the cerebral blood vessels. We found that in the early stages of insulin resistance (prediabetes), only mild differences exist in mitochondrial respiration as well as in mitochondrial protein production. However, superoxide production was already significantly higher in the insulin-resistant group (25). We further investigated how these parameters change with the development of T2DM and found that once T2DM is fully established, basal respiration and proton leak decline (24). In the present study, we observed that the same segments remain impaired after prolonged hyperglycemia. Proton leak does not show which part of the proton gradient was used to generate ATP but rather represents the loss of protons through the inner mitochondrial membrane that leads to heat generation. ROS production, as well as mitochondrial membrane composition, can affect this process (1, 30). Since considerable difference in superoxide production is demonstrated between the studied groups, it is reasonable to consider that this is the main source of difference in proton leak. In addition, inner mitochondrial membrane composition differs somewhat in diabetic mitochondria compared with nondiabetic mitochondria (38).
Most of the investigated proteins showed similar levels between the groups. These findings are similar to ones found in younger diabetic animals, with the exception of acetylated MnSOD and VDAC (24). In this study, we examined for the first time the expression of rattin. Rattin is a rat homolog of humanin, a small 24- or 21-amino acid mitochondrial-derived peptide that has been shown to have a role in the development of many pathological conditions (28). Its protective role was first observed in Alzheimer’s disease (39). It affects insulin-like growth factor binding protein 3 by blocking apoptosis induced by this protein in glial cells (13, 28). Besides Alzheimer’s and other neurodegenerative diseases, it has been shown that humanin might have a role in protection against oxidative stress. The same study demonstrated that ROS reduce the levels of endogenous rattin (14, 28). Humanin levels were also affected in atherosclerosis as well as ischemia-reperfusion, and treatment with humanin showed benefit in these disease models (17, 28, 40). It was also shown that humanin promotes mitochondrial biogenesis in pancreatic cells, acts like an insulin sensitizer, and alters amino acid plasma concentration as well as lipid metabolism (17, 27). Although there is increasing evidence of humanin (rattin) involvement in different pathological conditions, the exact mechanisms are not completely clear. Nonetheless, given its protective properties, humanin may represent a novel treatment option to lessen the cellular damage caused by T2DM.
In summary, the current data and previous studies indicate that insulin resistance and T2DM have many diverse, often independent, effects on the mitochondria of the cerebral vasculature. Thus, despite impaired mitochondrial-induced dilation and enhanced ROS production, mitochondrial respiration and mitochondrial protein levels are fairly well maintained during prolonged periods of the metabolic syndrome.
GRANTS
This work was supported in part by National Heart, Lung and Blood Institute Grants HL-077731 and HL093554 (to D. W. Busija); National Institute of Neurological Disorders and Stroke and National Institute of General Medical Sciences Grant NS-094834 (to P. V. G. Katakam); National Institute of General Medical Sciences, which funds the Louisiana Clinical and Translational Science Center, Grant U54-GM-104940 (to I. Rutkai); American Heart Association Scientist Development Grants 17S-DG-33410366 (to I. Rutkai) and 14S-DG-20490359 (to P. V. G. Katakam); and by Louisiana Board of Regents grants (Endowed Chairs for Eminent Scholars Program to D. W. Busija).
DISCLOSURES
No conflicts of interest, financial or otherwise, are declared by the authors.
AUTHOR CONTRIBUTIONS
I.M. and D.W.B. conceived and designed experiments; I.M., I.R., V.N.L.R.S., and P.V.G.K. performed experiments; I.M. and D.W.B. analyzed data; I.M. and D.W.B. interpreted results of experiments; I.M. and D.W.B prepared figures; I.M. drafted manuscript; I.M., I.R., V.N.L.R.S., P.V.G.K., and D.W.B. edited and revised manuscript; I.M., I.R., V.N.L.R.S., P.V.G.K., and D.W.B. approved final version of manuscript.
ACKNOWLEDGMENTS
We thank Nancy Busija for editing the manuscript.
REFERENCES
- 1.Brand MD, Hafner RP, Brown GC. Control of respiration in non-phosphorylating mitochondria is shared between the proton leak and the respiratory chain. Biochem J 255: 535–539, 1988. [PMC free article] [PubMed] [Google Scholar]
- 2.Brand MD, Nicholls DG. Assessing mitochondrial dysfunction in cells. Biochem J 435: 297–312, 2011. doi: 10.1042/BJ20110162. [DOI] [PMC free article] [PubMed] [Google Scholar]
- 3.Bray GA. The Zucker-fatty rat: a review. Fed Proc 36: 148–153, 1977. [PubMed] [Google Scholar]
- 4.Brownlee M. Biochemistry and molecular cell biology of diabetic complications. Nature 414: 813–820, 2001. doi: 10.1038/414813a. [DOI] [PubMed] [Google Scholar]
- 5.Csipo T, Fulop GA, Lipecz A, Tarantini S, Kiss T, Balasubramanian P, Csiszar A, Ungvari Z, Yabluchanskiy A. Short-term weight loss reverses obesity-induced microvascular endothelial dysfunction. Geroscience 40: 337–346, 2018. doi: 10.1007/s11357-018-0028-9. [DOI] [PMC free article] [PubMed] [Google Scholar]
- 6.Csipo T, Lipecz A, Fulop GA, Hand RA, Ngo BN, Dzialendzik M, Tarantini S, Balasubramanian P, Kiss T, Yabluchanska V, Silva-Palacios F, Courtney DL, Dasari TW, Sorond F, Sonntag WE, Csiszar A, Ungvari Z, Yabluchanskiy A. Age-related decline in peripheral vascular health predicts cognitive impairment. Geroscience 41: 125–136, 2019. doi: 10.1007/s11357-019-00063-5. [DOI] [PMC free article] [PubMed] [Google Scholar]
- 7.Erdös B, Simandle SA, Snipes JA, Miller AW, Busija DW. Potassium channel dysfunction in cerebral arteries of insulin-resistant rats is mediated by reactive oxygen species. Stroke 35: 964–969, 2004. doi: 10.1161/01.STR.0000119753.05670.F1. [DOI] [PubMed] [Google Scholar]
- 8.Erdös B, Snipes JA, Miller AW, Busija DW. Cerebrovascular dysfunction in Zucker obese rats is mediated by oxidative stress and protein kinase C. Diabetes 53: 1352–1359, 2004. doi: 10.2337/diabetes.53.5.1352. [DOI] [PubMed] [Google Scholar]
- 9.Erdös B, Snipes JA, Tulbert CD, Katakam P, Miller AW, Busija DW. Rosuvastatin improves cerebrovascular function in Zucker obese rats by inhibiting NAD(P)H oxidase-dependent superoxide production. Am J Physiol Heart Circ Physiol 290: H1264–H1270, 2006. doi: 10.1152/ajpheart.00804.2005. [DOI] [PubMed] [Google Scholar]
- 10.Fisher-Wellman KH, Weber TM, Cathey BL, Brophy PM, Gilliam LA, Kane CL, Maples JM, Gavin TP, Houmard JA, Neufer PD. Mitochondrial respiratory capacity and content are normal in young insulin-resistant obese humans. Diabetes 63: 132–141, 2014. doi: 10.2337/db13-0940. [DOI] [PMC free article] [PubMed] [Google Scholar]
- 11.Fulop GA, Kiss T, Tarantini S, Balasubramanian P, Yabluchanskiy A, Farkas E, Bari F, Ungvari Z. Nrf2 deficiency in aged mice exacerbates cellular senescence promoting cerebrovascular inflammation. Geroscience 40: 513–521, 2018. doi: 10.1007/s11357-018-0047-6. [DOI] [PMC free article] [PubMed] [Google Scholar]
- 12.Gerencser AA, Chinopoulos C, Birket MJ, Jastroch M, Vitelli C, Nicholls DG, Brand MD. Quantitative measurement of mitochondrial membrane potential in cultured cells: calcium-induced de- and hyperpolarization of neuronal mitochondria. J Physiol 590: 2845–2871, 2012. doi: 10.1113/jphysiol.2012.228387. [DOI] [PMC free article] [PubMed] [Google Scholar]
- 13.Henly DC, Chauvet MC, Phillips JW. Hepatic glucose cycling does not contribute to the development of hyperglycemia in Zucker diabetic fatty rats. Diabetes 48: 342–346, 1999. doi: 10.2337/diabetes.48.2.342. [DOI] [PubMed] [Google Scholar]
- 14.Hers HG. Mechanisms of blood glucose homeostasis. J Inherit Metab Dis 13: 395–410, 1990. doi: 10.1007/BF01799497. [DOI] [PubMed] [Google Scholar]
- 15.Hill BG, Benavides GA, Lancaster JR Jr, Ballinger S, Dell’Italia L, Jianhua Z, Darley-Usmar VM. Integration of cellular bioenergetics with mitochondrial quality control and autophagy. Biol Chem 393: 1485–1512, 2012. doi: 10.1515/hsz-2012-0198. [DOI] [PMC free article] [PubMed] [Google Scholar]
- 16.Institoris A, Lenti L, Domoki F, Wappler E, Gaspar T, Katakam PV, Bari F, Busija DW. Cerebral microcirculatory responses of insulin-resistant rats are preserved to physiological and pharmacological stimuli. Microcirc 19: 749–756, 2012. doi: 10.1111/j.1549-8719.2012.00213.x. [DOI] [PMC free article] [PubMed] [Google Scholar]
- 17.Jung SS, Van Nostrand WE. Humanin rescues human cerebrovascular smooth muscle cells from Abeta-induced toxicity. J Neurochem 84: 266–272, 2003. doi: 10.1046/j.1471-4159.2003.01524.x. [DOI] [PubMed] [Google Scholar]
- 18.Karakelides H, Irving BA, Short KR, O’Brien P, Nair KS. Age, obesity, and sex effects on insulin sensitivity and skeletal muscle mitochondrial function. Diabetes 59: 89–97, 2010. doi: 10.2337/db09-0591. [DOI] [PMC free article] [PubMed] [Google Scholar]
- 19.Katakam PV, Domoki F, Snipes JA, Busija AR, Jarajapu YP, Busija DW. Impaired mitochondria-dependent vasodilation in cerebral arteries of Zucker obese rats with insulin resistance. Am J Physiol Regul Integr Comp Physiol 296: R289–R298, 2009. doi: 10.1152/ajpregu.90656.2008. [DOI] [PMC free article] [PubMed] [Google Scholar]
- 20.Katakam PV, Gordon AO, Sure VN, Rutkai I, Busija DW. Diversity of mitochondria-dependent dilator mechanisms in vascular smooth muscle of cerebral arteries from normal and insulin-resistant rats. Am J Physiol Heart Circ Physiol 307: H493–H503, 2014. doi: 10.1152/ajpheart.00091.2014. [DOI] [PMC free article] [PubMed] [Google Scholar]
- 21.Katakam PV, Wappler EA, Katz PS, Rutkai I, Institoris A, Domoki F, Gáspár T, Grovenburg SM, Snipes JA, Busija DW. Depolarization of mitochondria in endothelial cells promotes cerebral artery vasodilation by activation of nitric oxide synthase. Arterioscler Thromb Vasc Biol 33: 752–759, 2013. doi: 10.1161/ATVBAHA.112.300560. [DOI] [PMC free article] [PubMed] [Google Scholar]
- 22.Kelley DE, He J, Menshikova EV, Ritov VB. Dysfunction of mitochondria in human skeletal muscle in type 2 diabetes. Diabetes 51: 2944–2950, 2002. doi: 10.2337/diabetes.51.10.2944. [DOI] [PubMed] [Google Scholar]
- 23.Lefort N, Glancy B, Bowen B, Willis WT, Bailowitz Z, De Filippis EA, Brophy C, Meyer C, Højlund K, Yi Z, Mandarino LJ. Increased reactive oxygen species production and lower abundance of complex I subunits and carnitine palmitoyltransferase 1B protein despite normal mitochondrial respiration in insulin-resistant human skeletal muscle. Diabetes 59: 2444–2452, 2010. doi: 10.2337/db10-0174. [DOI] [PMC free article] [PubMed] [Google Scholar]
- 24.Merdzo I, Rutkai I, Sure VN, McNulty CA, Katakam PV, Busija DW. Impaired mitochondrial respiration in large cerebral arteries of rats with type 2 diabetes. J Vasc Res 54: 1–12, 2017. doi: 10.1159/000454812. [DOI] [PMC free article] [PubMed] [Google Scholar]
- 25.Merdzo I, Rutkai I, Tokes T, Sure VN, Katakam PV, Busija DW. The mitochondrial function of the cerebral vasculature in insulin-resistant Zucker obese rats. Am J Physiol Heart Circ Physiol 310: H830–H838, 2016. doi: 10.1152/ajpheart.00964.2015. [DOI] [PMC free article] [PubMed] [Google Scholar]
- 26.Petersen KF, Befroy D, Dufour S, Dziura J, Ariyan C, Rothman DL, DiPietro L, Cline GW, Shulman GI. Mitochondrial dysfunction in the elderly: possible role in insulin resistance. Science 300: 1140–1142, 2003. doi: 10.1126/science.1082889. [DOI] [PMC free article] [PubMed] [Google Scholar]
- 27.Qin Q, Jin J, He F, Zheng Y, Li T, Zhang Y, He J. Humanin promotes mitochondrial biogenesis in pancreatic MIN6 β-cells. Biochem Biophys Res Commun 497: 292–297, 2018. doi: 10.1016/j.bbrc.2018.02.071. [DOI] [PubMed] [Google Scholar]
- 28.Ramanjaneya M, Bettahi I, Jerobin J, Chandra P, Abi Khalil C, Skarulis M, Atkin SL, Abou-Samra AB. Mitochondrial-derived peptides are down regulated in diabetes subjects. Front Endocrinol (Lausanne) 10: 331, 2019. doi: 10.3389/fendo.2019.00331. [DOI] [PMC free article] [PubMed] [Google Scholar]
- 29.Ritov VB, Menshikova EV, He J, Ferrell RE, Goodpaster BH, Kelley DE. Deficiency of subsarcolemmal mitochondria in obesity and type 2 diabetes. Diabetes 54: 8–14, 2005. doi: 10.2337/diabetes.54.1.8. [DOI] [PubMed] [Google Scholar]
- 30.Rolfe DF, Brown GC. Cellular energy utilization and molecular origin of standard metabolic rate in mammals. Physiol Rev 77: 731–758, 1997. doi: 10.1152/physrev.1997.77.3.731. [DOI] [PubMed] [Google Scholar]
- 31.Rovira-Llopis S, Bañuls C, Diaz-Morales N, Hernandez-Mijares A, Rocha M, Victor VM. Mitochondrial dynamics in type 2 diabetes: pathophysiological implications. Redox Biol 11: 637–645, 2017. doi: 10.1016/j.redox.2017.01.013. [DOI] [PMC free article] [PubMed] [Google Scholar]
- 32.Rutkai I, Dutta S, Katakam PV, Busija DW. Dynamics of enhanced mitochondrial respiration in female compared with male rat cerebral arteries. Am J Physiol Heart Circ Physiol 309: H1490–H1500, 2015. doi: 10.1152/ajpheart.00231.2015. [DOI] [PMC free article] [PubMed] [Google Scholar]
- 33.Shafrir E. Contribution of animal models to the research of the causes of diabetes. World J Diabetes 1: 137–140, 2010. doi: 10.4239/wjd.v1.i5.137. [DOI] [PMC free article] [PubMed] [Google Scholar]
- 34.Shiota M, Printz RL. Diabetes in Zucker diabetic fatty rat. Methods Mol Biol 933: 103–123, 2012. doi: 10.1007/978-1-62703-068-7_8. [DOI] [PubMed] [Google Scholar]
- 35.Sivitz WI, Yorek MA. Mitochondrial dysfunction in diabetes: from molecular mechanisms to functional significance and therapeutic opportunities. Antioxid Redox Signal 12: 537–577, 2010. doi: 10.1089/ars.2009.2531. [DOI] [PMC free article] [PubMed] [Google Scholar]
- 36.Sure VN, Sakamuri S, Sperling JA, Evans WR, Merdzo I, Mostany R, Murfee WL, Busija DW, Katakam PV. A novel high-throughput assay for respiration in isolated brain microvessels reveals impaired mitochondrial function in the aged mice. Geroscience 40: 365–375, 2018. doi: 10.1007/s11357-018-0037-8. [DOI] [PMC free article] [PubMed] [Google Scholar]
- 37.Ungvari Z, Yabluchanskiy A, Tarantini S, Toth P, Kirkpatrick AC, Csiszar A, Prodan CI. Repeated Valsalva maneuvers promote symptomatic manifestations of cerebral microhemorrhages: implications for the pathogenesis of vascular cognitive impairment in older adults. Geroscience 40: 485–496, 2018. doi: 10.1007/s11357-018-0044-9. [DOI] [PMC free article] [PubMed] [Google Scholar]
- 38.Wang Y, Katayama A, Terami T, Han X, Nunoue T, Zhang D, Teshigawara S, Eguchi J, Nakatsuka A, Murakami K, Ogawa D, Furuta Y, Makino H, Wada J. Translocase of inner mitochondrial membrane 44 alters the mitochondrial fusion and fission dynamics and protects from type 2 diabetes. Metabolism 64: 677–688, 2015. doi: 10.1016/j.metabol.2015.02.004. [DOI] [PubMed] [Google Scholar]
- 39.Widmer RJ, Flammer AJ, Herrmann J, Rodriguez-Porcel M, Wan J, Cohen P, Lerman LO, Lerman A. Circulating humanin levels are associated with preserved coronary endothelial function. Am J Physiol Heart Circ Physiol 304: H393–H397, 2013. doi: 10.1152/ajpheart.00765.2012. [DOI] [PMC free article] [PubMed] [Google Scholar]
- 40.Wu C, Okar DA, Newgard CB, Lange AJ. Increasing fructose 2,6-bisphosphate overcomes hepatic insulin resistance of type 2 diabetes. Am J Physiol Endocrinol Metab 282: E38–E45, 2002. doi: 10.1152/ajpendo.2002.282.1.E38. [DOI] [PubMed] [Google Scholar]
- 41.Yoon Y, Galloway CA, Jhun BS, Yu T. Mitochondrial dynamics in diabetes. Antioxid Redox Signal 14: 439–457, 2011. doi: 10.1089/ars.2010.3286. [DOI] [PMC free article] [PubMed] [Google Scholar]