Abstract
Bacteria have evolved sophisticated mechanisms to inhibit the growth of competitors1. One such mechanism involves type VI secretion systems, which bacteria can use to directly inject antibacterial toxins into neighboring cells. Many of these toxins target cell envelope integrity, but the full range of growth inhibitory mechanisms remains to be determined2. Here, we discover a novel type VI secretion effector, Tas1, in the opportunistic pathogen Pseudomonas aeruginosa. A crystal structure of Tas1 reveals similarity to enzymes that synthesize (p)ppGpp, a broadly conserved signaling molecule in bacteria that modulates cell growth rate, particularly in response to nutritional stress3. Strikingly, however, we find that Tas1 does not synthesize (p)ppGpp, and instead pyrophosphorylates adenosine nucleotides to produce (p)ppApp at rates of nearly 180,000 per min. Consequently, delivery of Tas1 into competitor cells drives the rapid accumulation of (p)ppApp, depletion of ATP, and widespread dysregulation of essential metabolic pathways, resulting in target cell death. Collectively, our findings reveal a new mechanism for interbacterial antagonism and demonstrate, for the first time, a physiological role for the metabolite (p)ppApp in bacteria.
Identification of a novel type VI secretion system effector
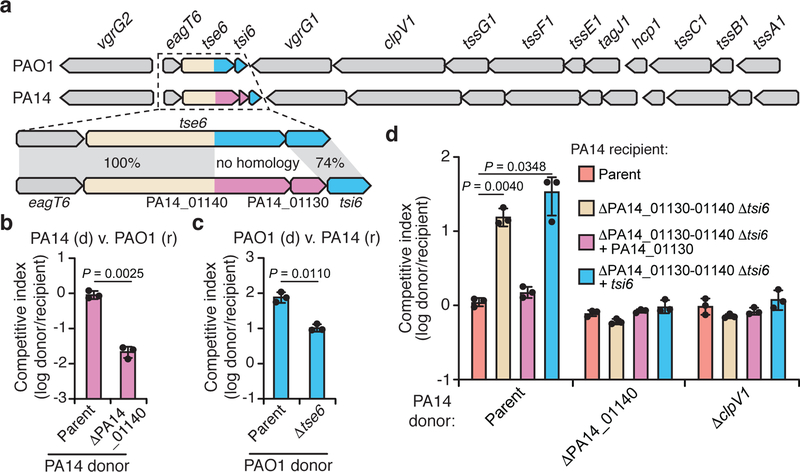
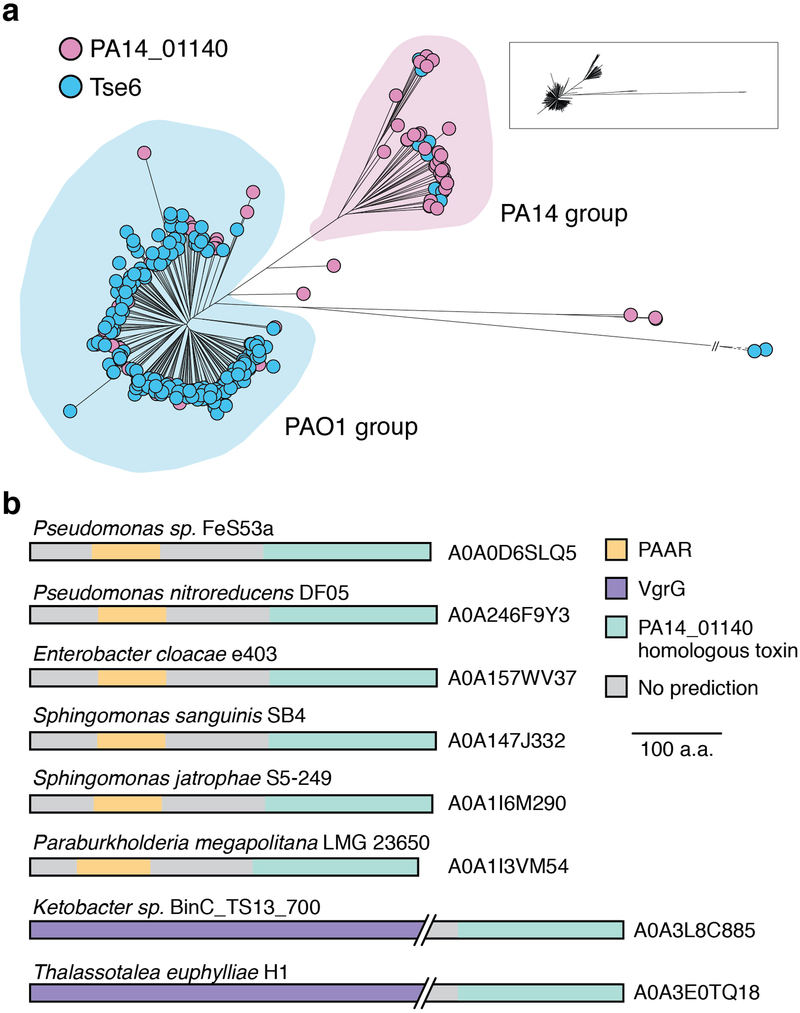
Effectors that transit the bacterial type VI secretion system (T6SS) are often encoded adjacent to structural components of the secretion apparatus4. In Pseudomonas aeruginosa strain PAO1, the Tse6 effector is found next to the bacteria-targeting haemolysin-coregulated protein secretion island I T6SS (H1-T6SS)5. We noted that in the more virulent, clinical isolate PA14, a unique domain is encoded by PA14_01140 instead of the well-characterized C-terminal NAD+ glycohydrolase toxin domain of Tse6 (Fig. 1a)6,7. Orthologues of PA14_01140 are found in many PA14-related strains of P. aeruginosa as well as several other species of Proteobacteria (Extended Data Fig. 1a, b and Supplementary Dataset 1). An additional open reading frame, PA14_01130, immediately downstream of PA14_01140 may encode a cognate immunity protein as T6SS effector-immunity genes are typically found adjacent to one another.
Figure 1 |. A unique T6SS effector-immunity pair is encoded within the H1-T6SS of P. aeruginosa strain PA14.
a) Genomic context of tse6-tsi6 and PA14_01140-PA14_01130 within the H1-T6SS gene clusters of P. aeruginosa strains PAO1 and PA14, respectively. Known toxin-immunity encoding regions of tse6-tsi6 and predicted toxin-immunity encoding regions of PA14_01140-PA14_01130 are shown in blue and pink, respectively. b, c) Outcome of growth competition assays between the indicated donor (d) and recipient (r) strains. The parental PA14 genotype is ΔrsmA ΔrsmF and the parental PAO1 genotype is ΔretS, both of which are mutations that stimulate H1-T6SS activity20,21. d) Outcome of intraspecific growth competitions between the indicated PA14 donor and recipient strains. The parental PA14 strain genotype is ΔrsmA ΔrsmF. The competitive index is normalized to starting ratios of donor/recipient. b-d) Data are mean ±SD for three biological replicates. P values are shown from two-tailed, unpaired t-tests.
We hypothesized that the unique toxin encoded by PA14_01140 could contribute to the fitness of PA14 when co-cultured with PAO1 under contact-promoting conditions that facilitate T6SS attack. Indeed, we found that a PA14 strain lacking PA14_01140 displayed an approximately 40-fold decrease in competitive index against PAO1 (Fig. 1b, Extended Data Fig. 2a). Conversely, a variant of PAO1 lacking tse6 exhibited a 7-fold decrease in co-culture fitness versus PA14 (Fig. 1c). Though PA14 possesses a homologue of the Tse6-specific immunity determinant tsi6, this gene was not protective against Tse6 (Extended Data Fig. 2b). To test the proposed immunity function of PA14_01130, we deleted the PA14_01140-PA14_01130-tsi6 gene cluster from a PA14 recipient and found that it was outcompeted by its parental donor strain in a PA14_01140-and H1-T6SS-dependent manner (Fig. 1d, Extended Data Fig. 2c-e). The fitness defect of this recipient was restored by expressing PA14_01130 but not tsi6 (Fig. 1d). Together, our data demonstrate that PA14_01140 is a unique T6SS effector with PA14_01130 functioning as its cognate immunity protein.
We next sought to determine how PA14_01140 inhibits the growth of bacterial cells. Conventional homology searches were inconclusive, although more sensitive hidden Markov model-based algorithms indicated weak similarity of its C-terminal domain to proteins harboring RelA-SpoT Homolog (RSH) domains (Extended Data Fig. 3)8. These domains are highly conserved across bacteria and usually synthesize the bacterial alarmones guanosine penta-and tetraphosphate, (p)ppGpp, by transferring pyrophosphate from ATP to either GDP or GTP9. Intracellular levels of (p)ppGpp tune growth rate in response to nutritional conditions10. We found that expressing the C-terminal domain of PA14_01140 (PA14_01140tox) inhibited the growth of E. coli, even at levels of approximately three copies per cell, indicating that this domain is sufficient for toxicity (Extended Data Fig. 4a-c).
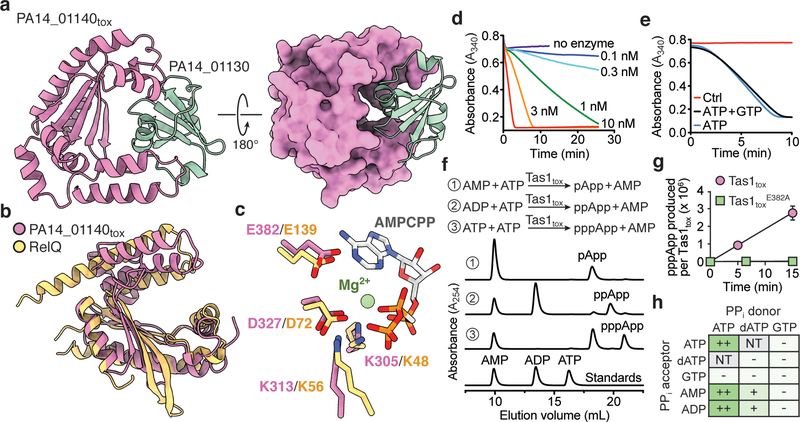
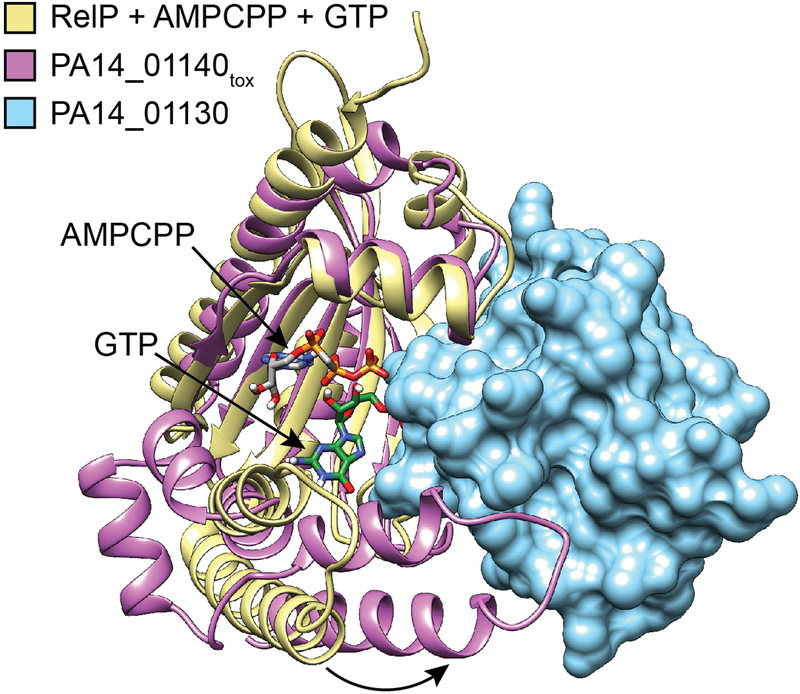
To determine if PA14_01140tox is an RSH enzyme, we determined its structure in complex with the PA14_01130 immunity protein to a resolution of 2.2 Å (Fig. 2a, Supplementary Table 1). This structure revealed strong similarity to the (p)ppGpp-synthetase domains of RelQ from Bacillus subtilis and RelP from Staphyloccoccus aureus (Fig. 2b, Extended Data Fig. 5). Structural overlay of PA14_01140tox with RelQ revealed a highly conserved three-dimensional positioning of residues known to interact with the pyrophosphate donor ATP (Fig. 2c). Mutating any of these residues drastically reduced toxicity when expressed in E. coli (Extended Data Fig. 4d). In contrast to the ATP binding site, the predicted guanosine nucleotide binding site of PA14_01140tox is substantially distorted relative to the catalytically competent position in the Rel enzymes. In our co-crystal structure, two α-helices in PA14_01140tox predicted to form this acceptor site are rotated by approximately 30° relative to the equivalent helices in the Rel proteins (Extended Data Fig. 5). This rotation likely arises from binding of the immunity protein, PA14_01130, which may neutralize PA14_01140-mediated toxicity by inducing a structural rearrangement in the acceptor nucleotide binding site.
Figure 2 |. Tas1tox adopts a RelA-SpoT Homolog (RSH) fold found in enzymes that synthesize the bacterial alarmone (p)ppGpp but instead synthesizes (p)ppApp.
a) Overall structure of PA14_01140tox in complex with PA14_01130. Shown are ribbon (left) and space-filling (right) representations of PA14_01140tox (purple) in complex with PA14_01130 (green). b) PA14_01140tox resembles (p)ppGpp synthetase enzymes. Structural overlay of PA14_01140tox and the small alarmone synthetase RelQ from Bacillus subtilis (PDB code 5DEC)22. The structures superimpose with a Cα r.s.m.d. of 3.4Å over 145 equivalent positions. c) Structural alignment of the pyrophosphate donor ATP binding site of RelQ in complex with a magnesium ion and the non-hydrolyzable ATP analog AMPCPP (PDB code 5F2V) with the equivalent amino acid positions in PA14_01140tox. Amino acid side chains deriving from PA14_01140tox or RelQ and their corresponding labels are shown in purple and yellow, respectively. d) PA14_01140tox catalyzes the formation of AMP in a dose-dependent manner. Coupled enzyme assay of PA14_01140tox-catalyzed AMP production as a function of NADH consumption over time. e) PA14_01140tox catalyzes the production of AMP from ATP in a GTP-independent manner. The control reaction lacks adenylate kinase, which is required for the initial step of the coupled assay. f) PA14_01140tox (Tas1tox) is a (p)ppApp synthetase enzyme. Anion-exchange traces of ATP alone or with excess AMP or ADP after incubation with Tas1tox. A standard trace for ATP, ADP and AMP is shown for comparison. g) Rate of ppApp production by Tas1tox or Tas1toxE382A. Reactions were performed at 37°C with 10 mM ATP and 1 nM Tas1tox or 1 μM Tas1toxE382A. Data are mean ±SD from three separate reactions. h) Specificity of Tas1tox towards pyrophosphate (PPi) donors and acceptors. Indicated nucleotides (1 mM each) were incubated with 100 nM Tas1tox at room temperature for 10 minutes. Reactions that progressed to completion (++), made detectable product (+) or made no detectable product (−) are indicated. NT, not tested. See also Extended Data Figure 6. d–f) Data are representative of two technical replicates.
A toxin that synthesizes (p)ppApp
To assess the enzymatic activity of PA14_01140tox, we used an assay that couples AMP production to the depletion of NADH, which can be monitored at 340nm11. Incubating purified PA14_01140tox with ATP and GTP led to a dose-dependent decrease in A340 over time indicating the production of AMP (Fig. 2d). Surprisingly, however, AMP production by PA14_01140tox did not require GTP (Fig. 2e). This finding suggested that PA14_01140tox can transfer a pyrophosphate from ATP to an adenosine nucleotide acceptor. To test this hypothesis, we incubated purified PA14_01140tox with ATP alone, ATP+ADP, or ATP+AMP and used anion-exchange chromatography to examine the products. In these reactions, PA14_01140tox produced pppApp, ppApp and pApp, respectively, with the identities of these molecules verified by mass spectrometry and by 1H and 31P NMR (Fig. 2f, Extended Data Fig. 6a, b, Supplementary Table 2). In the presence of ATP alone, we also observed pApp formation, which suggests that the pppApp initially produced can subsequently be used to pyrophosphorylate AMP, producing two pApp molecules (Extended Data Fig. 7a, b). Collectively, these results demonstrated that PA14_01140tox is a pyrophosphate kinase for adenosine nucleotides. We therefore renamed this effector Tas1 for type VI secretion effector (p)ppApp synthetase 1 and its cognate immunity protein Tis1 for type VI secretion immunity to (p)ppApp synthetase 1.
We next examined the catalytic rate of pppApp production by Tas1. Strikingly, one molecule of Tas1 was found to pyrophosphorylate 180,000 molecules of ATP per minute (Fig. 2g). This catalytic rate is two orders of magnitude higher than characterized (p)ppGpp synthetases and likely reflects the role of Tas1 as an interbacterial toxin rather than an enzyme involved in growth rate control12,13. Rapid turnover was also observed when ADP or AMP were used as pyrophosphate acceptors (Fig. 2h). In addition to being unable to use GTP as a pyrophosphate donor or acceptor, Tas1 was unable to use dATP as an acceptor, though this deoxynucleotide could serve as a suboptimal pyrophosphate donor (Extended Data Fig. 6c). Alanine substitution of a conserved glutamate residue known to bind the pyrophosphate donor ATP in RSH enzymes abolished Tas1 activity (Fig. 2g, Extended Data Fig. 4d, e).
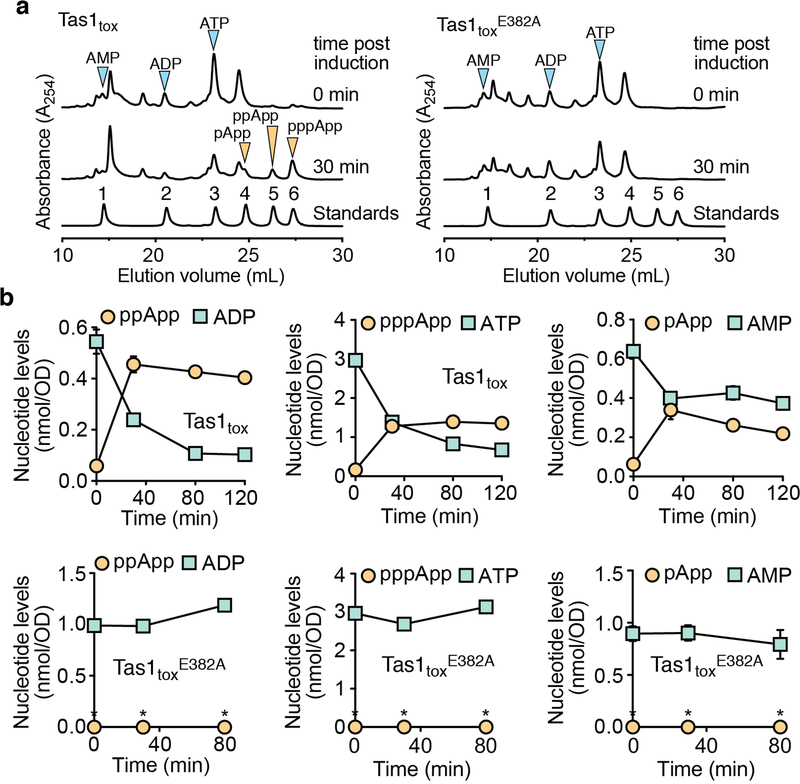
The remarkable catalytic rate of Tas1 predicts that T6SS-dependent delivery of one toxin molecule into a 1 μm3 target bacterium would reduce ATP concentration by approximately 0.6 mM per minute. This calculation led us to hypothesize that Tas1 intoxicates cells in part by depleting essential adenosine nucleotides. To test this idea, we first examined nucleotide levels in E. coli cells expressing Tas1tox. Within 30 minutes of Tas1tox expression, we observed a profound reduction in cellular AMP, ADP, and ATP levels that coincided with a substantial increase in pApp, ppApp and pppApp (Extended Data Fig. 8a, b).
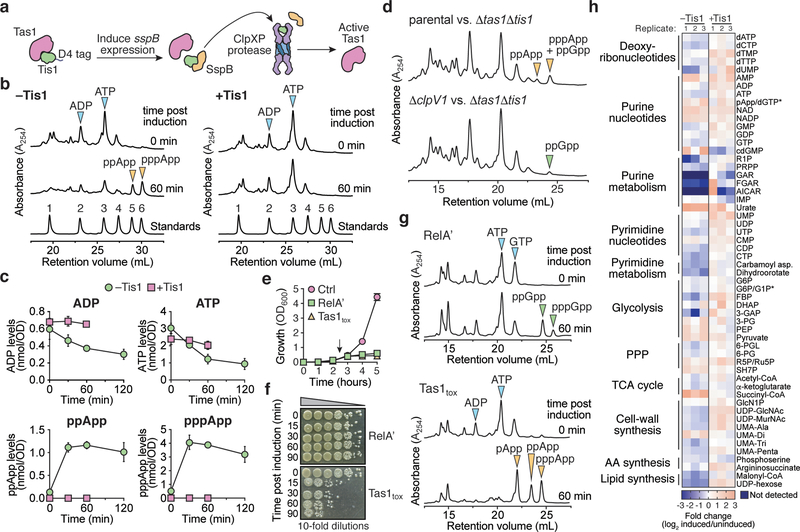
We also examined nucleotide levels in P. aeruginosa cells depleted of the Tis1 immunity protein (Fig. 3a) and observed a similarly large and rapid drop in ADP and ATP levels along with robust formation of pppApp and ppApp (hereafter called (p)ppApp) (Fig. 3b, c). ADP and ATP levels were not completely abolished, suggesting that intoxicated cells attempt to compensate for the loss of these essential nucleotides by altering their metabolism. AMP levels remained unchanged in Tis1-depleted P. aeruginosa cells suggesting that at physiologically relevant concentrations of Tas1, ADP and ATP are the preferred adenosine nucleotide acceptors. Finally, we detected (p)ppApp during interbacterial competition between a PA14 donor and a Δtas1 Δtis1 recipient strain in a manner that was dependent on a functional T6SS in donor cells (Fig. 3d). Collectively, these results demonstrate that T6SS-delivered Tas1 depletes ADP and ATP in target bacteria by synthesizing (p)ppApp.
Figure 3 |. Tas1 intoxication depletes cellular ADP and ATP resulting in dysregulation of central metabolism.
a) Schematic of the inducible Tis1 degradation system used to generate active Tas1 in P. aeruginosa cells. Induction of sspB expression results in degradation of D4-tagged Tis1 by the ClpXP protease23. b) (p)ppApp accumulates in Tis1-depleted P. aeruginosa cells. Anion-exchange chromatography separated metabolites extracted from a P. aeruginosa PA14 parental strain (right, ΔretS ΔsspB pPSV39-CV::sspB) and a derivative expressing tis1-D4 (left, ΔretS ΔsspB PA14_01130-DAS+4 pPSV9-CV::sspB) before or 1-hour after induction of sspB expression. Blue and orange arrowheads indicate peaks of adenosine 5′-nucleotides and (p)ppApp, respectively. A standard trace of an equimolar mixture of 1-AMP, 2-ADP, 3-ATP, 4-pApp, 5-ppApp and 6-pppApp using the same gradient is shown for comparison. c) Absolute quantification of ADP, ATP and (p)ppApp levels in the P. aeruginosa strains from (a) as a function of time post induction of Tis1 depletion. d) Anion-exchange chromatography traces of metabolites extracted from growth competition experiments conducted on solid media for 2.5 hours. The parental strain is P. aeruginosa ΔrsmA ΔrsmF. e) Growth curves of E. coli cells expressing either the (p)ppGpp synthetase domain of RelA (RelA′), Tas1tox or a vector control (Ctrl). Arrow indicates time at which inducer was added to cultures. f) CFU plating of E. coli cells expressing the plasmids defined in (d). Cells were plated either pre-induction or at the indicated times post-induction on inducer-free agar. Representative CFU plates from three biological replicates are shown. g) Anion-exchange chromatography traces of metabolites extracted from strains in (d) either pre-induction or 1-hour post-induction. Arrows indicate relevant metabolites isolated from culture. h) Relative levels of metabolites from P. aeruginosa containing or lacking Tis1. Heat map shows metabolite levels calculated for both the +Tis1 and –Tis1 strains as a log2 ratio for samples 1-hour post-induction relative to pre-induction of sspB expression. The asterisk indicates metabolites that are indistinguishable in our LC-MS analysis. The metabolic pathway or classification for each metabolite is shown on the left. Data for three biological replicates are shown. c, e) Data are mean ±SD for three biological replicates. b, d) Representative traces from three biological replicates are shown.
To compare the effects of (p)ppGpp and (p)ppApp production, we assessed the viability of E. coli cells expressing either a constitutively active fragment of the (p)ppGpp synthetase RelA (RelA′) or Tas1tox. Even though the expression of both enzymes results in growth arrest, only cells undergoing Tas1-mediated intoxication showed a significant reduction in viability (Fig. 3e, f, Supplementary Videos 1-4). This difference likely arises because, in contrast to (p)ppApp production, (p)ppGpp production does not significantly reduce ATP levels and results in only a two-fold reduction in cellular GTP (Fig. 3g). In line with these findings in E. coli, we also observed a substantial decrease in the viability of Tis1-depleted P. aeruginosa cells and during interbacterial competition with a Tas1-expressing donor strain (Extended Data Fig. 9a, b). These results indicate that the production of (p)ppGpp is bacteriostatic whereas (p)ppApp production by Tas1 is bactericidal.
(p)ppApp kills target cells in multiple ways
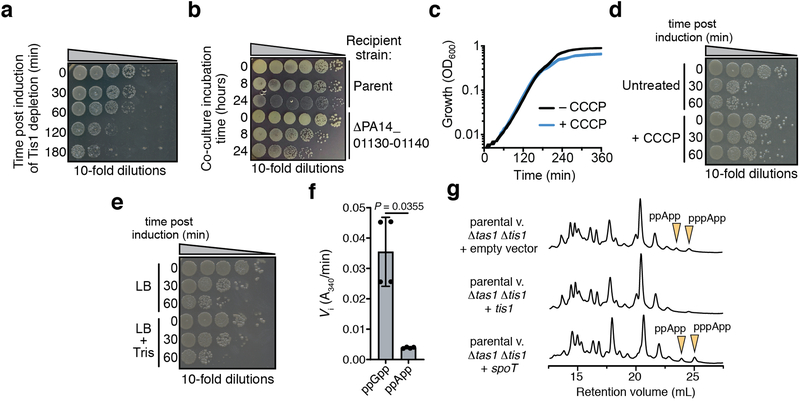
Our findings suggest that (p)ppApp affects target cell physiology by depleting ADP and ATP, which would have pleiotropic consequences for many cellular processes. In particular, ADP is an essential regulator of energy production due to its role in dissipating the proton motive force (pmf) via ATP synthase-catalyzed ATP production. Consequently, reduced levels of ADP following Tas1 delivery may produce excessive electrostatic potential across the inner membrane. Consistent with this notion, we found that addition of sub-lethal levels of the pmf uncoupling ionophore CCCP reduced the toxicity of Tas1tox (Extended Data Fig. 9c-e). We also sought to test if Tas1-intoxicated cells can regenerate ADP by hydrolyzing ppApp. In Proteobacteria, the bifunctional RSH enzyme SpoT can cleave the 3′ pyrophosphate of ppGpp to produce GDP14. We found that the ppGpp-hydrolyzing domain of SpoT was substantially less active on ppApp than ppGpp in vitro (Extended Data Fig. 9f). Furthermore, expression of SpoT during interbacterial competition did not result in a change in ppApp levels (Extended Data Fig. 9g). Together, these data suggest that SpoT cannot alleviate Tas1 toxicity by regenerating ADP from ppApp.
In contrast to ADP, ATP is required for virtually all anabolic and catabolic pathways in bacteria. To examine the impact of Tas1-dependent ATP depletion, we performed metabolic profiling of P. aeruginosa cells depleted of the Tis1 immunity protein. These Tas1-intoxicated cells displayed a dramatic decrease in metabolites belonging to many essential pathways including glycolysis, TCA cycle, and the pentose-phosphate pathway, as well as decreases in intermediates of lipid, amino acid, pyrimidine and purine biosynthesis (Fig. 3h, Supplementary Dataset 2). Additionally, the levels of mononucleotide triphosphates and nucleotide-activated precursors involved in cell wall biosynthesis were substantially depleted (Fig. 3h, Supplementary Table 3). Thus, our results suggest that (p)ppApp production by Tas1 is bactericidal due to a decrease in ADP and ATP levels, leading to a dysregulation of the pmf and depletion of numerous metabolites required for cell viability.
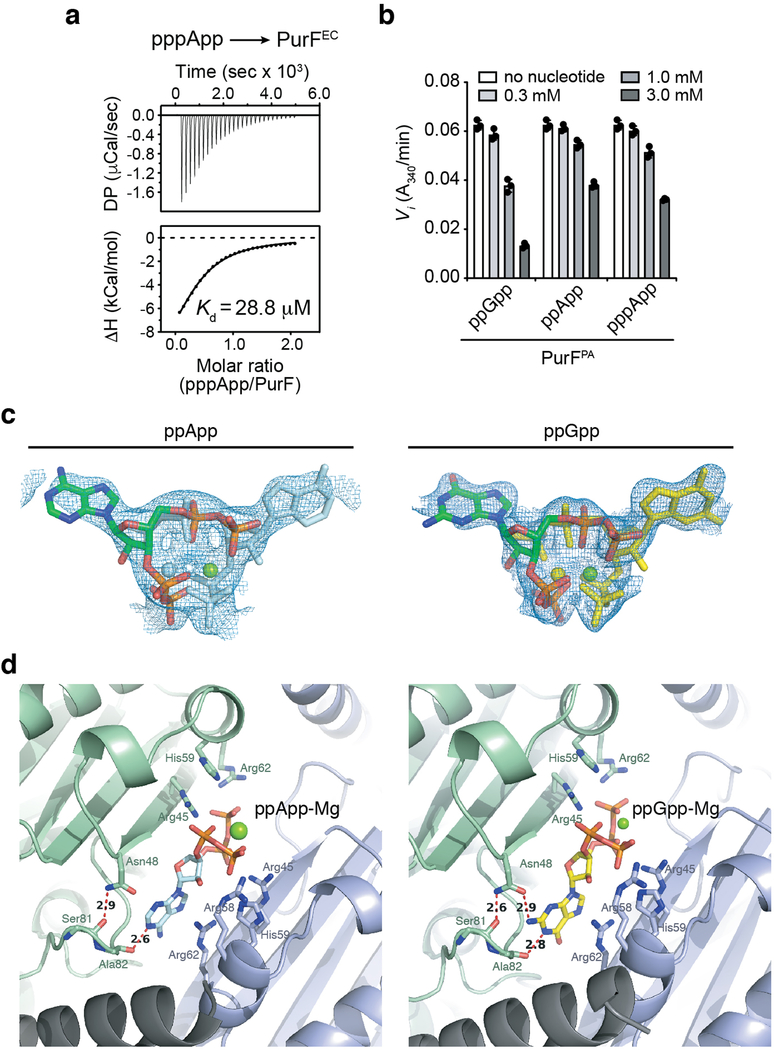
We also considered the possibility that (p)ppApp itself contributes to Tas1-mediated toxicity by binding directly to protein targets. As with (p)ppGpp, (p)ppApp accumulation resulted in the reduction of de novo purine biosynthesis intermediates (Fig. 4a). (p)ppGpp blocks the dedicated step of purine synthesis by competitively inhibiting PurF11. Given its similarity to (p)ppGpp, we hypothesized that (p)ppApp could also inhibit PurF. Indeed, we found that (p)ppApp binds to and inhibits PurF from both E. coli (PurFEC) and P. aeruginosa (PurFPA) at concentrations of (p)ppApp achieved in Tas1-intoxicated cells (Fig. 4b, c and Extended Data Fig. 10a, b). To determine if the mode of PurF inhibition by the two nucleotides is similar, we determined the crystal structure of PurFEC in complex with ppApp to a resolution of 2.5Å (Supplementary Table 1). Our structure indicated that despite differences in the purine rings, ppGpp and ppApp bind PurF in a similar manner, and mutation of an arginine residue required for ppGpp binding to PurFEC also ablated the ability of ppApp to bind and inhibit PurF (Fig. 4c-e, Extended Data Fig. 10c, d). These data indicate that (p)ppApp directly inhibits purine biosynthesis via PurF and likely targets many, if not most, of the more than 50 proteins targeted by (p)ppGpp11, further enhancing the toxicity of (p)ppApp that results from depletion of ADP and ATP.
Figure 4 |. (p)ppApp interacts with PurF and inhibits de novo purine biosynthesis.
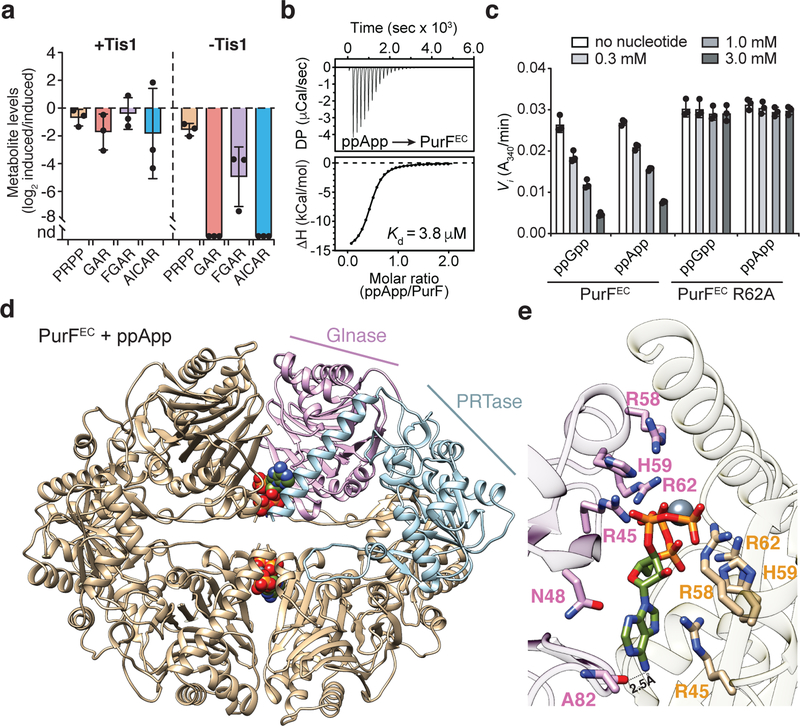
a) Relative quantification of metabolites within the de novo purine biosynthesis pathway in P. aeruginosa strains containing or lacking Tis1. Metabolite levels for both the +Tis1 and –Tis1 strains are shown as log2 ratios for samples 1-hour post-induction relative to pre-induction of sspB expression. nd, not detected. b) Isothermal calorimetry traces (top) and fitted isotherms (bottom) for the titration of 100 μM PurFEC (monomer) with 1 mM ppApp. Representative traces from two independent replicates are shown. c) Changes to the activity of PurFEC in the presence of indicated concentrations of ppGpp or ppApp. d) Ribbon diagram of the PurFEC tetramer in complex with ppApp. A single PurF subunit is coloured by individual domains (Glnase; glutaminase domain in pink, PRTase; phosphoribosyltransferase domain in blue), while the remaining subunits are coloured brown. ppApp and Mg2+ are shown in stick and sphere representations, respectively. e) Close-up view of the ppApp binding site between the glutaminase domains of two adjacent PurFEC monomers. ppApp-interacting residues are shown as pink or orange sticks and hydrogen bonding between PurFEC and the purine ring of ppApp are shown as black dashed lines (see Extended Data Fig. 10 for additional details). a, c) Data are mean ±SD for three separate cultures (a) or reactions (c).
Conclusions
Our work demonstrates that Tas1 is a novel interbacterial toxin and represents the first case of an RSH protein that is delivered between bacterial cells. Tas1 is also, to our knowledge, the first (p)ppApp synthetase enzyme with a known role in bacterial physiology. All previously characterized RSH enzymes synthesize (p)ppGpp, which regulates cell growth rate and promotes bacterial survival. Although (p)ppApp is very similar to (p)ppGpp in structure, its physiological role differs because its production irreversibly alters the cellular metabolome, depleting existing pools of ATP and hindering the ability of intoxicated cells to synthesize ATP. As the P. aeruginosa H1-T6SS delivers a diverse payload of effectors into target cells, the (p)ppApp synthetase activity of Tas1 likely augments the activities of co-secreted cell wall and membrane targeting effectors because pathways involved in cell envelope biosynthesis and repair require ATP15–17. Although reports from several decades ago linked (p)ppApp production to sporulation in B. subtilis18,19, a physiological role for this molecule had never been elucidated, nor had enzymes that synthesize this molecule been reported. Our discovery of Tas1 now indicates that (p)ppApp is a physiologically relevant molecule that can serve as a potent cellular toxin.
Experimental Procedures
Bacterial strains and growth conditions
P. aeruginosa strains generated in this study were derived from the sequenced strains PAO1 and PA14 (Supplementary Table 4)24,25. For co-culture experiments, growth curves and secretion assays, P. aeruginosa strains were grown at 37°C in LB medium (10 g/L NaCl, 10 g/L tryptone, and 5 g/L yeast extract). Solid media contained 1.5% or 3% agar. For analysis of cellular extracts and preparation of samples for metabolomics, P. aeruginosa strains were grown at 30°C overnight and sub-inoculated at 37°C, in LB medium. Media were supplemented with gentamicin (30 μg/mL) and IPTG (500 μM) as appropriate. E. coli strains XL-1 Blue, SM10, BL21 (DE3) CodonPlus, and MG1655 were used for plasmid maintenance, conjugative transfer, gene expression, growth curves and nucleotide extraction experiments, respectively (Supplementary Table 4). E. coli strains were grown 37°C in LB medium with the exception of the PurFPA expression and nucleotide extraction experiments. For PurFPA, the expression strain was grown in M9 medium (14 g/L Na2HPO4∙7H2O, 3 g/L KH2PO4, 0.5 g/L NaCl, 1 g/L NH4Cl, 1 mM MgSO4, and 30 μM CaCl2) supplemented with 0.4% glucose and 25 μM Fe(SO4)-EDTA chelate. For nucleotide extraction experiments, cells were grown in M9 medium supplemented with 0.1% glucose, 0.25% each of L-serine and L-threonine, 0.0375% each of L-asparagine and L-glutamine, 0.015% each of all 16 other natural amino acids, and 1× Kao & Michayluk Vitamin Solution (abbreviated as M9GAV). Where appropriate, media were supplemented with 150 μg/mL carbenicillin, 50 μg/mL kanamycin, 200 μg/mL trimethoprim, 15 μg/mL gentamicin, 500 μM IPTG, 0.1% (w/v) rhamnose or 40 μg/mL X-gal.
DNA manipulation and plasmid construction
All DNA manipulation procedures followed standard molecular biology protocols. Primers were synthesized and purified by Integrated DNA Technologies (IDT). Phusion polymerase, restriction enzymes and T4 DNA ligase were obtained from New England Biolabs (NEB). DNA sequencing was performed by Genewiz Incorporated.
In-frame chromosomal deletion mutants in P. aeruginosa were generated using the pEXG2 suicide plasmid as described previously26. Briefly, ~500bp upstream and downstream of target gene were amplified by standard PCR and spliced together by overlap-extension PCR. The resulting DNA fragment was ligated into pEXG2 using standard cloning procedures (Supplementary Table 5). Deletion constructs were introduced into P. aeruginosa via conjugal transfer and sacB-based allelic exchange was carried out as described previously27. All deletions were confirmed by PCR.
Bioinformatic analysis of tse6 and tas1 distribution among P. aeruginosa strains
Complete or draft assembled genome sequences for 326 P. aeruginosa isolates representing a broad sampling of P. aeruginosa diversity were downloaded from the Pseudomonas Genome DB28. Open reading frames were predicted for each isolate using Prodigal v2.6.1 and the resulting putative proteomes compared to the Tse6 and Tas1 sequences using BLASTP v2.8.1, with automated and manual inspection of the results to identify all homologs and sequence variants within each genome 29,30. Phylogenetic relationships of the isolates were reconstructed using whole-genome SNP analysis; homologous sites in the genomes containing nucleotide variation among isolates, but not involved in horizontal gene transfer or recombination, were identified using PARSNP v1.2 with PhiPack filtering31. The resulting SNP matrix was converted to PHYLIP format and the phylogenetic history of the isolates reconstructed using maximum likelihood as implemented in the RAxML-HPC BlackBox v8.2.10 hosted on the CIPRES Science Gateway server32. RAxML analysis included automatically generated bootstrapping and estimated proportion of invariables sites (GTRGAMMA+I). The resulting Tse6 and Tas1 homologs were mapped onto the isolate phylogenetic tree using FigTree v1.4.4 (http://tree.bio.ed.ac.uk/software/figtree/).
Bacterial toxicity experiments
E. coli XL-1 Blue cells were co-transformed with either pSCrhaB2-CV or pSCrhaB2-CV expressing either wild-type or active site mutants of Tas1tox and pPSV39-CV or pPSV39-CV expressing Tis1, Tsi6PA14, Tsi6PAO1 (Supplementary Table 5). Overnight cultures of these strains were diluted to 106 in 10-fold increments and each dilution was spotted onto LB agar plates containing 0.1% (w/v) L-rhamnose, 250 μM IPTG and the appropriate antibiotics. Photographs were taken after overnight growth at 37°C.
To compare (p)ppApp versus (p)ppGpp toxicity, E. coli MG1655 with plasmids expressing either Tas1tox or RelA′ were grown in LB at 30°C overnight with appropriate antibiotic selection. Stationary-phase overnight cultures were diluted to OD 0.01 in fresh LB medium and grown at 37°C with shaking. At OD 0.3, 1mL of culture was retrieved and chilled in ice water and the remaining culture was treated with 500 μM IPTG or 0.1% (w/v) rhamnose. At indicated time points post-induction, 1 mL culture was withdrawn and chilled in ice water for 2 minutes and then cells were pelleted at 20,000 g at 4°C and re-suspended in ice-cold fresh LB without inducer and kept on ice. These samples were diluted to 106 in 10-fold increments and 10 μL from each dilution was spotted onto LB agar plates containing appropriate antibiotics. Nucleotides levels in these strains were examined by anion exchange chromatography as described below (see Metabolite extraction and quantification – nucleotide quantification using anion-exchange chromatography).
Secretion assay
Stationary-phase overnight cultures of P. aeruginosa strains were inoculated in 2 mL LB at a ratio of 1:500. Cultures were grown at 37 °C with shaking to mid-log phase, and cell and supernatant fractions were prepared as described previously33.
Quantification of Tas1tox overexpression in E. coli
E. coli MG1655 harboring an anhydrotetracycline (aTC)-inducible His6-Tas1tox-VSV-G expression plasmid was grown to OD600 = 0.3 and either untreated or induced with 2 or 3 ng/mL aTC for 15 minutes. Viability of each culture was assessed by enumerating CFUs. Cells from 100 mL cultures (5 × 10⁹ CFU) were collected for Ni-NTA enrichment of His6-Tas1tox-VSV-G. Briefly, cells from each culture were lysed in 1 mL lysis buffer (20 mM HEPES-Na 7.4, 150 mM NaCl) and applied to a column of 0.5 mL Ni-NTA resin. Each column was washed with 3 mL lysis buffer containing 20 mM imidazole followed by 3 mL 20 mM HEPES-Na 7.4, 500 mM NaCl, 20 mM imidazole containing 8M Urea. Bound protein was eluted with a buffer containing 300 mM imidazole and 8M urea, and each eluate was concentrated to 60 μL. 15 μL of concentrated eluate (25% of total protein) underwent anti-VSV-G immunoblotting for quantification, using 50 and 15 fmol of purified, recombinant His6-Tas1tox-VSV-G as internal standards. Assuming 100% recovery of His6-Tas1tox-VSV-G by Ni-NTA enrichment, cells induced by 2 or 3 ng/mL aTC contain 24 and 44 fmol Tas1, which, provided a cell count of 5 × 10⁹, correspond to 3 and 5 copies of His6-Tas1tox-VSV-G per cell, respectively.
Western blot analyses
Western blot analyses of protein samples were performed as described previously using rabbit anti-VSV-G (diluted 1:5,000; Sigma), rabbit anti-Hcp (diluted 1:5,000) and detected with anti-rabbit horseradish peroxidase-conjugated secondary antibodies (diluted 1:5,000; Sigma)6. Western blots were developed using chemiluminescent substrate (Clarity Max, Bio-Rad or SuperSignal™ West Femto Maximum Sensitivity Substrate, Thermofisher) and imaged with the ChemiDoc Imaging System (Bio-Rad).
Competition assays
A lacZ cassette was inserted into a neutral phage attachment site (attB) of recipient P. aeruginosa strains to differentiate these strains from unlabeled donors. For interstrain competitions, stationary-phase cultures of P. aeruginosa PA14 and PAO1 donor or recipients were mixed in a 4:3 (v/v) ratio, in favour of the donor. For intraspecific competitions, stationary-phase cultures of P. aeruginosa PA14 donor and recipient strains were mixed in a 1:1 (v/v) ratio.
Starting ratios of donor and recipient were enumerated by plating on LB agar containing 40 μg/ml X-gal. Ten microlitres of each competition mixture was then spotted in triplicate on a 0.45 μm nitrocellulose membrane overlaid on a 3% LB agar plate and incubated face up at 37 °C for 20–24 h. Competitions were then harvested by resuspending cells in LB and enumerating colony forming units by plating on LB agar containing 40 μg/ml X-gal. The final ratio of donor/recipient colony forming units were normalized to the starting ratio of donor and recipient strains.
To monitor (p)ppApp production in recipients by anion exchange, 600μL of donor and recipient mixtures were plated on a 25-mm, 0.45 μM PVDF membranes using vacuum filtration. The membrane was overlaid onto 3% LB agar and incubated face up for 2–7h. Following incubation, each membrane was immersed in 2 mL ice-cold lysis solvent, a methanol-acetonitrile-water mixture in a volume ratio of 40:40:20. After brief sonication to detach cells from the PVDF membrane, the membrane was removed, and the entire suspension was diluted into 6mL of 20mM Tris-HCl buffer (pH 8.0). The diluted mixture was spun at 10,000 g to pellet insoluble debris. After passage of a 0.22-μm syringe filter, 4 mL of the supernatant was analyzed using anion-exchange chromatography as described below (see Metabolite extraction and quantification– nucleotide quantification using anion-exchange chromatography).
Tis1 depletion system
A C-terminal ssrA-like DAS+4 degradation tag (peptide sequence of tag: AANDENYSENYADAS) was fused to the 3ʹ end of the native tis1 locus in a P. aeruginosa strain bearing deletions in retS and sspB23. An IPTG-inducible plasmid containing sspB was used to stimulate controlled degradation of Tis1-DAS+4 (Tis1-D4). The SspB protein recognizes DAS+4 tagged proteins and delivers them to the ClpXP protease for degradation. Strains harbouring this plasmid were streaked on LB agar supplemented with 30 μg/mL gentamicin and 500 μM IPTG.
Protein expression and purification
Tas1tox-Tis1 complex
Tas1tox or Tas1toxE382A were coexpressed with Tis1 from pETDuet-1 in E. coli BL21 (DE3) CodonPlus cells. 40 mL overnight cultures of expression strains were diluted into 2 L of LB broth and grown to mid-log phase (OD600 = 0.6) in a shaking incubator at 37°C. Protein expression was induced by the addition of 1mM IPTG and cells were further incubated for 3.5 h at 37°C. Cells were harvested by centrifugation at 9,800 g for 10 min and resuspended in 25 mL of lysis buffer (50 mM Tris-HCl pH 8.0, 300 mM NaCl, 10 mM imidazole) prior to rupture by sonication (6 × 30 second pulses, amplitude 30%). Cell lysates were cleared by centrifugation at 39,000 g for 60 min and the soluble fraction was loaded onto a gravity flow Ni-NTA column that had been equilibrated in lysis buffer.
To obtain Tas1tox–Tis1 complex for crystallization, Ni-NTA bound complex was washed twice with 25 mL of lysis buffer followed by elution in 10 mL of lysis buffer supplemented with 400 mM imidazole. The Ni-NTA purified complex was further purified by gel filtration using a HiLoad 16/600 Superdex 200 column equilibrated in 20 mM Tris-HCl pH 8.0 150 mM NaCl. Fractions with the highest purity were used for subsequent crystallization screening.
To obtain Tas1tox and Tas1toxE382A for enzyme assays, Tis1 was removed from Ni-NTA immobilized Tas1tox or Tas1toxE382A by washing the column twice with 25 mL of lysis buffer supplemented with 8 M urea. On-column refolding was achieved by washing twice with 25 mL of lysis buffer followed by elution of the renatured proteins using lysis buffer supplemented with 400 mM imidazole. Refolded Tas1tox and Tas1toxE382A were further purified by gel-filtration as described above except that the running buffer was comprised of 20 mM HEPES pH 7.4, 150 mM NaCl. Purified proteins were then flash frozen until needed.
SpoT1–387
The SpoT 1–387 fragment from P. aeruginosa was expressed from pETDuet-1 in E. coli BL21 (DE3) CodonPlus cells. The same expression protocol was followed as described for the Tas1tox-Tis1 complex. To obtain SpoT1–387 for enzyme assays, cleared cell lysates containing SpoT1–387 were loaded onto a gravity flow Ni-NTA column that had been equilibrated in lysis buffer. The Ni-NTA bound SpoT1–387 was washed twice with 25 mL of lysis buffer followed by elution in 10 mL of lysis buffer supplemented with 400 mM imidazole. The Ni-NTA purified complex was further purified by gel-filtration as described above except that the running buffer was comprised of 20 mM HEPES pH 7.4, 150 mM NaCl. Purified proteins were then flash frozen until needed.
PurFEC and PurFPA
PurFEC used for crystallization was expressed without an affinity tag (Supplementary Table 5). PurFEC and PurFPA used in biochemical experiments was expressed as a fusion protein with a C-terminal self-cleaving Cfa-His6 tag34. Cultures of expression strains were grown to mid-log phase, cooled to 22°C and induced with 200 μM IPTG for 20 h. For PurFPA, M9 minimal medium was used for expression.
For untagged PurFEC, cell pellets (~10 g wet weight) were resuspended in 40 mL lysis buffer containing 50 mM Tris-HCl, pH 8.0, 50 mM NaCl, 10 mM MgCl2, 5 mM DTT, 20 μg/mL lysozyme and 1 mM PMSF. Cells were lysed by sonication and centrifuged at 15,000 g for 10 min. Cleared lysates were treated with protamine sulfate (8 mg per gram of cell pellet), vortexed. Precipitate was pelleted at 30, 000 g for 1 h and cleared lysate was fractionated using a DEAE Sepharose column equilibrated in buffer A (50 mM Tris-HCl, pH 8.0, 10 mM MgCl2 and 5 mM DTT). The column was washed with 50 mL 5% buffer B (buffer A + 1 M NaCl) and bound protein was eluted using a linear gradient with buffer B concentration increasing from 5% to 55% over 200 mL. Peak fractions were combined and saturated ammonium sulfate was added to samples at 4°C. Precipitated protein collected between 40% and 47.5% saturation was redissolved in gel-filtration buffer (20 mM HEPES-Na, pH 7.4, 150mM NaCl, 2mM MgCl2 and 1mM TCEP) and run over a Superdex-200 increase (10/300) column.
PurF-Cfa-His6 was purified using a Ni-NTA affinity column, as previously described. To cleave the Cfa-His6 tag, eluate was treated with 100 mM sodium 2-mercaptoethanesulfonate (MESNa), 100 mM L-cysteine, and 20 mM TCEP, pH 7.0 at room temperature overnight. The cleavage mixture was dialyzed against gel filtration buffer and then subjected to a reverse Ni-NTA process. Collected protein was run over a Superdex-200 column equilibrated with gel-filtration buffer.
Crystallization and structure determination
Tas1tox-Tis1 complex
Selenomethionine-incorporated Tas1tox-Tis1 complex was concentrated to 28 mg/mL by spin filtration (10 kDa MWCO, MilliporeSigma) and screened for crystallization conditions at 23°C using commercially available sparse matrix screens (MCSG1–4, Anatrace) and the hanging drop vapour diffusion technique. Diffraction quality crystals appeared after approximately one week in a condition containing sodium acetate pH 4.5, 0.8 M sodium phosphate monobasic, 1.2 M potassium phosphate dibasic. Crystals were cryoprotected in crystallization buffer containing 20% (v/v) ethylene glycol and flash frozen in liquid nitrogen prior to data collection. Synchrotron diffraction data were collected at 100K on a Pilatus 3X 6M detector using beamline 19-ID of the Structural Biology Center at the Advanced Photon Source. Diffraction data were processed using HKL300035 and the structure was solved by single wavelength anomalous dispersion (SAD) phasing using Phenix.autosol36. Initial model building was performed using Phenix.autobuild followed by manual adjustment using Coot37. Refinement was carried out using Phenix.refine with TLS parameterization.
PurFEC-ppApp complex
Crystals were grown by hanging-drop vapor diffusion with drops containing 2 μL of protein (25 mg/mL PurFEC in 20 mM HEPES-Na, pH 7.4, 150 mM NaCl, 1 mM TCEP, 5 mM ppApp, and 10 mM MgCl2) mixed with 2 μL of well solution (0.1 M HEPES-Na, pH 7.4, 24% PEG 3350 and 4% iPrOH) at 18°C. After 1 week, crystals were flash frozen in liquid nitrogen without added cryoprotectant. Diffraction data were collected at the APS, with the NE-CAT beamline 25-IDC on a Pilatus 6M detector. Diffraction data were were indexed, integrated and scaled using XDS/XSCALE38 and refined with Phenix36. The structure was solved by molecular replacement using Phaser39 with chain A of PDB entry 6CZF as the search model. The asymmetric unit of the C2221 cell contains two PurF chains forming a symmetric dimer. The D2 symmetry of PurF tetramer is generated by the crystallographic centering operation. As in the 6CZF crystal, each PurF tetramer has four ligand binding sites but can only bind two ligands because pairs of binding sites overlap each other across a twofold symmetry axis of the tetramer. Consequently, each PurF chain in the PurF/ppApp crystal is modeled with a single ppApp (and its associated Mg2+ ion) at 0.5 occupancy.
Biochemical analysis of Tas1tox
Analysis by coupled enzyme assay
Each reaction (100 μL) contained 50 mM HEPES 7.4, 150 mM NaCl, 20 mM KCl, 10 mM MgCl2, 1 mM TCEP-Na, 5 mM ATP, 1 mM GTP (if indicated) and Tas1tox or Tas1toxE382A at the indicated concentrations. To couple production of AMP in the pyrophosphokinase reaction to the consumption of NADH, the reaction also contained 3.75 M phosphoenolpyruvate (PEP), 0.5 mM NADH, 10 U/mL myokinase (Adenylate kinase, ADK), 20 U/mL pyruvate kinase (PK) and 20 U/mL lactate dehydrogenase (LDH).
Reactions were assembled in 96-well plates, with Tas1 added at t = 0. The reactions were monitored at 25°C in a Spectramax M5 plate reader (Molecular Devices) and absorbance at 340 nm (A340) was measured every 15 seconds.
Analysis by anion-exchange chromatography
Each reaction (100 μL total volume) contained 20 mM HEPES-Na 7.4, 300 mM NaCl, 10 mM MgCl2, and substrates at indicated concentrations. Tas1tox was diluted to 10X working concentration in the above buffer conditions and added last. Reactions were incubated at 37°C (Tas1tox turnover experiment in Figure 2g) or 25°C (all other reactions). At the indicated time points, each 50 μL reaction was diluted in 1 mL ice-cold water and then applied to a MonoQ 5/50 column (GE Healthcare). Bound nucleotides were eluted at 4°C using a linear gradient of buffer A (5 mM Tris-HCl pH 8.0) and buffer B (5 mM Tris-HCl pH 8.0, 1M NaCl), with the percentage of buffer B increasing from 0 to 40% over 20 mL.
Tas1 turnover measurement
Each reaction (200 μL total volume) contained 20 mM HEPES-Na pH 7.4, 150 mM NaCl, 15 mM MgCl2, 10 mM ATP, 25 mM PEP-K, 10U/mL each ADK and PK, and 1 nM Tas1tox or 1 μM Tas1toxE382A. Reactions were incubated at 37°C and 20μL was diluted in 1 mL ice-cold water at the indicated time points and analyzed by anion-exchange chromatography as described above. The 3′-pyrophosphorylated product, pppApp, was quantified based on the integration of the A254 trace.
Additional biochemical analyses by enzyme-coupling readout
Reactions were assembled in 96-well plates from 10X stocks of individual components, with enzymes added at t = 0. Then reactions were monitored at 30 °C in a Spectramax M5 plate reader (Molecular Devices) for the absorbance at 340 nm (A340) every 30 seconds.
PurF glutamine amidophosphoribosyltransferase assay
Each reaction (100 μL) contained 50nM PurFEC or 100nM PurFPA in 50 mM HEPES-Na pH 7.4, 150 mM NaCl, 10 mM MgCl2, 1 mM TCEP, 5 mM glutamine, 1 mM pRpp-Mg and indicated concentrations of ppGpp-Mg, ppApp-Mg or pppApp-Mg. To couple production of 5′-phosphoribosylamine (PRA) by PurF to the consumption of NADH, the reaction also contains 5 mM ATP, 5 mM glycine and 1 μM E. coli PurD (these components ligate glycine to 5′-PRA to form glycinamide 5′-ribonucleotide (GAR) and generate ADP), as well as 3.75M PEP, 0.5 mM NADH, 20U/mL PK and 20U/mL LDH.
glutamine + pRpp + glycine + H2O + PEP + NADH + H+ = glutamate + GAR + PPi + Pi + lactate + NAD+
P. aeruginosa SpoT1–387 hydrolase assay
Each reaction (100 μL) contained 40 mM HEPES 7.4, 150 mM KCl, 5 mM MnCl2, 2 mM MgCl2, 1 mM TCEP-Na, 1 mM ATP, 10μM SpoT1–387, and 1 mM ppGpp or ppApp. To couple production of ADP or GDP by SpoT1–387 to the consumption of NADH, the reaction also contains 3.75M PEP, 0.5 mM NADH, 1 μM E. coli nucleoside disphosphate kinase, 20U/mL PK and 20U/mL LDH.
Scale-up preparation of (p)ppApp
pApp
Because Tas1 can slowly convert pppApp and AMP to pApp, quantitative conversion of ATP to pApp is achieved after prolonged incubation with Tas1. Excess AMP was included to ensure the complete consumption of pppApp. We incubated 175 μmol AMP and 75 μmol ATP with 50 nmol Tas1 in 50 mL reaction containing 20 mM HEPES 7.4, 150 mM NaCl, 5 mM MgCl2 and 1 mM TCEP-Na. The reaction reached completion after 15 minutes at RT and then diluted to 200 mL with ice water. pApp was purified using anion-exchange chromatography.
ppApp
When ADP is present in excess to ATP, Tas1 activity preferentially produces ppApp (Fig. 2f). Thus, we first incubated 50 μmol ADP with 50 pmol Tas1tox in 5 mL 20 mM HEPES 7.4, 150 mM NaCl, 20 mM MgCl2 and 1 mM TCEP-Na at 37°C. Then, with vigorous stirring, we added 45 μmol ATP in 9 portions over 10 minutes. After another 5 minutes of incubation at 37°C, the reaction was complete and Tas1tox was inactivated with 2 mL chloroform. The aqueous phase was isolated, diluted to 25 mL with water, and ppApp purified using anion-exchange chromatography.
pppApp
After synthesizing pppApp, Tas1tox further converts pppApp and AMP into pApp (Extended Data Fig. 7). To maximize the yield of pppApp, we included ADK, PK and PEP to regenerate ATP from AMP. The synthesis was thus carried out with 50 μmol ATP, 125 μmol PEP, 25 pmol Tas1tox and 200U/mL each PK and ADK in 5mL in the presence of 20 mM HEPES 7.4, 150 mM NaCl, 15mM MgCl2 and 1mM TCEP-Na. After incubation at 37°C for 30 min, 250 nmol Tas1tox was added and the mixture was incubated for another 30 min. Tas1tox was then inactivated with 2 mL chloroform. The aqueous phase was isolated, diluted to 25 mL with water, and pppApp purified using anion-exchange chromatography.
Preparative anion-exchange chromatography
To purify (p)ppApp, a MonoQ 10/100 column (GE Healthcare) was operated at 5 mL/min at room temperature. (p)ppApp synthesis reactions were diluted with water and applied to the column. Bound nucleotides were eluted using a linear gradient of buffer A (5 mM Tris-HCl pH 8.0) and buffer B (5 mM Tris-HCl pH 8.0, 1M NaCl), with the percentage of buffer B increasing from 15 to 40% within 5 column volumes (~ 40 mL). Preparations of pppApp were purified in two runs, while preparations of ppApp were purified in 4 runs. Fractions containing the purified product purity were combined, and LiCl was added to the combined fractions to 1M final concentration. Then, 4x volumes of ethanol was added to precipitate the nucleotide. After incubation in an ice-water bath for 30 min, the nucleotide was collected by centrifugation at 8000 g for 10min and the mother liquor decanted. The product was washed with 10 mL 95% ethanol, then dissolved in water and dried on a lyophilizer. The powder was reconstituted in water and concentration determined by absorbance at 260nm (ε = 15,400 M−1cm−1).
Metabolite Extraction and Quantification
Culture and induction conditions
Prior to each experiment, strains were grown overnight at 30°C to stationary phase in the same medium. The starter culture was diluted to OD600 = 0.005 in fresh medium and grown at 37°C. Inducer was added after OD600 reached 0.10 for P. aeruginosa or 0.25 for E. coli. Untreated control samples were harvested 1 minute prior to induction.
Expression of Tas1tox and Tas1toxE382A in E. coli MG1655: cells were grown in LB or M9GAV containing 250 μg/mL trimethoprim (TMP) and induced using 0.1% rhamnose.
Expression of RelA′ in E. coli MG1655: cells were grown in LB containing 100 μg/mL carbenicillin and induced using 500 μM IPTG.
Depletion of Tis1 in P. aeruginosa PA14: Tis1 inducible-degradation strain ΔretS ΔsspB PA14_01130-DAS+4 pPSV9-CV::sspB and its parental strain ΔretS ΔsspB PA14_01130-DAS+4 pPSV9-CV::sspB were grown in LB containing 50 μg/mL gentamycin and Tis1 depletion was induced using 500 μM IPTG.
Metabolite extraction from E. coli
E. coli cells (2.5~3.5 OD) were collected on a 0.22-μm hydrophilic PVDF membrane by vacuum filtration and washed briefly with 160 mM NaCl. At the same time, the culture was sampled for OD600 measurements. Cells on the membrane were subsequently immersed in ice-cold lysis solvent, a methanol-acetonitrile-water mixture in a volume ratio of 40:40:20. Lysates were briefly sonicated and, after removal of PVDF membranes, diluted by the lysis solvent for a uniform cell density, typically 1.0 OD600 cells per mL solvent.
Metabolite extraction from P. aeruginosa
P. aeruginosa cells (1.25~1.75 OD) were collected on a 0.45-μm hydrophilic PVDF membrane by vacuum filtration and washed briefly with 160 mM NaCl. At the same time, the culture was sampled for OD600 measurements. Cells on the membrane were subsequently immersed in ice-cold lysis solvent, a methanol-acetonitrile-water mixture in a volume ratio of 40:40:20 containing 0.02% (v/v) Metabolomics Amino Acid Mix Standard solution (Cambridge Isotope Laboratories, MSK-A2–1.2) as the internal standard (ISTD). After brief sonication to detach cells from the PDVF membrane, the membrane was removed, and the suspension was diluted using the lysis solvent to 0.625 OD600 cells per mL solvent.
Nucleotide quantification using anion-exchange chromatography
(p)ppApp was quantified using anion-exchange chromatography: cell suspension in lysis solvent equivalent to 1.0 OD600 cells were diluted with aqueous solution of 10 mM Tris-HCl pH 8.0 until the content of organic solvent less than 20%. Insoluble material was pelleted at 10,000 g, and the supernatant was applied to a Mono Q 5/50 column (GE Healthcare) after passing through a 0.22-μm syringe filter. Bound metabolites were eluted at 4°C using a linear gradient of buffer A (5 mM Tris-HCl pH 8.0) and buffer B (5 mM Tris-HCl pH 8.0, 1M NaCl), with the percentage of buffer B increasing from 0 to 35% over 17.5 mL. External standards containing equimolar of AMP, ADP, ATP, pApp, ppApp and pppApp was analyzed under the same condition to locate their peaks. Nucleotides were quantified according to their peak areas on the 254-nm chromatogram.
MS profiling of P. aeruginosa metabolites
Cell suspension in lysis solvent (0.625 OD/mL) was extracted with 1.5x volumes of water and cell debris removed by centrifugation. 330 μL cleared extract was mixed with 770 μL 50% methanol in acetonitrile (v/v), and the mixture was frozen at −40°C for 1hr. Any insoluble material was spun down at 4°C, 20000 g for 10 min. 1 mL supernatant (0.075 OD) was transferred to a fresh tube and solvent evaporated using a speedvac followed by a lyophilizer. The residual was reconstituted with 37.5μL water, and 4 uL was injected into a ZIC-pHILIC 150 × 2.1 mm (5 μm particle size) column (EMD Millipore). Analysis was conducted on a QExactive benchtop orbitrap mass spectrometer equipped with an Ion Max source and a HESI II probe, which was coupled to a Dionex UltiMate 3000 UPLC system (Thermo Fisher Scientific, San Jose, CA). External mass calibration was performed using the standard calibration mixture every 7 days. Chromatographic separation was achieved using the following conditions: Buffer A was 20 mM ammonium carbonate, 0.1% ammonium hydroxide; buffer B was acetonitrile. The column oven and autosampler tray were held at 25°C and 4°C, respectively. The chromatographic gradient was run at a flow rate of 0.150 ml/min as follows: 0–20 min.: linear gradient from 80% to 20% B; 20–20.5 min.: linear gradient from 20% to 80% B; 20.5–28 min.: hold at 80% B. The mass spectrometer was operated in full-scan, polarity switching mode with the spray voltage set to 3.0 kV, the heated capillary held at 275°C, and the HESI probe held at 350°C. The sheath gas flow was set to 40 units, the auxiliary gas flow was set to 15 units, and the sweep gas flow was set to 1 unit. The MS data acquisition was performed in a range of 70–1000 m/z, with the resolution set at 70,000, the AGC target at 10e6, and the maximum injection time at 20 msec. Relative quantitation of polar metabolites was performed with XCalibur QuanBrowser 2.2 (Thermo Fisher Scientific) using a 5 ppm mass tolerance and referencing an in-house library of chemical standards.
For relative quantifications, a peak area of 1.0×10⁴ was arbitrarily assigned to undetected metabolites. Then, peak area of each metabolite was normalized to the ISTD amino acid with the closest retention time and ionized by the same charge. Fold change of metabolite levels between conditions were then calculated based on normalized peak areas.
For absolute quantifications, standard samples containing AMP, ADP, ATP, GMP, GDP, GTP, pApp, ppApp, pppApp, IMP, UTP, dATP, dGTP, dCTP, dTTP and UDP-GlcNAc at a series of known concentrations were prepared in water containing 0.064% (v/v) ISTD and 4 μL was analyzed under the same conditions. Note that this ISTD concentration was identical to that in metabolome samples. Peak areas of all 16 purine nucleotides were therefore normalized to that of 13C515N-glutamate, and standard curves were generated. Absolute levels of the above nucleotides in unknown samples were then derived through interpolation.
Isothermal titration calorimetry (ITC)
All ITC experiments were performed in a VP-ITC (Malvern) instrument thermo-equilibrated at 25°C with water in the reference cell. Ligand solution is 1 mM (p)ppApp and 1 mM MgCl2 in a buffer containing 20 mM HEPES-Na pH 7.4 and 150 mM NaCl, 2 mM MgCl2 and 1 mM TCEP. Sample cell contains 100 μM PurFEC in the same buffer. ppApp-Mg was injected in 27 injections at 10 nmol/injection. Blank titrations were performed with protein-free gel filtration buffer in the sample cell. The blank-subtracted data were analyzed using the Origin software package (version 5.0, MicroCal, Inc.) and fit using a single-site binding model.
Microscopy
Phase contrast and propidium iodide (PI)-fluorescence images were taken on a Zeiss Observer Z1 microscope using a 100x/1.4 oil immersion objective and an LED-based Colibri illumination system using software Metamorph (Universal Imaging, PA). Cells were first washed with inducer-free medium and concentrated to OD600 = 0.5. 1 μL sample was spotted onto 1.5% agarose LB pads containing 2.5 μg/mL PI and incubated at 30°C. Time-lapse images were taken every 10 minutes over a 6-hour period.
Extended Data
Extended Data Figure 1 |. Homologs of PA14_01140 and Tse6 are enriched in P. aeruginosa PAO1-and PA14-related strains, respectively.
a) Phylogenetic distribution of PA14_01140 (pink) and tse6 (blue) within 326 P. aeruginosa genomes based on whole-genome SNP maximum likelihood analysis. Circles denote individual P. aeruginosa strains. Each clade is labeled according to its representative member. Miniaturized tree depicts true branch distance between each clade. The full tree in Newick format, including bootstrap values, is provided as Supplementary Dataset 1. b) Proteins containing a domain homologous to the C-terminus of PA14_01140 are found in several different species of Proteobacteria. Homologs were identified using the HMMER webserver and candidate T6SS effectors were selected based on the presence of predicted N-terminal domains known to facilitate export by the T6SS. The UniProt accession number for each identified protein is indicated.
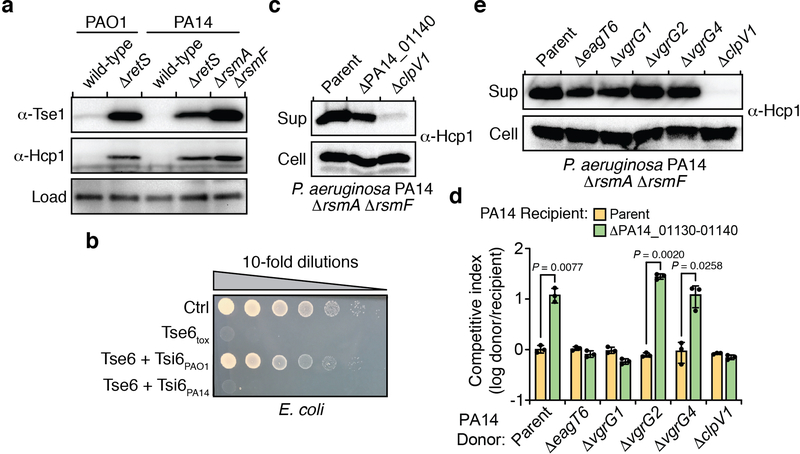
Extended Data Figure 2 |. Characterization of the PA14_01140-PA14_01130-tsi6 gene cluster.
a) Expression levels of the conserved H1-T6SS effector Tse1 and the secreted H1-T6SS subunit Hcp1 are similar between P. aeruginosa PAO1 ΔretS and P. aeruginosa PA14 ΔrsmA ΔrsmF. Western blot analysis of Tse1 and Hcp1 in the indicated P. aeruginosa strains. A non-specific band that reacts with the α-Tse1 antiserum was used as a loading control. b) Tsi6PA14 is not protective against Tse6-mediated intoxication. Viability of E. coli cells grown on solid media harboring inducible plasmids expressing Tse6tox, Tse6tox + Tsi6PAO1, Tse6tox + Tsi6PA14, or an empty vector control. c) Mutational inactivation of PA14_01140 does not abrogate Hcp1 secretion. Western blot analysis of Hcp1 levels in the cell and supernatant (sup) fractions of the indicated P. aeruginosa PA14 strains. d) PA14_01140 delivery into recipient cells requires the H1-T6SS exported protein VgrG1 and the Tse6-specific chaperone EagT6. Intraspecific growth competition assay between indicated PA14 donor and recipient strains. The parental strain genotype is ΔrsmA ΔrsmF. Data are mean ±SD. P values from two-tailed, unpaired t-tests are shown. e) Mutational inactivation of eagT6, vgrG1, vgrG2 and vgrG4 does not abrogate H1-T6SS function. Western blot analysis of Hcp1 levels in the cell and supernatant (sup) fractions of the indicated P. aeruginosa PA14 strains. a-e) Data are representative of three biological replicates.
Extended Data Figure 3 |. PA14_01140tox possesses remote homology to characterized (p)ppGpp synthetases.
ClustalW alignment of PA14_01140tox, the RSH domains of E. coli RelA and Streptococcus equisimilis Rel, and the small alarmone synthetases RelQ and RelP from Bacillus subtilis and Staphylococcus aureus, respectively. Dashed boxes represent regions of high sequence homology. The catalytic glutamic acid is indicated by a red triangle.
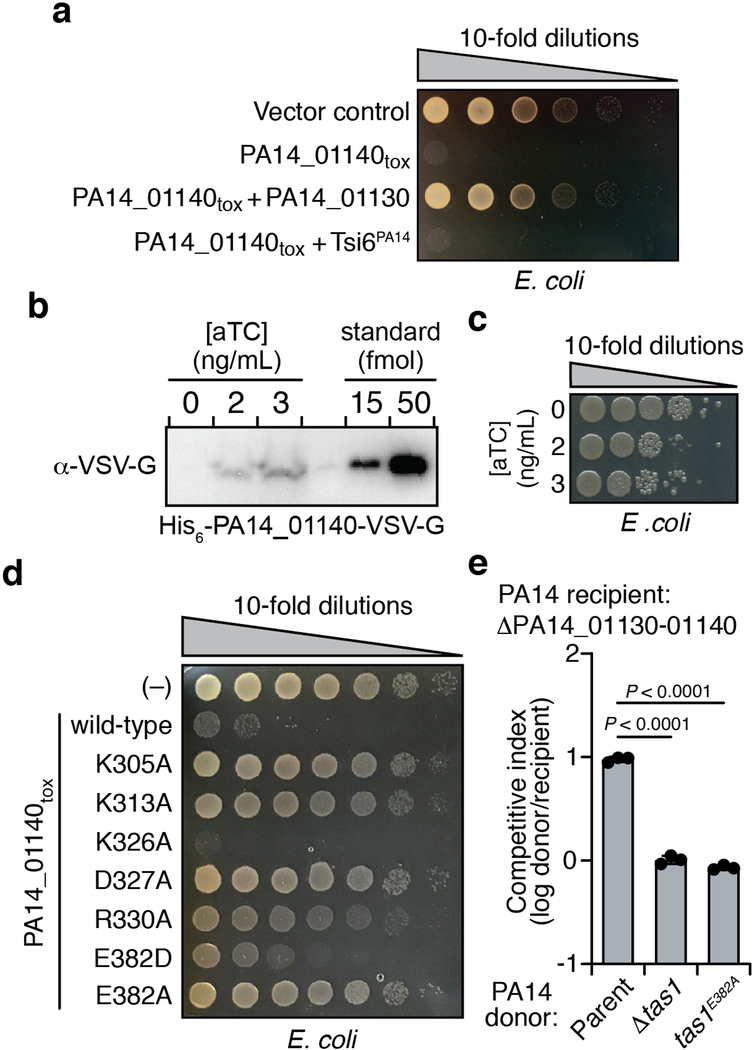
Extended Data Figure 4 |. The C-terminal domain of PA14_01140 (PA14_01140tox) is toxic when expressed in E. coli.
a) PA14_01130 but not Tsi6PA14 inhibits PA14_01140tox mediated toxicity. Viability of E. coli cells grown on solid media harboring inducible plasmids expressing PA14_01140tox, PA14_01140tox + PA14_01130, PA14_01140tox + Tsi6PA14, or an empty vector control. b and c) PA14_01140tox is toxic to E. coli, even when expressed at approximately three copies per cell. Western blot analysis of pull-downs from E. coli expressing His6-PA14_01140tox-VSV-G in the presence of the indicated concentrations anhydrotetracyline (aTC) inducer (b). See “Quantification of Tas1tox overexpression in E. coli” in Methods for details. Viability of E. coli cells expressing His6-PA14_01140tox-VSV-G in the presence of the indicated aTC concentrations for 15 minutes (c). d) Amino acid residues in PA14_01140tox that structurally align with known pyrophosphate donor ATP interacting residues in RelQ are required for PA14_01140tox-mediated toxicity. Viability of E. coli cells grown on solid media harboring inducible plasmids expressing PA14_01140tox, each of the indicated PA14_01140tox point mutants or an empty vector control. Lysine 326 is a residue located within the PA14_01140tox active site that is not predicted to interact with the pyrophosphate donor ATP. e) Glutamate 382 is required for PA14_01140-based intoxication of susceptible recipient cells. Outcome of intraspecific growth competitions between the indicated PA14 donor strains and a ΔPA14_01130–1140 recipient. The parental PA14 strain genotype is ΔrsmA ΔrsmF. The competitive index is normalized to starting ratios of donor/recipient. Data are mean ±SD. P value range from two-tailed, unpaired t-tests is shown. a–e) Data are representative of three biological replicates.
Extended Data Figure 5 |. Interaction with PA14_01130 distorts the predicted nucleotide acceptor site of PA14_01140tox.
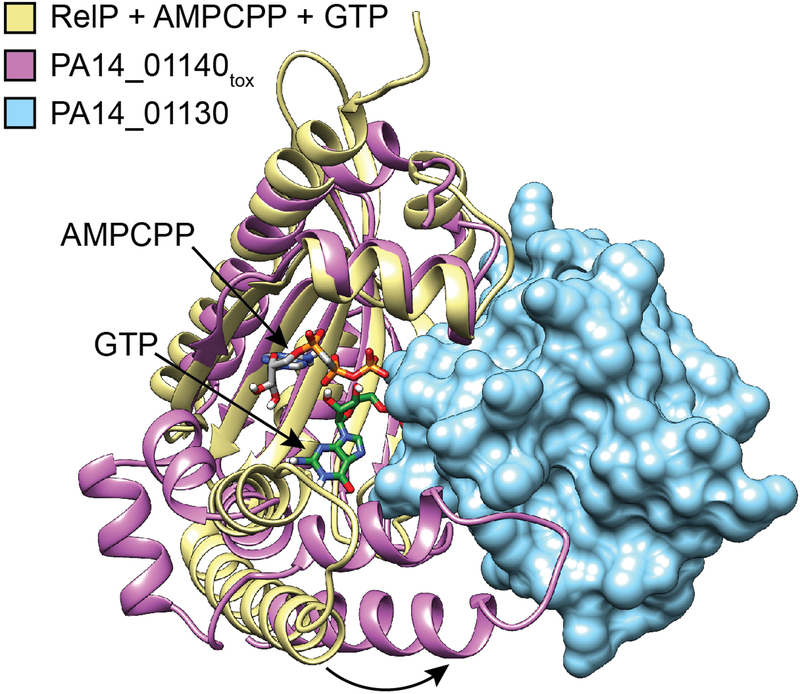
Structural alignment between PA14_01140tox-PA14_01130 complex and the (p)ppGpp synthetase RelP bound to the non-hydrolysable ATP analog AMPCPP and a GTP acceptor nucleotide (PDB code 6EWZ)40. Two C-terminal α-helices of PA14_01140tox that align with the GTP binding site of RelP are rotated approximately 30° as a consequence of their interaction with PA14_01130 (black arrow). Colours corresponding to each protein model are indicated.
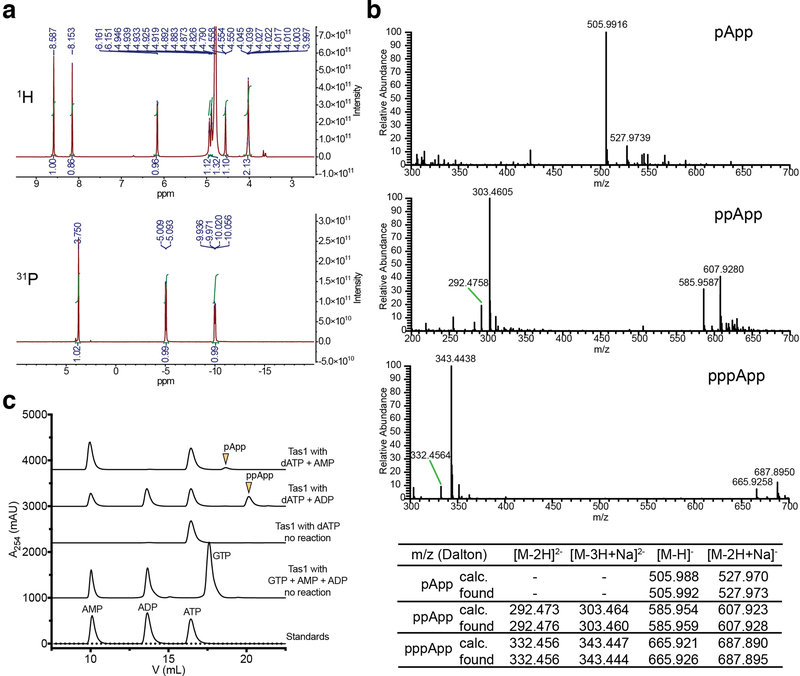
Extended Data Figure 6 |. Tas1 pyrophosphorylates the 3’ hydroxyl group of adenosine nucleotides.
a) 1H (top) and 31P NMR (bottom) spectra of pApp. See Supplementary Table 2 for assignments. b) Negative mode electrospray mass spectra for pApp (top), ppApp (middle) and pppApp (bottom). Assignment of major peaks is shown below the spectra. c) Anion-exchange traces of Tas1tox-catalyzed reactions with dATP or GTP as pyrophosphate donors. Arrowheads indicate 3′ pyrophosphorylation products. a-c) Data are representative of two independent experiments.
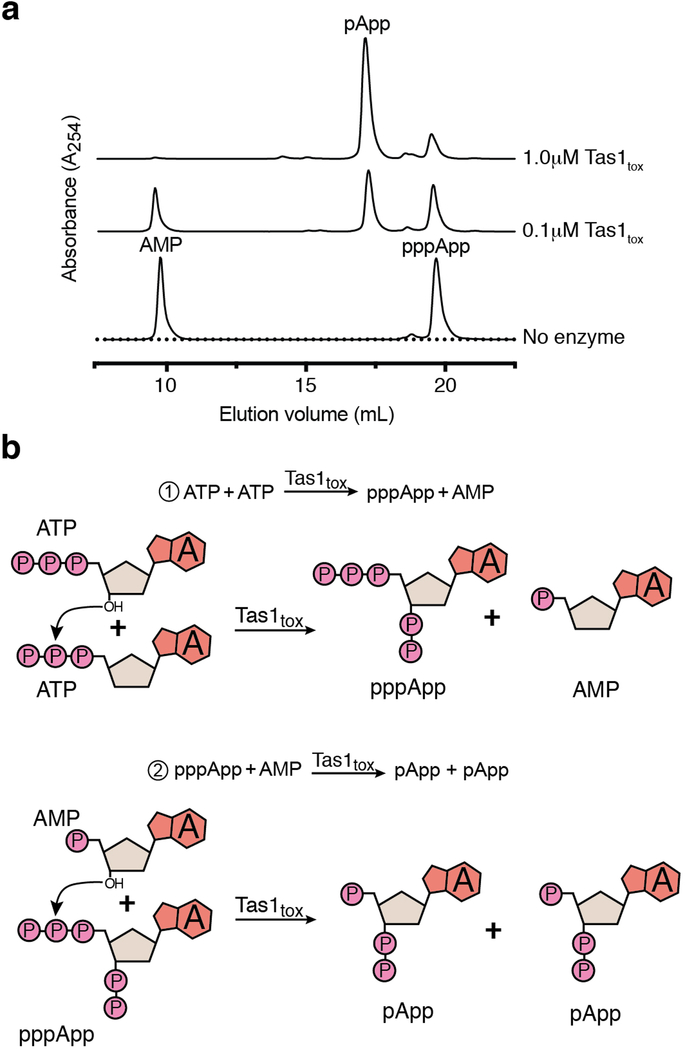
Extended Data Figure 7 |. Purified Tas1tox can use pppApp as a pyrophosphate donor to pyrophosphorylate AMP resulting in pApp formation.
a) Anion-exchange traces of pppApp and AMP after incubation with the indicated concentrations of Tas1tox for 30 min at room temperature. A control lacking Tas1tox is shown for comparison. Chromatogram is representative of two independent experiments. b) Mechanism of quantitative conversion of ATP to pApp. Only heteroatoms that participate in the reaction mechanism of pApp formation are shown.
Extended Data Figure 8 |. Tas1tox overexpression in E. coli leads to (p)(p)pApp accumulation and a reduction in cellular 5′ adenosine nucleotides.
a) Anion exchange-chromatography traces of metabolites extracted from E. coli cells overexpressing Tas1tox (left) or Tas1toxE382A (right) at the indicated time points. A trace generated from a mixture of standards containing an equimolar amount of AMP (1), ADP (2), ATP (3), pApp (4), ppApp (5) and pppApp (6) using the same gradient is shown for comparison. Peaks of adenosine 5′-nucleotides and (p)(p)pApp are indicated by blue and orange arrowheads, respectively. Traces are representative of three biological replicates. b) Quantification of adenosine 5′-nucleotide and (p)(p)pApp levels in the E. coli strains from (a) as a function of time post induction. Data are mean ± SD for metabolites extracted from three separate cultures. Metabolites below the detection limit are indicated with an asterisk.
Extended Data Figure 9 |. The pmf uncoupling ionophore CCCP but not the ppGpp-hydrolase domain of SpoT reduces the toxicity of Tas1tox.
a) Tis1-depleted cells exhibited a reduction in viability over time. CFU plating of P. aeruginosa PA14 ΔretS ΔsspB Tis1-D4 pPSV39::sspB cells at the indicated time points post induction of SspB expression. b) Tas1 reduces the viability of susceptible recipient cells during interbacterial competition. CFU plating of the indicated P. aeruginosa PA14 recipient strains after co-culture with a parental donor strain at the indicated time points. The parental PA14 strain genotype is ΔrsmA ΔrsmF. c) Steady-state growth of E. coli is not substantially affected by the presence of carbonyl cyanide m-chlorophenyl hydrazine (CCCP). Growth curves of E. coli cells harboring the Tas1tox expression plasmid in LB medium with or without (CCCP). Results from three independent cultures were overlaid for each medium condition. d) Tas1tox toxicity is reduced in the presence of CCCP. Viability of E. coli cells following Tas1tox expression in the presence or absence of CCCP. Cells were plated either pre-induction or at the indicated times post-induction. e) Alkaline pH does not affect the ability of CCCP to reduce Tas1tox-dependent toxicity indicating that the toxicity of Tas1tox likely arises from the generation of excessive membrane electrostatic potential. Cultures were untreated or conditioned to pH 8.0 using 25 mM Tris-HCl buffer immediately prior to induction. f) Activity of the ppGpp-hydrolase domain of SpoT against either ppGpp or ppApp. Initial velocities were normalized to hydrolase activity in the absence of either nucleotide. Data are mean ± SD for enzymatic activity from four technical replicates. P value from two-tailed, unpaired t-test is shown. g) Anion-exchange chromatography traces of metabolites extracted from growth competition experiments between the indicated strains conducted on solid media for 4 hours. The parental strain is ΔrsmA ΔrsmF. Traces are representative of three biological replicates. a-b, d-e) Representative plates of three biological replicates are shown.
Extended Data Figure 10 |. (p)ppApp binds to and inhibits PurF in a similar manner to ppGpp.
a) Isothermal calorimetry traces (top) and fitted isotherms (bottom) for the titration of 100 μM PurFEC with 1 mM pppApp. Traces are representative of three independent replicates. b) Changes to the activity of PurFPA in the presence of indicated concentrations of ppGpp or (p)ppApp. Data are mean ±SD for three reactions. c) 2Fo-Fc difference electron density maps of ppApp (left) and ppGpp (right, PDB code 6CZF) contoured at 0.4σ are shown in blue. Nucleotides are shown as stick models of two overlapping ppApp-Mg2+ (coloured by heteroatom or light blue) or ppGpp-Mg2+ (coloured by heteroatom or yellow), related by a two-fold rotational axis. d) Comparison of ppGpp and ppApp binding configuration within PurFEC. The nucleotide-Mg2+ complexes are modeled at 0.5 occupancy because they lie on a crystallographic two-fold rotational axis as shown in (c). Relevant hydrogen bonding interactions and their distance in angstroms between PurFEC residues and the purine rings of ppApp (left) or ppGpp (right) are shown with red dashed line.
Supplementary Material
Acknowledgements
We thank Amos Raphenya and Brian Alcock for assistance with sequence data curation and analyses, Changsoo Chang for assistance with X-ray data collection and processing and the Whitehead Institute Metabolite Profiling Core Facility for measuring metabolite levels. S.A and B.W. were supported by an Ontario Graduate Scholarship and a fellowship from the Jane Coffin Childs Memorial Fund, respectively. A.G.M. holds a Cisco Research Chair in Bioinformatics and M.T.L is an Investigator of the Howard Hughes Medical Institute. Results shown in this report are derived from work performed by the Structural Biology Center (SBC) and the Northeastern Collaborative Access Team (NECAT) at the Advanced Photon Source, Argonne National Laboratory. SBC is funded by NIAID (HHSN272201200026C) and HHS (HHSN272201700060C) and NECAT is funded by NIH grants P30 GM124165 and S10OD021527. SBC-CAT and NECAT are operated by UChicago Argonne, LLC, for the U.S. DOE under contract number DE-AC02–06CH11357. This work was supported by grants from the Canadian Foundation for Innovation (34531 to A.G.M.), NIH (R01-GM082899 to M.T.L.), CIHR (PJT-156129 to J.C.W.) and seed funding from the David Braley Centre for Antibiotic Discovery (to J.C.W.).
Footnotes
The authors declare no competing financial interests.
Data Availability
All data supporting the findings of this study are available within the manuscript and associated Supplementary Information. X-ray crystallographic coordinates and structure factor files are available from the PDB: Tas1tox-Tis1 (6OX6) and PurFEC-ppApp (6OTT). Maximum likelihood estimates of P. aeruginosa strain relationships used for tree construction are provided in Newick format in Supplementary Dataset 1. Relative concentrations of metabolites from metabolomics are reported in Supplementary Dataset 2. Source gel images are available in Supplementary Figure 1.
References
- 1.Granato ET, Meiller-Legrand TA & Foster KR The Evolution and Ecology of Bacterial Warfare. Current biology : CB 29, R521–R537, doi: 10.1016/j.cub.2019.04.024 (2019). [DOI] [PubMed] [Google Scholar]
- 2.Russell AB, Peterson SB & Mougous JD Type VI secretion system effectors: poisons with a purpose. Nature reviews. Microbiology 12, 137–148, doi: 10.1038/nrmicro3185 (2014). [DOI] [PMC free article] [PubMed] [Google Scholar]
- 3.Hauryliuk V, Atkinson GC, Murakami KS, Tenson T. & Gerdes K. Recent functional insights into the role of (p)ppGpp in bacterial physiology. Nature reviews. Microbiology 13, 298–309, doi: 10.1038/nrmicro3448 (2015). [DOI] [PMC free article] [PubMed] [Google Scholar]
- 4.Wexler AG et al. Human symbionts inject and neutralize antibacterial toxins to persist in the gut. Proceedings of the National Academy of Sciences of the United States of America 113, 3639–3644, doi: 10.1073/pnas.1525637113 (2016). [DOI] [PMC free article] [PubMed] [Google Scholar]
- 5.Whitney JC et al. Genetically distinct pathways guide effector export through the type VI secretion system. Molecular microbiology 92, 529–542, doi: 10.1111/mmi.12571 (2014). [DOI] [PMC free article] [PubMed] [Google Scholar]
- 6.Whitney JC et al. An interbacterial NAD(P)(+) glycohydrolase toxin requires elongation factor Tu for delivery to target cells. Cell 163, 607–619, doi: 10.1016/j.cell.2015.09.027 (2015). [DOI] [PMC free article] [PubMed] [Google Scholar]
- 7.Quentin D. et al. Mechanism of loading and translocation of type VI secretion system effector Tse6. Nat Microbiol 3, 1142–1152, doi: 10.1038/s41564-018-0238-z (2018). [DOI] [PMC free article] [PubMed] [Google Scholar]
- 8.Johnson LS, Eddy SR & Portugaly E. Hidden Markov model speed heuristic and iterative HMM search procedure. BMC bioinformatics 11, 431, doi: 10.1186/1471-2105-11-431 (2010). [DOI] [PMC free article] [PubMed] [Google Scholar]
- 9.Atkinson GC, Tenson T. & Hauryliuk V. The RelA/SpoT homolog (RSH) superfamily: distribution and functional evolution of ppGpp synthetases and hydrolases across the tree of life. PloS one 6, e23479, doi: 10.1371/journal.pone.0023479 (2011). [DOI] [PMC free article] [PubMed] [Google Scholar]
- 10.Potrykus K, Murphy H, Philippe N. & Cashel M. ppGpp is the major source of growth rate control in E. coli. Environmental microbiology 13, 563–575, doi: 10.1111/j.1462-2920.2010.02357.x (2011). [DOI] [PMC free article] [PubMed] [Google Scholar]
- 11.Wang B. et al. Affinity-based capture and identification of protein effectors of the growth regulator ppGpp. Nature chemical biology 15, 141–150, doi: 10.1038/s41589-018-0183-4 (2019). [DOI] [PMC free article] [PubMed] [Google Scholar]
- 12.Gaca AO et al. From (p)ppGpp to (pp)pGpp: Characterization of Regulatory Effects of pGpp Synthesized by the Small Alarmone Synthetase of Enterococcus faecalis. Journal of bacteriology 197, 2908–2919, doi: 10.1128/JB.00324-15 (2015). [DOI] [PMC free article] [PubMed] [Google Scholar]
- 13.Beljantseva J. et al. Negative allosteric regulation of Enterococcus faecalis small alarmone synthetase RelQ by single-stranded RNA. Proceedings of the National Academy of Sciences of the United States of America 114, 3726–3731, doi: 10.1073/pnas.1617868114 (2017). [DOI] [PMC free article] [PubMed] [Google Scholar]
- 14.Sarubbi E. et al. Characterization of the spoT gene of Escherichia coli. The Journal of biological chemistry 264, 15074–15082 (1989). [PubMed] [Google Scholar]
- 15.Bugg TD, Braddick D, Dowson CG & Roper DI Bacterial cell wall assembly: still an attractive antibacterial target. Trends in biotechnology 29, 167–173, doi: 10.1016/j.tibtech.2010.12.006 (2011). [DOI] [PubMed] [Google Scholar]
- 16.Raetz CR Enzymology, genetics, and regulation of membrane phospholipid synthesis in Escherichia coli. Microbiological reviews 42, 614–659 (1978). [DOI] [PMC free article] [PubMed] [Google Scholar]
- 17.LaCourse KD et al. Conditional toxicity and synergy drive diversity among antibacterial effectors. Nat Microbiol 3, 440–446, doi: 10.1038/s41564-018-0113-y (2018). [DOI] [PMC free article] [PubMed] [Google Scholar]
- 18.Rhaese HJ & Groscurth R. Control of development: role of regulatory nucleotides synthesized by membranes of Bacillus subtilis in initiation of sporulation. Proceedings of the National Academy of Sciences of the United States of America 73, 331–335 (1976). [DOI] [PMC free article] [PubMed] [Google Scholar]
- 19.Rhaese HJ, Hoch JA & Groscurth R. Studies on the control of development: isolation of Bacillus subtilis mutants blocked early in sporulation and defective in synthesis of highly phosphorylated nucleotides. Proceedings of the National Academy of Sciences of the United States of America 74, 1125–1129 (1977). [DOI] [PMC free article] [PubMed] [Google Scholar]
- 20.Goodman AL et al. A signaling network reciprocally regulates genes associated with acute infection and chronic persistence in Pseudomonas aeruginosa. Developmental cell 7, 745–754, doi: 10.1016/j.devcel.2004.08.020 (2004). [DOI] [PubMed] [Google Scholar]
- 21.Marden JN et al. An unusual CsrA family member operates in series with RsmA to amplify posttranscriptional responses in Pseudomonas aeruginosa. Proceedings of the National Academy of Sciences of the United States of America 110, 15055–15060, doi: 10.1073/pnas.1307217110 (2013). [DOI] [PMC free article] [PubMed] [Google Scholar]
- 22.Steinchen W. et al. Catalytic mechanism and allosteric regulation of an oligomeric (p)ppGpp synthetase by an alarmone. Proceedings of the National Academy of Sciences of the United States of America 112, 13348–13353, doi: 10.1073/pnas.1505271112 (2015). [DOI] [PMC free article] [PubMed] [Google Scholar]
- 23.McGinness KE, Baker TA & Sauer RT Engineering controllable protein degradation. Molecular cell 22, 701–707, doi: 10.1016/j.molcel.2006.04.027 (2006). [DOI] [PubMed] [Google Scholar]
- 24.Stover CK et al. Complete genome sequence of Pseudomonas aeruginosa PAO1, an opportunistic pathogen. Nature 406, 959–964, doi: 10.1038/35023079 (2000). [DOI] [PubMed] [Google Scholar]
- 25.Lee DG et al. Genomic analysis reveals that Pseudomonas aeruginosa virulence is combinatorial. Genome biology 7, R90, doi: 10.1186/gb-2006-7-10-r90 (2006). [DOI] [PMC free article] [PubMed] [Google Scholar]
- 26.Rietsch A, Vallet-Gely I, Dove SL & Mekalanos JJ ExsE, a secreted regulator of type III secretion genes in Pseudomonas aeruginosa. Proceedings of the National Academy of Sciences of the United States of America 102, 8006–8011, doi: 10.1073/pnas.0503005102 (2005). [DOI] [PMC free article] [PubMed] [Google Scholar]
- 27.Hmelo LR et al. Precision-engineering the Pseudomonas aeruginosa genome with two-step allelic exchange. Nature protocols 10, 1820–1841, doi: 10.1038/nprot.2015.115 (2015). [DOI] [PMC free article] [PubMed] [Google Scholar]
- 28.Winsor GL et al. Enhanced annotations and features for comparing thousands of Pseudomonas genomes in the Pseudomonas genome database. Nucleic acids research 44, D646–653, doi: 10.1093/nar/gkv1227 (2016). [DOI] [PMC free article] [PubMed] [Google Scholar]
- 29.Hyatt D. et al. Prodigal: prokaryotic gene recognition and translation initiation site identification. BMC bioinformatics 11, 119, doi: 10.1186/1471-2105-11-119 (2010). [DOI] [PMC free article] [PubMed] [Google Scholar]
- 30.Camacho C. et al. BLAST+: architecture and applications. BMC bioinformatics 10, 421, doi: 10.1186/1471-2105-10-421 (2009). [DOI] [PMC free article] [PubMed] [Google Scholar]
- 31.Treangen TJ, Ondov BD, Koren S. & Phillippy AM The Harvest suite for rapid core-genome alignment and visualization of thousands of intraspecific microbial genomes. Genome biology 15, 524, doi: 10.1186/s13059-014-0524-x (2014). [DOI] [PMC free article] [PubMed] [Google Scholar]
- 32.Stamatakis A. RAxML version 8: a tool for phylogenetic analysis and post-analysis of large phylogenies. Bioinformatics 30, 1312–1313, doi: 10.1093/bioinformatics/btu033 (2014). [DOI] [PMC free article] [PubMed] [Google Scholar]
- 33.Hood RD et al. A type VI secretion system of Pseudomonas aeruginosa targets a toxin to bacteria. Cell Host Microbe 7, 25–37 (2010). [DOI] [PMC free article] [PubMed] [Google Scholar]
- 34.Stevens AJ et al. Design of a Split Intein with Exceptional Protein Splicing Activity. Journal of the American Chemical Society 138, 2162–2165, doi: 10.1021/jacs.5b13528 (2016). [DOI] [PMC free article] [PubMed] [Google Scholar]
- 35.Minor W, Cymborowski M, Otwinowski Z. & Chruszcz M. HKL-3000: the integration of data reduction and structure solution--from diffraction images to an initial model in minutes. Acta crystallographica. Section D, Biological crystallography 62, 859–866, doi: 10.1107/S0907444906019949 (2006). [DOI] [PubMed] [Google Scholar]
- 36.Adams PD et al. PHENIX: a comprehensive Python-based system for macromolecular structure solution. Acta crystallographica. Section D, Biological crystallography 66, 213–221, doi: 10.1107/S0907444909052925 (2010). [DOI] [PMC free article] [PubMed] [Google Scholar]
- 37.Emsley P, Lohkamp B, Scott WG & Cowtan K. Features and development of Coot. Acta crystallographica. Section D, Biological crystallography 66, 486–501, doi: 10.1107/S0907444910007493 (2010). [DOI] [PMC free article] [PubMed] [Google Scholar]
- 38.Kabsch W.Xds. Acta crystallographica. Section D, Biological crystallography 66, 125–132, doi: 10.1107/S0907444909047337 (2010). [DOI] [PMC free article] [PubMed] [Google Scholar]
- 39.Bunkoczi G. et al. Phaser.MRage: automated molecular replacement. Acta crystallographica. Section D, Biological crystallography 69, 2276–2286, doi: 10.1107/S0907444913022750 (2013). [DOI] [PMC free article] [PubMed] [Google Scholar]
- 40.Manav MC et al. Structural basis for (p)ppGpp synthesis by the Staphylococcus aureus small alarmone synthetase RelP. The Journal of biological chemistry 293, 3254–3264, doi: 10.1074/jbc.RA117.001374 (2018). [DOI] [PMC free article] [PubMed] [Google Scholar]
Associated Data
This section collects any data citations, data availability statements, or supplementary materials included in this article.


