

SUMMARY
Analyses of HIV-1 envelope (Env) binding to CD4, and the conformational changes the interactions induce, inform the molecular mechanisms and factors governing HIV-1 infection. To address these questions, we used a single-molecule detection (SMD) approach to study the nature of reactions between soluble CD4 (sCD4) and soluble HIV-1 trimers. SMD of these reactions distinguished a mixture of one, two, or three CD4-bound trimer species. Single-ligand trimers were favored at early reaction times and ligand-saturated trimers later. Furthermore, some trimers occupied by one sCD4 molecule did not bind additional ligands, whereas the majority of two ligand-bound species rapidly transitioned to the saturated state. Quantification of liganded trimers observed in reactions with various sCD4 concentrations reflected an overall negative cooperativity in ligand binding. Collectively, our results highlight the general utility of SMD in studying protein interactions and provide critical insights on the nature of sCD4-HIV-1 Env interactions.
Graphical Abstract
In Brief
Agrawal et al. use single-molecule fluorescence approaches to evaluate the interactions between sCD4 and soluble near-native trimer. Their findings highlight the general utility of single-molecule detection in studying protein interactions and provide critical insights into sCD4-Env interaction for better understanding the complex biology of HIV-1 entry into cells.
INTRODUCTION
HIV-1 infection of CD4+ T cells requires viral entry that is mediated via envelope (Env) trimers on the virion surface and CD4 receptor on the cell surface, with subsequent binding to the co-receptors CCR5 and/or CXCR4. These binding events mediated by gp120 on the Env trimer trigger the exposure of the gp41 fusion peptide, which leads to fusion of the viral membranes, permitting HIV-1 entry (Blumenthal et al., 2012; Brandenberg et al., 2015; Klasse, 2012; Kwong et al., 1998). Although it is widely held that on the mature virion, the Env assumes a closed conformation, thermodynamic measurements and biological evidence strongly suggest that the trimer undergoes considerable dynamic fluctuations and assumes a variety of conformational sub-states under native conditions (Duenas-Decamp et al., 2016; Pancera et al., 2014, 2017; Stadtmueller et al., 2018). It is not fully understood if such sampling is fully stochastic or follows a specific folding pathway. Additionally, these conditions seem to be significantly altered by CD4 binding to the gp120 component of the trimer (Kwong et al., 1998; Wang et al., 2016; White et al., 2011). The trimer harbors three CD4 receptor binding sites (one on each protomer), but the stoichiometry of this binding (i.e., number of interactions between Env and CD4 molecules) leading to HIV-1 entry is still not clear (Chojnacki et al., 2012; Kuhmann et al., 2000; Liu et al., 2008; Sougrat et al., 2007; Zhu et al., 2003, 2006). Accordingly, intensive efforts have been geared toward understanding the structural, functional, and antigenic characteristics of HIV-1 trimer and CD4 receptor interactions.
In this study, we investigated whether Env exhibited quantal changes in stoichiometry during progressive binding to soluble CD4 (sCD4). Because ligand binding is a stepwise process, each sCD4 molecule binding should exhibit signature kinetics. Moreover, this binding event could potentially influence the binding characteristics of subsequent ligands with negative or positive cooperativity. To address these questions, we used the soluble SOSIP.664 trimers that are based on the BG505 isolate (Julien et al., 2013; Lyumkis et al., 2013; Sanders et al., 2013). SOSIP.664 and its D7 epitope-tagged derivative, SOSIP. 664.D7, have been structurally characterized, are thermostable, and are non-aggregating in solution (Julien et al., 2013; Lyumkis et al., 2013; Sanders et al., 2013) and are therefore well-suited for single-molecule detection studies. Importantly, SOSIP trimers resemble native-like viral spikes by mimicking most of their antigenic and structural properties and are accepted models for the Env trimer in vaccine and structural studies (Derking et al., 2015; Dey et al., 2018; He et al., 2016; Julien et al., 2013; Lyumkis et al., 2013; Nogal et al., 2017; Pancera et al., 2014; Ringe et al., 2017; Sanders et al., 2015; Wang et al., 2017; Yasmeen et al., 2014).
We used single-molecule fluorescence approaches (Michalet et al., 2006; Moerner, 2007; Ray et al., 2014, 2015; Rigler and Elson, 2001; Ulbrich and Isacoff, 2007; Xie and Dunn, 1994) to evaluate the binding stoichiometry of labeled sCD4 fusion protein (sCD4-SNAP-A488; see STAR Methods) to SOSIP.664.D7. sCD4-SNAP-A488 places a single AlexaDye-488 reporter on the C terminus of sCD4-SNAP fusion protein. Compared with traditional ensemble methods, single-molecule detection (SMD) enables us to observe intermediate, pre-equilibrium states, and minor sub-populations of molecules, providing important insights into binding mechanisms and possibly revealing previously unknown interactions (Dobrowsky et al., 2008; Mason et al., 2004; Michalet et al., 2006; Ray et al., 2015; Roy et al., 2008; Xie and Dunn, 1994). Furthermore, the single-molecule photobleaching approach implemented here displays a stepwise intensity drop for individual fluorophores, and thus direct counting of reporter probes is achieved by recording the total number of steps in the intensity time trace (Tsekouras et al., 2016; Ulbrich and Isacoff, 2007). Consequently, stoichiometry can be determined as a function of the number of descending steps resulting from the photobleaching of individual fluorophores. Our approach also includes real-time, single-molecule association kinetic experiments, to capture the different states of trimer triggering. We have developed an algorithm for automated analyses of our data to infer the stoichiometry in real time. In addition, the single-molecule analyses from hundreds of individual complexes provide an opportunity to determine the distributions of binding stoichiometry under different reaction conditions along with the quantitative information regarding the assembly of the complex. These features are difficult to achieve with any of the known ensemble methods. Overall, the results presented here provide a useful link to understand the role of CD4 receptor binding to the HIV-1 Env and may help in the design of next-generation immunogens as candidate vaccines.
RESULTS
To perform single-molecule fluorescence experiments, it was necessary to generate a four-domain (D1–D4) sCD4 ligand labeled with a single fluorophore. This was achieved by engineering a sCD4 fusion protein that introduced a C-terminal SNAP tag (sCD4-SNAP), to which single Alexa 488 fluorophore could be covalently coupled (sCD4-SNAP-A488; see STAR Methods). This strategy placed the fluorophore distal to the gp120 binding site, thus minimizing any influence on the HIV-1 receptor function. Efficient expression of the sCD4-SNAP from transfected 293FS cells was determined by western blot, using OKT4, anti-CD4, and anti-SNAP antibodies (data not shown). A Sepharose column conjugated with anti-CD4 antibody was used to purify the sCD4-SNAP fusion protein. Western blot using anti-CD4 antibody (Figure 1A) and Coomassie gel staining (Figure 1B) confirmed that the expressed fusion protein exhibited the expected molecular weight (MW ~ 60 kD) of D1–D4 sCD4, with no additional species present.
Figure 1. Functional Characterization of the hu-sCD4-SNAP-tag Fusion Protein.

(A) Western blot showing the expression of SNAP-tagged sCD4 (sCD4-SNAP) in the supernatant from the 293FS-transfected cells. Bands corresponding to sCD4-SNAP fusion protein and untagged sCD4 were detected using anti-huCD4 antibody. L, molecular weight ladder; W, wash; E, elute; FT, flow through; H, harvest; sCD4, positive control at 75 and 150 ng concentration.
(B) SDS-PAGE with Coomassie staining showing successful purification of sCD4-SNAP from transfected 293FS cells using CNBr-activated Sepharose conjugated with an anti-CD4 antibody. Samples are as described in (A).
(C) FCS autocorrelation plots for sCD4-SNAP-A488 alone and in complex with monomeric gp120, SOSIP.664 (BG505), and SOSIP.664.D7 (BG505.D7) trimers are shown.
(D) FCS binding of Alexa 647 labeled mAbs b12 and 17b to HIV-1BaL virions with or without 100 μg/mL sCD4-SNAP.
Data are presented as the mean of three experiments ± SEM. ***Average percentage binding is significantly (p < 0.001) different.
To examine if the biological activity of sCD4-SNAP fusion protein was intact, we performed fluorescence correlation spectroscopy (FCS) measurements, observing binding of sCD4-SNAP-A488 (MW ~ 60 kD) to unlabeled gp120 monomer (MW ~ 120 kD), SOSIP.664 trimers (BG505 and BG505.D7; MW ~ 400 kD), and HIV-1BaL virions (~100 nm diameter). The principle of FCS states that the fluorescently labeled molecule acquires a slower diffusion coefficient when bound to a larger target, where the fraction of species diffusing more slowly can reflect binding efficiency. As diffusion coefficients are proportional to the size of the molecules observed, FCS can be used to validate ligand-target binding (Ray et al., 2014; Rigler and Elson, 2001). Accordingly, when sCD4-SNAP-A488 forms complexes with several-fold higher MW targets, it will diffuse significantly slower compared with free sCD4-SNAP-A488 molecule. Indeed, we observed slower diffusion when sCD4-SNAP-A488 was in complex as compared with unbound sCD4-SNAP-A488 (Figure 1C). The autocorrelation curve of sCD4-SNAP-A488 could be fitted with a three-dimensional (3D) diffusion model for a single species with a translational diffusion coefficient of D = 85 μm2/s (Rigler and Elson, 2001). Addition of unlabeled species (monomer, trimer, or virion particle), however, resulted in a longer correlation time, which informs about the sCD4-SNAP-A488 binding and the fraction of bound species. For instance, a substantial fraction (>90%) of sCD4-SNAP-A488 bound monomeric gp120, where the diffusion coefficient of the gp120-sCD4-SNAP-A488 complex was ~45 μm2/s (Figure 1C). SOSIP.664 trimer-sCD4-SNAP-A488 complexes exhibited a diffusion coefficient of ~20 μm2/s, and the percentage of binding was comparable between BG505 and BG505.D7 strains (Figure 1C). Overall, the autocorrelation plots showed the expected binding pattern with an increased diffusion coefficient for sCD4-SNAP-A488 complexes, suggesting intact function of our fusion protein (Figure 1C).
To further confirm that the sCD4-SNAP fusion protein established bona fide interactions with the gp120 CD4 binding site (CD4bs) on a virion particle, FCS was performed with HIV-1BaL virions in the presence of labeled mAb b12 (neutralizing monoclonal antibody against CD4bs) or labeled mAb 17b (non-neutralizing mAb against a CD4-induced epitope in the co-receptor binding site), with or without unlabeled sCD4-SNAP. mAb-virus binding was reflected in the amount of fluorophore acquiring the “slower” diffusion coefficient of ~8 μm2/s. As expected, sCD4-SNAP competitively reduced the amount of b12-A647 that bound to HIV-1BaL virions (Figure 1D). Conversely, mAb 17b-A647 binding to HIV-1BaL virions became more pronounced in the presence of sCD4-SNAP (Figure 1D), consistent with CD4-induced exposure of the 17b epitope. These degrees of b12 inhibition and 17b enhancement closely followed what is seen with native D1–D4 sCD4 binding (Figure S1A). In accordance, native sCD4 and sCD4-SNAP showed comparable neutralization potencies (Figure S1B) against HIV-1BaL and HIV-1JRFL pseudoviruses in standard TZM-bl neutralization assays (Li et al., 2006). Thus, SNAP fusion did not appear to compromise sCD4 function relative to HIV-1 infection.
Next, we used SMD approaches to examine if Env exhibits quantal changes in stoichiometry with progressive binding of one, two, or three molecules of sCD4-SNAP-A488. The photon count rate during single-molecule fluorescence measurements can fluctuate between different intensity levels. The origin of these fluctuations could be due to blinking of the probes, association or dissociation of sCD4 to gp120 monomer or SOSIP.664 trimer, conformational changes upon sCD4 binding to gp120 monomer or SOSIP.664 trimer, or positive or negative cooperativity.
As a benchmark analysis, we first performed SMD studies with gp120 monomer, which contains only one binding site for sCD4. We recorded the intensity-time traces from gp120-sCD4-SNAP-A488 complexes to test if the 1:1 stoichiometry of binding can be unambiguously determined. gp120 monomer was immobilized to a glass coverslip using a purified polyclonal sheep antibody raised against a peptide derived from the C-terminal (15 amino acids) of gp120, D7324 (Sanders et al., 2013). Following adsorption to the matrix, gp120 monomer was allowed to interact with sCD4-SNAP-A488 (see STAR Methods; Figure 2A). Figure 2B shows a representative single-molecule image of sCD4-SNAP-A488 bound to unlabeled gp120 monomers upon excitation with an incident laser at 470 nm on the sample. The well-separated bright spots in the image represent emission from individual sCD4-SNAP-A488-gp120 complexes. We expected that a single sCD4-SNAP-A488 molecule should bind to each gp120 monomer, giving rise to a single-step photobleaching event (Figure 2A). Indeed, intensity-time trajectories of the gp120-sCD4-SNAP-A488 complexes showed a single-step photobleaching event (Figure 2C), suggesting the presence of only one sCD4-SNAP-A488 molecule in complex with the monomer. Analysis of intensity-time traces from about 100 gp120-sCD4-SNAP-A488 individual complexes revealed that the majority (90%) of the tested population showed only one-step photobleaching, indicating that sCD4-SNAP-A488 binds gp120 in the expected, biologically relevant manner. These observations further validated that sCD4-SNAP-A488 is functionally intact. The sCD4-SNAP-A488 molecules bound to the gp120 displayed fluorescence lifetimes of ~4 ns, which is characteristic of the Alexa 488 dye. For further validation of authentic receptor-ligand binding versus nonspecific protein-protein interactions, we performed experiments with HIV-1BaL-gp120 monomers encoding a D368R mutation that abrogates CD4 binding (Sajadi et al., 2018). The antigen was immobilized on glass coverslips as before and probed with either sCD4-SNAP-A488 or a fluorescently labeled mAb 2G12, directed against a carbohydrate cluster on gp120 (Calarese et al., 2005). The binding of mAb 2G12 is not affected by the D368R mutation. As expected, sCD4-SNAP-A488 did not produce a binding signal with the mutant gp120 (Figure S2A), whereas mAb 2G12-A488 bound well to the mutant gp120 (Figure S2B). These observations supported the use of SMD approaches for analyzing the nature of gp120-CD4 interactions in greater detail.
Figure 2. Single-Molecule Detection Shows Single-Step Photobleaching for sCD4-SNAP-A488-gp120 Monomer Complexes.

(A) Schematic representation of sCD4-SNAP-A488-gp120 monomer complex using surface immobilization strategy for single-molecule fluorescence studies. Possible scenario of one sCD4-SNAP-A488 molecule binding to gp120 monomer is shown.
(B) Scanning confocal image (10 × 10 μm2) of sCD4-SNAP-A488 molecules (100 ng/mL) bound to gp120 monomers (200 ng/mL) immobilized on a glass coverslip.
(C) Representative intensity-time trace from individual sCD4-SNAP-A488 molecule bound to gp120 monomer.
We next investigated the stoichiometry of sCD4-SNAP-A488 binding to the D7 epitope-tagged derivative of SOSIP.664 trimer, SOSIP.664.D7. This SOSIP variant allows the homogeneous capture of the trimers via their C termini, thus orienting CD4bss away from the substrate. Because there are three CD4bss on the Env, we expected to see up to three photobleaching levels, corresponding to one, two, or three molecules of sCD4-SNAP-A488 binding to SOSIP.664.D7 trimer (Figure 3A). In this case, any unliganded trimers would not be visible in the system. Figure 3B shows 10 × 10 μm2 fluorescence image of sCD4-SNAP-A488 (at 100 ng/mL) bound to the immobilized SOSIP.664.D7 trimer. We recorded intensity-time traces from individual complexes and visually assessed the stoichiometry of sCD4-SNAP-A488 binding to the trimer. Interestingly, we observed up to three photobleaching steps for individual complexes, suggesting that up to three sCD4-SNAP-A488 molecules bind to a single SOSIP.664.D7 trimer molecule (Figure 3C). In addition to the distinct photobleaching steps, the observation of gradual fluctuations of fluorescence signals during photobleaching process may reflect conformational changes in the protein as well as from other factors such as reorientation and spectral shift of fluorophores (Goudsmits et al., 2017; Ha et al., 1999; Li et al., 2011; Rhoades et al., 2003). Importantly, the signal in the complexes from intensity decays were further confirmed to be the characteristic ~4 ns fluorescence lifetime of the probe Alexa 488. Statistical analysis from n = 105 SOSIP.664.D7-sCD4-SNAP-A488 individual complexes suggested that the majority of the population (74%) bound three sCD4-SNAP-A488 molecules under these assay conditions (Figure 3D). Notably, reactions run with a broadly neutralizing antibody against the CD4bs, N49P7 (Sajadi et al., 2018), bound to SNAP and labeled with Alexa 488 also exhibited three photobleaching events (Figure S3).
Figure 3. Single-Molecule Imaging Illustrates the Stoichiometric Dynamics of HIV-1 Env.

(A) Schematic representation of SOSIP.664.D7 gp120 trimer in complex with sCD4-SNAP-A488 using surface immobilization strategy for single-molecule fluorescence studies. Possible scenarios of one, two, and three sCD4-SNAP-A488 molecules photobleaching from trimer are shown.
(B) Scanning confocal image (10 × 10 μm2) of sCD4-SNAP-A488 molecules (100 ng/mL) bound to SOSIP.664.D7 trimers (700 ng/mL) immobilized on a glass coverslip.
(C) Representative intensity-time trace from individual sCD4-SNAP-A488 molecules bound to SOSIP.664.D7 gp120 trimer.
(D) Pie chart demonstrating occupancy distribution of stoichiometry for n = 105 single complexes of sCD4-SNAP-A488-SOSIP.664.D7 is shown.
To further interpret the findings, we constructed histograms using data from n = 105 of these individual binding events, which could be used to elucidate the distributions of photobleaching steps according to intensity (Figure S4A) and duration (Figure S4B). As expected, the total intensity of the second and third photobleaching steps was considerably lower than the total intensity of the first step (corresponding to three sCD4-SNAP-A488 bound state), and the distribution of these sub-populations followed a Gaussian trend (Figure S4A). In addition, the ratio of the average of total intensity for the three steps followed the estimated 3:2:1 ratio (i.e., the total intensity of the first step was 3 times the total intensity of the third step that corresponds to a single sCD4-SNAP-A488 molecule bound state). Consistent with the single-molecule photobleaching studies, the duration of the first, second, and third steps increased considerably, with the third step lasting much longer compared with the first two (Figure S4B).
The stoichiometry of the sCD4-SNAP-A488-SOSIP.664.D7 interactions was further examined by varying the reactant concentrations (Figures 4A and 4B). The concentration of SOSIP.664.D7 was kept constant at 700 ng/mL to allow well-separated complex formation, with the concentration of sCD4-SNAP-A488 decreasing from 100 ng/mL, through 10 ng/mL, to 5 ng/mL. This concentration range resulted in different surface densities of sCD4-SNAP-A488 bound to SOSIP.664.D7 trimers. With more trimer molecules available to bind, we expected to observe fewer sCD4-SNAP-A488 molecules attached to the same trimer at 10 and 5 ng/mL concentrations compared with 100 ng/mL. Indeed, the number of three-step photobleaching events decreased in a concentration-dependent manner (Figure 4B). Representative intensity-time traces of the sCD4-SNAP-A488-SOSIP.664.D7 complexes with one, two, or three bound sCD4-SNAP-A488 molecules are shown in Figure 4A. These data suggest that sCD4-SNAP-A488 molecule preferentially binds to an unliganded trimer in comparison with a liganded one. As seen before, the distribution of different intensity peaks showed a decrease in total intensity between the first, second, and third photobleaching steps and followed a Gaussian trend (Figures 5A–5C). Consistently, the distribution of duration of each step also increased from the first to the third sCD4-SNAP-A488 bound states (data not shown).
Figure 4. Stoichiometry of sCD4-SNAP-A488 Molecules Bound to Unlabeled SOSIP.664.D7 Trimers at 100, 10, and 5 ng/ml of sCD4-SNAP-A488, as Measured Using SMD.

(A) Representative intensity-time trace from individual sCD4-SNAP-A488 molecules bound to SOSIP.664.D7 trimers at 5 ng/mL of sCD4-SNAP-A488 showing three-step events (I), two-step events (II), and one-step event (III); at 10 ng/mL of sCD4-SNAP-A488 showing three-step events (IV); and at 100 ng/mL of sCD4-SNAP-A488 showing three-step events (V).
(B) Data analysis from at least 100 individual SOSIP.664.D7-sCD4-SNAP-A488 complexes were compiled into a bar graph to represent the population stoichiometry.
Figure 5. Quantification of Liganded Trimers Observed in Reactions with Various sCD4-SNAP-A488 Concentrations.

(A–C) Population histograms demonstrating stoichiometry of sCD4-SNAP-A488-SOSIP.664.D7 complexes at 100 (A), 10 (B), and 5 (C) ng/mL of sCD4-SNAP-A488. Data from at least 100 individual SOSIP.664.D7-sCD4-SNAP-A488 complexes were compiled into a population histogram and fit to show the Gaussian distributions (black bell-shaped line). Histograms represent intensity versus number of occurrences for the three steps: I1 for first photobleaching event, I2 for second photobleaching event, and I3 for third photobleaching event.
(D) Occupancy distribution of stoichiometry for SOSIP.664.D7-sCD4-SNAP-A488 complexes at 500 ng/mL of sCD4-SNAP-A488 across indicated time points (from <5 s to 30 min) is represented as pie charts.
(E) Hill plot of sCD4-SNAP-A488 binding to soluble SOSIP.664.D7 trimers in reaction with varied concentration of ligand molecules (q denotes the fractions of CD4 binding site occupied with ligands in the SOSIP.664.D7 trimers surveyed).
To examine how CD4bs occupancy changes with time, we carried out experiments in which sCD4-SNAP-A488 was allowed to bind to the immobilized SOSIP.664.D7 trimer for different periods of time (ranging from <5 s to 30 min). We used sCD4-SNAP-A488 at a high concentration of 500 ng/mL to allow maximum binding to the SOSIP.664.D7 trimer. Figure 5D illustrates the differences in stoichiometry at all time points examined, with an average steady-state stoichiometry increasing from one to three sCD4-SNAP-A488 molecules binding to the trimer from <5 s to 30 min, respectively. Strikingly, less than 5% of the trimers are fully occupied at <5 s, whereas up to ~65% are fully occupied by 10 min. This observation led us to speculate that the trimer may achieve maximum saturation with three sCD4-SNAP-A488 bound state within a few minutes (~10 min). Notably, sCD4-SNAP-A488 did not fully saturate the SOSIP.664.D7 trimer, with ~35% of the population still incompletely occupied (i.e., one or two sCD4-SNAP-A488 bound trimers; Figure 5D) at the end of 30 min.
On the basis of these results, we next evaluated the stoichiometry of sCD4-SNAP-A488 binding in real time. Typically, polyvalent binding interactions are not synchronized, and it is difficult if not impossible to resolve multiple binding events among a population of reactants using classical systems. However, this situation is greatly simplified using SMD because only one polyvalent target molecule is observed, and each of its sequential ligand binding steps is marked by an incremental change in fluorescence intensity. Furthermore, the number of incremental changes observed on a single target molecule as the reaction approaches equilibrium marks the number of fluorescent ligands bound (one, two, or three), in this case, the number of sCD4-SNAP-A488 molecules bound to a SOSIP.664.D7 trimer constituted by a fixed region of interest.
Real-time imaging of the sCD4-SNAP-A488-SOSIP.664.D7 complexes was carried out using fast galvano scanning immediately after sCD4-SNAP-A488 was introduced to the SOSIP.664.D7-coated glass coverslip. We used a high concentration of sCD4-SNAP-A488 (500 ng/mL) to possibly capture all binding events. Separate images were acquired continuously to monitor the binding events, with at least 250 images recorded for every sample. Individual binding and/or dissociation events between trimer and sCD4-SNAP-A488 were determined by recording the intensities of individual single-molecule complexes (considered as region of interest [ROI]) from the raw images using ImageJ software. We measured intensities from at least 100 such ROIs obtained from multiple samples and analyzed the data as a function of time.
To rule out the possibility of manual error in scoring the binding events and to increase throughput of our analysis, we developed a Python-based step-counting algorithm (following rule-based processing principles) for automated counting of the association, dissociation, and/or photobleaching events (see STAR Methods). Intensity graphs as a function of time from individual complexes were generated (Figure 6A) and analyzed for the number of sCD4-SNAP-A488 molecules bound to SOSIP.664.D7 trimers. Total intensities, represented as histograms, showed an increase in photon counts per second between the first, second, and third binding steps and followed a Gaussian trend (Figure 6B). This is consistent with the expectation of higher total intensity as more sCD4-SNAP-A488 molecules bind to the trimer. Moreover, the ratio of the average total intensity for each step followed the estimated 1:2:3 ratio. Histograms representing the distribution of onset time for each step and duration of each step, revealed minimal differences among the first, second, and third binding steps and followed a Gaussian trend (data not shown). Consistent with our previous observations, we saw binding of up to three sCD4-SNAP-A488 molecules to a single trimer (Figure 6C). Interestingly, the distribution representing the difference in time of onset for three versus one sCD4-SNAP-A488 molecule to attach to the trimer (T3-T1) suggested that the binding of the second molecule (after the first has been bound) is quickly followed by the binding of the third molecule (Figure 6D). Such rapid transitioning through a two-ligand state could explain why the majority of the observed population showed one or three bound sCD4-SNAP-A488 molecules (Figure 6C).
Figure 6. Stoichiometry of sCD4-SNAP-A488 Molecule Association to Unlabeled SOSIP.664.D7 Trimers.

(A) Representative intensity-time trace generated from automated assessment using Python-based scripts on binding characteristics of sCD4-SNAP-A488-SOSIP.664.D7 complexes showing one-, two-, and/or three-step binding events.
(B) Data from at least 100 individual ROIs, compiled into a population histogram of total intensity versus number of occurrences for the three steps, are fit to show the Gaussian distributions (black bell-shaped line), where I1 is one sCD4-SNAP-A488 binding event, I2 is two sCD4-SNAP-A488 binding events, and I3 is three sCD4-SNAP-A488 binding events.
(C) Data from at least 100 individual ROIs comprising individual SOSIP.664.D7-sCD4-SNAP-A488 complexes after 30 min reaction time were compiled to determine the relative occurrence of different trimer:sCD4 binding stoichiometries.
(D) Traces from at least 100 individual ROIs were analyzed to determine the time intervals between the first (one) ligand binding to the onset of final (third) ligand binding event on a SOSIP.664.D7 trimer. Data (time interval between two red arrows as shown in A) are plotted as histogram distributions. Inset represents the indicated time frame on an extended x axis.
DISCUSSION
Abundant evidence shows that HIV-1 Env trimers on virions transition through a series of conformations when they engage CD4 receptors and co-receptors during the attachment and entry phases of replication. Each trimer can potentially engage up to three CD4 molecules during this process. Moreover, the flexibility and antigenicity of trimers change as they progressively become saturated with CD4 molecules. However, the finer changes in trimer characteristics that occur as they accumulate CD4 interactions are not well understood. To date, ensemble techniques and indirect biological assays have been unable to fully address these questions. Here, we used an approach incorporating SMD analyses to determine quantitatively the number of sCD4 molecules bound to soluble trimer and demonstrate capture of the intermediate interaction states.
A key step in direct counting of single molecules is to ensure single fluorophore labeling of the target molecule. For this purpose, sCD4-SNAP (see STAR Methods) was subjected to single-fluorophore labeling using SNAP surface Alexa Fluor 488 to create sCD4-SNAP-A488 protein. The binding patterns of sCD4-SNAP-A488 to gp120 monomer, SOSIP.664 trimers, and HIV-1BaL virion and their neutralization profiles confirmed that the endogenous function of CD4 receptor was preserved in our fusion protein (Figure 1; Figure S1). SMD of sCD4-SNAP-A488 allowed direct counting of ligand binding to gp120 monomer in a straightforward manner (Figure 2). Our results with SOSIP.664.D7 trimers confirmed that up to three sCD4-SNAP-A488 molecules bind a single trimer (Figures 3, 4, 5, and 6), thus affording analyses of the full spectrum of trimer-ligand stoichiometry.
One caveat to the step-counting approach presented in our study could be that loss of signal may arise because of dissociation events rather than photobleaching. However, our single-molecule fluorescence measurements revealed that stoichiometry profiles were independent of the incident excitation laser power (data not shown), suggesting that we were mostly observing photobleaching events rather than dissociation. Further in support, biolayer interferometry measurements have indicated that the sCD4 binding to BG505 SOSIP.664 trimer has a KD = 55 nM, with modest on rates (4 × 10⁴ M−1s−1) and low off rates (2 × 10⁻³ s−1) (de Taeye et al., 2015), implying that dissociation is less likely to occur in our experiments.
Our results suggest that the distribution of one, two, and three photobleaching events is dependent on the amounts of sCD4-SNAP-A488 and SOSIP.664.D7 present in the reaction mixture (Figure 4B). Thus, the variable reaction kinetics seen in previous studies (Berkower et al., 1996; Khasnis et al., 2016; Madani et al., 2017; Munro et al., 2014; Pancera et al., 2005; Yang et al., 2006) could be explained by differences in the reaction stoichiometry used. Importantly, a subset of non-saturated trimers (i.e., one or two sCD4-SNAP-A488 bound sub-populations) were consistently detected even after extended reaction times. A Hill plot of photobleaching data from liganded trimers detected across a sCD4-SNAP-A488 concentration range yielded a Hill coefficient of 0.32 ± 0.04, suggesting negative cooperativity in progressive ligand binding to soluble trimers (Figure 5E); that is, attachment of the first ligand does not promote the binding of the second. Negative binding cooperativity was also observed in surface plasmon resonance (SPR) analyses and microscale thermophoresis measurements of sCD4-SOSIP.664 interactions (Alsahafi et al., 2018; Kwon et al., 2015).
We also probed SOSIP.664.D7 occupancy during association events using continuous imaging combined with SMD (Figure 6). This approach further confirmed that up to three sCD4-SNAP-A488 molecules bind to the trimer. To allow higher throughput analyses compared with visual inspection of the data, we used an automated scoring approach built on Python-based scripts for counting trimer occupancy. Interestingly, this experiment also indicated that reaction products with two bound sCD4-SNAP-A488 molecules were relatively less abundant and more transitional, once formed (Figures 6C and 6D). Our findings suggest that trimer-sCD4-SNAP-A488 reactions rapidly transition from double to triple CD4 occupancy or otherwise fail to persist in the two-liganded state. This propensity could explain why it has been difficult to capture structural information on partially occupied soluble trimers (Kwon et al., 2015; Liu et al., 2017; Wang et al., 2016; Wu et al., 1997). Notably, although several structures are available for the HIV-1 Env in its prefusion, ligand-free (Kwon et al., 2015; Lee et al., 2016; Liu et al., 2008), or in complex with three sCD4 molecule state (Liu et al., 2008; Scharf et al., 2015; Wang et al., 2016), there is only one example of HIV-1 trimer in complex with one sCD4 molecule (BG505 DS SOSIP.664 Env from PDB: 5U1F; Liu et al., 2017) and none in complex with two sCD4 molecules.
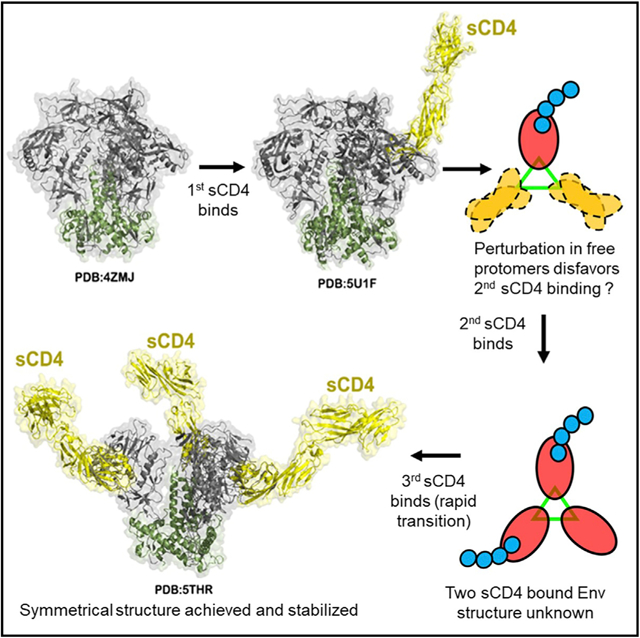
On the basis of our findings, we posit the following model for ligand binding to an HIV-1 Env trimer (Figure 7). Here, the binding of the first CD4 to any protomer on the trimer is relatively straightforward, inducing structural changes in the bound gp120. However, this event induces trimer-wide structural perturbations, which could prevent (in some cases) or impede the binding of the next ligand (negative cooperativity). Our data suggest a mean lag time of ~10 s (Figures 5D and 6D) between binding of the first and second CD4 to a single trimer. Capture of two ligands, however, induces a rapid (Figures 5 and 6) transition to full occupancy. Nevertheless, a subset of trimers may still resist binding a third ligand for unknown reasons. Thus, despite the apparent homogeneity of unliganded SOSIP trimer structures (Julien et al., 2013; Lyumkis et al., 2013; Sanders et al., 2013), there can be a certain level of heterogeneity in reaction products as evinced by SMD.
Figure 7. Model for a Stepwise Attachment of sCD4 to HIV-1 SOSIP Trimers (See Discussion).

The model is assembled using available crystallographic and CryoEM structures of soluble SOSIP trimers determined in prefusion, ligand-free state: BG505 SOSIP.664 HIV-1 trimer (PDB: 4ZMJ; Kwon et al., 2015); and CD4-triggered states: BG505 DS SOSIP.664 HIV-1 Env trimer in complex with one CD4 molecule (PDB: 5U1F; Liu et al., 2017) and BG505 SOSIP.664 HIV-1 trimer in complex with three CD4 molecules (PDB: 5THR; Wang et al., 2016). The four domain CD4 (d1d4CD4) is shown for each of the two CD4-triggered structures (for PDB: 5THR, the d1d4CD4 was generated by superimposing structure of four domain CD4 [residues 1–363; PDB: 1WIO; Wu et al., 1997] onto d1d2 domains present in complex structure). The transitional assembly of Env triggered by two CD4 molecules is not known.
Whether and how such a phenomenon occurs on virion-associated trimers is an intriguing question. In this context, trimers are membrane anchored, tethered to the viral matrix, and allosterically linked (Mengistu et al., 2015). Our early studies using HIV-1BaL virus particles and sCD4-SNAP-A488 show that we can use SMD to detect multi-step photobleaching events on isolated virions captured on poly-lysine coated glass coverslips compared with an isolated trimer (i.e., virions should bind more CD4 receptors than SOSIPs). At this point we can detect six or seven discrete events (representative traces are in Figure S5) with virions, compared with no more than three for SOSIP molecules. The relationships between virion-associated photobleaching events are likely to be relatively complex and require extended efforts to fully elucidate. However, such efforts seem possible via adaptations of the SMD approach.
In conclusion, the above studies with sCD4 and SOSIP reinforce how analytical SMD methods track temporal changes in the disposition of single molecules and as such reveal in fine detail the stoichiometry of multiple and sequential trimer-receptor interactions and the features associated with each binding step. Moreover, these methods are better suited to capture the nature of an intermediate state versus traditional ensemble approaches that study protein-protein interactions in aggregate. An added advantage to the approach is that it obviates the need to make any genetic modifications in the target (here SOSIP) sequence. Continued advances in SMD should make it possible to study the spatiotemporal dynamics of nano-molecular entities in many biological systems and in even greater detail.
STAR★METHODS
LEAD CONTACT AND MATERIALS AVAILABILITY
Further information and requests for resources and reagents should be directed to and will be fulfilled by the Lead Contact, Krishanu Ray (kray@som.umaryland.edu). All unique/stable reagents generated in this study are available from the Lead Contact with a completed Materials Transfer Agreement.
EXPERIMENTAL MODEL AND SUBJECT DETAILS
Cell lines
FreeStyle 293 cell line (Thermo Fisher Scientific) was used to express SNAP-tagged human soluble CD4 fusion protein (sCD4-SNAP). The cell line was maintained in FreeStyle 293 expression medium at 37°C / 8% CO2 / 125 rpm shaker.
Studies using organisms as source for materials
HIV-1BaL pseudovirus (in house; with 10 μg/ml p24 equivalent value corresponding to TCID50/ml values of 200,000 to 650,000) was used in FCS experiments. Pseudoviruses with 1 μg p24 equivalent concentrations were used in 50 μl reaction buffer containing Dulbecco modified Eagle medium (DMEM; GIBCO-BRL) supplemented with 10% heat-inactivated fetal bovine serum (FBS).
METHOD DETAILS
Generation, expression and purification of sCD4-SNAP
A C terminus SNAP-tagged human sCD4 fusion protein (sCD4-SNAP; four-domain) was generated as described. Briefly, pSNAPf, ~5.8Kb vector (NEB), was digested with PpuMI (NEB); the overhang was blunted using 3′–5′ mung bean exonuclease, digested again with NotI (NEB) and gel purified. Two custom oligos were designed and annealed to incorporate dual stop codons at the end of the SNAP-tag protein; remove 12 non-SNAP amino acids and reconstitute restriction enzyme sites required for cloning. Ligated material was transformed into STBL3 cells (Invitrogen), generating the desired plasmid (pSF311). Screening for positive clones and sequence confirmation was carried out. Positive clone (pSF311.1) was digested with NdeI/EcoRI (NEB), and gel purified for ligation with the hu-sCD4 PCR cassette. hu-sCD4 was generated via PCR (~1400bp), using custom designed primers containing restriction sites, XbaI/EcoRI, for cloning. The sense primer was located upstream of the hu-CD4 “ATG” start site and included the hu-CD4 Kozak sequence. The antisense primer sequence terminated just upstream of the hu-CD4 TMD region. hu-sCD4 was amplified, digested with XbaI/EcoRI, and gel purified. Purified PCR product was ligated to the pSF311.1 NdeI/EcoRI fragment and used to transform STBL3 cells, generating the plasmid pSF314. pSF314 clones were screened for the presence of the hu-sCD4 cassette and positive clones, sequence confirmed. Plasmid pSF314.4 was then used to transfect 293FS cells (Thermo Fisher Scientific) for expression of the hu-sCD4-SNAP-tag fusion protein (sCD4-SNAP). Expression was determined by western blotting using anti-CD4 (Bio-Rad); OKT4 (eBioscience), and anti-SNAP (NEB) primary antibodies at 1:1000 dilution; and goat anti-rabbit and anti-mouse (Cell Signaling Technology) conjugated to horseradish peroxidase used at a 1:2000 dilution as secondary antibodies. CNBr-Activated Sepharose (GE Healthcare Life Sciences) conjugated with an anti-CD4 antibody (CD4R1, monkey-anti-CD4; gift from Profectus) was used to purify/concentrate the fusion protein using 1.0L of 293FS cells transfected with pSF314.4.
Western blotting and Coomassie gel staining
A western blot of the purified fusion protein using anti-huCD4 antibody (Figure 1A), and Coomassie gel staining using Gel Code Blue (Thermo Fisher Scientific; Figure 1B) was carried out to confirm expression of sCD4-SNAP. Briefly, 293 cells were transfected as previously described (Ray et al., 2014). Following samples were collected after the purification step: wash (W), eluted protein (E), flow through during sample purification (FT), positive controls: supernatant from 5 days post transfection harvested cells (H) and human sCD4 at 75 and 150 ng concentration. Samples were prepared with NuPAGE LDS sample buffer (4X) according to manufactures instructions (Invitrogen) and electrophoresed on a NuPAGE 4%–12% Bis–tris gel (NOVEX, Life Technologies). Gel was transferred to an ImmunBlot PVDF membrane (Whatman Optitran reinforced nitrocellulose membrane) and probed with a primary antibody to CD4 (abcam) at 1:1000 dilution. A horse radish peroxidase-conjugated goat anti-rabbit secondary antibody at a 1:2000 dilution was added (Cell Signaling Technology) and detected using autoradiography.
Antiviral assay
The antiviral activities of sCD4 variants against HIV-1JRFL and HIV-1BaL pseudoviruses were determined using TZM-bl target cells (which measures Tat driven luciferase expression in relative luminescence units, RLU, following a single round of virus infection) as previously described (Li et al., 2006). Briefly, TZM-bl cells were plated using Dulbecco modified Eagle medium (DMEM; GIBCO-BRL) on 96-well microtiter plates and incubated overnight at 37°C. HIV-1JRFL and HIV-1BaL pseudoviruses (100,000TCID50/ml) were mixed with 2-fold serial dilutions of sCD4, sCD4-SNAP, and anti-RSV mAb (Synagis, negative control) starting at 10 μg/ml. After 1 h at 37°C the mixtures were then added to the cells. Additional assay controls included TZM-bl cells alone or TZM-bl cells with virus in the absence of antibody. After 48 hr incubation at 37°C in a CO2 incubator, Bio-Glo reagent (Promega, Madison, WI) was added to the cells and RLU were measured using a luminometer (Molecular Devices).
Fluorescent dye labeling of mAb b12, mAb 17b and sCD4-SNAP:
Both b12 (Polymun Scientific Vienna) and 17b mAbs (Ray et al., 2014) were fluorescently labeled with an Alexa Fluor 647 monoclonal antibody labeling kit (Invitrogen). mAb 2G12 (Polymun Scientific Vienna) was labeled with Alexa 488 monoclonal antibody labeling kit (Invitrogen). Each labeling reaction was performed with 100 μg of mAb as per manufacturer’s protocol. The labeled antibody was separated from unreacted dye by centrifugation through a spin column at 1,100 g for 5 mins. Recovered antibodies were dialyzed against phosphate-buffered saline (PBS) as necessary. Dye-to-protein ratios were determined (ranging from 2 to 3) by measuring absorbance at 280 nm (protein) versus 650 nm (dye). Labeled antibodies were quantified using a UV-visible spectrometer (Nanodrop 2000; Thermo-Scientific). For sCD4-SNAP labeling, the fusion protein was buffer exchanged with PBS and further concentrated using Amicon Ultra-4 Centrifugal filter Devices (10,000 MWCO). 100 μM of sCD4-SNAP was then fluorescently labeled with a SNAP surface Alexa Fluor 488 labeling kit (NEB) and dialyzed against PBS as necessary.
Microscope setup
A customized confocal microscope (based on ISS Q2 laser scanning nanoscope) with single-molecule detection sensitivity was used for all recording and analyses. The excitation source is a Fianniuum supercontinuum SC-400 laser (6 psec pulse width and 42MHz repetition rate) equipped with a NKT acousto-optic tunable filter (AOTF) to select single- or multiple- wavelengths. Incident wavelengths of 470 nm or 635 nm were used for Alexa 488 and Alexa 647 respectively. The excitation light further cleaned-up by laser-line bandpass filters (Chroma) was reflected by a dichroic mirror to a high-numerical-aperture (NA) water objective (60X; NA,1.2) or oil-objective (100X, NA 1.3), and focused onto the sample. The fluorescence was collected by single photon counting avalanche photodiodes (SPAD) through a dichroic beam splitter and Chroma band-pass filters, thus eliminating the scattered excitation light and collecting fluorescence from the Alexa 488 or Alexa 647 probes in the ROI. The imaging in our Q2 FCS/SMD set-up was performed with Galvo-controlled mirrors with related electronics and optics controlled through the 3X-DAC control card. The software module in ISS VistaVision for data acquisition and data processing along with this time-correlated single photon counting (TCSPC) module from Becker & Hickl (SPC-150) facilitate fluorescence lifetime measurements.
FCS, sample preparation
For experiments using HIV-1BaL, pseudoviruses with 1 μg p24 equivalent concentrations in 50 μl reaction buffer were treated with 1.5 μl of nonspecific IgG1 (final concentration of 100 μg/ml; Calbiochem) for 90 mins at 37°C to block nonspecific binding. This was followed by incubation with Alexa Fluor 647-conjugated mAbs (b12 or 17b); final concentrations ~5 μg/ml for 90 mins at 37°C. For experiments using sCD4-SNAP, viruses were incubated with 1.5 μl of unlabeled sCD4-SNAP (final concentration: 100 μg/ml), along with nonspecific IgG1 for 90 mins at 37°C. The reaction buffer contained PBS when using gp120 monomer (in house) and SOSIP trimer isotypes (BG505 and BG505D7 [Sanders et al., 2013], a gift from Dr. John Moore). Purified gp120 monomer and SOSIP trimer isotype suspensions were pre-incubated at RT for 1 hr with sCD4-SNAP-A488, such that the final molar ratios of sCD4-SNAP-A488:gp120 monomer and sCD4-SNAP-A488:SOSIP trimer were 1:1 (i.e., sCD4-SNAP-A488 at 100ng/ml, gp120 monomer at 200 ng/ml and SOSIP trimer isotypes at 700ng/ml). An aliquot (12 μl) of a given reaction mixture was loaded onto a glass coverslip sample chamber (pre-coated with 10% BSA) and sealed for spectroscopic measurements.
SMD, sample preparation
10 μM D7324 mAb (Aalto Bioreagents) in 1X PBS (100 mM, pH 7.2; 4°C, O.N) facilitated surface immobilization of gp120 monomer or SOSIP trimer on glass coverslips for single-molecule recording (Figure 2A). Coverslips were then washed 3X with 1X PBS and treated with 5% BSA to prevent nonspecific binding. Next, glass coverslips were incubated with gp120 monomer or SOSIP.664.D7 trimer suspension at 37°C for 1hr, followed by blocking with 5% BSA and 3X PBS wash. sCD4-SNAP-A488 was then added at RT for 30 mins with a final concentration of 100 ng/ml, diluted in Trolox (final concentration 2mM; used to improve the photostability of Alexa 488 dye during imaging/recording, [Roy et al., 2008]). The concentration of sCD4-SNAP-A488 (1 ng/ml – 500 ng/ml) was varied to get different surface densities of bound complexes. For time series experiments, an excess amount of sCD4-SNAP-A488 (500 ng/ml in 2mM Trolox) was added to the trimer (treated under similar conditions) and allowed to react for different amounts of time ranging from < 5 s to 30 mins. For association experiments, 500 ng/ml sCD4-SNAP-A488 in 2 mM Trolox was used and imaging carried out as soon as sCD4-SNAP-A488 was added to the trimer coated cover glass slips for at least 250 continuous frames.
Computational algorithm (Python based script) for automated analysis of stoichiometry:
To verify the results of our automated model generated for step counting, we analyzed a subset of our single molecule photobleaching data to obtain similar information using the python-based algorithm. The results obtained using the algorithm were largely similar (> 98% times) to observations made with manual scoring (Figure S6), giving credibility to our automated modeling system for counting binding events. Multiple factors (e.g., setting a higher threshold, number of steps expected etc.) can shift trimer occupancy distribution balance, however, trends in stoichiometry, as well as the shifts in trimer occupancy distributions are largely consistent between human and algorithm-based assessment. While the complexes in our study were initially analyzed via visual inspection, we endeavored to create a more objective and faster method for determining stoichiometry. Thus, this approach can potentially remove bias and increase throughput of data analysis.
QUANTIFICATION AND STATISTICAL ANALYSIS
FCS, data analysis
The FCS measurements were performed with an ISS Q2 confocal microscope. Data from each sample that typically represents the number of photon counts in a given time interval (~microsecond) was collected for 60 s, where the intensity is dependent on the number of photons detected from each fluorophore in a given period of time. Data acquisition were enabled by a B&H SPC-150 card operated in a photon time-tag time-resolved (TTTR) mode. ISS VistaVision software was used to generate the autocorrelation plot and analyze the FCS data to assess the in vitro binding of sCD4-SNAP-A488 to gp120 monomer, SOSIP trimers or HIV-1BaL virions. The autocorrelation data was fit to a single species or two-species diffusion model with a 3D-Gaussian point spread function to determine the diffusion time τD. Fit to the autocorrelation analyses also revealed the fraction of labeled species that acquired a lower diffusion rate in the observation volume when in a complex (Ray et al., 2014).
SMD, data analysis
The intensity-time traces and fluorescence lifetime of individual molecules were recorded (n = ~100 in each experiment). Distribution of 1, 2, or 3- sCD4-SNAP-A488 bound gp120 monomers or SOSIP.664.D7 trimers was visually determined by counting the number of total molecules belonging to each category. Histograms representing distributions of intensity and time were generated for the whole datasets. For association experiments, ImageJ was used to determine the intensity of individual single molecules (ROI). N = ~100 ROIs were analyzed to calculate the variation in intensity as a function of time. Histograms representing distributions of intensity and time were generated as before.
DATA AND CODE AVAILABILITY
The code generated during this study are available at https://github.com/Yatrie/Tracer/blob/master/photoTracer.py
Supplementary Material
KEY RESOURCES TABLE
| REAGENT or RESOURCE | SOURCE | IDENTIFIER |
|---|---|---|
| Antibodies | ||
| mAb b12 | Polymun Scientific Vienna, Austria | AB011 |
| mAb 2G12 | Polymun Scientific Vienna, Austria | AB002 |
| mAb 17b | In house | N/A |
| OKT4 | eBioscience | Catalog # 17-0048-42 |
| UMAB64 (anti-CD4) | Bio-Rad | Product Code: VMA00370 |
| Anti-SNAP-tag® Antibody (Polyclonal) | NEB | Catalog # P9310S |
| CD4R1 | Gift from Profectus | N/A |
| mAb N49P7 | In house | https://doi.org/10.1016/j.cell.2018.03.061 |
| Synagis (anti-RSV mAb) | MedImmune | N/A |
| Anti-rabbit IgG | Cell Signaling Technology | #7074 |
| Goat anti-mouse | Cell Signaling Technology | #7076 |
| Affinity purified anti-HIV-1-gp120 | Aalto Bioreagents | D7324 |
| IgG1 | Calbiochem | Catalog #401114 |
| Bacterial and Virus Strains | ||
| Pseudovirus: HIV-1BaL | In house | N/A |
| Pseudovirus: HIV-1JRFL | In house | N/A |
| E. coli: One Shot Stbl3 Chemically Competent Cells | Invitrogen | Catalog # C737303 |
| Chemicals, Peptides, and Recombinant Proteins | ||
| gp120 monomer | In house | N/A |
| SOSIP.664 trimer isotypes | A gift from Dr. John Moore | BG505 and BG505.D7 (Sanders et al., 2013) |
| CNBr-Activated Sepharose | GE Healthcare Life Sciences | Catalog # 17043001 |
| GelCode Blue Stain Reagent | Thermo Fisher Scientific | Catalog # 24590 |
| NuPAGE LDS Sample Buffer (4X) | Thermo Fisher Scientific | Catalog #NP0007 |
| Trolox | Sigma-Aldrich | Catalog #238813 |
| Critical Commercial Assays | ||
| Bright-Glo Luciferase Assay System | Promega | Catalog # E2610 |
| NuPAGE 4–12% Bis-Tris Protein Gels | Thermo Fisher Scientific | Catalog # NP0322PK2 |
| Whatman® Optitran® reinforced nitrocellulose membranes | MilliporeSigma | Catalog # 10493396 |
| Deposited Data | ||
| BG505 SOSIP.664 HIV-1 trimer | Kwon et al., 2015 | PDB code: PDB: 4ZMJ |
| BG505 DS SOSIP.664 HIV-1 Env trimer in complex with one CD4 molecule | Liu et al., 2017 | PDB code: PDB: 5U1F |
| BG505 SOSIP.664 HIV-1 trimer in complex with three CD4 molecules | Wang et al., 2016 | PDB code: PDB: 5THR |
| CD4 | Wu et al., 1997 | PDB code: PDB: 1WIO |
| Experimental Models: Cell Lines | ||
| FreeStyle 293-F Cells | Thermo Fisher Scientific | Catalog # R79007 |
| TZM-bl Cells | NIH AIDS Reagent Program | Catalog # 8129 |
| Oligonucleotides | ||
| Plasmid: pSF314.4 | In house | GenBank MK732924–MK732925 |
| Recombinant DNA | ||
| Plasmid: pSNAPf | NEB | Catalog # N9183S |
| hu-sCD4 PCR cassette | In house | N/A |
| Software and Algorithms | ||
| VistaVision | ISS | N/A |
| ImageJ | Fiji | N/A |
| Prism | GraphPad | N/A |
| Origin | OriginLab | N/A |
| Step counting algorithm | This paper | https://github.com/Yatrie/Tracer/blob/master/photoTracer.py |
| Other | ||
| DMEM | GIBCO | Catalog # 31053028 |
| Alexa Fluor 647 Antibody Labeling Kit | Invitrogen | Catalog # A20186 |
| SNAP-Surface® Alexa Fluor® 488 | NEB | Catalog # S9129S |
| Amicon® Ultra-15 Centrifugal Filter Unit | Sigma-Aldrich | Catalog # UFC901024 |
Highlights.
Single-molecule fluorescence quantifying sequential biomolecular interactions
Stoichiometry of soluble CD4 binding to native-like HIV-1 envelope
Real-time association kinetics with quantitative information for assembly of complex
Quantification of liganded trimers reflect negative cooperativity in ligand binding
ACKNOWLEDGMENTS
Research reported in this publication was supported by the National Institute of General Medical Sciences and National Institute of Allergy and Infectious Diseases of the NIH under awards numbers R01 GM117836, R01 AI150447, and R01GM117836-S1 to K.R.; R01 AI116274 and R01 AI129769 to M.P.; and P01 AI120756 to A.L.D. The content is solely the responsibility of the authors and does not necessarily represent the official views of the NIH. We thank Dr. John Moore of Cornell University for the generous gift of BG505 SOSIP.664 trimers. We thank Amir Dashti and Panjamurthy Kuppusamy for technical assistance. We greatly appreciate Vivek M. Agrawal for his help with creating Python-based scripts to automate step tracing from intensity-time trajectories using rule-based processing.
Footnotes
SUPPLEMENTAL INFORMATION
Supplemental Information can be found online at https://doi.org/10.1016/j.celrep.2019.08.074.
DECLARATION OF INTERESTS
The authors declare no competing interests.
REFERENCES
- Alsahafi N, Anand SP, Castillo-Menendez L, Verly MM, Medjahed H, Prévost J, Herschhorn A, Richard J, Schön A, Melillo B, et al. (2018). SOSIP changes affect human immunodeficiency virus (HIV-1) envelope glycoprotein conformation and CD4 engagement. J. Virol 92, e01080–18. [DOI] [PMC free article] [PubMed] [Google Scholar]
- Berkower I, Mostowski H, Bull TE, and Murphy D (1996). CD4-IgG binding threshold for inactivation of human immunodeficiency virus type 1.J. Infect. Dis 173, 863–869. [DOI] [PubMed] [Google Scholar]
- Blumenthal R, Durell S, and Viard M (2012). HIV entry and envelope glycoprotein-mediated fusion. J. Biol. Chem 287, 40841–40849. [DOI] [PMC free article] [PubMed] [Google Scholar]
- Brandenberg OF, Magnus C, Regoes RR, and Trkola A (2015). The HIV-1 entry process: a stoichiometric view. Trends Microbiol. 23, 763–774. [DOI] [PubMed] [Google Scholar]
- Calarese DA, Lee HK, Huang CY, Best MD, Astronomo RD, Stanfield RL, Katinger H, Burton DR, Wong CH, and Wilson IA (2005). Dissection of the carbohydrate specificity of the broadly neutralizing anti-HIV-1 antibody 2G12. Proc. Natl. Acad. Sci. U S A 102, 13372–13377. [DOI] [PMC free article] [PubMed] [Google Scholar]
- Chojnacki J, Staudt T, Glass B, Bingen P, Engelhardt J, Anders M, Schneider J, Müller B, Hell SW, and Kräusslich HG (2012). Maturation-dependent HIV-1 surface protein redistribution revealed by fluorescence nanoscopy. Science 338, 524–528. [DOI] [PubMed] [Google Scholar]
- de Taeye SW, Ozorowski G, Torrents de la Peña A, Guttman M, Julien JP, van den Kerkhof TL, Burger JA, Pritchard LK, Pugach P, Yasmeen A, et al. (2015). Immunogenicity of stabilized HIV-1 envelope trimers with reduced exposure of non-neutralizing epitopes. Cell 163, 1702–1715. [DOI] [PMC free article] [PubMed] [Google Scholar]
- Derking R, Ozorowski G, Sliepen K, Yasmeen A, Cupo A, Torres JL, Julien JP, Lee JH, van Montfort T, de Taeye SW, et al. (2015). Comprehensive antigenic map of a cleaved soluble HIV-1 envelope trimer. PLoS Pathog. 11, e1004767. [DOI] [PMC free article] [PubMed] [Google Scholar]
- Dey AK, Cupo A, Ozorowski G, Sharma VK, Behrens AJ, Go EP, Ketas TJ, Yasmeen A, Klasse PJ, Sayeed E, et al. (2018). cGMP production and analysis of BG505 SOSIP.664, an extensively glycosylated, trimeric HIV-1 envelope glycoprotein vaccine candidate. Biotechnol. Bioeng 115, 885–899. [DOI] [PMC free article] [PubMed] [Google Scholar]
- Dobrowsky TM, Zhou Y, Sun SX, Siliciano RF, and Wirtz D (2008). Monitoring early fusion dynamics of human immunodeficiency virus type 1 at single-molecule resolution. J. Virol 82, 7022–7033. [DOI] [PMC free article] [PubMed] [Google Scholar]
- Duenas-Decamp M, Jiang L, Bolon D, and Clapham PR (2016). Saturation mutagenesis of the HIV-1 envelope CD4 binding loop reveals residues controlling distinct trimer conformations. PLoS Pathog 12, e1005988. [DOI] [PMC free article] [PubMed] [Google Scholar]
- Goudsmits JMH, Slotboom DJ, and van Oijen AM (2017). Single-molecule visualization of conformational changes and substrate transport in the vitamin B12 ABC importer BtuCD-F. Nat. Commun 8, 1652. [DOI] [PMC free article] [PubMed] [Google Scholar]
- Ha T, Ting AY, Liang J, Caldwell WB, Deniz AA, Chemla DS, Schultz PG, and Weiss S (1999). Single-molecule fluorescence spectroscopy of enzyme conformational dynamics and cleavage mechanism. Proc. Natl. Acad. Sci. U S A 96, 893–898. [DOI] [PMC free article] [PubMed] [Google Scholar]
- He L, de Val N, Morris CD, Vora N, Thinnes TC, Kong L, Azadnia P, Sok D, Zhou B, Burton DR, et al. (2016). Presenting native-like trimeric HIV-1 antigens with self-assembling nanoparticles. Nat. Commun 7, 12041. [DOI] [PMC free article] [PubMed] [Google Scholar]
- Julien JP, Cupo A, Sok D, Stanfield RL, Lyumkis D, Deller MC, Klasse PJ, Burton DR, Sanders RW, Moore JP, et al. (2013). Crystal structure of a soluble cleaved HIV-1 envelope trimer. Science 342, 1477–1483. [DOI] [PMC free article] [PubMed] [Google Scholar]
- Khasnis MD, Halkidis K, Bhardwaj A, and Root MJ (2016). Receptor activation of HIV-1 Env leads to asymmetric exposure of the gp41 Trimer. PLoS Pathog. 12, e1006098. [DOI] [PMC free article] [PubMed] [Google Scholar]
- Klasse PJ (2012). The molecular basis of HIV entry. Cell. Microbiol 14, 1183–1192. [DOI] [PMC free article] [PubMed] [Google Scholar]
- Kuhmann SE, Platt EJ, Kozak SL, and Kabat D (2000). Cooperation of multiple CCR5 coreceptors is required for infections by human immunodeficiency virus type 1. J. Virol 74, 7005–7015. [DOI] [PMC free article] [PubMed] [Google Scholar]
- Kwon YD, Pancera M, Acharya P, Georgiev IS, Crooks ET, Gorman J, Joyce MG, Guttman M, Ma X, Narpala S, et al. (2015). Crystal structure, conformational fixation and entry-related interactions of mature ligand-free HIV-1 Env. Nat. Struct. Mol. Biol 22, 522–531. [DOI] [PMC free article] [PubMed] [Google Scholar]
- Kwong PD, Wyatt R, Robinson J, Sweet RW, Sodroski J, and Hendrickson WA (1998). Structure of an HIV gp120 envelope glycoprotein in complex with the CD4 receptor and a neutralizing human antibody. Nature 393, 648–659. [DOI] [PMC free article] [PubMed] [Google Scholar]
- Lee JH, Ozorowski G, and Ward AB (2016). Cryo-EM structure of a native, fully glycosylated, cleaved HIV-1 envelope trimer. Science 351, 1043–1048. [DOI] [PMC free article] [PubMed] [Google Scholar]
- Li M, Salazar-Gonzalez JF, Derdeyn CA, Morris L, Williamson C, Robinson JE, Decker JM, Li Y, Salazar MG, Polonis VR, et al. (2006). Genetic and neutralization properties of subtype C human immunodeficiency virus type 1 molecular env clones from acute and early heterosexually acquired infections in Southern Africa. J. Virol 80, 11776–11790. [DOI] [PMC free article] [PubMed] [Google Scholar]
- Li X, Wang X, Yang Y, Li R, He Q, Fang X, Luu DT, Maurel C, and Lin J (2011). Single-molecule analysis of PIP2;1 dynamics and partitioning reveals multiple modes of Arabidopsis plasma membrane aquaporin regulation. Plant Cell 23, 3780–3797. [DOI] [PMC free article] [PubMed] [Google Scholar]
- Liu J, Bartesaghi A, Borgnia MJ, Sapiro G, and Subramaniam S (2008). Molecular architecture of native HIV-1 gp120 trimers. Nature 455, 109–113. [DOI] [PMC free article] [PubMed] [Google Scholar]
- Liu Q, Acharya P, Dolan MA, Zhang P, Guzzo C, Lu J, Kwon A, Gururani D, Miao H, Bylund T, et al. (2017). Quaternary contact in the initial interaction of CD4 with the HIV-1 envelope trimer. Nat. Struct. Mol. Biol 24, 370–378. [DOI] [PMC free article] [PubMed] [Google Scholar]
- Lyumkis D, Julien JP, de Val N, Cupo A, Potter CS, Klasse PJ, Burton DR, Sanders RW, Moore JP, Carragher B, et al. (2013). Cryo-EM structure of a fully glycosylated soluble cleaved HIV-1 envelope trimer. Science 342, 1484–1490. [DOI] [PMC free article] [PubMed] [Google Scholar]
- Madani N, Princiotto AM, Zhao C, Jahanbakhshsefidi F, Mertens M, Herschhorn A, Melillo B, Smith AB 3rd, and Sodroski J (2017). Activation and inactivation of primary human immunodeficiency virus envelope glycoprotein trimers by CD4-mimetic compounds. J. Virol 91, e01880–16. [DOI] [PMC free article] [PubMed] [Google Scholar]
- Mason MD, Ray K, Grober RD, Pohlers G, and Cameron J (2004). Single molecule acid-base kinetics and thermodynamics. Phys. Rev. Lett 93, 073004. [DOI] [PubMed] [Google Scholar]
- Mengistu M, Ray K, Lewis GK, and DeVico AL (2015). Antigenic properties of the human immunodeficiency virus envelope glycoprotein gp120 on virions bound to target cells. PLoS Pathog. 11, e1004772. [DOI] [PMC free article] [PubMed] [Google Scholar]
- Michalet X, Weiss S, and Jäger M (2006). Single-molecule fluorescence studies of protein folding and conformational dynamics. Chem. Rev 106, 1785–1813. [DOI] [PMC free article] [PubMed] [Google Scholar]
- Moerner WE (2007). New directions in single-molecule imaging and analysis. Proc. Natl. Acad. Sci. U S A 104, 12596–12602. [DOI] [PMC free article] [PubMed] [Google Scholar]
- Munro JB, Gorman J, Ma X, Zhou Z, Arthos J, Burton DR, Koff WC, Courter JR, Smith AB 3rd, Kwong PD, et al. (2014). Conformational dynamics of single HIV-1 envelope trimers on the surface of native virions. Science 346, 759–763. [DOI] [PMC free article] [PubMed] [Google Scholar]
- Nogal B, Bowman CA, and Ward AB (2017). Time-course, negative-stain electron microscopy-based analysis for investigating protein-protein interactions at the single-molecule level. J. Biol. Chem 292, 19400–19410. [DOI] [PMC free article] [PubMed] [Google Scholar]
- Pancera M, Lebowitz J, Schön A, Zhu P, Freire E, Kwong PD, Roux KH, Sodroski J, and Wyatt R (2005). Soluble mimetics of human immunodeficiency virus type 1 viral spikes produced by replacement of the native trimerization domain with a heterologous trimerization motif: characterization and ligand binding analysis. J. Virol 79, 9954–9969. [DOI] [PMC free article] [PubMed] [Google Scholar]
- Pancera M, Zhou T, Druz A, Georgiev IS, Soto C, Gorman J, Huang J, Acharya P, Chuang GY, Ofek G, et al. (2014). Structure and immune recognition of trimeric pre-fusion HIV-1 Env. Nature 514, 455–461. [DOI] [PMC free article] [PubMed] [Google Scholar]
- Pancera M, Lai YT, Bylund T, Druz A, Narpala S, O’Dell S, Schön A, Bailer RT, Chuang GY, Geng H, et al. (2017). Crystal structures of trimeric HIV envelope with entry inhibitors BMS-378806 and BMS-626529. Nat. Chem. Biol 13, 1115–1122. [DOI] [PMC free article] [PubMed] [Google Scholar]
- Ray K, Mengistu M, Yu L, Lewis GK, Lakowicz JR, and DeVico AL (2014). Antigenic properties of the HIV envelope on virions in solution.J. Virol 88, 1795–1808. [DOI] [PMC free article] [PubMed] [Google Scholar]
- Ray K, Badugu R, Szmacinski H, and Lakowicz JR (2015). Several hundred-fold enhanced fluorescence from single fluorophores assembled on silver nanoparticle-dielectric-metal substrate. Chem. Commun. (Camb.) 51, 15023–15026. [DOI] [PMC free article] [PubMed] [Google Scholar]
- Rhoades E, Gussakovsky E, and Haran G (2003). Watching proteins fold one molecule at a time. Proc. Natl. Acad. Sci. U S A 100, 3197–3202. [DOI] [PMC free article] [PubMed] [Google Scholar]
- Rigler R and Elson ES, eds. (2001). Fluorescence Correlation Spectroscopy: Theory and Applications (Springer; ). [Google Scholar]
- Ringe RP, Ozorowski G, Rantalainen K, Struwe WB, Matthews K, Torres JL, Yasmeen A, Cottrell CA, Ketas TJ, LaBranche CC, et al. (2017). Reducing V3 antigenicity and immunogenicity on soluble, native-like HIV-1 Env SOSIP trimers. J. Virol 91, e00677–17. [DOI] [PMC free article] [PubMed] [Google Scholar]
- Roy R, Hohng S, and Ha T (2008). A practical guide to single-molecule FRET. Nat. Methods 5, 507–516. [DOI] [PMC free article] [PubMed] [Google Scholar]
- Sajadi MM, Dashti A, Rikhtegaran Tehrani Z, Tolbert WD, Seaman MS, Ouyang X, Gohain N, Pazgier M, Kim D, Cavet G, et al. (2018). Identification of near-pan-neutralizing antibodies against HIV-1 by deconvolution of plasma humoral responses. Cell 173, 1783–1795.e14. [DOI] [PMC free article] [PubMed] [Google Scholar]
- Sanders RW, Derking R, Cupo A, Julien JP, Yasmeen A, de Val N, Kim HJ, Blattner C, de la Peña AT, Korzun J, et al. (2013). A next-generation cleaved, soluble HIV-1 Env trimer, BG505 SOSIP.664 gp140, expresses multiple epitopes for broadly neutralizing but not non-neutralizing antibodies. PLoS Pathog. 9, e1003618. [DOI] [PMC free article] [PubMed] [Google Scholar]
- Sanders RW, van Gils MJ, Derking R, Sok D, Ketas TJ, Burger JA, Ozorowski G, Cupo A, Simonich C, Goo L, et al. (2015). HIV-1 vaccines. HIV-1 neutralizing antibodies induced by native-like envelope trimers. Science 349, aac4223. [DOI] [PMC free article] [PubMed] [Google Scholar]
- Scharf L, Wang H, Gao H, Chen S, McDowall AW, and Bjorkman PJ (2015). Broadly neutralizing antibody 8ANC195 recognizes closed and open states of HIV-1 Env. Cell 162, 1379–1390. [DOI] [PMC free article] [PubMed] [Google Scholar]
- Sougrat R, Bartesaghi A, Lifson JD, Bennett AE, Bess JW, Zabransky DJ, and Subramaniam S (2007). Electron tomography of the contact between T cells and SIV/HIV-1: implications for viral entry. PLoS Pathog. 3, e63. [DOI] [PMC free article] [PubMed] [Google Scholar]
- Stadtmueller BM, Bridges MD, Dam KM, Lerch MT, Huey-Tubman KE, Hubbell WL, and Bjorkman PJ (2018). DEER spectroscopy measurements reveal multiple conformations of HIV-1 SOSIP envelopes that show similarities with envelopes on native virions. Immunity 49, 235–246.e4. [DOI] [PMC free article] [PubMed] [Google Scholar]
- Tsekouras K, Custer TC, Jashnsaz H, Walter NG, and Pressé S (2016). A novel method to accurately locate and count large numbers of steps by photobleaching. Mol. Biol. Cell 27, 3601–3615. [DOI] [PMC free article] [PubMed] [Google Scholar]
- Ulbrich MH, and Isacoff EY (2007). Subunit counting in membrane-bound proteins. Nat. Methods 4, 319–321. [DOI] [PMC free article] [PubMed] [Google Scholar]
- Wang H, Cohen AA, Galimidi RP, Gristick HB, Jensen GJ, and Bjorkman PJ (2016). Cryo-EM structure of a CD4-bound open HIV-1 envelope trimer reveals structural rearrangements of the gp120 V1V2 loop. Proc. Natl. Acad. Sci. U S A 113, E7151–E7158. [DOI] [PMC free article] [PubMed] [Google Scholar]
- Wang Y, O’Dell S, Turner HL, Chiang CI, Lei L, Guenaga J, Wilson R, Martinez-Murillo P, Doria-Rose N, Ward AB, et al. (2017). HIV-1 cross-reactive primary virus neutralizing antibody response elicited by immunization in nonhuman primates. J. Virol 91, e00910–e00917. [DOI] [PMC free article] [PubMed] [Google Scholar]
- White TA, Bartesaghi A, Borgnia MJ, de la Cruz MJ, Nandwani R, Hoxie JA, Bess JW, Lifson JD, Milne JL, and Subramaniam S (2011). Three-dimensional structures of soluble CD4-bound states of trimeric simian immunodeficiency virus envelope glycoproteins determined by using cryo-electron tomography. J. Virol 85, 12114–12123. [DOI] [PMC free article] [PubMed] [Google Scholar]
- Wu H, Kwong PD, and Hendrickson WA (1997). Dimeric association and segmental variability in the structure of human CD4. Nature 387, 527–530. [DOI] [PubMed] [Google Scholar]
- Xie XS, and Dunn RC (1994). Probing single molecule dynamics. Science 265, 361–364. [DOI] [PubMed] [Google Scholar]
- Yang X, Kurteva S, Ren X, Lee S, and Sodroski J (2006). Subunit stoichiometry of human immunodeficiency virus type 1 envelope glycoprotein trimers during virus entry into host cells. J. Virol 80, 4388–4395. [DOI] [PMC free article] [PubMed] [Google Scholar]
- Yasmeen A, Ringe R, Derking R, Cupo A, Julien JP, Burton DR, Ward AB, Wilson IA, Sanders RW, Moore JP, and Klasse PJ (2014). Differential binding of neutralizing and non-neutralizing antibodies to native-like soluble HIV-1 Env trimers, uncleaved Env proteins, and monomeric subunits. Retrovirology 11, 41. [DOI] [PMC free article] [PubMed] [Google Scholar]
- Zhu P, Chertova E, Bess J Jr., Lifson JD, Arthur LO, Liu J, Taylor KA, and Roux KH (2003). Electron tomography analysis of envelope glycoprotein trimers on HIV and simian immunodeficiency virus virions. Proc. Natl. Acad. Sci. U S A 100, 15812–15817. [DOI] [PMC free article] [PubMed] [Google Scholar]
- Zhu P, Liu J, Bess J Jr., Chertova E, Lifson JD, Grisé H, Ofek GA, Taylor KA, and Roux KH (2006). Distribution and three-dimensional structure of AIDS virus envelope spikes. Nature 441, 847–852. [DOI] [PubMed] [Google Scholar]
Associated Data
This section collects any data citations, data availability statements, or supplementary materials included in this article.
Supplementary Materials
Data Availability Statement
The code generated during this study are available at https://github.com/Yatrie/Tracer/blob/master/photoTracer.py