Abstract
The evolutionary processes that drive universal therapeutic resistance in adult patients with diffuse glioma remain unclear1,2. Here, we analyzed temporally separated DNA sequencing data and matched clinical annotation from 222 patients with glioma. Through mutational and copy number analyses across the three major subtypes of diffuse glioma, we observed that driver genes detected at initial disease were retained at recurrence, while there was little evidence of recurrence-specific gene alterations. Treatment with alkylating-agents resulted in a hypermutator phenotype at different rates across glioma subtypes, and hypermutation was not associated with differences in survival. Acquired aneuploidy was frequently detected in recurrent gliomas characterized by presence of an IDH mutation but without 1p/19q codeletion and further converged with acquired cell cycle alterations and poor outcomes. We show that the clonal architecture of each tumor remains similar over time and that absence of clonal selection was associated with increased survival. Finally, we did not observe differences in immunoediting levels between initial and recurrent glioma. Our results collectively argue that the strongest selective pressures occur early during glioma development and that current therapies shape this evolution in a largely stochastic manner.
INTRODUCTION
Diffuse glioma is the most common malignant brain tumor in adults and invariably relapse despite treatment with surgery, radiotherapy, and chemotherapy. The molecular landscape of glioma at diagnosis has been extensively characterized 3-9. While these efforts have led to the identification of driver genes and clinically relevant subtypes10,11, it is unknown how the glioma genetic landscape evolves over time and in response to therapy.
Intratumoral heterogeneity is a well-recognized characteristic of gliomas and results from selective pressures such as a limited availability of nutrients, clonal competition, and treatment12-15. Tumors are thought to circumvent these growth bottlenecks via dynamic competition of subclones resulting in the most favorable environment for tumor sustenance1. Recent studies have suggested that stochastic changes in clone frequency (i.e. neutral evolution) and immunogenic surveillance may further contribute to the observed intratumoral heterogeneity16,17. An understanding of evolutionary dynamics at multiple time points is needed to develop strategies aimed at delaying or preventing the onset of tumor progression.
To investigate clonal dynamics over time and in response to therapeutic pressures, we established the Glioma Longitudinal Analysis (GLASS) Consortium. GLASS is a community-driven effort that seeks to overcome the logistical challenges in constructing adequately powered longitudinal genomic glioma datasets by pooling datasets from patients treated at institutions worldwide 18. We have analyzed longitudinal profiles across the three molecular glioma subtypes to identify the molecular processes active at initial and recurrent time points. These analyses identified few common features of glioma evolution across subtypes, and instead pointed toward highly variable and patient-specific trajectories of genomic alterations.
RESULTS
GLASS cohort
We pooled existing and newly generated longitudinal DNA sequencing datasets from 288 patients treated at 35 hospitals (Supplementary Table 1, Extended Data Fig. 1). After applying quality filters, tumor samples from 222 patients with high-quality data in at least two time points were classified according to molecular markers into three major glioma subtypes: 1. IDH-mutant and chromosome 1p/19q co-deleted (IDHmutant-codel; n = 25) 2. IDH-mutant without chromosome 1p/19q codeletion (IDHmutant-noncodel; n = 63) and 3. IDH wild type (IDHwt; n = 134), in alignment with the World Health Organization classification of Central Nervous System tumors 10,11. For each patient we selected two time-separated tumor samples, henceforth initial and recurrence, for further analysis.
Mutational burdens and processes over time
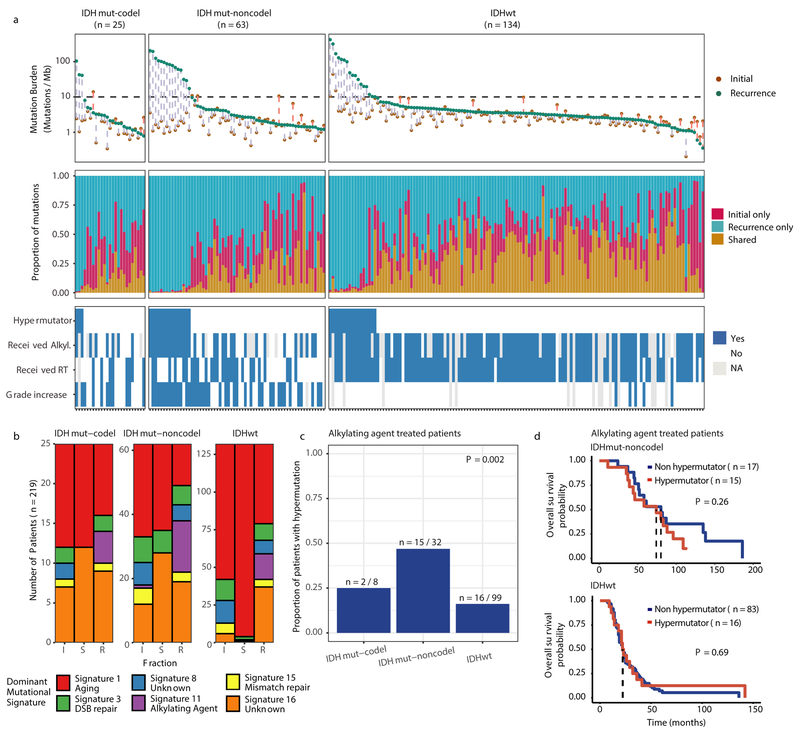
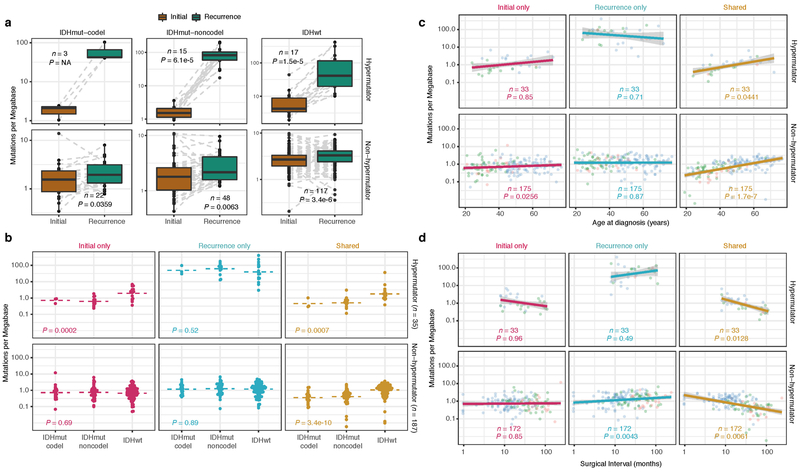
We first evaluated temporal changes in mutational burden and processes to understand general patterns of glioma evolution. Mutation burdens in initial tumors were comparable with previously reported rates 6,7,19. 2.20 mutations (single-nucleotide variants and small insertions/deletions) per Megabase (Mutations/Mb) for IDHmutant-codels; 2.52 Mutations/Mb for IDHmutant-noncodels; and 2.85 Mutations/Mb for IDHwt glioma (Fig. 1a; Extended Data Fig. 2a). Excluding DNA hypermutation cases (> 10 Mutations/Mb, n = 35), the mutation burden increased after recurrence in 70% of the cohort (Extended Data Fig. 2a). To study changes during tumor progression, we separated mutations into three fractions: initial only, recurrence only, or shared. Interestingly, private fraction but not shared fraction mutation burdens were comparable between subtypes (Extended Data Fig. 2b). Patient age at diagnosis was significantly associated with the shared mutational burden and to a lesser extent the mutation burden private to the initial tumor (Extended Data Fig. 2c). On average, tumors with longer time to recurrence had slightly higher mutation burdens (Extended Data Fig. 2d).
Fig. 1 ∣. Temporal changes in glioma mutational burden and processes.
a. Each column represents a single patient (n = 222) at two separate timepoints grouped by glioma subtype and ordered left-to-right by decreasing mutation frequency at recurrence. Top, mutation frequency differences between initial and recurrent tumors. Blue dotted line indicates increased mutation frequency while a red dotted line indicates decreased mutational frequency. Stacked bar plot reflects the proportion of total mutations shared (mustard), private to initial (magenta), or private to recurrence (blue). Clinical information including hypermutation status, therapy, and grade changes. b. Stacked bar plot (n=219) indicating the dominant mutational signature among initial, recurrent and shared mutation fractions stratified by glioma subtype. c. The proportion of glioma recurrences with alkylating agent-related hypermutation, grouped by glioma subtype. Fisher’s exact test was used to compare proportions between subtypes. d. Kaplan-Meier curve depicting overall survival in hypermutant (red) versus non-hypermutant (blue) alkylating agent treated patients amongst IDHwt (left, n = 99) and IDHmut-noncodel (right, n = 32) tumors. Log-rank test P-values are shown.
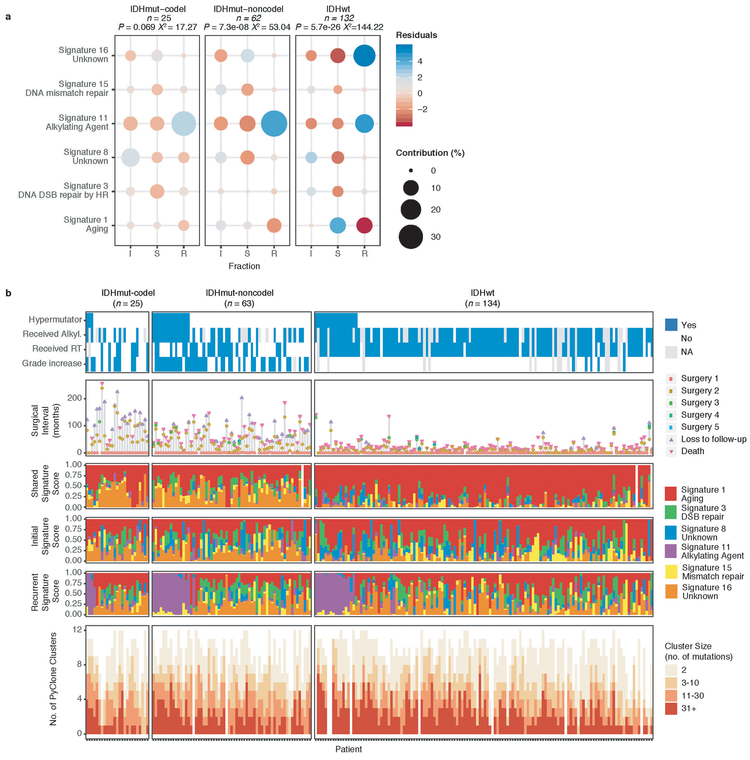
These fraction-specific differences in mutation burden suggested that the activity of distinct mutational processes may also be time-dependent. We therefore classified mutations in each fraction according to the Catalogue of Somatic Mutations in Cancer (COSMIC) signature database20. As expected, signature activity was closely related to subtype and fraction (Fig. 1b, Extended Data Fig. 3a). Signature 1 (aging) was nearly always the dominant signature amongst shared mutations in IDHwt tumors, whereas the shared fraction in IDHmut-noncodel and IDHmut-codel tumors - tumor subtypes associated with a younger age of diagnosis - additionally showed a strong presence of signature 16 (unknown etiology). Signatures 3 (double strand break repair) and 15 (mismatch repair) along with signature 8 (unknown etiology) were mostly confined to the private fractions, suggesting that these processes were of lesser importance to tumor maintenance than those associated with aging.
Treatment of glioma includes alkylating agents that can induce post-treatment hypermutation21-23. We observed enrichment of the associated signature 11 in recurrent tumors with a mutational load exceeding 10 Mutations/Mb and treated with alkylating agents (Fig. 1a, Extended Data Fig. 3b). Treatment-associated hypermutation occurred most frequently among IDHmutant-noncodels (47%), followed by IDHmutant-codels (25%), and IDHwt gliomas (16%) (Fig. 1c). The difference in the proportion of hypermutation events was significantly different between the three glioma subtypes (Fisher’s exact-test P = 2.0e-03), suggesting that IDHmutant noncodels are most sensitive to developing a hypermutator phenotype 24.
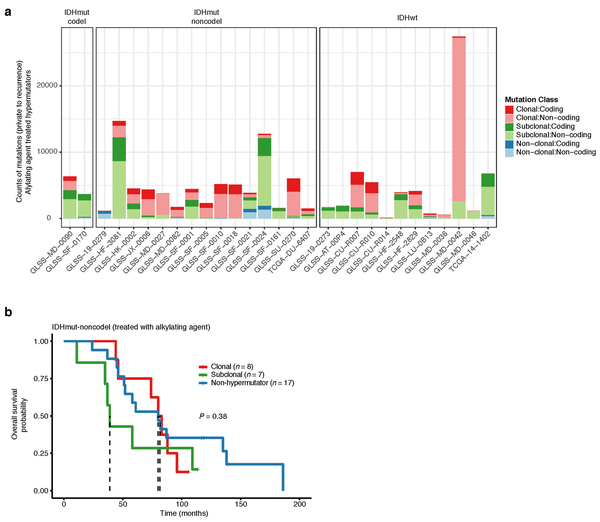
Treatment-induced hypermutation has been associated with disease progression23. We did not find overall survival differences between alkylating agent-treated hypermutators and alkylating agent-treated non-hypermutators independent of age, subtype, and MGMT methylation status (Fig. 1d, Supplementary Table 2a-b). In order to further assess the pathogenicity of acquired mutations, we studied their clonality25. Newly acquired clonal mutations have penetrated most of the tumor (i.e., a selective sweep) between initial and recurrence and mark clonal expansion 26. Conversely, acquired subclonal mutations are less prevalent, and therefore less likely to drive disease progression. Previous reports have suggested that alkylating agent-associated mutations hypermutation are frequently clonal27. We found that in 48% of hypermutated tumors a majority of the recurrence-only mutations were clonal, potentially reflecting cases where a selective sweep occurred (Extended Data Fig. 4a). However, IDHmut-noncodel hypermutators with predominantly clonal mutations did not show differences in survival compared with those harboring predominantly subclonal mutations (log-rank test P = 0.38, Extended Data Fig. 4b). Alkylating agents such as temozolomide prolong survival of adult patients with glioma28,29. Our results show that treatment-induced hypermutation is common across subtypes and does not associate with a reduced overall survival supporting the noted benefit of alkylating agent therapy.
Selective pressures during glioma evolution
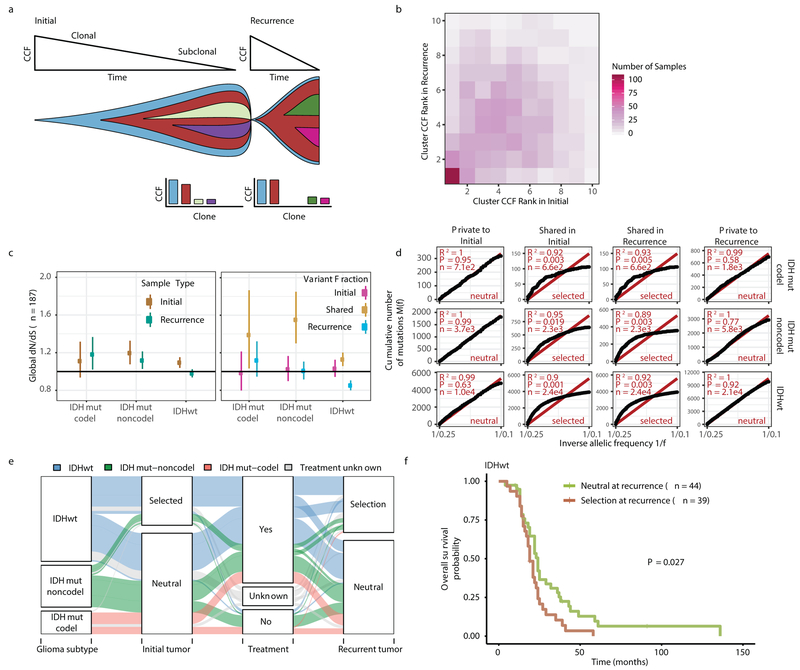
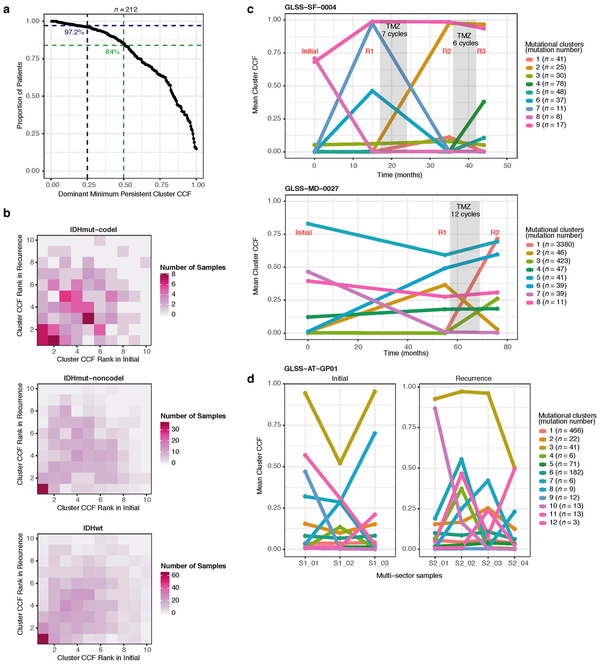
Environmental and treatment-induced pressures may drive changes in clonal architecture at recurrence. To evaluate selection over time we clustered copy number changes and mutations based on their cancer cell fraction (CCF). CCF values represent the fraction of cancer cells harboring a given alteration and reflect the relative timing of events, since alterations that are present in a subset of cancer cells likely occurred later than events present in all cancer cells (Fig. 2a). Most tumors (84%) demonstrated a mutational cluster with CCF > 50% that persisted from the initial tumor into recurrence, likely reflecting the tumor trunk and harboring the tumor-initiating driver mutations (Fig. 2b, Extended Data Fig. 5a)30. To determine changes in clonal dominance over time we ranked clusters within each sample by their CCF and found similarities in clonal architecture throughout the course of disease (Kendall rank correlation, tau = 0.20, P = 3.76E-24, Fig. 2b, Extended Data Fig. 5b-d). These results suggested that the clonal structure at initial disease mostly persisted into recurrence.
Fig. 2 ∣. Quantifying selective pressures during glioma evolution.
a. Schematic depiction of cancer cell fraction (CCF) values during tumor evolution indicating clonality and associated relative timing. b. Comparison of PyClone clusters ranked by CCF in matched initial and recurrent tumors. c. Left: dN/dS ratio for all variants (i.e. global) in initial and recurrent tumors for each subtype. Hypermutators were not included (n = 187). Dots represent the global dN/dS ratio with associated Wald confidence intervals. Right: global dN/dS ratios for variant fractions per subtype. d. Cumulative distribution of subclonal mutations by their inverse variant allele frequency. Mutations were separated by timepoint, variant fraction, and glioma subtype. Deviation from a linear relationship, significant Kolmogorov-Smirnov P-values and R2 below 0.98 indicate selection. e. Sankey plot indicating the breakdown of SubClonalSelection evolutionary modes by subtype and therapy (n = 104). The sizes of the bands reflect sample sizes and band colors highlight the glioma subtype. Gray coloring reflects instances when treatment information was not available. f. Kaplan-Meier curve showing survival differences between IDHwt recurrent tumors demonstrating selection (n = 39) compared with neutrally evolving tumors (n = 44). Log-rank P-value is indicated.
To deepen our assessment of selective pressures, we evaluated selection in initial and recurrent tumors by determining the normalized ratio between non-synonymous and synonymous mutations (dNdScv). Higher ratios (> 1) suggest positive selection, and ratios less than one suggest negative selection . We found evidence for positive selection at both time points despite differences between subtypes (Fig. 2c). Separating mutations into mutational fractions demonstrated that shared but not private mutations showed positive dN/dS ratios in all three glioma subtypes indicating that only shared mutations (including truncal mutations) are likely subject to positive selection (Fig. 2c). The dN/dS ratio of initial-only mutations showed that these are neither positively nor negatively selected for, while recurrence-only mutations were subject to negative selection in IDHwt.
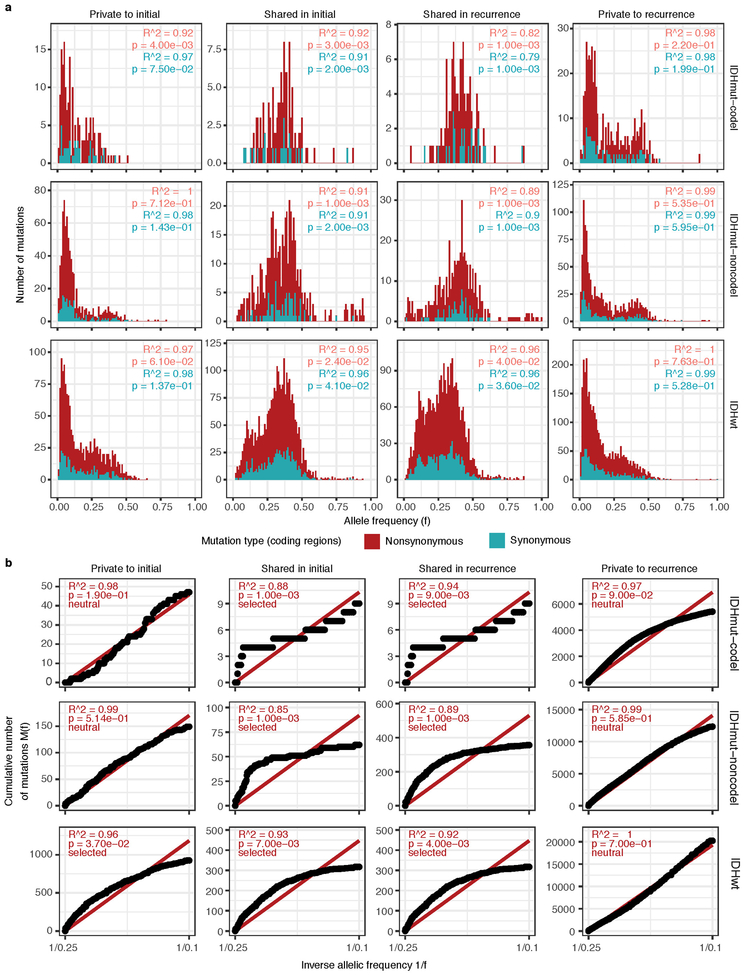
To verify the reduced selective pressure in the private mutations we used an orthogonal method to test for evidence of selection (neutralitytestr)31. The method uses variant allele frequency distributions and estimated mutation rates to detect whether profiles significantly deviate from a model of neutral evolution (i.e. as depicted by a linear relationship in Fig. 2d). In accordance with dNdScv results, private mutations demonstrated dynamics consistent with neutral evolution (Fig. 2d). Shared subclonal mutations deviated from linearity and were consistent with selection both in non-hypermutators and hypermutators (Fig. 2d, Extended Data Fig. 6a-b), providing additional evidence that the strongest selective forces occur early in gliomagenesis.
Cohort-level analysis of selection masks the heterogeneity that exists in individual evolutionary trajectories. To determine the selective effects at each tumor time point we used a Bayesian framework (SubClonalSelection) which simultaneously provides sample-specific probabilities for both selection and neutrality while modeling sources of noise in sequencing data. The classification of a sample as “selection” or “neutral” is determined by whichever model has the greater probability. Classification as “neutral” reflects the accumulation of random mutations that are not subject to selection. Given the stringent algorithm requirements, 183 patients were included in this analysis with at least one time point, and 104 patients with both time points (16 IDHmutant-codels, 29 IDHmutant-noncodels, 59 IDHwt, Supplementary Table 3). Neutral to neutral was the most common evolutionary trajectory across all three subtypes (52%), and IDHwt tumors displayed the highest observed selection at any time point with selection detected in 64% of tumors (Fisher’s exact test P = 0.01, Fig. 2e, Supplementary Table 3). IDHwt gliomas with evidence for selection at recurrence had a shorter overall survival than IDHwt gliomas classified as neutral at recurrence (P = 2.7E-02; log-rank statistic, Fig. 2f), suggesting that subclonal competition associates with more aggressive tumor behavior. To address the limitations of smaller sample sizes in the IDH-mutant subtypes, we performed a Cox proportional hazards model including age at first diagnosis, all three glioma subtypes, and mode of selection at recurrence. This analysis revealed that selection at recurrence was significantly associated with shorter survival across subtypes (HR = 1.53 95% CI 1.00–2.41, P = 4.8E-02, Supplementary Table 4). We next investigated whether radiation and chemotherapy imposed a selective effect, by comparing the evolutionary status at recurrence with treatment and other clinical variables. We did not observe significant associations between subclonal selection and radiation therapy or chemotherapy (Fisher’s exact-test P > 0.05, Supplementary Table 5), suggesting that standard therapeutic approaches for glioma have limited impact on the subclonal tumor architecture. While high-depth sequencing datasets may be required to detect subtle selective effects26, our analyses raise the possibility that the survival benefit derived from standard chemoradiation results from tumor cell elimination where treatment sensitivity of individual cells is not determined by genetic factors.
Driver alteration frequencies across time
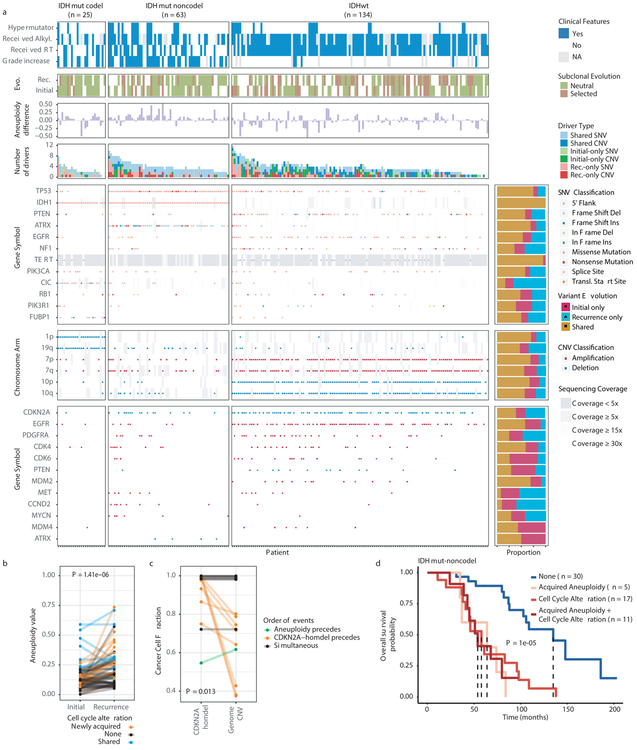
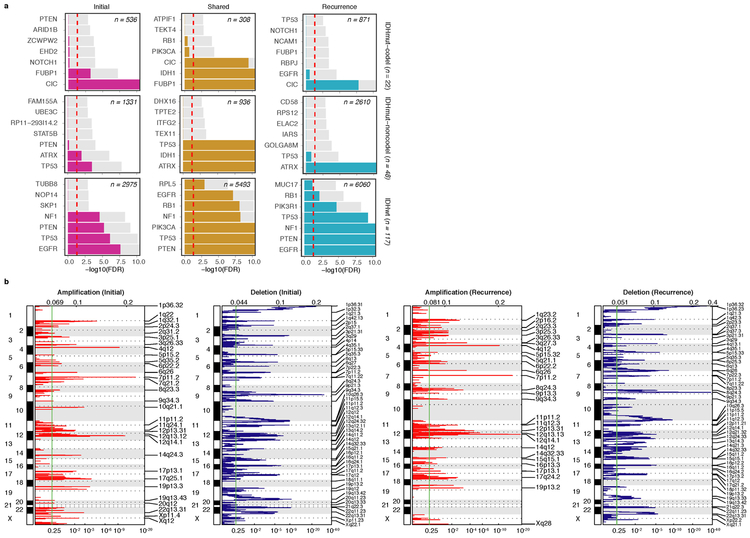
We evaluated how stability, acquisition, and loss of mutation and copy number drivers6 over time impact glioma evolution. We used dNdScv to nominate 12 candidate mutation driver genes at both time points (Q < 0.05, Fig. 3a, Extended Data Fig. 7a) and determined significant copy number alterations that recapitulated previously identified drivers (Extended Data Fig. 7b). Mutations in IDH1 and co-occurring 1p/19q chromosome-arm loss have been suggested as glioma-initiating events1, which was corroborated by the observation that these events were never lost or acquired during the surgical interval (Fig. 3a, Extended Data Fig. 8a). Similarly, we observed that TERT promoter mutations were almost always shared in the IDHmutant-codel and IDHwt, though many samples lacked sufficient coverage in this GC-rich region. Chromosome 7 gains and chromosome 10 losses were present in a large majority of IDHwt initial tumors and persisted into recurrence.
Fig. 3 ∣. Patterns of glioma driver frequencies over time.
a. Driver dynamics for SNVs nominated by the dNdScv and CNVs nominated by GISTIC (n = 222). Each column represents a single patient at two separate time points stratified by subtype and ordered left-to-right by the number of driver alterations. The degree of aneuploidy difference (recurrence – initial) offers a summary metric for increases (> 0) or decreases (< 0) in aneuploidy at recurrence. Variants are marked and different shapes indicate whether a variant was shared or private. The variant type is depicted by its color. Stacked bar plots accompanying each gene/arm provide cohort-level proportions for whether the alteration was shared, lost, or acquired. b. Aneuploidy comparison in matching initial and recurrent IDHmut-noncodel tumors. c. Within-sample CCF comparison of CDKN2A homozygous deletion (homdel) to genome-wide CCF as a proxy for aneuploidy. A relative higher CCF indicates temporal precedence. Wilcoxon signed-rank test P-value is indicated. d. Kaplan-Meier curve comparing survival in IDHmut-noncodel tumors with an alteration in the cell cycle, acquired aneuploidy, or both (shades of red) versus unaltered IDHmut-noncodel tumors (blue). Log-rank P-value is shown.
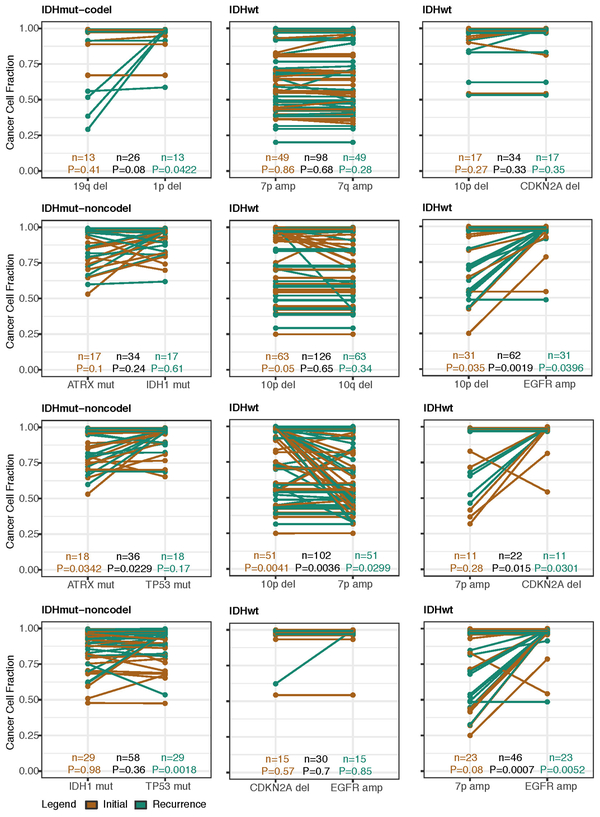
Shifts in the fraction of cancer cells harboring an event may also indicate a time dependency of drivers. We determined changes in cellular prevalence of shared driver events by ordering events in each sample by their CCF (Extended Data Fig. 9). ATRX mutations in IDHmutant-noncodel initial tumors demonstrated lower CCFs than TP53 (P = 0.03) and IDH1 (P = 0.10) mutations, suggesting IDH1 and TP53 mutations precede ATRX inactivation1. There was no difference in CCF between IDH1 and TP53 amongst initial gliomas (P = 0.98), however, IDH1 mutations demonstrated significantly lower CCFs compared with TP53 (P = 0.0018) in recurrent gliomas. We did not observe any CCF differences among driver mutations detected in IDHwt tumors at either time point. Chromosome 10 deletion CCFs were higher compared to chromosome 7 amplifications (P = 0.0036) implying that chromosome 10 deletions arise earlier 32. Similarly, there was no difference in CCF between CDKN2A deletion and EGFR amplification (P = 0.70). EGFR and chromosomal arm events significantly differed (i.e. 10p del vs EGFR amp, P = 0.0019) but not CDKN2A deletion and chromosomal events (i.e. 10p del vs CDKN2A del, P = 0.33). The consistently high CCF for EGFR amplifications could indicate that these events precede even some larger chromosomal aberrations, while not excluding the possibility that high levels of extrachromosomal EGFR 33 artificially inflate CCF.
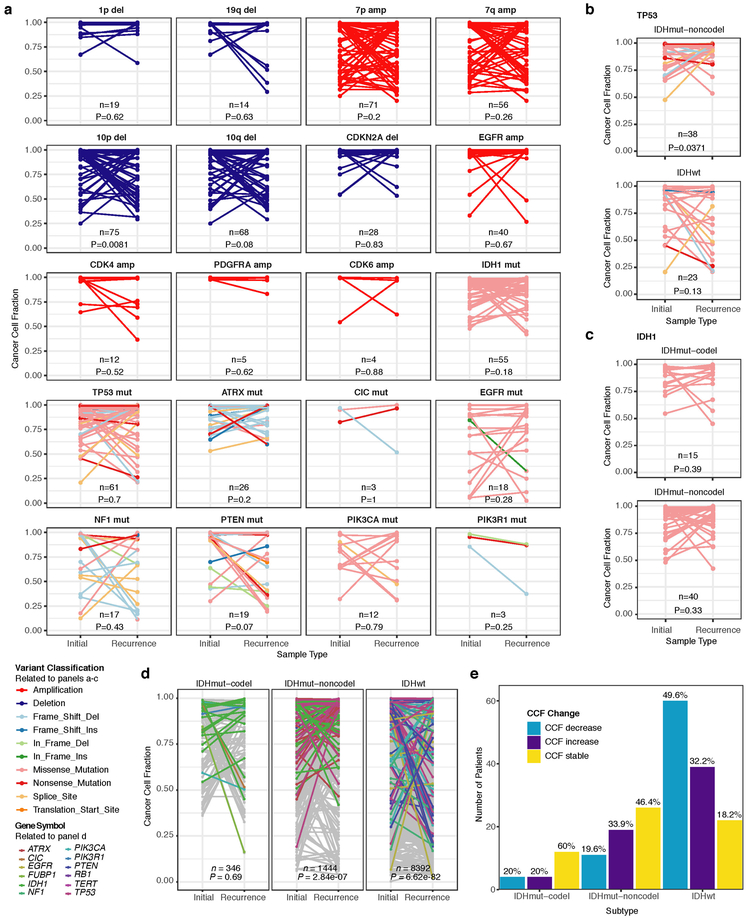
Longitudinal changes in CCF values provide additional insights into evolutionary dynamics. For instance, the CCF value may increase when a driver event is linked to clonal expansion, or conversely, decrease when a clone is outcompeted. Most individual drivers did not demonstrate significant consistent CCF changes between the initial tumor and recurrence (Extended Data Fig. 10a). A notable exception was the TP53 mutation CCF that increased over time (P = 0.037) in IDHmut-noncodels, but not IDHwt gliomas (P = 0.13, Extended Data Fig. 10b). We did not observe any differences in IDH1 CCF over time among IDHmut-noncodel tumors, possibly because the general trend of these tumors to increase in CCF is counteracted by the biological loss of relevance of mutant IDH1 over time (Extended Data Fig. 10c). Indeed, a gross comparison of all shared mutation CCFs revealed an increase in recurrent IDHmut-noncodel tumors (P < 0.0001), which may reflect increased clonality and a reduction in intratumoral heterogeneity (Extended Data Fig. 10d). In contrast, shared CCFs decreased in IDHwt tumors, potentially indicating a general increase in intratumoral heterogeneity at recurrence (P < 0.0001, Extended Data Fig. 10d). We confirmed that IDHmutant-noncodel CCF increases and IDHwt decreases were not biased by patients with high mutation burden through the classification of patient-specific shared mutation CCF change (Extended Data Fig. 10e).
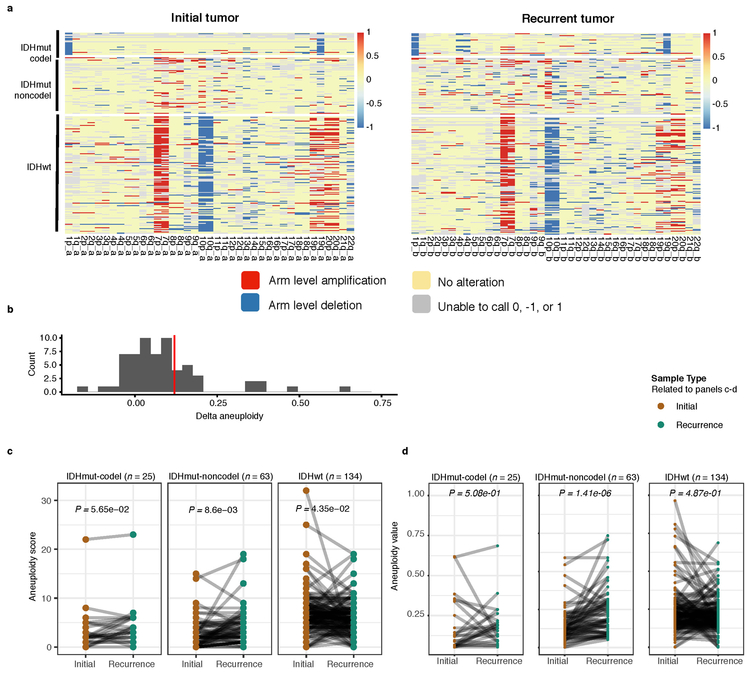
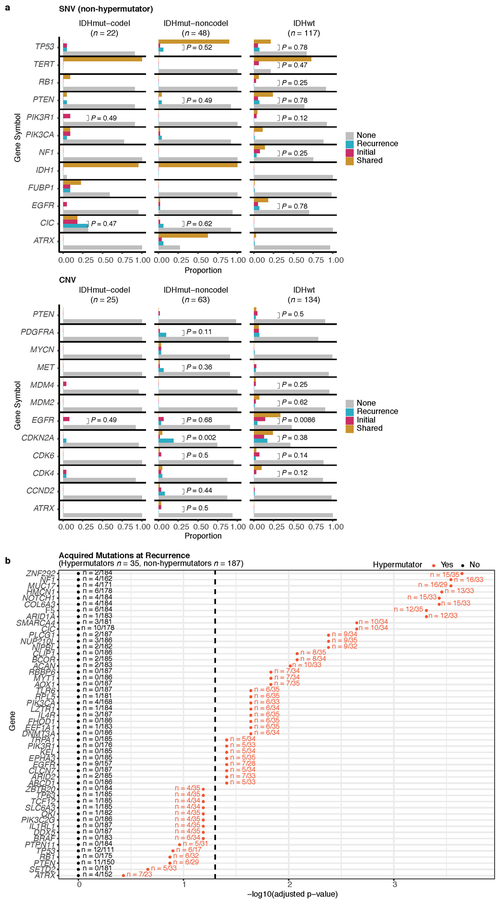
We next investigated whether specific somatic alterations were acquired or lost over time. Gene-specific enrichment of many recurrence-only mutations was found in hypermutated tumors, but there was no enrichment for somatic gene alterations in non-hypermutators suggesting that glioma recurrence is not directed by particular sets of mutations (Extended Data Fig. 8b). Within subtypes we detected an enrichment in CDKN2A homozygous deletions (Fig. 3a, Extended Data Fig. 8a) in recurrent IDHmutant-noncodels, which was corroborated by additional cell cycle gene alterations (focal gain of CCND2, CDK4, CDK6, and mutation or homozygous loss of RB1). Mutations in cell cycle checkpoint control genes are associated with genomic instability 34. Therefore, we analyzed aneuploidy levels by determining the proportion of the genome that had undergone aneuploidy events (Extended Data Fig. 11a-b). We observed that IDHmutant-noncodel tumors had a higher level of aneuploidy at recurrence (Wilcoxon rank sum test P = 1.4E-06 total aneuploidy, p = 8.6E-03 arm-level aneuploidy, Extended Data Fig. 11c-d) with tumors carrying acquired cell cycle gene alterations displaying the largest increases in aneuploidy (P = 7.6E-06; Wilcoxon rank sum test, Fig. 3b). We reasoned that CDKN2A deletions may precede aneuploidy. Homozygous CDKN2A deletions had significantly higher CCFs compared to average CNV CCF across the genome (as a surrogate for aneuploidy related copy number changes), suggesting that CDKN2A loss occurred prior to aneuploidy (Fig. 3c). These alterations may hasten disease progression as patients with either cell cycle alterations or the largest increases in aneuploidy at recurrence demonstrated significantly shorter survival than patients without these alterations (log-rank test P < 0.0001, Fig. 3d). Taken together, the persistence of drivers over time and the paucity of consistent change imply that therapy does not result in selection of specific sets of molecular changes.
Immunoediting activity in glioma
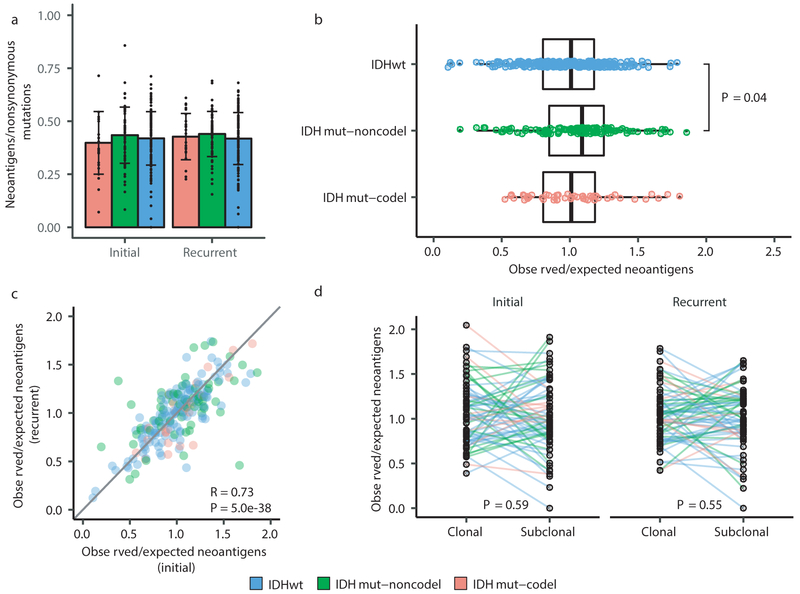
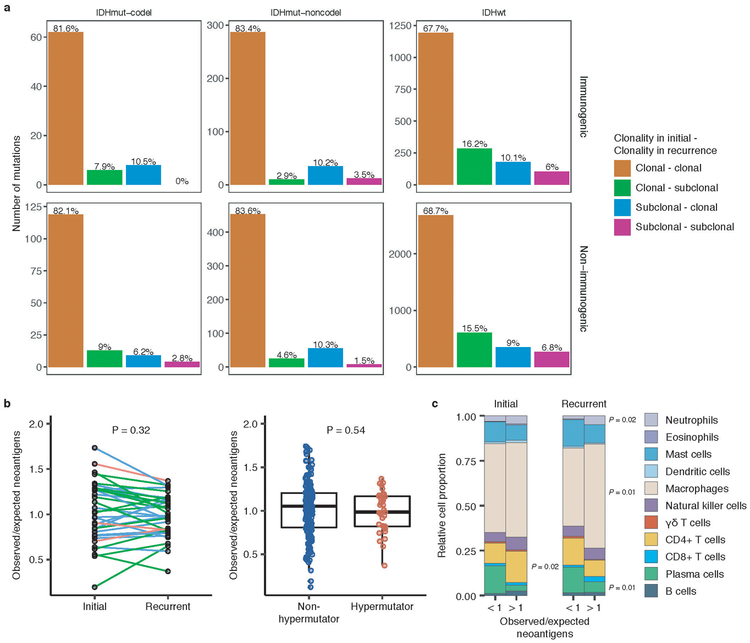
We next investigated how the immune microenvironment affects evolutionary trajectories. The immune system may prune tumor cells carrying immunogenic (neo-)antigens, resulting in the selection of subclones capable of evading the immune response. Evidence of this immunoediting process has been shown in several cancer types, including glioma 35-38, and suggests active immunosurveillance that may be therapeutically exploited 39. We computationally predicted neoantigen-causing mutations40. As expected, the neoantigen load across the GLASS cohort was strongly correlated with exonic mutation burden (Spearman’s Rho = 0.89), with 42% of nonsynonymous exonic mutations giving rise to neoantigens on average. This fraction did not significantly differ by glioma subtype or between initial and recurrent tumors (P > 0.05, Wilcoxon rank-sum test; Fig. 4a). The most common neoantigen arose from the clonal R132H mutation in IDH1 and was present in of 22 out of 88 IDH-mutant initial and recurrent tumors. Beyond mutations in IDH1, no mutations gave rise to a neoantigen found in more than three tumors at a given timepoint (Supplementary Table 6). Across the dataset, neoantigens and non-immunogenic mutations exhibited similar changes in cancer cell fractions between initial and recurrent tumors indicating a lack of neoantigen-specific selection processes over time (Extended Data Fig. 12a).
Fig. 4 ∣. Neoantigen selection during tumor progression.
a. Mean proportion of coding mutations giving rise to neoantigens (neoantigens/nonsynonymous) stratified by glioma subtype and timepoint (n = 222). Error bars represent standard deviation. b. Boxplot depicting the distribution of observed to expected neoantigen ratios in the GLASS cohort stratified by glioma subtype. P-value was calculated using the Wilcoxon rank-sum test. Each box spans quartiles, with the lines representing the median ratio for each group. Whiskers represent absolute range, excluding outliers. c. Scatterplot depicting the association between the observed-to-expected neoantigen ratio in a patient’s initial versus recurrent tumor. Each point represents a single patient. R represents Pearson correlation coefficient. Panels b and c only include samples with at least 3 neoantigens in the initial and recurrent tumors (n = 131, 63, and 24 for IDHwt, IDHmut-noncodel, and IDHmut-codel, respectively). d. Ladder plot depicting the difference in observed-to-expected neoantigen ratio between a tumor’s clonal and subclonal neoantigens. Each set of points connected by a line represents one tumor. Tumors are stratified by whether they were a patient’s initial or recurrent tumor. Lines are colored by each patient’s glioma subtype. Panel d only includes samples with at least 3 clonal neoantigens and at least 3 subclonal neoantigens in both the initial and recurrent tumors (n = 35, 20 and 9 for IDHwt, IDHmut-noncodel, and IDHmut-codel, respectively). P-value was calculated using a paired two-sided t-test. Colors in each panel represent the glioma subtype and are denoted at the bottom of the figure.
We then examined the extent to which immunoediting occurred by comparing each sample’s observed neoantigen rate to an expected rate that was empirically derived from our dataset. The output of this approach is a normally distributed set of ratios centered at 1. Samples with an observed-to-expected neoantigen ratio < 1 exhibit evidence of neoantigen depletion relative to the rest of the dataset, and thus are more likely to have been immunoedited. We found that none of the three glioma subtypes harbored observed-to-expected ratios that significantly differed from 1 (P > 0.05, one sample t-test), though IDHwt tumors exhibited significantly lower scores compared to IDHmut-noncodels (t-test, P = 0.04; Fig. 4b). We additionally did not observe an association between the observed-to-expected ratio and survival when adjusting for subtype and age (Wald test, P > 0.05), nor was there a difference between samples with neutral evolution dynamics compared to those exhibiting evidence of subclonal selection. When comparing samples longitudinally, we found that the observed-to-expected neoantigen ratio was strongly correlated between initial and recurrent tumors of each patient (Pearson’s R = 0.73, P = 5E-38), suggesting that the neoantigen depletion level in the recurrence reflects that of the initial tumor (Fig. 4c).
Immunoediting is most likely to take place in the tumors with high cytolytic activity and low levels of immunosuppressive activity38. Hypermutators, which have high neoantigen loads, have previously been associated with highly cytolytic microenvironments 37. However, we did not observe any differences in the observed-to-expected neoantigen ratio between hypermutated recurrent tumors and their initial counterparts, nor did we observe differences between hypermutated and non-hypermutated recurrent tumors, indicating that immunoediting activity is not related to the total number of mutations in a sample (Wilcoxon rank-sum test P > 0.05; Extended Data Fig. 12b). To more directly determine whether there were immunologic factors associated with neoantigen depletion, we analyzed CIBERSORT immune cell fractions from a subset of samples that had undergone expression profiling in a previous study (n = 84 from 42 tumor pairs) 37,41. Initial tumors with an observed-to-expected neoantigen ratio >1 exhibited significantly higher levels of CD4+ T cells than those with a ratio < 1, while recurrent tumors with a ratio > 1 exhibited significantly higher levels of macrophages, neutrophils, and significantly lower levels of plasma cells relative to those with ratio < 1 (P < 0.05, Wilcoxon rank-sum test; Extended Data Fig. 12c).
While we did not detect many factors associated with the observed-to-expected neoantigen ratio, we did observe that the ratio was significantly associated with the total number of unique HLA loci in a patient (Spearman’s Rho = 0.28, P = 2E-9), reflecting similar findings in lung cancer42. This may bias analyses comparing the ratio across patients. To determine whether immunoediting varies over time in a patient-agnostic manner, we compared the observed-to-expected neoantigen ratio derived from a sample’s clonal mutations, which likely arose earlier in tumor evolution, to that derived from their subclonal mutations, which likely arose later. We did not observe a significant difference in the observed-to-expected neoantigen ratio of each patient’s clonal and subclonal neoantigens, regardless of glioma subtype or whether the sample was an initial tumor or recurrence (P > 0.05, paired t-test; Fig. 4d). Together, these analyses suggest that neoantigens in glioma are not exposed to differing levels of selective pressure throughout their development.
DISCUSSION
We reconstructed the evolutionary trajectories of 222 patients with glioma to better understand treatment failures and tumor progression. The longitudinal molecular profiles revealed common features such as acquired hypermutation and aneuploidy, but highlighted the individualistic paths of post-treatment glioma evolution. Our results provide evidence that current standard of care therapies do not frequently coerce glioma down predictable paths. Instead, an unexpected number of gliomas appeared to stochastically evolve following early driver events. We expect that continuing to profile patient tumors over time using comprehensive sequencing approaches will identify additional common evolutionary paths. Our results here highlight the exciting prospects of several ongoing efforts that may inform new glioma therapies.
The observation that treatment-induced hypermutation occurred across subtypes, but did not confer a detrimental effect on patient survival leaves the clinical significance of glioma hypermutation uncertain21-24,27. Future analyses that consider the number of therapy cycles and MGMT DNA methylation status will help to elucidate factors that predispose tumors to hypermutation and identify therapies that effectively exploit this phenotype’s vulnerabilities (e.g., high mutation burden). Acquired cell cycle alterations and aneuploidy in recurrent IDHmut-noncodel gliomas also provide a rationale to target these more aggressive phenotypes with CDK inhibitors43 or with compounds that disrupt microtubule dynamics44. Finally, our analyses revealed that immunoediting activity does not vary in glioma over time, though we did observe variation between individual patients. Additional molecular and immunological data are needed to fully understand the impact this variability has on glioma evolution and to devise therapies directed at a glioma’s immunogenicity17. To this end, we found that clonal neoantigens arising from the IDH1 R132H mutation persisted from the initial tumor into the recurrence, justifying neoantigen vaccine approaches as treatments for initial and recurrent glioma45,46.
Collectively, these findings help shape our perspective on what constitutes an optimal treatment, and what approaches would result in the greatest removal or killing of glioma cells possible. Genomic characterization efforts such as TCGA have greatly increased our understanding of glioma biology, but were limited to a single snapshot in evolutionary time. The GLASS resource provides a framework to study the patterns of glioma evolution and treatment response.
Methods
Data reporting
No statistical methods were used to predetermine sample size.
DNA sequencing and data collection
The GLASS dataset consists of both unpublished and published sequencing data as outlined in Supplementary Table 1. Among the cohort were exomes from 436 glioma samples (200 patients), whole-genome from 165 glioma samples (78 patients), with overlapping exome/whole-genome data on 78 glioma samples (38 patients). A matching germline sequence was available for all patients. The dataset includes 257 sets of at least two time-separated tumor samples, seventeen standalone recurrences, and 19 patients with at least two geographically distinct tumor portions. More specifically, the dataset includes exome or whole-genome sequencing data on 211 primary gliomas, 234 first recurrences, 32 second recurrences, 11 third recurrences and one fourth recurrence (Supplementary Table 7).
Newly generated whole genome sequencing data for the Chinese University of Hong Kong (HK), Northern Sydney Cancer Centre (NS) and MD Anderson Cancer Center (MD) cohorts were subjected to 150 base paired-end sequencing. The HK samples were sequenced using a HiSeqX while the NS and MD cohorts were sequenced using a NovaSeq according to Illumina’s protocols. Whole exome capture was performed using the following platforms as reported in previous publications. Agilent SureSelect Human All Exon 50Mb capture kit was used for patients SF-0001- SF-0021, Agilent SureSelect Human All Exon V4 capture kit was used for patients SF-0024 – SF-0029 in the UC San Francisco cohort. Agilent SureSelect Human All Exon v4 or v5 was used to capture samples in the Kyoto University cohort. Samsung Medical Center cohort reported using Agilent SureSelect kit for patients SM-R056 – SM-R071, SM-R075, SM-R076, SM-R095- SM-R114 while Illumina TruSeq Exome-capture kit was used for patient SM-R072. Exome capture was performed using Agilent SureSelect Human All Exon 50 Mb in The Cancer Genome Atlas (TCGA)-GBM cohort and Agilent SureSelect Human All Exon v2.0, 44Mb kit in the TCGA-LGG cohort. Columbia University cases were captured using Agilent V3 50M kit, sequencing 90bp PE for samples R009-TP, R009R1, R011TP, R011R1, R014TP, R014R1, R017-R1, R018-R1, R019-R1. Mapping files of initial tumor and normal samples of patients R017 – R019 were obtained from TCGA through CG-hub. All other samples were captured using Agilent SureSelect XT Human All Exon v4 Kit, PE, 80M reads, 150X on target coverage. Samples in the Henry Ford Hospital cohort were multiplexed and sequenced using Illumina HiSeq 2000 by the Sequencing and Microarray Facility at an average target exome coverage of 100× using 76-bp paired-end reads. Samples in the HK cohort were subjected to 75 base paired-end sequencing for HK-0001 – HK-0004 as performed NextSeq in high output mode. In the Leeds Cohort (LU) SureSelectXT V5 kit (PE100) was used to construct exome libraries. Illumina TruSeq Exome capture kit was used for samples at the Medical University of Vienna – CeMM.
GLASS identifiers
A GLASS barcode system was created, based on TCGA barcode design, in an effort to de-identify patient information and provide an organized framework for the different pieces of the dataset.
GLASS barcodes are composed of 24 characters. The first four characters specify the project (either GLSS or TCGA). All datasets submitted to the GLASS consortium, published and unpublished, were given the GLSS project ID. Samples that were part of the TCGA cohorts (TCGA GBM and TCGA LGG) were given a TCGA designation. The next two characters designate the center where the samples were either acquired or sequenced (Supplementary Table 7). This is followed by the four-character center specific patient identification that was kept as close as possible to the patient identification provided by the collaborators to allow a simplified trace back process. Patient data is divided by a relative sample type, such as initial tumor (TP), recurrent tumor (R1), normal tissue (NB, NM, etc), or metastatic tumor sample (M1). If there was more than one recurrence the relative number was specified following “R”. Some patients had surgeries for which a biospecimen was unavailable. Thus, a surgical number was also provided to indicate temporal ordering (Supplementary Table 8). To include spatially separated samples the portion designation was added, which is followed by one character specifying the type of analyte, either DNA (D) or RNA (R). As there is variation in the sequencing analysis, a three-character designation represents either whole genome (WGS) or whole exome sequencing (WXS). The last part of the GLASS barcode is a six-character designation unique to each barcode that was randomly generated.
Computational pipelines
All pipelines were developed using snakemake 5.2.2 47. Unless otherwise stated, all tools mentioned are part of the GATK 4 suite 48. All data was collected at a central location (The Jackson Laboratory) and was analyzed using homogenous pipelines capable of processing both raw fastq files as well as re-process previously analyzed bam files.
Alignment and pre-processing
Data pre-processing was conducted in accordance to the GATK Best Practices using GATK 4.0.10.1. Briefly, aligned BAM files were separated by read group, sanitized and stripped of alignments and attributes using ‘RevertSam’, giving one unaligned BAM (uBAM) file per readgroup. Uniform readgroups were assigned to uBAM files using ‘AddOrReplaceReadgroups’. Similarly, unaligned fastq files were assigned uniformly designated readgroup attributes and converted to uBAM format using ‘FastqToSam’. uBAM files underwent quality control using ‘FastQC 0.11.7’. Sequencing adapters were marked using ‘MarkIlluminaAdapters’. uBAM files were finally reverted to interleaved fastq format using ‘SamToFastq’, aligned to the b37 genome (‘human_g1k_v37_decoy’) using ‘BWA MEM 0.7.17’, attributes were restored using ‘MergeBamAlignment’. ‘MarkDuplicates’ was then used to merge aligned BAM files from multiple readgroups and to mark PCR and optical duplicates across identical sequencing libraries. Lastly, base recalibration was performed using ‘BaseRecalibrator’ followed by ‘ApplyBQSR’. Coverage statistics were gathered using ‘CollectWgsMetrics’. Alignment QC was performed running ‘ValidateSamFile’ on the final BAM file and QC results were inspected using ‘MultiQC 1.6a0’ 49. A haplotype database for fingerprinting was generated using a modified version of the code on https://github.com/naumanjaved/fingerprint_maps. The tool ‘CrosscheckFingerprints’ was used to confirm that all readgroups within a sample belong to the same individual, and that all samples from one individual match. Any mismatches were marked and excluded from further analysis.
Variant detection
Variant detection was performed in accordance to the GATK Best practices using GATK 4.1.0.0. Germline variants were called from control samples using Mutect2 in artifact detection mode and pooled into a cohort-wide panel of normals. Somatic variants were subsequently called in individual tumor samples (single-sample mode) and in entire patients using GATK 4.1 Mutect2 in multi-sample mode. Mutect2 was given matched control samples, the aforementioned panel of normals and the gnomAD germline resource as additional controls. Cross-sample contamination was evaluated using ‘GetPileupSummaries’ and ‘CalculateContamination’ run for both tumor and matching control samples. Read orientation artifacts were evaluated using ‘CollectF1R2Counts’ and ‘LearnReadOrientationModel’. Somatic likelihood, read orientation, sequence context, germline and contamination filters were applied using ‘FilterMutectCalls’.
Variant post-processing
BCFTools 1.9 was used to normalize, sort and index variants50. A consensus VCF was generated from all variants in the cohort, removing any duplicate variants. The consensus VCF file was annotated using GATK 4.1 Funcotator and the v1.6.20190124s annotation data source. Allele frequencies (AFs) from multi-sample Mutect2 were used to compare AFs between related samples. Multi-sample Mutect2 calls and filters mutations across a patient as a whole and does not determine mutation calls in a single samples. Single-sample mutation calls were overlaid on the multi-sample calls to infer whether variants were called in individual samples. Single-sample called variants that were not present in the multi-sample callset were discarded.
Mutational burden
Mutational burden was calculated as the number of mutations per megabase (Mb) sequenced. A minimum coverage threshold of 15x was required for each base. DNA hypermutation was defined for recurrent tumors with greater than 10 mutations per Mb sequenced as these values were considered outliers (1.5 times the interquartile range above the upper quartile). Notably, there were a few initial gliomas that demonstrated a mutational frequency above 10 mutations per Mb. However, the “hypermutation” classification was restricted to only patients with this level at recurrence since these likely reflect different evolutionary paths.
Mutational signatures
The relative contributions of the COSMIC mutational signatures were determined from a patient’s initial-only, recurrence-only, and shared mutations by solving the non-negative-least squares (NNLS) problem for each set of mutations using the 30 signatures from version 2 (March 2015). Six signatures were dominantly enriched in at least 3% of the fractions and we resolved the NNLS using the reduced six-signature model to increase accuracy and reduce noise.
Copy number segmentation
Copy number identification was performed according to the GATK Best Practices and is outlined briefly here. The pipeline differs slightly for whole genomes and whole exomes. For genomes, the genome was segmented into 10kb bins using ‘PreprocessIntervals’. For exomes, overlapping regions between several commonly used capture kits (Broad Human Exome b37, Nextera Rapid Capture, TruSeq Exome, SeqCap EZ Exome V3, Agilent SureSelect V4, Agilent SureSelect V7) were identified using ‘bedtools multiIntersectBed’. The tool ‘PreprocessIntervals’ was used to apply 1kb padding and to merge overlapping intervals. In parallel, ‘SelectVariants’ was used to subset the gnomAD resource of germline variants to variants with a population AF greater than 5%. Next, ‘CollectReadcounts’ was used to count reads in the bins generated by ‘PreprocessIntervals’ separately for autosomes and allosomes. In parallel, ‘CollectAllelicCounts’ was used to count reference and alternate reads at gnomAD variant sites with a population AF greater than 5%. The cohort was subsequently split into batches determined by sequencing center and ‘CreateReadCountPanelOfNormals’ was used to create a panel of normal (PON) for each batch. PONs were created separately for allosomes and autosomes, and allosomes were separated further by sex. To further improve the panel of normals, GC content annotation of each interval as determined by ‘AnnotateIntervals’ were given. Next, ‘DenoiseReadCounts’ was used to denoise the binned readcounts output by ‘CollectReadCounts’, given a PON determined by batch, chromosomes (allosomes or autosomes) and sex. Denoised copy ratios were plotted and inspected for quality concerns using ‘PlotDenoisedCopyRatios’. The tool ‘ModelSegments’ is an implementation of a gaussian-kernel binary-segmentation algorithm and was used to merge contiguous segments and assign copy and allelic ratios. The results of this segmentation were plotted using ‘PlotModeledSegments’ and inspected for quality concerns.
Copy number calling
A copy number caller loosely based on GATK ‘CallCopyRatioSegments’ (which in turn is based off of ReCapSeg) and GISTIC was implemented to call both arm-level and high-level copy number changes, respectively51,52.
Segments (from ‘ModelSegments’) with a non-log2 copy ratio between 0.9 and 1.1 were determined to be neutral. These segments were then weighted by length and a weighted mean and standard deviation (sd) non-log2 copy ratio (once-filtered) were determined again. Outlier segments are removed and once again a weighted mean and sd non-log2 copy ratio (twice-filtered) were determined. Segments with a non-log2 copy ratio between 0.9 and 1.1 and segments within two standard deviations of the twice-filtered mean were determined to be neutral, and segments outside of these boundaries were determined to have a low-level amplification or deletion, depending on the direction.
The weighted mean and sd of the non-log2 copy ratio (once-filtered) was then determined individually for each chromosome arm. Outlier segments were removed and the weighted mean and sd of the non-log2 copy ratio (twice-filtered) was determined again. In order to determine a high-level amplification and deletion threshold, the most highly amplified and deleted chromosome arms were selected, respectively. The twice-filtered mean plus (high level amplification) or minus (high level deletion) two times the sd of the selected arms were used as high-level thresholds.
Gene level copy number were called by intersecting the gene boundaries with the segment intervals and by calculating the weighted non-log2 copy ratio for that gene. The copy number call for that gene was then determined by comparing the gene-level non-log2 copy ratio to the previously determined thresholds.
dNdScv
The R package dNdScv53 (https://github.com/im3sanger/dndscv) was run using the default and recommended parameters for all mutations in initial tumor samples, recurrent tumor samples, and for each mutational fraction (unique to initial, unique to recurrent and shared). All analyses were conducted separately within the three main tumor subtypes.
Aneuploidy calculation
The most reductive metric of aneuploidy was computed by taking the size of all non-neutral segments divided by the size of all segments. The resulting aneuploidy value indicates the proportion of the segmented genome that is non-diploid.
In parallel, an arm-level aneuploidy score modeled after a previously described method was computed54. Briefly, adjacent segments with identical arm-level calls (−1, 0 or 1) were merged into a single segment with a single call. For each merged/reduced segment, the proportion of the chromosome arm it spans was calculated. Segments spanning greater than 80% of the arm length resulted in a call of either −1 (loss), 0 (neutral) or +1 (gain) to the entire arm, or NA if no contiguous segment spanned at least 80% of the arm’s length. For each sample the number of arms with a non-neutral event was finally counted. The resulting aneuploidy score is a positive integer with a minimum value of 0 (no chromosomal arm-level events detected) and a maximum value of 39 (total number of autosomal chromosome arms excluding the short arms for chromosomes 13, 14, 15, 21, and 22).
Estimates of evolutionary pressures
Evolutionary pressures were evaluated both by variant status and glioma subtype using the neutralitytestr algorithm as previously described (R-package: neutralitytestr version: 0.0.2, https://github.com/marcjwilliams1/neutralitytestr)31. Individual variant allele frequency vectors were merged at the level of glioma subtype by variant status. Only mutations found in copy-neutral regions should were included in these analyses. For all else, default parameters were used. Merged VAF distributions were deemed to be selected when the neutral null hypothesis was rejected using several metrics. Tests for neutrality required that both R2 values < 0.98 and the area between the two curves of 1) merged VAF data and 2) a normalized distribution expected under neutrality to be significantly different.
The SubclonalSelection algorithm was applied to GLASS mutation data to measure the selection strength in individual tumor samples (Julia package: SubclonalSelection, https://github.com/marcjwilliams1/SubClonalSelection.jl)16. Patients that had samples at both timepoints with a TITAN-defined purity estimate >= 0.5 and >= 25 subclonal mutations in non-diploid regions were included. Mean coverage across all mutations was used as the “read_depth” input parameter and the model was run with the recommended 106 iterations and 1000 particles. Samples were classified as neutral or selected based on the model that had the highest probability, in line with the prior applications to TCGA data16. Classification based on the highest model probability yielded stable results there was not a significant change in proportions when setting a higher classification probability threshold (P > 0.05, Pearson’s Chi-square test, for both probability thresholds of 0.6 and 0.7). At all three probability thresholds (0.5, 0.6, and 0.7), Kaplan-Meier survival analyses between selection at recurrence and overall survival continued to indicate that patients with IDHwt tumors that were selected had a worse overall survival (P = 0.03 (n=81), P = 0.01 (n=66), P = 0.01 (n=56) respectively).
Mutation clonality
Each patient’s clonal architecture was inferred using PyClone (version 0.13.1) by grouping SNVs into clonal clusters (https://github.com/aroth85/pyclone)55. The patient-level input mutation matrix was reduced by limiting to sites with at least 30x coverage across all samples. PyClone was subsequently ran using a binomial density model, connected initiation, and 10000 iterations. Sample purities were provided for each patient and parental copy number (minor and major allele counts) from TITAN were given. PyClone results were post-processed using a burn-in of 1000, thin of 1, minimum cluster size of 2 and a maximum number of clusters per patient of 12. Individual mutations were determined to be clonal if the PyClone cancer cell fraction (CCF) values were >= 0.5, subclonal for mutations with CCF >= 0.1 and CCF <0.5, mutations were considered non-clonal when CCF < 0.1 as previously described 56.
CNV clonality
Allele specific copy number, tumor purity and ploidy estimates were derived using a probabilistic model (TITAN, version 1.19.1) for both whole genome and whole exome sequencing samples 57. TITAN was supplied with the tumor denoised readcounts output by GATK DenoiseReadCounts and the tumor allelic counts at loci found to be heterozygous in control samples output by ModelSegments. An ‘alphaK’ (and ‘alphaKHigh’) parameter of 2500 and 10000 was used for exomes and genomes, respectively. The patient sex was provided in order to improve fitting allosomes. For each tumor-control pair TITAN was ran assuming an initial ploidy of two or three, and assuming 1 to 3 clusters, resulting in a total of six possible solutions per tumor/control pair. To select the optimal solution, TITAN’s internal selectSolution function was used with a threshold of 0.15 giving additional weight to diploid solutions.
Timing analysis
The CCF values output by TITAN or PyClone were used for separately timing copy number changes or mutations. To time specific copy number changes in genes, the average CCF for that gene was calculated. When timing mutations in genes, the highest CCF amongst the non-synonymous mutations was taken.
Neoantigen analyses
Neoantigens in this analysis were defined as all 8–11-mer peptides that arose from an exonic nonsynonymous SNV or indel and bound their respective patient’s HLA class I molecules at a binding affinity score (IC50) that was ≤ 500 nM and better than or equal to the wild-type form of the peptide. Each patient’s 4-digit HLA class I types were inferred using OptiType (version 1.3.1, https://github.com/FRED-2/OptiType) run on each patient’s matched normal sample58. VCF files for each tumor sample were annotated using Variant Effect Predictor (ensembl) with the Downstream and Wildtype plugins. Neoantigens from these VCFs were then called using pVACseq (version 4.0.10, https://github.com/griffithlab/pVAC-Seq)40 run using netMHCpan (version 2.8, http://www.cbs.dtu.dk/services/NetMHCpan-2.8/)59. For each pVACseq run, epitope length was set to 8, 9, 10, or 11, minimum binding affinity fold-change was set to 1, and downstream sequence length was set to full, with default parameters used for all other settings.
Downstream neoantigen analyses were performed using the pVACseq output linked to its respective mutation information. Neoantigen-causing mutations were defined as all mutations that gave rise to at least one neoantigen. The observed-to-expected neoantigen ratio was calculated using a previously developed approach that compares each tumor’s observed neoantigen rate to an empirically derived expected rate that assumes no selection against neoantigen-causing mutations38: From the gold set samples in the GLASS cohort (n = 222), define to be the expected number of nonsynonymous missense SNVs per synonymous SNV with trinucleotide context s. is then defined as the expected number of neoantigen-generating missense SNVs per nonsynonymous missense SNV with trinucleotide context s. For a given sample i, define Yi as the sample’s set of synonymous SNVs and s(m) to be a synonymous SNV with trinucleotide context m. The expected number of nonsynonymous missense SNVs, Npred, and neoantigen-causing mutations, Bpred, can then be calculated as follows:
To obtain sample i’s final neoantigen depletion ratio Ri, the observed number of neoantigen-causing mutations in the sample, Bobs,i is divided by the sample’s observed number of nonsynonymous missense SNVs, Nobs,i, and then this ratio is divided by the ratio of Bpred,i and Npred,i. Thus:
For analyses examining clonal/subclonal neoantigen ratios, the observed and expected numbers were calculated by subsetting a sample’s SNVs by the respective criteria and then recalculating the ratio as described above. To mitigate overfitting, all analyses presented here utilized samples from patients with at least 3 neoantigen-causing mutations in their primary and recurrent tumors.
Immune cell analyses
CIBERSORT relative immune cell fraction data used in downstream neoantigen analyses were downloaded from a previous publication37.
Statistical methods
All data analyses were conducted in R 3.4.2, Python 2.7.15, PostgreSQL 10.5, and Julia 0.7. All survival analyses including Kaplan-Meier plots and Cox proportional hazards models were conducted using the R packages survival and survminer.
Data availability
All deidentified, non-protected access somatic variant profiles and clinical data are accessible via Synapse (http://synapse.org/glass). Raw data of the various sequencing datasets can be obtained per the overview provided in the Supplement.
Code availability
All custom scripts and pipelines are available on the project’s github page (https://github.com/TheJacksonLaboratory/GLASS).
Extended Data
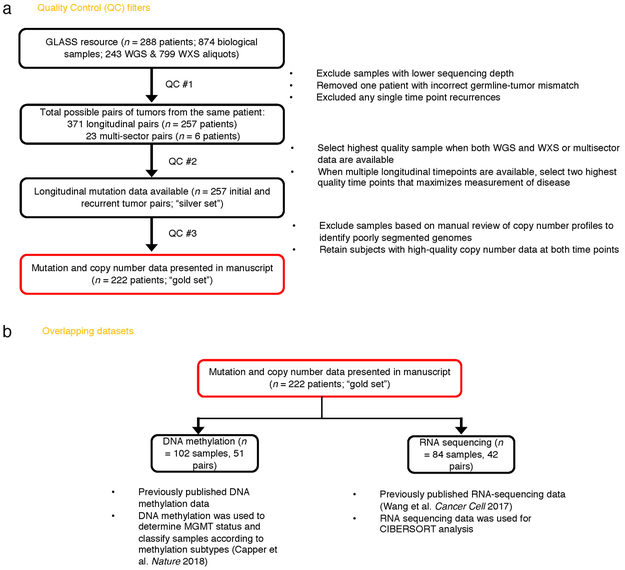
Extended Data Fig. 1 ∣. Sample Selection.
a. Quality control workflow steps identifying all GLASS samples available as a resource and the identification of the highest quality set of patient pairs (n = 222) used for the presented mutational and copy number analyses. b. Additional available datasets.
Extended Data Fig. 2 ∣. Mutation burden by time point and subtype.
a. Boxplots and paired lines depicting coverage adjusted mutation frequencies in initial and matched recurrent samples across three subtypes. Wilcoxon signed-rank test P-values and sample sizes are indicated. b. Bee swarm plot depicting coverage adjusted mutation frequencies in fractions by subtype. Dashed line indicates the mean. One-way ANOVA P-values comparing three subtypes are indicated. c. Scatter plot showing the relationship between age at diagnosis and coverage adjusted mutation burdens by subtype and fraction. Linear model P-values are indicated and were adjusted by subtype. d. Similar to the analysis presented in c, but showing the relationship between time to recurrence and coverage adjusted mutation burdens.
Extended Data Fig. 3 ∣. Mutational signatures by fraction and subtype.
a. Correlation plot showing the Pearson’s chi-squared (X2) residuals for each signature by fraction and subtype. A X2 was performed for each subtype and P-values are indicated. Positive residuals (blue) indicate a positive correlation, whereas negative residuals (red) indicate an anticorrelation. The point size reflects the contribution to X2 estimate. b. The same ordered of patients as Fig. 1a along with relevant clinical information is provided alongside the fraction-specific mutational signatures. PyClone mutational clusters are also presented.
Extended Data Fig. 4 ∣. Hypermutator clonality.
a. Bar plots represent counts of recurrence-only mutations per hypermutator tumor that were known to receive alkylating agent therapy and were successfully run through the PyClone algorithm. Colors indicate mutation clonality and color intensity indicates whether the mutations resulted in coding changes. b. Kaplan-Meier curve comparing alkylating agent-treated patients with IDHmut-noncodel hypermutator tumors that were predominantly clonal (n = 8), predominantly subclonal (n = 7), versus IDHmut-noncodel non-hypermutators known to be treated with alkylating agents and had available PyClone data (n = 17). Log-rank P-value is shown.
Extended Data Fig. 5 ∣. Clonal structure evolution over time.
a. The minimum cancer cell fraction of the most persistent (shared between initial and recurrence) PyClone cluster. b. Comparison of PyClone clusters ranked by CCF in matched initial and recurrent tumors, as Fig. 2b but separated by subtype. c-d. Examples of cluster CCF dynamics over time in three separate samples, including (c) two multi-timepoint samples (d) and one multi-sector sample. These additional data are available in the GLASS resource, but only two time-separated samples were used throughput the manuscript to ensure clarity.
Extended Data Fig. 6 ∣. Variant allele fraction distribution.
(a) Non-hypermutator variant allele fraction distributions for copy neutral variants in coding regions (n = 181 patients). Variants are separated by subtype, fraction, and also whether the variant was non-synonymous or synonymous mutation in a coding region. R2 goodness-of-fit measure and associated P-values are shown for both mutation types. Note that this data considers only the coding portion of genome while Fig. 2d presents both coding and non-coding. (b) The cumulative distribution of the subclonal mutations in copy-neutral regions for hypermutators (n = 31 patients). For each variant fraction and subtype, the R2 goodness-of-fit measure and P-values are shown.
Extended Data Fig. 7 ∣. Driver gene nomination.
a. Local (gene-wise) dNdScv estimates by subtype (rows) and fraction (columns). Genes are sorted by Q-value and P-value. The Q-value is shown in color, whereas the P-value is indicated in light gray. The Q-value threshold of 0.05 is indicated by a horizontal red line. b. GISTIC significant amplification (red) and deletion (blue) plots in initial (left) and recurrent tumors (right). Chromosomal locations are ordered on the y-axis, Q-values are shown on the x-axis, and selected drivers are indicated by their chromosomal location on the right.
Extended Data Fig. 8 ∣. Driver acquisition over time.
a. Tabulated numbers of SNV (top) and CNV (bottom) driver events that were shared, initial-only, or recurrence-only. P-values were obtained using a two-sided Fisher test comparing the initial-only fraction to the recurrence-only fraction testing for acquisition. b. One-sided Fisher test comparing the initial-only fraction to the recurrence-only fraction amongst previously implicated glioma drivers testing for driver acquisition. P-values were adjusted for multiple testing using the FDR (x-axis). Hypermutators (red) and non-hypermutators (black) were separately analyzed.
Extended Data Fig. 9 ∣. Intra-tumor CCF comparison.
Ladder plots comparing the CCF of co-occurring drivers in single tumor samples. The color of the lines and points indicates whether the sample shown is an initial (brown) or recurrent (green) tumor. Two-sided Wilcoxon rank-sum test P-values are shown for all initial samples, all recurrent samples, as well as all samples (black).
Extended Data Fig. 10 ∣. Between time point intra-patient CCF comparison.
a. Driver-gene CCF comparison between initial and matched recurrences. Lines are colored by variant classification. Two-sided Wilcoxon rank-sum test P-values are shown. b. TP53 CCF by subtype, otherwise as in (a). c. IDH1 CCF by subtype, otherwise as in (a). d. Ladder plot visualizing CCF change across all SNVs between initial and recurrent tumors, separated by subtype. Wilcoxon rank-sum test was used to test for differences between time points. e. Initial and recurrent mutations in each patient were compared using a Wilcoxon rank-sum test. Bar plot with counts of patients in each subtype are shown. Patients lacking significant change are shown in yellow, those with a significant increase or decrease are shown in dark and light blue, respectively.
Extended Data Fig. 11 ∣. Aneuploidy calculation.
a. Heatmap displaying the chromosomal arm-level events (x-axis) with patients represented in each row. Patients are placed in the same order for both the initial (left) and recurrence (right). White space was inserted as a break between the three subtypes. b. Distribution of total aneuploidy difference. Acquired aneuploidy determination (upper-quartile) indicated with a red line. c. Comparison of aneuploidy score between initial and recurrent tumors separated by subtype d. As (c), comparing aneuploidy value.
Extended Data Fig. 12 ∣. Neoantigen evolution and cellular analysis.
a. Bar plots representing the number of shared mutations that give rise to neoantigens (top row, “immunogenic”) and those that do not give rise to neoantigens (bottom row, “non-immunogenic”) stratified by longitudinal clonality (“(clonality in initial)-(clonality in recurrence)”) and further separated by subtype. Percentage of longitudinal clonality per subtype and mutation immunogenicity are presented above the respective bars. b. Left: Ladder plot depicting the difference in observed-to-expected neoantigen ratio between the initial and recurrent tumors of patients with hypermutated tumors at recurrence. Each set of points connected by a line represents one tumor (n = 70). Right: Boxplot depicting the distribution of observed to expected neoantigen ratios in recurrent tumors stratified by hypermutator status (n = 35 and 183 for hypermutators and non-hypermutators, respectively). Each box spans quartiles, with the lines representing the median ratio for each group. Whiskers represent absolute range, excluding outliers. P-values for panel b were calculated using a paired and unpaired two-sided t-test, respectively. c. Stacked bar plots depicting the average relative fraction of 11 CIBERSORT cell types in the neoantigen depleted (< 1) and non-depleted (> 1) initial and recurrent tumor subgroups. Asterisks to the right of each plot indicate a significant difference (P < 0.05, Wilcoxon rank-sum test) between the depleted and non-depleted groups for the noted cell type at that time.
Supplementary Material
ACKNOWLEDGEMENTS
This work is dedicated to the memory of Simone Bischoff-Lardenoije and is made possible by the patients and their families whom generously contributed to this study. This work is supported by the National Brain Tumor Society, Oligo Research Fund; Cancer Center Support grants P30CA16672 and P30CA034196; Cancer Prevention & Research Institute of Texas (CPRIT) grant number R140606; Agilent Technologies (R.G.W.V.); the National Institutes of Health- National Cancer institute for the following grants: NCI CA170278 (L.M.P., M.M.T., N.H.), NCI R01CA222146 (L.M.P, N.H.), NCI R01CA230031 (J.H.C., J.N.), NCI R01CA188288 (J.S.B., R.B., P.B., K.L.L., A.C., A.E.S.), R01CA179044 (Antonio Iavarone), U54CA193313 (Antonio Iavarone). The National Brain Tumor Society (W.K.A.Y.; J.D.G). Brain Tumour Northwest tissue bank (including the Walton research tissue bank) is supported by the Sidney Driscol Neuroscience Foundation and part of the Walton Centre and Lancashire Teaching Hospitals NHS Foundation Trusts (A.B., M.D.J.). This work was supported by a generous gift from the Dabbiere family (J.F.C.). Support is also provided by a Leeds Charitable Foundation grant (9R11/14‐11 to LFS), University of Leeds Academic Fellowship (11001061) (L.F.S.) and Studentship (11061191) (G.T.) as well as Leeds Teaching Hospitals NHS Trust (Aruna Chakravarti, Azzam Ismail). The Leeds Multidisciplinary Research Tissue Bank staff was funded by the PPR Foundation and The University of Leeds (S.C.S.). Funds were received from The Brain Tumour Charity (C.W., Grants 10/136 & GN-000580, B.A.W., 200450). G.T. is funded by EKFS 2015_Kolleg_14. R01CA218144 (P.S.L, E.J.C, J.C. A.K.L.) and Strain for the Brain, Milwaukee, WI (P.S.L, E.J.C, J.C. A.K.L.). E.K is recipient of an MD-Fellowship by the Boehringer Ingelheim Fonds and is supported by the German National Academic Foundation. The Leeds Multidisciplinary Research Tissue Bank staff was funded by the PPR Foundation and part of the University of Leeds (S.C.S.). GLASS-Austria was funded by the Austrian Science Fund project KLI394 (A.W.). GLASS-Germany was funded by the German Ministry of Education and Research (BMBF) 031A425 (G.R., P.L.) and German Cancer Aid (DKH) 70–3163-Wi 3 (M.W.). GLASS-NL receives support from KWF/Dutch Cancer Society project11026 (MCMK, PW, RGWV, PJF, JMN, MS, BAW). We thank the University of Colorado Denver Central Nervous System Biorepository (D.R.O.) for providing tissue samples. Sponsoring was also received from the National Institute of Neurological Disorders and Stroke (NINDS R01NS094615, R.G.), National Health and Medical Research Council project grant (A.M.D.). F.S.V. is supported by a postdoctoral fellowship from The Jane Coffin Childs Memorial Fund for Medical Research. F.P.B. is supported by the JAX Scholar program and the National Cancer Institute (K99 CA226387); K.C.J. is the recipient of an American Cancer Society Fellowship (130984-PF-17–141-01-DMC). We thank the Jackson Laboratory Clinical and Translation Support team for coordinating all data transfer agreements. We thank Matt Wimsatt for assistance in graphic design.
Footnotes
CONFLICTS OF INTEREST
R.G.W.V. declares equity in Boundless Bio, Inc. M.K. receives research grants from BMS and ABBVie. P.K.B. is a consultant for Lilly, Genentech-Roche, Angiochem and Tesaro. P.K.B. receives institutional funding from Merck and Pfizer and honoraria from Merch and Genentech-Roche. W.K.A.Y serves in a consulting or advisory role at DNAtrix Therapeutics. M.W. receives funding from Acceleron, Actelion, Bayer, Isarna, Merck, Sharp & Dohme, Merck (EMD, Darmstadt), Novocure, OGD2, Pigur and Roche as well as honoraria from BMS, Celldex, Immunocellular Therapeutics, Isarna, Magforce, Merck, Sharp & Dohme, Merck (EMD, Darmstadt), Northwest Biotherapeutics, Novocure, Pfizer, Roche, Teva and Tocagen. G.R. receives funding from Roche and Merck (EMD, Darmstadt) as well as honoraria from AbbVie. M.S. is a central reviewer for Parexel Ltd and honoraria are paid to the institution. G.T. reports personal fees from Bristol-Myers-Squibb, personal fees from AbbVie, personal fees from Novocure, personal fees from Medac, travel grants from Bristol-Myers-Squibb, education grants from Novocure, research grants from Roche Diagnostics, research grants from Medac, membership in the National Steering board of the TIGER NIS (Novocure) and the International Steering board of the ON-TRK NIS (Bayer).
References
- 1.Barthel FP, Wesseling P & Verhaak RGW Reconstructing the molecular life history of gliomas. Acta Neuropathol 135, 649–670, doi: 10.1007/s00401-018-1842-y (2018). [DOI] [PMC free article] [PubMed] [Google Scholar]
- 2.Sturm D et al. Paediatric and adult glioblastoma: multiform (epi)genomic culprits emerge. Nat Rev Cancer 14, 92–107, doi: 10.1038/nrc3655 (2014). [DOI] [PMC free article] [PubMed] [Google Scholar]
- 3.Bettegowda C et al. Mutations in CIC and FUBP1 contribute to human oligodendroglioma. Science 333, 1453–1455, doi: 10.1126/science.1210557 (2011). [DOI] [PMC free article] [PubMed] [Google Scholar]
- 4.Zheng S et al. A survey of intragenic breakpoints in glioblastoma identifies a distinct subset associated with poor survival. Genes Dev 27, 1462–1472, doi: 10.1101/gad.213686.113 (2013). [DOI] [PMC free article] [PubMed] [Google Scholar]
- 5.Cancer Genome Atlas Research, N. Comprehensive genomic characterization defines human glioblastoma genes and core pathways. Nature 455, 1061–1068, doi: 10.1038/nature07385 (2008). [DOI] [PMC free article] [PubMed] [Google Scholar]
- 6.Ceccarelli M et al. Molecular Profiling Reveals Biologically Discrete Subsets and Pathways of Progression in Diffuse Glioma. Cell 164, 550–563, doi: 10.1016/j.cell.2015.12.028 (2016). [DOI] [PMC free article] [PubMed] [Google Scholar]
- 7.TCGA_Network et al. Comprehensive, Integrative Genomic Analysis of Diffuse Lower-Grade Gliomas. N Engl J Med 372, 2481–2498, doi: 10.1056/NEJMoa1402121 (2015). [DOI] [PMC free article] [PubMed] [Google Scholar]
- 8.Verhaak RG et al. Integrated genomic analysis identifies clinically relevant subtypes of glioblastoma characterized by abnormalities in PDGFRA, IDH1, EGFR, and NF1. Cancer Cell 17, 98–110, doi: 10.1016/j.ccr.2009.12.020 (2010). [DOI] [PMC free article] [PubMed] [Google Scholar]
- 9.Yan H et al. IDH1 and IDH2 mutations in gliomas. N Engl J Med 360, 765–773, doi: 10.1056/NEJMoa0808710 (2009). [DOI] [PMC free article] [PubMed] [Google Scholar]
- 10.Louis DN et al. International Society Of Neuropathology--Haarlem consensus guidelines for nervous system tumor classification and grading. Brain Pathol 24, 429–435, doi: 10.1111/bpa.12171 (2014). [DOI] [PMC free article] [PubMed] [Google Scholar]
- 11.Louis DN et al. The 2016 World Health Organization Classification of Tumors of the Central Nervous System: a summary. Acta Neuropathol 131, 803–820, doi: 10.1007/s00401-016-1545-1 (2016). [DOI] [PubMed] [Google Scholar]
- 12.Venteicher AS et al. Decoupling genetics, lineages, and microenvironment in IDH-mutant gliomas by single-cell RNA-seq. Science 355, doi: 10.1126/science.aai8478 (2017). [DOI] [PMC free article] [PubMed] [Google Scholar]
- 13.Patel AP et al. Single-cell RNA-seq highlights intratumoral heterogeneity in primary glioblastoma. Science 344, 1396–1401, doi: 10.1126/science.1254257 (2014). [DOI] [PMC free article] [PubMed] [Google Scholar]
- 14.Snuderl M et al. Mosaic amplification of multiple receptor tyrosine kinase genes in glioblastoma. Cancer Cell 20, 810–817, doi: 10.1016/j.ccr.2011.11.005 (2011). [DOI] [PubMed] [Google Scholar]
- 15.Sottoriva A et al. Intratumor heterogeneity in human glioblastoma reflects cancer evolutionary dynamics. Proc Natl Acad Sci U S A 110, 4009–4014, doi: 10.1073/pnas.1219747110 (2013). [DOI] [PMC free article] [PubMed] [Google Scholar]
- 16.Williams MJ et al. Quantification of subclonal selection in cancer from bulk sequencing data. Nat Genet 50, 895–903, doi: 10.1038/s41588-018-0128-6 (2018). [DOI] [PMC free article] [PubMed] [Google Scholar]
- 17.Nejo T et al. Reduced Neoantigen Expression Revealed by Longitudinal Multiomics as a Possible Immune Evasion Mechanism in Glioma. Cancer Immunol Res, doi: 10.1158/2326-6066.CIR-18-0599 (2019). [DOI] [PubMed] [Google Scholar]
- 18.Consortium G Glioma through the looking GLASS: molecular evolution of diffuse gliomas and the Glioma Longitudinal Analysis Consortium. Neuro Oncol 20, 873–884, doi: 10.1093/neuonc/noy020 (2018). [DOI] [PMC free article] [PubMed] [Google Scholar]
- 19.Hu H et al. Mutational Landscape of Secondary Glioblastoma Guides MET-Targeted Trial in Brain Tumor. Cell 175, 1665–1678 e1618, doi: 10.1016/j.cell.2018.09.038 (2018). [DOI] [PubMed] [Google Scholar]
- 20.Alexandrov LB et al. Signatures of mutational processes in human cancer. Nature 500, 415–421, doi: 10.1038/nature12477 (2013). [DOI] [PMC free article] [PubMed] [Google Scholar]
- 21.Wang J et al. Clonal evolution of glioblastoma under therapy. Nat Genet 48, 768–776, doi: 10.1038/ng.3590 (2016). [DOI] [PMC free article] [PubMed] [Google Scholar]
- 22.Kim H et al. Whole-genome and multisector exome sequencing of primary and post-treatment glioblastoma reveals patterns of tumor evolution. Genome Res 25, 316–327, doi: 10.1101/gr.180612.114 (2015). [DOI] [PMC free article] [PubMed] [Google Scholar]
- 23.Johnson BE et al. Mutational analysis reveals the origin and therapy-driven evolution of recurrent glioma. Science 343, 189–193, doi: 10.1126/science.1239947 (2014). [DOI] [PMC free article] [PubMed] [Google Scholar]
- 24.Hunter C et al. A hypermutation phenotype and somatic MSH6 mutations in recurrent human malignant gliomas after alkylator chemotherapy. Cancer Res 66, 3987–3991, doi: 10.1158/0008-5472.CAN-06-0127 (2006). [DOI] [PMC free article] [PubMed] [Google Scholar]
- 25.Jolly C & Van Loo P Timing somatic events in the evolution of cancer. Genome Biol 19, 95, doi: 10.1186/s13059-018-1476-3 (2018). [DOI] [PMC free article] [PubMed] [Google Scholar]
- 26.Turajlic S, Sottoriva A, Graham T & Swanton C Resolving genetic heterogeneity in cancer. Nat Rev Genet, doi: 10.1038/s41576-019-0114-6 (2019). [DOI] [PubMed] [Google Scholar]
- 27.Choi S et al. Temozolomide-associated hypermutation in gliomas. Neuro Oncol 20, 1300–1309, doi: 10.1093/neuonc/noy016 (2018). [DOI] [PMC free article] [PubMed] [Google Scholar]
- 28.Baumert BG et al. Temozolomide chemotherapy versus radiotherapy in high-risk low-grade glioma (EORTC 22033–26033): a randomised, open-label, phase 3 intergroup study. Lancet Oncol 17, 1521–1532, doi: 10.1016/S1470-2045(16)30313–8 (2016). [DOI] [PMC free article] [PubMed] [Google Scholar]
- 29.Buckner JC et al. Radiation plus Procarbazine, CCNU, and Vincristine in Low-Grade Glioma. N Engl J Med 374, 1344–1355, doi: 10.1056/NEJMoa1500925 (2016). [DOI] [PMC free article] [PubMed] [Google Scholar]
- 30.Yap TA, Gerlinger M, Futreal PA, Pusztai L & Swanton C Intratumor heterogeneity: seeing the wood for the trees. Sci Transl Med 4, 127ps110, doi: 10.1126/scitranslmed.3003854 (2012). [DOI] [PubMed] [Google Scholar]
- 31.Williams MJ, Werner B, Barnes CP, Graham TA & Sottoriva A Identification of neutral tumor evolution across cancer types. Nat Genet 48, 238–244, doi: 10.1038/ng.3489 (2016). [DOI] [PMC free article] [PubMed] [Google Scholar]
- 32.Korber V et al. Evolutionary Trajectories of IDH(WT) Glioblastomas Reveal a Common Path of Early Tumorigenesis Instigated Years ahead of Initial Diagnosis. Cancer Cell 35, 692–704 e612, doi: 10.1016/j.ccell.2019.02.007 (2019). [DOI] [PubMed] [Google Scholar]
- 33.deCarvalho AC et al. Discordant inheritance of chromosomal and extrachromosomal DNA elements contributes to dynamic disease evolution in glioblastoma. Nat Genet 50, 708–717, doi: 10.1038/s41588-018-0105-0 (2018). [DOI] [PMC free article] [PubMed] [Google Scholar]
- 34.Giam M & Rancati G Aneuploidy and chromosomal instability in cancer: a jackpot to chaos. Cell Div 10, 3, doi: 10.1186/s13008-015-0009-7 (2015). [DOI] [PMC free article] [PubMed] [Google Scholar]
- 35.Marty R, Thompson WK, Salem RM, Zanetti M & Carter H Evolutionary Pressure against MHC Class II Binding Cancer Mutations. Cell 175, 416–428 e413, doi: 10.1016/j.cell.2018.08.048 (2018). [DOI] [PMC free article] [PubMed] [Google Scholar]
- 36.McGranahan N et al. Allele-Specific HLA Loss and Immune Escape in Lung Cancer Evolution. Cell 171, 1259–1271 e1211, doi: 10.1016/j.cell.2017.10.001 (2017). [DOI] [PMC free article] [PubMed] [Google Scholar]
- 37.Wang Q et al. Tumor Evolution of Glioma-Intrinsic Gene Expression Subtypes Associates with Immunological Changes in the Microenvironment. Cancer Cell 32, 42–56 e46, doi: 10.1016/j.ccell.2017.06.003 (2017). [DOI] [PMC free article] [PubMed] [Google Scholar]
- 38.Rooney MS, Shukla SA, Wu CJ, Getz G & Hacohen N Molecular and genetic properties of tumors associated with local immune cytolytic activity. Cell 160, 48–61, doi: 10.1016/j.cell.2014.12.033 (2015). [DOI] [PMC free article] [PubMed] [Google Scholar]
- 39.Dunn GP, Bruce AT, Ikeda H, Old LJ & Schreiber RD Cancer immunoediting: from immunosurveillance to tumor escape. Nat Immunol 3, 991–998, doi: 10.1038/ni1102-991 (2002). [DOI] [PubMed] [Google Scholar]
- 40.Hundal J et al. pVAC-Seq: A genome-guided in silico approach to identifying tumor neoantigens. Genome Med 8, 11, doi: 10.1186/s13073-016-0264-5 (2016). [DOI] [PMC free article] [PubMed] [Google Scholar]
- 41.Newman AM et al. Robust enumeration of cell subsets from tissue expression profiles. Nat Methods 12, 453–457, doi: 10.1038/nmeth.3337 (2015). [DOI] [PMC free article] [PubMed] [Google Scholar]
- 42.Rosenthal R et al. Neoantigen-directed immune escape in lung cancer evolution. Nature 567, 479–485, doi: 10.1038/s41586-019-1032-7 (2019). [DOI] [PMC free article] [PubMed] [Google Scholar]
- 43.Raub TJ et al. Brain Exposure of Two Selective Dual CDK4 and CDK6 Inhibitors and the Antitumor Activity of CDK4 and CDK6 Inhibition in Combination with Temozolomide in an Intracranial Glioblastoma Xenograft. Drug Metab Dispos 43, 1360–1371, doi: 10.1124/dmd.114.062745 (2015). [DOI] [PubMed] [Google Scholar]
- 44.van den Bent M et al. Efficacy of depatuxizumab mafodotin (ABT-414) monotherapy in patients with EGFR-amplified, recurrent glioblastoma: results from a multi-center, international study. Cancer Chemother Pharmacol 80, 1209–1217, doi: 10.1007/s00280-017-3451-1 (2017). [DOI] [PMC free article] [PubMed] [Google Scholar]
- 45.Keskin DB et al. Neoantigen vaccine generates intratumoral T cell responses in phase Ib glioblastoma trial. Nature 565, 234–239, doi: 10.1038/s41586-018-0792-9 (2019). [DOI] [PMC free article] [PubMed] [Google Scholar]
- 46.Schumacher T et al. A vaccine targeting mutant IDH1 induces antitumour immunity. Nature 512, 324–327, doi: 10.1038/nature13387 (2014). [DOI] [PubMed] [Google Scholar]
- 47.Koster J & Rahmann S Snakemake-a scalable bioinformatics workflow engine. Bioinformatics 34, 3600, doi: 10.1093/bioinformatics/bty350 (2018). [DOI] [PubMed] [Google Scholar]
- 48.Van der Auwera GA et al. From FastQ data to high confidence variant calls: the Genome Analysis Toolkit best practices pipeline. Curr Protoc Bioinformatics 43, 11 10 11–33, doi: 10.1002/0471250953.bi1110s43 (2013). [DOI] [PMC free article] [PubMed] [Google Scholar]
- 49.Ewels P, Magnusson M, Lundin S & Kaller M MultiQC: summarize analysis results for multiple tools and samples in a single report. Bioinformatics 32, 3047–3048, doi: 10.1093/bioinformatics/btw354 (2016). [DOI] [PMC free article] [PubMed] [Google Scholar]
- 50.Li H et al. The Sequence Alignment/Map format and SAMtools. Bioinformatics 25, 2078–2079, doi: 10.1093/bioinformatics/btp352 (2009). [DOI] [PMC free article] [PubMed] [Google Scholar]
- 51.Mermel CH et al. GISTIC2.0 facilitates sensitive and confident localization of the targets of focal somatic copy-number alteration in human cancers. Genome Biol 12, R41, doi: 10.1186/gb-2011-12-4-r41 (2011). [DOI] [PMC free article] [PubMed] [Google Scholar]
- 52.Beroukhim R et al. Assessing the significance of chromosomal aberrations in cancer: methodology and application to glioma. Proc Natl Acad Sci U S A 104, 20007–20012, doi: 10.1073/pnas.0710052104 (2007). [DOI] [PMC free article] [PubMed] [Google Scholar]
- 53.Martincorena I et al. Universal Patterns of Selection in Cancer and Somatic Tissues. Cell 171, 1029–1041 e1021, doi: 10.1016/j.cell.2017.09.042 (2017). [DOI] [PMC free article] [PubMed] [Google Scholar]
- 54.Taylor AM et al. Genomic and Functional Approaches to Understanding Cancer Aneuploidy. Cancer Cell 33, 676–689 e673, doi: 10.1016/j.ccell.2018.03.007 (2018). [DOI] [PMC free article] [PubMed] [Google Scholar]
- 55.Roth A et al. PyClone: statistical inference of clonal population structure in cancer. Nat Methods 11, 396–398, doi: 10.1038/nmeth.2883 (2014). [DOI] [PMC free article] [PubMed] [Google Scholar]
- 56.Turajlic S et al. Tracking Cancer Evolution Reveals Constrained Routes to Metastases: TRACERx Renal. Cell 173, 581–594 e512, doi: 10.1016/j.cell.2018.03.057 (2018). [DOI] [PMC free article] [PubMed] [Google Scholar]
- 57.Ha G et al. TITAN: inference of copy number architectures in clonal cell populations from tumor whole-genome sequence data. Genome Res 24, 1881–1893, doi: 10.1101/gr.180281.114 (2014). [DOI] [PMC free article] [PubMed] [Google Scholar]
- 58.Szolek A et al. OptiType: precision HLA typing from next-generation sequencing data. Bioinformatics 30, 3310–3316, doi: 10.1093/bioinformatics/btu548 (2014). [DOI] [PMC free article] [PubMed] [Google Scholar]
- 59.Hoof I et al. NetMHCpan, a method for MHC class I binding prediction beyond humans. Immunogenetics 61, 1–13, doi: 10.1007/s00251-008-0341-z (2009). [DOI] [PMC free article] [PubMed] [Google Scholar]
Associated Data
This section collects any data citations, data availability statements, or supplementary materials included in this article.
Supplementary Materials
Data Availability Statement
All deidentified, non-protected access somatic variant profiles and clinical data are accessible via Synapse (http://synapse.org/glass). Raw data of the various sequencing datasets can be obtained per the overview provided in the Supplement.


