

Abstract
Background
Little is known about the relationship between sleep and obesity in young adults, particularly college students. This study examined the relationship between sleep (i.e., sleep duration and quality) and obesity in a large and diverse binational sample of college students.
Methods
Analyses were based on a 40-item paper survey from 2016/2017 to 2017/2018 academic years, with a 72% response rate. The samples were 1578 college students aged 18–25 years from five universities (two in the U.S. and three in South Korea). Weight and height were measured objectively; other measures (e.g., health behaviors) were self-reported. Multinomial logistic regression was used to assess the association between sleep duration and independent variables (race/nationality, gender, and BMI). Poisson regression was used to examine the relationship between sleep quality and independent variables.
Results
Overall, blacks had a higher adjusted odds ratio (AOR) of short sleep (< 7 h/night) than whites (AOR = 1.74, P < .01); overweight participants had a higher AOR of short sleep than normal weight participants (AOR = 1.52, P < .01); and obese participants had a higher AORs of both short and long sleep (> 9 h/night) (AOR = 1.67, P < .01; AOR = 1.79, P < .05, respectively). Among men, being black, overweight, and obesity were associated with short sleep (P < .05), whereas only obesity was related to short sleep among women (P < .05). In analyses stratified by race and nationality, overweight and obesity were related to short sleep among blacks only (P < .05). Overall, sleep quality (getting enough sleep to feel rested in the morning in the past 7 days) was worse in blacks and South Koreans than whites (P < .05), worse in women than men (P < .05), and worse in participants with obesity than normal weight participants (P < .05).
Conclusions
Obesity was associated with both short (< 7 h/night) and long sleep duration (> 9 h/night) and poor sleep quality among all participants. In comparison with whites, blacks were more like to have short sleep, and blacks and South Koreans had worse sleep quality. Further investigations using a larger sample of college students in multiple countries may be helpful to identify target populations who are at a greater risk of obesity and sleep problems.
Keywords: Sleep, Obesity, Race, South Korea, Gender
Background
Sleep problems are considered an emerging global epidemic [1, 2]. In the United States (U.S.), sleep problems are estimated to affect 50–70 million adults every year [3]. Sleep problems are associated with multiple disabilities, morbidity, mortality, depression [4], and unhealthy behaviors [3, 5] including cigarette use [6], alcohol use [7], lower intakes of fruit and vegetable [8], and lack of physical activity [9]. College students are at high risk of sleep problems [2, 10], as they not only have high likelihood of sleep problems, but are also likely to develop long term problems associated with chronic sleep deprivation [11, 12].
Studies have reported that trends in sleep problems parallel trends in obesity [1, 13]. Obesity is another global epidemic that affects approximately 5.5% of current college students across different geographic regions, with notable national disparities [14]. Sleep problems contribute to obesity, as shorter duration and poorer quality of sleep lead to behavioral, metabolic, and endocrine changes that lead to weight gain [15, 16]. At the same time, obesity contributes to sleep problems, as individuals with obesity are more likely to suffer from sleep disordered breathing, such as sleep apnea [17]. Despite the parallels and the mechanism that drive those parallels, the relationship between sleep problems and obesity among college students is not fully understood [16, 18]. Our understanding is particularly limited for gender and racial differences in sleep and obesity among college students.
Studies have reported that people manifest problematic sleep in different ways. For instance, studies have suggested significant gender differences in risk or prevalence of both obesity and sleep problems [3, 19]. The National Institute of Health (NIH) specifically mentioned the identification of gender differences that contribute to the risk of sleep problems as one of their five goals of their 2011 Sleep Disorders Research Plan [3]. One study found that the relationship between sleep duration and body mass index (BMI) is affected by gender instead of race [20], though it is unclear if the same is true for the relationship between sleep quality and BMI.
Nevertheless, sleep problems and obesity are affected by race. Non-Hispanic blacks (blacks) are more likely to report short sleep durations [21], while having higher BMI than non-Hispanic whites (whites) [22], suggesting that sleep problems have greater influence on obesity status for certain racial groups [23, 24]. However, many existing studies conflate various racial groups, limiting inference therein. Many of the existing studies either do not include non-Hispanic Asians (Asians) in their study sample, or include Asians as one combined racial group [23]. Differences in ethnicity, nativity, and primary language are associated with different health and behaviors within the Asian population [25], and Asians with different nationalities should be considered separately.
South Korea (Korea) is a country with a high prevalence of sleep problems [26, 27], with higher prevalence of insomnia (22.8%) than other Asian countries (e.g., Singapore: 15.3% and Japan: 21.4%) [27–29]. Korea is also a country with a steady increase in the prevalence of obesity and severe obesity among adults since 1998 [30]. However, the health of college students is often overlooked [31, 32], and neither obesity nor sleep problems are rigorously monitored in the Korean college student population. To the best of our knowledge, there are no studies that have examined the relationship between sleep and obesity among Korean college students.
Only a few studies have examined the relationship between sleep and obesity in U.S. college populations, and even fewer studies included both duration and quality measures of sleep while considering demographic variance of the relationship [12, 18, 33, 34]. Moreover, none of the studies to date have investigated differences in sleep and obesity between college students in the U.S. and college students in Korea. The purpose of this study was thus to examine the relationship between sleep (i.e., sleep duration and quality) and body weight in a binational sample of college students, and identify gender and racial/national groups most affected by the relationship.
Methods
Survey and study sample
A 40-item paper questionnaire in English was adapted from the National Health and Nutrition Examination Survey (NHANES), the American College Health Association-National College Health Assessment (ACHA-NCHA), and the Center for Epidemiologic Studies Depression Scale (CES-D). NHANES collects the nation’s primary source of health-related data [35, 36], and ACHA-NCHA [37] and CES-D [38] have been determined to be of high reliability and high validity. The original 40-item English questionnaire was translated into Korean by two bilingual health professors at two universities in Korea, using translation steps to ensure that the translated questionnaire is valid and reliable [39]. A back translation was performed by two bilingual health professors in the U.S. Then, the jury of bilingual experts in the U.S. and Korea reviewed the original and translated questionnaires and edited the translated version to remove discrepancies. The translated questionnaire was pilot tested with ten undergraduates at participating universities in Korea to evaluate the questionnaire wording and respondent’s understanding of the questions. No wording problems were found, and this pilot sample was not included in the study sample. The current study was approved by the Institutional Review Board at five participating universities in the U.S. and Korea.
Study participants were undergraduates aged 18 to 25 years at a predominantly non-Hispanic white university, a historically black university, and three universities in Korea utilizing data from academic years 2016–2017 and 2017–2018. Convenience sampling was used for this study. A total of 2232 undergraduates enrolled in health courses (e.g., Foundations in Physical Education) were invited to participate in the 40-item paper survey by an email invitation that was sent by the five health departments at the five participating universities. Lead investigators at each university provided students with an overview of the study during class sessions. Inclusion criteria were being blacks, whites, Koreans, and aged 18 to 25 years. An exclusion criterion included pregnant students. A total of 1605 students participated (72% response rate), and 27 questionnaires with 10% or more missing responses were excluded based on NHANES analytic guidelines [40]. The final sample size was reduced to 1578 participants (60.3% Koreans) on five campuses.
Measures
Race/nationality was self-reported and included non-Hispanic whites, non-Hispanic blacks, and non-Hispanic Asians. Annual family income was measured by an open-ended question “What is the total income received last year by you and your family members before taxes? Family is individuals and groups of individuals who are related by birth, marriage or adoption.” Using a Detecto scale with height bar (Detecto Scale Company, Webb City, MO), weight and height of participants in the U.S. and Korea were measured while wearing light clothing without shoes. Detecto is the largest medical scale manufacturer in the world [41] and is used as height and weight measurements in obesity studies [42, 43]. Weight and height were measured twice, and the mean of each measurement was recorded by lead investigators at each university. BMI was calculated as kg/m2 using participants’ measured height in centimeters and weight in kilograms. Standard BMI cut points (underweight = BMI < 18.5; normal = 18.5 ≤ BMI < 25.0; overweight = 25.0 ≤ BMI < 30.0; and obese = BMI ≥ 30.0) [44] and Asian BMI cut points (underweight = BMI < 18.5; normal = 18.5 ≤ BMI < 23.0; overweight = 23.0 ≤ BMI < 25.0; and obese = BMI ≥ 25.0) [45, 46] were used for U.S. students and Korean students, respectively.
General health was assessed with the question, “How would you describe your general health?” with response options of excellent, very good, good, fair, and poor. Participants answered dichotomous questions regarding sleep problems: (1) “Have you ever told a doctor or other health professional that you have trouble sleeping?” and (2) “Have you ever been told by a doctor or other health professional that you have a sleep disorder?” Sleep duration was measured by an open-ended question “How much sleep do you usually get at night on weekdays or workdays?” Responses to this question were grouped into short sleep (< 7 h/night), normal sleep (7–9 h/night), and long sleep (> 9 h/night) [47]. Sleep quality was assessed with the question, “On how many of the past 7 days did you get enough sleep so that you felt rested when you woke up in the morning?” Response options ranged from 0 days to 7 days.
Depression was measured by the CES-D scale, a 20-item self-report measure with response options ranging from 0 to 3 for each item (0 = rarely or none of the time, 1 = some or little of the time, 2 = moderately or much of the time, 3 = most or almost all the time). CES-D scores of 16 or higher is considered depressed.
Based on the Centers for Disease Control and Prevention glossary [48], current smoking (i.e., ever smoked 100 cigarettes in entire life and reported current cigarette smoking every day or some days) was measured by (1) “Have you smoked 100 cigarettes in your entire life?” and (2) “Do you now smoke cigarettes every day, some days, or not at all?” Alcoho use was assessed by an open-ended question “Within the last 30 days, on how many days did you use alcohol (beer, wine, liquor)?” Daily fruits and vegetables intake was measured with an open-ended question “How many servings of fruits and vegetables do you usually have per day (1 serving = 1 medium piece of fruit; 1/2 cup fresh, frozen, or canned fruits/vegetables; 3/4 cup fruit/vegetable juice; 1 cup salad greens; or 1/4 cup dried fruit)?”
Weekly moderate-intensity exercise for ≥10 min and weekly vigorous-intensity exercise for ≥10 min were assessed by open-ended questions (1) “In a typical week, on how many days do you do moderate-intensity sports, fitness or recreational activities? Moderate-intensity sports, fitness or recreational activities cause small increases in breathing or heart rate such as brisk walking, bicycling, swimming, or golf for at least 10 minutes continuously.” and (2) “In a typical week, on how many days do you do vigorous-intensity sports, fitness or recreational activities? Vigorous-intensity activity causes large increases in breathing or heart rate like running or basketball for at least 10 minutes continuously.”
Statistical analysis
Chi-square tests were performed to identify significant differences in demographics and health behaviors among the three racial/national groups (whites, blacks, and Koreans). Data were analyzed separately for each gender and racial/national group. Racial/national differences in sleep quality were examined by using ANOVA followed by the Scheffe post hoc test. Multinomial logistic regression models were used to compute adjusted odds ratios (AORs) and investigate the association between sleep duration and three independent variables (race/nationality, gender, and BMI) with adjustment for potential confounding factors (age, annual family income, days of vigorous-intensity activity, days of moderate-intensity activity, current smoking status, days of alcohol use, having trouble sleeping, sleep disorder, and depression) based on prior research [49–51]. Whites were used as the reference group for all multinomial regression models. The prevalence of obesity by sleep duration was illustrated separately for race/nationality in graphical plots. Poisson regression models were used to estimate adjusted incidence rate ratio and examine the relationship between sleep quality (getting enough sleep to feel rested in the morning in the past 7 days) and three independent variables (race/nationality, gender, and BMI) with adjustment for confounding variables (age, current smoking status, days of alcohol use, and depression) based on previous studies [18, 49, 52]. All analyses were conducted with STATA version 13 (STATA Press, College Station, TX).
Results
The study sample consisted of 1578 participants, with a mean age of 21.0 years (SD = 2.3). The majority of the study sample was comprised of men (61.3%), with 19.4% whites, 20.3% blacks, and 60.3% Koreans. The majority of men and women perceived their general health as good or very good. Among men, Koreans had higher overweight/obesity rates (59.4%) than blacks (51.5%) and whites (46.8%) when the World Health Organization (WHO) definition of overweight/obesity for Asian adults was used. However, Koreans had lower overweight/obesity rates (26.2%) when the same BMI criteria were used across the three racial/national groups.
As shown in Table 1, more white men had normal sleep duration (P < .001), better sleep quality (i.e., getting enough sleep to feel rested in the morning in the past 7 days) (P < .05), and more moderate-intensity exercise (P < .001) compared to black or Korean men. Korean men had less trouble sleeping (P < .001) and had higher CES-D scores (P < .01) compared to white or black men. Korean men had the highest current smoking rate (30.9%) compared to white (13.4%) or black men (2.1%) (P < .001) and white men had the highest fruit and vegetable consumption (P < .001).
Table 1.
Characteristics of men by race/nationality (n = 968)
| Demographics and Health Behaviors | Whites (n = 188) |
Blacks (n = 196) |
Koreans (n = 584) |
p value |
|---|---|---|---|---|
| % | % | % | ||
| Years in undergraduate school | <.001 | |||
| 1 year | 12.8 | 41.0 | 28.9 | |
| 2 years | 12.2 | 24.1 | 25.7 | |
| 3 years | 24.5 | 16.9 | 25.0 | |
| 4 years | 33.0 | 11.3 | 17.6 | |
| ≥ 5 years | 17.6 | 6.7 | 2.7 | |
| General health | <.001 | |||
| Excellent | 17.1 | 13.4 | 13.0 | |
| Very good | 45.5 | 38.1 | 30.9 | |
| Good | 31.6 | 38.1 | 31.4 | |
| Fair | 5.9 | 10.3 | 24.7 | |
| Poor | 0.5 | 1.0 | 4.8 | |
| Body mass indexa | .003 | |||
| Underweight | 1.1 | 1.0 | 1.0 | |
| Normal weight | 52.1 | 47.5 | 39.6 | |
| Overweight | 33.0 | 35.7 | 33.2 | |
| Obesity | 13.8 | 15.8 | 26.2 | |
| Sleep durationb | <.001 | |||
| Short sleep (< 7 h/night) | 39.0 | 59.2 | 46.6 | |
| Normal sleep (7–9 h/night) | 50.3 | 35.7 | 47.6 | |
| Long sleep (> 9 h/night) | 10.7 | 5.1 | 5.8 | |
| Having trouble sleeping | 14.4 | 13.3 | 4.8 | <.001 |
| Having a sleep disorder | 3.2 | 4.6 | 2.1 | .163 |
| Depression | 23.5 | 27.0 | 34.9 | .005 |
| Current smoker | 13.4 | 2.1 | 30.9 | <.001 |
| Alcohol use in last 30 days | <.001 | |||
| 0 days | 10.6 | 51.5 | 8.2 | |
| 1–9 days | 47.3 | 39.8 | 55.8 | |
| ≥ 10 days | 42.0 | 8.7 | 36.0 | |
| Daily fruits and vegetables intake | <.001 | |||
| 0 servings | 3.2 | 10.2 | 15.9 | |
| 1–2 servings | 73.9 | 60.7 | 70.7 | |
| ≥ 3 servings | 22.9 | 29.1 | 13.4 | |
| Weekly moderate-intensity exercise for ≥10 min | <.001 | |||
| 0 days | 1.1 | 14.3 | 12.8 | |
| 1–2 days | 26.6 | 28.1 | 25.7 | |
| ≥ 3 days | 72.3 | 57.7 | 61.5 | |
| Weekly vigorous-intensity exercise for ≥10 min | .030 | |||
| 0 days | 5.3 | 12.8 | 9.8 | |
| 1–2 days | 23.9 | 28.1 | 30.3 | |
| ≥ 3 days | 70.7 | 59.2 | 59.9 | |
| Mean (SD) | Mean (SD) | Mean (SD) | ||
| Days of getting enough sleep to feel rested in the morning in past 7 days | 3.58 (2.11)b | 2.99 (2.39)c | 2.71 (1.78)c,d | <.05 |
The percentages may not add up to 100% because of no responses or rounding errors
Only one category for dichotomous variables is presented to eliminate redundancy in the table
aUnderweight (BMI < 18.5), normal (18.5 ≤ BMI < 25.0), overweight (25.0 ≤ BMI < 30.0), and obese (BMI ≥ 30.0) for whites and blacks. Underweight (BMI < 18.5), normal (18.5 ≤ BMI < 23.0), overweight (23.0 ≤ BMI < 25.0), and obese (BMI ≥ 25.0) for Koreans
P values are based on a chi-square test for categorical variables and an ANOVA for continuous data. b-d Values with different superscripts were significantly different across racial/national groups in the Scheffe test after ANOVA
As shown in Table 2, the majority of women perceived their general health as good or very good. Black women had higher overweight/obesity (53.8%) compared to white (38.8%) or Korean women (24.8%) when using the WHO definition. Overweight/obesity rates (12.2%) were however lower for Korean women when the same BMI criteria were used across the three racial/national groups. Korean women had worse sleep quality (P < .05), had less trouble sleeping (P < .001), and had higher CES-D scores (P < .05) compared to white or black women. White women had more days of alcohol use (P < .001), had the highest fruit and vegetable consumption (P < .01), and did more vigorous-intensity exercise compared to blacks or Koreans (P < .001).
Table 2.
Characteristics of women by race/nationality (n = 610)
| Demographics and Health Behaviors | Whites (n = 98) |
Blacks (n = 290) |
Koreans (n = 222) |
p value |
|---|---|---|---|---|
| % | % | % | ||
| Years in undergraduate school | <.001 | |||
| 1 year | 6.1 | 43.1 | 21.8 | |
| 2 years | 6.1 | 27.8 | 30.0 | |
| 3 years | 33.7 | 17.0 | 26.4 | |
| 4 years | 40.8 | 9.0 | 19.6 | |
| ≥ 5 years | 13.3 | 3.1 | 2.3 | |
| General health | <.001 | |||
| Excellent | 8.2 | 4.5 | 5.4 | |
| Very good | 37.8 | 22.5 | 21.6 | |
| Good | 43.9 | 47.1 | 30.2 | |
| Fair | 9.2 | 21.1 | 35.6 | |
| Poor | 1.0 | 4.8 | 7.2 | |
| Body mass indexa | <.001 | |||
| Underweight | 1.0 | 1.4 | 8.6 | |
| Normal weight | 60.2 | 44.8 | 66.7 | |
| Overweight | 25.5 | 25.5 | 12.6 | |
| Obesity | 13.3 | 28.3 | 12.2 | |
| Sleep durationb | .450 | |||
| Short sleep (< 7 h/night) | 53.1 | 59.3 | 51.8 | |
| Normal sleep (7–9 h/night) | 38.8 | 34.8 | 41.9 | |
| Long sleep (> 9 h/night) | 8.2 | 5.9 | 6.3 | |
| Having trouble sleeping | 25.5 | 19.3 | 6.8 | <.001 |
| Having a sleep disorder | 1.0 | 5.5 | 3.6 | .136 |
| Depression | 42.7 | 41.7 | 52.7 | .038 |
| Current smoker | 2.0 | 1.7 | 4.6 | .140 |
| Alcohol use in last 30 days | <.001 | |||
| 0 days | 12.2 | 42.4 | 14.0 | |
| 1–9 days | 54.1 | 49.0 | 60.4 | |
| ≥ 10 days | 33.7 | 8.6 | 25.7 | |
| Daily fruits and vegetables intake | .002 | |||
| 0 servings | 5.1 | 10.3 | 13.5 | |
| 1–2 servings | 58.2 | 66.9 | 68.9 | |
| ≥ 3 servings | 36.7 | 22.8 | 17.6 | |
| Weekly moderate-intensity exercise for ≥10 min | .060 | |||
| 0 days | 12.2 | 25.9 | 25.7 | |
| 1–2 days | 35.7 | 30.3 | 27.5 | |
| ≥ 3 days | 52.0 | 43.8 | 46.9 | |
| Weekly vigorous-intensity exercise for ≥10 min | <.001 | |||
| 0 days | 22.5 | 41.7 | 39.2 | |
| 1–2 days | 22.5 | 28.6 | 28.4 | |
| ≥ 3 days | 55.1 | 29.7 | 32.4 | |
| Mean (SD) | Mean (SD) | Mean (SD) | p value | |
| Days of getting enough sleep to feel rested in the morning in past 7 days | 2.80 (2.17)b,c | 2.83 (2.09)b | 2.28 (1.63)c | <.05 |
The percentages may not add up to 100% because of no responses or rounding errors
Only one category for dichotomous variables is presented to eliminate redundancy in the table
aUnderweight (BMI < 18.5), normal (18.5 ≤ BMI < 25.0), overweight (25.0 ≤ BMI < 30.0), and obese (BMI ≥ 30.0) for whites and blacks. Underweight (BMI < 18.5), normal (18.5 ≤ BMI < 23.0), overweight (23.0 ≤ BMI < 25.0), and obese (BMI ≥ 25.0) for Koreans
P values are based on a chi-square test for categorical variables and an ANOVA for continuous data. b-c Values with different superscripts were significantly different across racial/national groups in the Scheffe test after ANOVA
Table 3 summarizes the influence of gender, race/nationality, and BMI on sleep duration by gender and race/nationality, adjusting for demographic and health characteristics (age, annual family income, days of vigorous-intensity activity, days of moderate-intensity activity, current smoking status, days of alcohol use, having trouble sleeping, sleep disorder, and depression). Among all participants, blacks had a higher AOR of short sleep than whites (P < .01). Overweight participants had a higher AOR of short sleep than those who were normal weight (P < .01), while obese participants had a higher AOR of both short sleep (P < .01) and long sleep (P < .05).
Table 3.
Multinomial logistic regression of sleep duration (N = 1578)
| All | Men | Women | ||||
|---|---|---|---|---|---|---|
| Short sleep AOR (95% CI)a |
Long sleep AOR (95% CI)a |
Short sleep AOR (95% CI)a |
Long sleep AOR (95% CI)a |
Short sleep AOR (95% CI)a |
Long sleep AOR (95% CI)a |
|
| Race/nationality | ||||||
| Whites | Reference | Reference | Reference | Reference | Reference | Reference |
| Blacks | 1.74 (1.20, 2.51)** | 0.85 (0.43, 1.69) | 2.22 (1.34, 3.68)** | 0.93 (0.35, 2.46) | 1.28 (0.70, 2.35) | 0.59 (0.19, 1.84) |
| Koreans | 0.97 (0.69, 1.36) | 0.78 (0.43, 1.41) | 1.05 (0.68, 1.61) | 0.79 (0.38, 1.65) | 0.91 (0.50, 1.68) | 0.52 (0.16, 1.65) |
| BMI | ||||||
| Underweight | 0.86 (0.39, 1.93) | 1.44 (0.39, 5.30) | 0.69 (0.16, 2.94) | 0.25 (0.17, 3.95) | 1.00 (0.36, 2.77) | 2.40 (0.56, 10.36) |
| Normal weight | Reference | Reference | Reference | Reference | Reference | Reference |
| Overweight | 1.52 (1.16, 1.99)** | 1.17 (0.67, 2.03) | 1.48 (1.06, 2.07)* | 1.10 (0.56, 2.19) | 1.58 (0.97, 2.56) | 1.42 (0.53, 3.78) |
| Obesity | 1.67 (1.16, 2.41)** | 1.79 (1.03, 3.43)* | 1.61 (1.04, 2.74)* | 1.68 (0.69, 4.09) | 1.84 (1.07, 3.16)* | 1.74 (0.62, 4.86) |
| Whites | Blacks | Koreans | ||||
|
Short sleep AOR (95% CI)a |
Long sleep AOR (95% CI)a |
Short sleep AOR (95% CI)a |
Long sleep AOR (95% CI)a |
Short sleep AOR (95% CI)a |
Long sleep AOR (95% CI)a |
|
| Gender | ||||||
| Men | Reference | Reference | Reference | Reference | Reference | Reference |
| Women | 1.36 (0.72, 2.56) | 1.20 (0.42, 3.44) | 0.95 (0.61, 1.47) | 1.12 (0.44, 2.83) | 1.08 (0.72, 1.63) | 0.80 (0.34, 1.90) |
| BMI | ||||||
| Underweight | 0.82 (0.04, 18.08) | 1.45 (0.91, 4.27) | 0.22 (0.02, 2.09) | 3.14 (0.28, 34.53) | 1.19 (0.44, 3.19) | 1.40 (0.26, 7.46) |
| Normal weight | Reference | Reference | Reference | Reference | Reference | Reference |
| Overweight | 1.51 (0.77, 2.97) | 1.73 (0.60, 5.02) | 1.70 (1.06, 2.72)* | 1.30 (0.43, 3.92) | 1.30 (0.86, 1.97) | 0.73 (0.28, 1.89) |
| Obesity | 1.67 (0.71, 3.92) | 2.63 (0.71, 9.77) | 1.68 (1.01, 2.84)* | 2.25 (0.80, 6.27) | 1.10 (0.43, 2.77) | 0.46 (0.05, 4.00) |
Sleep duration classified into short sleep (< 7 h/night), normal sleep (7–9 h/night), and long sleep (> 9 h/night)
Underweight (BMI < 18.5), normal weight (18.5 ≤ BMI < 25.0), overweight (25.0 ≤ BMI < 30.0), and obesity (BMI ≥ 30.0) for whites and blacks. Underweight (BMI < 18.5), normal weight (18.5 ≤ BMI < 23.0), overweight (23.0 ≤ BMI < 25.0), and obesity (BMI ≥ 25.0) for Koreans
aOdds ratio adjusted for age, annual family income, days of vigorous-intensity activity, days of moderate-intensity activity, current smoking status, days of alcohol use, having trouble sleeping, sleep disorder, and depression
AOR adjusted odds ratio, CI confidence interval
*p < .05; **p < .01
Among men, being black (P < .01), overweight (P < .05), and obesity (P < .05) were associated with short sleep. Among women, only obesity was related to short sleep (P < .05). Among blacks, overweight and obesity were associated with short sleep (P < .05). Neither race/nationality nor BMI was significantly associated with long sleep, after stratification by gender. Unadjusted analyses showed patterns similar to adjusted multinomial regression analyses shown in Table 3, with some notable differences. Unlike adjusted analyses, unadjusted analyses showed that (1) among all, being black (P < .001) and obesity (P < .05) were related to short sleep, (2) among men, being black was associated with short sleep (P < .001) while overweight was associated with long sleep (P < .05), (3) among women, obesity was associated with short sleep (P < .05), and (4) among blacks, overweight was associated with short sleep (P < .05).
Among all participants, sleep quality (getting enough sleep to feel rested in the morning in the past 7 days) was worse in blacks (P < .05) and Koreans (P < .001) than whites, worse in women than men (P < .05), and worse in participants with obesity than those who are normal weight (P < .05) (Table 4). BMI was no longer a significant predictor of sleep quality after stratification by gender and race/nationality. Among men, sleep quality was poorer in blacks (P < .01) and Koreans (P < .001) than whites. Among women, it was poorer in Koreans than whites (P < .05). Among whites, it was poorer in women than men (P < .01). No difference was observed among blacks or Koreans.
Table 4.
Poisson regression of getting enough sleep in the past 7 days (N = 1578)
| All IRR (95% CI)a |
Men IRR (95% CI)a |
Women IRR (95% CI)a |
Whites IRR (95% CI)a |
Blacks IRR (95% CI)a |
Koreans IRR (95% CI)a |
|
|---|---|---|---|---|---|---|
| Race/nationality | ||||||
| Whites | Reference | Reference | Reference | – | – | – |
| Blacks | 0.89 (0.81, 0.98)* | 0.85 (0.75, 0.96)** | 0.99 (0.84, 1.15) | – | – | – |
| Koreans | 0.79 (0.73, 0.86)*** | 0.77 (0.70, 0.85)*** | 0.82 (0.70, 0.95)* | – | – | – |
| Gender | ||||||
| Men | Reference | – | – | Reference | Reference | Reference |
| Women | 0.92 (0.86, 0.99)* | – | – | 0.79 (0.68, 0.91)** | 1.00 (0.90, 1.12) | 0.91 (0.82, 1.02) |
| BMI | ||||||
| Underweight | 0.88 (0.71, 1.09) | 0.92 (0.62, 1.35) | 0.92 (0.70, 1.20) | 0.98 (0.48, 1.97) | 1.06 (0.67, 1.67) | 0.92 (0.68, 1.12) |
| Normal weight | Reference | Reference | Reference | Reference | Reference | Reference |
| Overweight | 0.96 (0.89, 1.03) | 0.95 (0.87, 1.03) | 0.95 (0.83, 1.08) | 0.92 (0.79, 1.08) | 0.99 (0.87, 1.12) | 0.97 (0.87, 1.08) |
| Obesity | 0.92 (0.85, 0.99)* | 0.91 (0.82, 1.01) | 0.90 (0.79, 1.03) | 0.86 (0.70, 1.06) | 0.90 (0.78, 1.04) | 0.97 (0.86, 1.09) |
Underweight (BMI < 18.5), normal weight (18.5 ≤ BMI < 25.0), overweight (25.0 ≤ BMI < 30.0), and obesity (BMI ≥ 30.0) for whites and blacks. Underweight (BMI < 18.5), normal weight (18.5 ≤ BMI < 23.0), overweight (23.0 ≤ BMI < 25.0), and obesity (BMI ≥ 25.0) for Koreans
aIncidence rate ratio (IRR) adjusted for age, current smoking status, days of alcohol use, and depression
CI confidence interval
*p < .05; **p < .05; ***p < .001
As shown in Fig. 1, both short and long sleep were significantly associated with obesity in blacks only (P < .05).
Fig. 1.
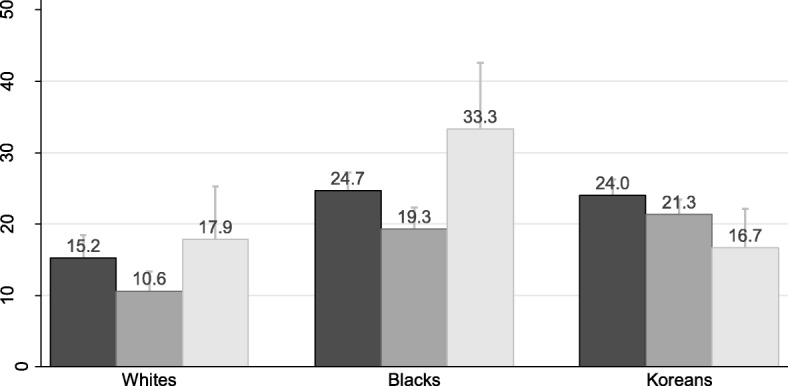
Prevalence of obesity by sleep duration with standard error of the mean. Black bar, short sleep (< 7 h/night). Dark gray bar, normal sleep (7–9 h/night). Light gray bar, long sleep (> 9 h/night)
Discussion
This study aimed to examine associations of BMI-based weight status with sleep duration and quality among college students in the U.S. and Korea. Moreover, this study tested gender and racial/national differences in the associations. To our knowledge, this study may be the first investigation that examined racial/national differences in the association between weight status and sleep problems among a binational sample of college students.
In this study, overweight and obesity were positively associated with having sleep problems. Specifically, college students with obesity were more likely to have inappropriate sleep duration and poor sleep quality compared to their normal weight counterparts. Previous studies also reported similar associations [53–55]. The association between weight status and sleep problems may be explained by a bidirectional mechanism [15, 16, 56]. Having excess body weight can lead to sleep problems due to disordered breathing [17], while having sleep problems can also contribute to weight gain due to abnormal changes in metabolic and endocrine functions [15, 16]. In another study of college students, however, sleep duration was not significantly associated with weight status, whereas sleep disturbance was significantly associated with increased BMI [12, 18, 33, 34]. Although sleep quality may be a better predictor of sleep-related health outcomes, both sleep duration or quantity and quality are important for well-being [57]. Given a tendency of easy weight gain among college students after starting college life [58, 59], managing uncontrolled weight gain among college students would be supportive to prevent their sleep problems.
Regarding gender differences, there was no specific difference in the association between weight status and sleep problems. Obesity was positively associated with having inappropriately short sleep duration in both men and women, while statistically significant association between weight status and sleep quality was not detected in both genders. Previous studies reported gender differences in overweight/obesity and sleep problems [60–62]. In general, male college students have higher prevalence of overweight/obesity compared to their female counterparts in both the U.S. [60] and Korea [61]. In contrast, female college students are more likely to experience sleep problems than their male counterparts in both countries [62, 63]. Nevertheless, in the association between these two health issues, no difference between men and women existed among this sample of students. Further investigations using a larger sample of college students in both countries may be required to confirm gender differences in the association between excess body weight and sleep problems.
In stratified analyses by college students’ race/nationality, obesity was associated with having inappropriately short sleep duration in only black college students, whereas there was no statistically significant association in white and Korean college students. Similarly, a previous study among a nationally representative sample of U.S. adults reported that only blacks showed a significant association between objectively measured obesity and inappropriately short sleep duration, whereas this association was not statistically significant in whites, Hispanics, and Asians [64]. Generally, black college students have higher prevalence of overweight and obesity than that of white and Asian college students [65]. If the association between obesity and having sleep problems is true, black college students may be the most vulnerable population to sleep problems among college students in the U.S. In fact, a review study documented that blacks have higher prevalence of inappropriately short or long sleep duration and poor sleep quality (less deep and restful sleep), compared to other racial/national groups [66]. Black college students may be in needs of targeted interventions for both weight and sleep management. Additional investigations on comparisons of the association between weight status and sleep problems among multi-national sample of college students may be needed to examine racial/national disparities more accurately.
Limitations
This study has several limitations. Since this study was a cross-sectional study, cause-and-effect associations cannot be determined. Secondly, as other observational studies, there might be unmeasured confounding factors which affect the study results. For example, influences of common behavioral factors for delayed sleep onset among young people, including caffeine intake and use of electronics late at night [67], were not considered. Thirdly, although objectively measured weight status was used, self-reported sleep duration and quality were used, so this might have affected the study results. Fourthly, when interpreting the data presented in this paper, cautions should be considered because the reliability and validity of NHANES questions used in this study have not been determined. Lastly, this study used a convenience sample of college students which is likely to be biased and have a generalizability issue.
Conclusions
Despite the limitations, this study provides novel information about the association of weight status with sleep duration and quality among college students in the U.S. and Korea, as well as racial/national differences in the association among three racial/national groups including whites, blacks, and Koreans. Overall, obesity was associated with having inappropriate sleep duration and poor sleep quality among college students in the U.S. and Korea. Although this association was not different by gender, only black students showed significant association between obesity and having inappropriately short sleep duration in stratified analyses. Further investigations using a larger sample of college students in multiple countries may be helpful to identify the populations at a greater risk of overweight/obesity and sleep problems by college students’ gender and race/nationality.
Acknowledgements
The authors thank Dr. Margarita Treuth for her invaluable comments.
Abbreviations
- ACHA-NCHA
American College Health Association-National College Health Assessment
- ANOVA
Analysis of variance
- AOR
Adjusted odds ratio
- BMI
Body mass index
- CES-D
Center for Epidemiologic Studies Depression Scale
- CI
Confidence interval
- IRR
Incidence rate ratio
- NHANES
National health and nutrition examination survey
- NIH
National Institute of Health
- SD
Standard deviation
- WHO
World Health Organization.
Authors’ contributions
JS and YK conceived the idea for the paper. JS, GK, CP, YC, BN, and YK collected the study data. JS and SC analyzed the data. JS, SC and BC drafted the original manuscript. JS, JPC, and JC revised the original manuscript. All authors read and approved the manuscript.
Funding
The authors have no financial sources to disclose.
Availability of data and materials
Data can be made available through the authors.
Ethics approval and consent to participate
Ethics approval was given by the Institutional Review Board of Touro University, CA, USA; the Institutional Review Board of University of Maryland Eastern Shore, MD, USA; the Committee on Human Research of Salisbury University, MD, USA; the Institutional Review Board of Korea National Sport University, Seoul, South Korea; the Institutional Review Board of Seoul National University, Seoul, South Korea; and the Institutional Review Board of Daegu University, Daegu, South Korea. All participants provided written consent to participate in the survey.
Consent for publication
All participants provided written consent for their personal data to be used.
Competing interests
The authors declare that they have no competing interest.
Footnotes
Publisher’s Note
Springer Nature remains neutral with regard to jurisdictional claims in published maps and institutional affiliations.
Contributor Information
Jaesin Sa, Email: jaesin.sa@tu.edu.
Siyoung Choe, Email: choes@miamioh.edu.
Beom-young Cho, Email: bycho@umich.edu.
Jean-Philippe Chaput, Email: jpchaput@cheo.on.ca.
Gyurin Kim, Email: prag-1@hanmail.net.
Chae-Hee Park, Email: chaepark@knsu.ac.kr.
Joon Chung, Email: joon.chung@emory.edu.
Yoojin Choi, Email: yxchoi@salisbury.edu.
Beatrice Nelson, Email: banelson@umes.edu.
Yongkyu Kim, Email: kim9886@daegu.ac.kr.
References
- 1.Stranges S, Tigbe W, Gómez-Olivé FX, Thorogood M, Kandala N-B. Sleep problems: an emerging global epidemic? Findings from the INDEPTH WHO-SAGE study among more than 40,000 older adults from 8 countries across Africa and Asia. Sleep. 2012;35(8):1173–1181. doi: 10.5665/sleep.2012. [DOI] [PMC free article] [PubMed] [Google Scholar]
- 2.Peltzer K, Pengpid S. Nocturnal sleep problems among university students from 26 countries. Sleep Breath. 2015;19(2):499–508. doi: 10.1007/s11325-014-1036-3. [DOI] [PubMed] [Google Scholar]
- 3.National Institutes of Health . Sleep Disorders Research Plan. Bethesda, MD: National Institutes of Health; 2011. [Google Scholar]
- 4.Nutt D, Wilson S, Paterson L. Sleep disorders as core symptoms of depression. Dialogues Clin Neurosci. 2008;10(3):329. doi: 10.31887/DCNS.2008.10.3/dnutt. [DOI] [PMC free article] [PubMed] [Google Scholar]
- 5.Cappuccio FP, D'Elia L, Strazzullo P, Miller MA. Sleep duration and all-cause mortality: a systematic review and meta-analysis of prospective studies. Sleep. 2010;33(5):585–592. doi: 10.1093/sleep/33.5.585. [DOI] [PMC free article] [PubMed] [Google Scholar]
- 6.Bellatorre A, Choi K, Lewin D, Haynie D, Simons-Morton B. Relationships between smoking and sleep problems in Black and White adolescents. Sleep. 2017;40(1). 10.1093/sleep/zsw031. [DOI] [PMC free article] [PubMed]
- 7.Stein MD, Friedmann PD. Disturbed sleep and its relationship to alcohol use. Subst Abus. 2006;26(1):1–13. doi: 10.1300/J465v26n01_01. [DOI] [PMC free article] [PubMed] [Google Scholar]
- 8.Kim S, DeRoo LA, Sandler DP. Eating patterns and nutritional characteristics associated with sleep duration. Public Health Nutr. 2011;14(5):889–895. doi: 10.1017/S136898001000296X. [DOI] [PMC free article] [PubMed] [Google Scholar]
- 9.Chang JJ, Pien GW, Stamatakis KA, Brownson RC. Association between physical activity and insomnia symptoms in rural communities of southeastern Missouri, Tennessee, and Arkansas. J Rural Health. 2013;29(3):239–247. doi: 10.1111/j.1748-0361.2012.00447.x. [DOI] [PMC free article] [PubMed] [Google Scholar]
- 10.National Institutes of Health . Working group report on problem sleepiness. Bethesda, MD: National Institutes of Health; 1997. [Google Scholar]
- 11.Brown MA, Goodwin JL, Silva GE, Behari A, Newman AB, Punjabi NM, Resnick HE, Robbins JA, Quan SF. The impact of sleep-disordered breathing on body mass index (BMI): the sleep heart health study (SHHS) Southwest J Pulm Crit Care. 2011;3:159. [PMC free article] [PubMed] [Google Scholar]
- 12.Quick V, Byrd-Bredbenner C, White AA, Brown O, Colby S, Shoff S, Lohse B, Horacek T, Kidd T, Greene G. Eat, sleep, work, play: associations of weight status and health-related behaviors among young adult college students. Am J Health Promot. 2014;29(2):e64–e72. doi: 10.4278/ajhp.130327-QUAN-130. [DOI] [PubMed] [Google Scholar]
- 13.Hargens TA, Kaleth AS, Edwards ES, Butner KL. Association between sleep disorders, obesity, and exercise: a review. Nat Sci Sleep. 2013;5:27. doi: 10.2147/NSS.S34838. [DOI] [PMC free article] [PubMed] [Google Scholar]
- 14.Peltzer K, Pengpid S, Samuels T, Özcan NK, Mantilla C, Rahamefy OH, Wong ML, Gasparishvili A. Prevalence of overweight/obesity and its associated factors among university students from 22 countries. Int J Environ Res Public Health. 2014;11(7):7425–7441. doi: 10.3390/ijerph110707425. [DOI] [PMC free article] [PubMed] [Google Scholar]
- 15.Spaeth AM, Dinges DF, Goel N. Effects of experimental sleep restriction on weight gain, caloric intake, and meal timing in healthy adults. Sleep. 2013;36(7):981–990. doi: 10.5665/sleep.2792. [DOI] [PMC free article] [PubMed] [Google Scholar]
- 16.Beccuti G, Pannain S. Sleep and obesity. Curr Opin Clin Nutr Metab Care. 2011;14(4):402. doi: 10.1097/MCO.0b013e3283479109. [DOI] [PMC free article] [PubMed] [Google Scholar]
- 17.Dempsey J, Veasey S, Morgan B, O'Donnell C. Pathophysiology of sleep apnea. Physiol Rev. 2010;90(2):797–798. doi: 10.1152/physrev.z9j-2526-corr.2010. [DOI] [PMC free article] [PubMed] [Google Scholar]
- 18.Vargas PA, Flores M, Robles E. Sleep quality and body mass index in college students: the role of sleep disturbances. J Am Coll Heal. 2014;62(8):534–541. doi: 10.1080/07448481.2014.933344. [DOI] [PMC free article] [PubMed] [Google Scholar]
- 19.Zhang B, Wing Y-K. Sex differences in insomnia: a meta-analysis. Sleep. 2006;29(1):85–93. doi: 10.1093/sleep/29.1.85. [DOI] [PubMed] [Google Scholar]
- 20.St-Onge Marie-Pierre, Perumean-Chaney Suzanne, Desmond Renee, Lewis Cora E., Yan Lijing L., Person Sharina D., Allison David B. Gender Differences in the Association between Sleep Duration and Body Composition: The Cardia Study. International Journal of Endocrinology. 2010;2010:1–8. doi: 10.1155/2010/726071. [DOI] [PMC free article] [PubMed] [Google Scholar]
- 21.Hale L, Do DP. Racial differences in self-reports of sleep duration in a population-based study. Sleep. 2007;30(9):1096–1103. doi: 10.1093/sleep/30.9.1096. [DOI] [PMC free article] [PubMed] [Google Scholar]
- 22.Krueger PM, Coleman-Minahan K, Rooks RN. Race/ethnicity, nativity and trends in BMI among US adults. Obesity. 2014;22(7):1739–1746. doi: 10.1002/oby.20744. [DOI] [PMC free article] [PubMed] [Google Scholar]
- 23.Adenekan B, Pandey A, McKenzie S, Zizi F, Casimir GJ, Jean-Louis G. Sleep in America: role of racial/ethnic differences. Sleep Med Rev. 2013;17(4):255–262. doi: 10.1016/j.smrv.2012.07.002. [DOI] [PMC free article] [PubMed] [Google Scholar]
- 24.Chen X, Wang R, Zee P, Lutsey PL, Javaheri S, Alcántara C, Jackson CL, Williams MA, Redline S. Racial/ethnic differences in sleep disturbances: the multi-ethnic study of atherosclerosis (MESA) Sleep. 2015;38(6):877–888. doi: 10.5665/sleep.4732. [DOI] [PMC free article] [PubMed] [Google Scholar]
- 25.Kim W, Keefe RH. Barriers to healthcare among Asian Americans. Soc Work Public Health. 2010;25(3–4):286–295. doi: 10.1080/19371910903240704. [DOI] [PubMed] [Google Scholar]
- 26.Nomura K, Yamaoka K, Nakao M, Yano E. Social determinants of self-reported sleep problems in South Korea and Taiwan. J Psychosom Res. 2010;69(5):435–440. doi: 10.1016/j.jpsychores.2010.04.014. [DOI] [PubMed] [Google Scholar]
- 27.Cho YW, Shin WC, Yun CH, Hong SB, Kim J, Earley CJ. Epidemiology of insomnia in Korean adults: prevalence and associated factors. J Clin Neurol. 2009;5(1):20–23. doi: 10.3988/jcn.2009.5.1.20. [DOI] [PMC free article] [PubMed] [Google Scholar]
- 28.Yeo B, Perera I, Kok L, Tsoi W. Insomnia in the community. Singap Med J. 1996;37(3):282–284. [PubMed] [Google Scholar]
- 29.Kim K, Uchiyama M, Okawa M, Liu X, Ogihara R. An epidemiological study of insomnia among the Japanese general population. Sleep. 2000;23(1):41–47. doi: 10.1093/sleep/23.1.1a. [DOI] [PubMed] [Google Scholar]
- 30.Kim CS, Ko S-H, Kwon H-S, Kim NH, Kim JH, Lim S, Choi SH, Song K-H, Won JC, Kim DJ. Prevalence, awareness, and management of obesity in Korea: data from the Korea national health and nutrition examination survey (1998-2011) Diabetes Metab J. 2014;38(1):35–43. doi: 10.4093/dmj.2014.38.1.35. [DOI] [PMC free article] [PubMed] [Google Scholar]
- 31.Park CM, Kim YB. Health promotion services and administrative system of the university health clinic. Korean J Health Edu Promot. 2010;27(2):151–163. [Google Scholar]
- 32.Kim YB, Park CM, Kim HH, Han CH. Health behavior and utilization of university health clinics. J Korean Soc Sch Health Educ. 2010;11(1):79–91. [Google Scholar]
- 33.Chang S, Chen Y. Relationships between sleep quality, physical fitness and body mass index in college freshmen. J Sports Med Phys Fitness. 2015;55(10):1234–1241. [PubMed] [Google Scholar]
- 34.Benham G. The association between body mass index and sleep in a predominantly Hispanic college population. Hisp J Behav Sci. 2017;39(3):389–397. doi: 10.1177/0739986317707721. [DOI] [Google Scholar]
- 35.Schuna JM, Jr, Johnson WD, Tudor-Locke C. Adult self-reported and objectively monitored physical activity and sedentary behavior: NHANES 2005-2006. Int J Behav Nutr Phys Act. 2013;10:126. doi: 10.1186/1479-5868-10-126. [DOI] [PMC free article] [PubMed] [Google Scholar]
- 36.Zajacova A, Dowd JB. Reliability of self-rated health in US adults. Am J Epidemiol. 2011;174(8):977–983. doi: 10.1093/aje/kwr204. [DOI] [PMC free article] [PubMed] [Google Scholar]
- 37.American College Health Association. Generalizability, Reliability, and Validity Analysis. [http://www.acha-ncha.org/grvanalysis.html]. Accessed 1 Aug 2016.
- 38.Lewinsohn PM, Seeley JR, Roberts RE, Allen NB. Center for Epidemiologic Studies Depression Scale (CES-D) as a screening instrument for depression among community-residing older adults. Psychol Aging. 1997;12(2):277–287. doi: 10.1037/0882-7974.12.2.277. [DOI] [PubMed] [Google Scholar]
- 39.Banville D, Esrosiers P, Genet-Volet Y. Translating questionnaires and inventories using a cross-cultural translation technique. J Teach Phys Educ. 2000;19:374–387. doi: 10.1123/jtpe.19.3.374. [DOI] [Google Scholar]
- 40.Centers for Disease Control and Prevention. Survey Orientation. [http://www.cdc.gov/nchs/tutorials/nhanes/faqs.htm]. Accessed 6 Dec 2015.
- 41.Detecto. Detecto Health Care Products. [http://www.detecto.com/featured/health-care-products/]. Accessed 15 Sept 2016.
- 42.Sa J, Heimdal J, Sbrocco T, Seo D-C, Nelson B. Overweight and physical inactivity among African American students at a historically Black University. J Natl Med Assoc. 2016;108:77–85. doi: 10.1016/j.jnma.2015.12.010. [DOI] [PubMed] [Google Scholar]
- 43.Zhong W, Cruickshanks KJ, Schubert CR, Nieto FJ, Huang GH, Klein BE, Klein R. Obesity and depression symptoms in the beaver dam offspring study population. Depress Anxiety. 2010;27(9):846–851. doi: 10.1002/da.20666. [DOI] [PMC free article] [PubMed] [Google Scholar]
- 44.World Health Organization . Physical status: the use and interpretation of anthropometry. Report of a WHO Expert Consultation:World Health Organization Technical Report. Geneva: World Health Organization; 1995. [PubMed] [Google Scholar]
- 45.Pan WH, Yeh WT. How to define obesity? Evidence-based multiple action points for public awareness, screening, and treatment: an extension of Asian-Pacific recommendations. Asia Pac J Clin Nutr. 2008;17(3):370–374. [PubMed] [Google Scholar]
- 46.World Health Organization Western Pacific Region . International Association for the Study of obesity and international obesity task force. The Asia-Pacific perspective: redefining obesity and its treatment. Health Communications Australia Pty Limited: Sydney; 2000. [Google Scholar]
- 47.Hirshkowitz M, Whiton K, Albert SM, Alessi C, Bruni O, DonCarlos L, Hazen N, Herman J, Adams Hillard PJ, Katz ES, et al. National Sleep Foundation's updated sleep duration recommendations: final report. Sleep Health. 2015;1(4):233–243. doi: 10.1016/j.sleh.2015.10.004. [DOI] [PubMed] [Google Scholar]
- 48.Centers for Disease Control and Prevention. Glossary: General Concepts. [http://www.cdc.gov/nchs/nhis/tobacco/tobacco_glossary.htm]. Accessed 1 Oct 2014.
- 49.Carnethon MR, De Chavez PJ, Zee PC, Kim KY, Liu K, Goldberger JJ, Ng J, Knutson KL. Disparities in sleep characteristics by race/ethnicity in a population-based sample: Chicago area sleep study. Sleep Med. 2016;18:50–55. doi: 10.1016/j.sleep.2015.07.005. [DOI] [PMC free article] [PubMed] [Google Scholar]
- 50.Park SE, Kim HM, Kim DH, Kim J, Cha BS, Kim DJ. The association between sleep duration and general and abdominal obesity in Koreans: data from the Korean National Health and nutrition examination survey, 2001 and 2005. Obesity. 2009;17(4):767–771. doi: 10.1038/oby.2008.586. [DOI] [PubMed] [Google Scholar]
- 51.Chaput JP, Lambert M, Gray-Donald K, McGrath JJ, Tremblay MS, O'Loughlin J, Tremblay A. Short sleep duration is independently associated with overweight and obesity in Quebec children. Can J Public Health. 2011;102(5):369–374. doi: 10.1007/BF03404179. [DOI] [PMC free article] [PubMed] [Google Scholar]
- 52.Sawyer A, Fisher A, Llewellyn C, Gregory AM. Self-reported sleep quality, weight status and depression in young adult twins and siblings. BMC Obes. 2015;2:50. doi: 10.1186/s40608-015-0079-8. [DOI] [PMC free article] [PubMed] [Google Scholar]
- 53.Kripke DF, Garfinkel L, Wingard DL, Klauber MR, Marler MR. Mortality associated with sleep duration and insomnia. Arch Gen Psychiatry. 2002;59(2):131–136. doi: 10.1001/archpsyc.59.2.131. [DOI] [PubMed] [Google Scholar]
- 54.Taheri S, Lin L, Austin D, Young T, Mignot E. Short sleep duration is associated with reduced leptin, elevated ghrelin, and increased body mass index. PLoS Med. 2004;1(3):e62. doi: 10.1371/journal.pmed.0010062. [DOI] [PMC free article] [PubMed] [Google Scholar]
- 55.Buxton OM, Marcelli E. Short and long sleep are positively associated with obesity, diabetes, hypertension, and cardiovascular disease among adults in the United States. Soc Sci Med. 2010;71(5):1027–1036. doi: 10.1016/j.socscimed.2010.05.041. [DOI] [PubMed] [Google Scholar]
- 56.Dempsey JA, Veasey SC, Morgan BJ, O'Donnell CP. Pathophysiology of sleep apnea. Physiol Rev. 2010;90(1):47–112. doi: 10.1152/physrev.00043.2008. [DOI] [PMC free article] [PubMed] [Google Scholar]
- 57.Pilcher JJ, Ginter DR, Sadowsky B. Sleep quality versus sleep quantity: relationships between sleep and measures of health, well-being and sleepiness in college students. J Psychosom Res. 1997;42(6):583–596. doi: 10.1016/S0022-3999(97)00004-4. [DOI] [PubMed] [Google Scholar]
- 58.Cluskey M, Grobe D. College weight gain and behavior transitions: male and female differences. J Am Diet Assoc. 2009;109(2):325–329. doi: 10.1016/j.jada.2008.10.045. [DOI] [PubMed] [Google Scholar]
- 59.Levitsky DA, Halbmaier CA, Mrdjenovic G. The freshman weight gain: a model for the study of the epidemic of obesity. Int J Obes. 2004;28(11):1435–1442. doi: 10.1038/sj.ijo.0802776. [DOI] [PubMed] [Google Scholar]
- 60.D'Souza MJ, Walls KJ, Rojas C, Everett LM, Wentzien DE. Effect of gender and lifestyle behaviors on BMI trends in a sample of the first State's undergraduate population. Am J Health Sci. 2015;6(1):59–74. doi: 10.19030/ajhs.v6i1.9270. [DOI] [PMC free article] [PubMed] [Google Scholar]
- 61.Brewis AA, Han SY, SturtzSreetharan CL. Weight, gender, and depressive symptoms in South Korea. Am J Hum Biol. 2017;29(4):e22972. 10.1002/ajhb.22972. [DOI] [PMC free article] [PubMed]
- 62.Buboltz WC, Jr, Brown F, Soper B. Sleep habits and patterns of college students: a preliminary study. J Am Coll Heal. 2001;50(3):131–135. doi: 10.1080/07448480109596017. [DOI] [PubMed] [Google Scholar]
- 63.Kim SJ, Lyoo IK, Won CY, Jeong DU. Characteristics of sleep pattern among Korean college students. Sleep Med and Psychophysiol. 2006;1:15–21. [Google Scholar]
- 64.Grandner MA, Chakravorty S, Perlis ML, Oliver L, Gurubhagavatula I. Habitual sleep duration associated with self-reported and objectively determined cardiometabolic risk factors. Sleep Med. 2014;15(1):42–50. doi: 10.1016/j.sleep.2013.09.012. [DOI] [PMC free article] [PubMed] [Google Scholar]
- 65.Nelson TF, Gortmaker SL, Subramanian SV, Cheung L, Wechsler H. Disparities in overweight and obesity among US college students. Am J Health Behav. 2007;31(4):363–373. doi: 10.5993/AJHB.31.4.3. [DOI] [PubMed] [Google Scholar]
- 66.Grandner MA, Williams NJ, Knutson KL, Roberts D, Jean-Louis G. Sleep disparity, race/ethnicity, and socioeconomic position. Sleep Med. 2016;18:7–18. doi: 10.1016/j.sleep.2015.01.020. [DOI] [PMC free article] [PubMed] [Google Scholar]
- 67.Lund HG, Reider BD, Whiting AB, Prichard JR. Sleep patterns and predictors of disturbed sleep in a large population of college students. J Adolesc Health. 2010;46(2):124–132. doi: 10.1016/j.jadohealth.2009.06.016. [DOI] [PubMed] [Google Scholar]
Associated Data
This section collects any data citations, data availability statements, or supplementary materials included in this article.
Data Availability Statement
Data can be made available through the authors.