

Abstract
This study looked to investigate a new quantitative metric, R2 – R1ρ (1/T2 – 1/T1ρ), using magnetic resonance (MR) images and voxel-based relaxometry (VBR) for detecting early cartilage degeneration and explore the association with patient-reported outcomes measures (PROMs) in patients 6 months after ACL reconstruction. Sixty-four patients from three sites were bilaterally scanned on a 3T MR with a combined T1ρ/T2 protocol to calculate R1ρ (1/T1ρ) and R2 (1/T2) values at baseline and 6 months after reconstructive surgery. Non-rigid registration was applied to align images onto a template, allowing VBR to determine VBR rate differences and explore cross-sectional and longitudinal differences between injured and uninjured knees, generating Statistical Parametric Maps (SPMs). Baseline R2 – R1ρ differences were further correlated with change in PROMs from the Knee Injury and Osteoarthritis Outcome Score (KOOS) from baseline to 6 months. Cross-sectional results demonstrated low relaxation rate differences in the injured patella (baseline: 21%, p = 0.01; 6-months: 18%, p = 0.02), lateral tibia (baseline: 25%, p = 0.01; 6-months: 24%, p = 0.01), and weight-bearing regions of the tibia and femur. The uninjured patella showed significant longitudinal changes (17%, p = 0.02). R2 – R1ρ differences showed significant correlations with KOOS PROMs, particularly in the lateral tibia, patella, and trochlea. R2 – R1ρ difference VBR analyses provide new and highly sensitive parameters for assessing early cartilage degeneration in patients after ACL injury by integrating findings from both T1ρ and T2, commonly used relaxation time parameters, into a single metric. © 2016 Orthopaedic Research Society. Published by Wiley Periodicals, Inc. J Orthop Res
Keywords: R2–R1ρ, voxel-based relaxometry, ACL injury, cartilage degeneration, KOOS
The association between anterior cruciate ligament (ACL) injury and the subsequent onset of early knee osteoarthritis (OA) despite reconstructive surgery (ACLR) is a well-researched phenomenon.1–3 Characteristic joint space narrowing and morphological cartilage changes are clear indicators of OA, with radiographic joint space narrowing as the gold standard modality for OA evaluation.4 However, biochemical and macromolecular changes are thought to precede these larger morphologic changes. The degradation of proteins, specifically proteoglycan (PG) and glycosaminoglycan (GAG) aggrecan depletion, collagen fibrillation, and loss from the extracellular matrix (ECM), have been shown to initiate morphologic changes in early stages of OA, which eventually result in cartilage thinning, fissuring, and, ultimately, pain.5–8 To date, treatment options for OA are largely relegated to pain management or invasive surgical replacement, partially due to poor sensitivity and specificity of standard diagnostic methods.6,9 Thus, refining and discovering accurate methods to detect early, subtle stages of this debilitating disease are imperative.
Currently, non-invasive magnetic resonance (MR) imaging methods are employed in many cartilage and OA studies, as they offer highly sensitive approaches to evaluate cartilage compositional changes prior to observable morphologic changes. In particular, T1ρ, the parameter describing spin-lattice relaxation in the rotating frame, and T2, spin–spin relaxation related to energy changes between proton spins, have shown to provide complementary information on cartilage quality and structure.7,10 Many studies have investigated the role of the T1ρ parameter in biological tissues, demonstrating that PG content, specifically the motion-restricted water molecules in their macromolecular environment, contributes to T1ρ relaxation.7,11,12 Elevations of T1ρ have been observed in individuals with OA, thought to be due to PG loss.7,9 The dipolar interaction of water protons associated with collagen contributes to T2 relaxation, and has been shown to be sensitive to water interactions within the cartilage ECM.10,11 In fact, a correlation between average T1ρ and T2 relaxation times in cartilage of individuals with OA has been reported.7 Despite the non-point-to-point relationship observed, this nevertheless implies complementary information for detecting cartilage degeneration.7,13 In another study correlating T1ρ and T2 in OA patients, Li et al. proposed that a weaker association may be observed in the early stages of disease, as T1ρ may indicate PG loss, while T2 is more sensitive to collagen network organization; yet, in later stages of degeneration, both T1ρ and T2 values are affected by PG loss and hydration changes, suggesting a stronger association.9
Brought to the forefront of relaxation time critiques are the experimental parameter-dependency and effects of different locking field strengths on relaxation times.7,14,15 Measuring relaxation times at different locking fields negates this frequency dependency, a phenomenon known as dispersion.11,14–16 Concurrent research with relaxation dispersion also analyzes relaxation rates and relaxation rate dispersions, R1ρ (1/T1ρ) and R2 (1/T2), which several studies have correlated with cartilage quality.8,14,17,18 Furthermore, data suggests correlations between PG and GAG concentrations with R1ρ rates, as well as complementing traditional relaxation time measurements.11,19,20 R2 similarly has been correlated with collagen content and orientation.21 In an effort to comprehensively describe the cartilage ECM with a single metric, we assessed the difference of R2 and R1ρ (Please see Supporting Information Appendix 1 for a further explanation of R2 – R1ρ). Combining cartilage relaxation times into a single metric has been suggested in other studies, such as the ratio of T1ρ and T2 to assess cartilage macromolecular complexity.20 As previously mentioned, other studies have noted the complementary information from T1ρ and T2 regarding cartilage degeneration.12,14 In this study, the proposed R2 – R1ρ metric offers a new gauge of cartilage degeneration, incorporating previous understandings of T1ρ and T2 to better understand larger macromolecular changes into a single parameter.
In this multicenter study, voxel-based relaxometry (VBR), a novel and sensitive quantitative technique, is used to cross-sectionally and longitudinally analyze cartilage of patients with ACL tears at the time of injury and 6 months after ACLR using R2 – R1ρ differences to highlight macromolecular changes.22 We further assessed the correlation between R2 – R1ρ differences in the injured knee and the change in patient-reported outcome measures (PROMs) over time points using the Knee Injury and Osteoarthritis Outcomes Score (KOOS) survey, a validated method to accurately measure patient-reported outcomes, to assess whether baseline relaxation times could predict the longitudinal change in KOOS.23 In traditional quantitative relaxation time studies, region of interest (ROI)-based methods are employed to quantify average times within a cartilage region. VBR is capable of detecting extremely localized cartilage changes in the early stages of degeneration and may reveal regions of change where global analyses may not. As compositional changes occur before morphological evidence is observed, a composite parameter reflecting both proteoglycan and collagen changes may be beneficial in characterizing the macromolecular environment of the cartilage and combined with VBR, could provide additional, more targeted information on localized cartilage changes, as well as a potential new biomarker to predict future patient-reported outcomes.
METHODS
Approval
This study was approved by the Institutional Review Board (IRB). All patients provided informed consent prior to scanning by the Committee on Human Research of the home institution.
Calibration
An initial cohort of 16 healthy volunteers was scanned at all sites to establish reliability.24 Scan/rescan comparisons of group averages yielded a CV of 1.84%, and scan/rescan for each subjects yielded a CV of 11.62%. No significant differences were observed between scan/rescan or between sites.
Subjects
A total of 64 patients (28 female; age = 28.3 ± 12.5 years; BMI = 24.5 ± 3.1 kg/m2) were recruited from three sites: University of California, San Francisco (San Francisco, CA), Mayo Clinic (Rochester, MN), and Hospital for Special Surgery (New York City, NY). Sixty of these patients sustained acute, unilateral ACL tears and had no previous history of knee trauma or disease, two patients had previous ACLR in the contralateral knee, and two patients did not undergo ACLR (n = 64 patients). To date, 56 patients (24 female; age = 29.3 ± 12.7 years; BMI = 24.7 ± 3.1 kg/m2) have returned 6 months after ACLR for follow-up studies (Table 1); the two patients without ACLR returned 6 months following injury.
Table 1.
Patient Demographic Characteristics
| Characteristic | Baseline | 6 Months |
|---|---|---|
| Total | n = 64 | n = 56 |
| Malea | 36 (56%) | 32 (57%) |
| Femalea | 28 (44%) | 24 (43%) |
| Age (years)b | 28.3 ± 12.5 | 29.3 ± 12.7 |
| BMI (kg/m2)b | 24.5 ± 3.1 | 29.3 ± 3.1 |
| Time from injury to baseline scan (days)b | 18.5 ± 7.9 | – |
| Time from injury to surgery (days)b | 49.1 ± 31.2 | – |
| ACL graft (baseline n = 63; 6-month n = 56)a | ||
| Hamstring-semitendinosus + gracilis | 17 (27%) | 16 (29%) |
| Hamstring-semitendinosus | 4 (6%) | 4 (7%) |
| Posterior tibialis | 6 (10%) | 6 (11%) |
| Bone-patella tendon-bone (B-PT-B) | 28 (44%) | 22 (39%) |
| Achilles tendon | 6 (10%) | 6 (11%) |
| No ACLR | 2 (3%) | 2 (4%) |
| Type of graft (baseline n = 60, 6-month n = 53)a | ||
| Allograft | 13 (22%) | 13 (25%) |
| Autograft | 47 (78%) | 40 (75%) |
| Meniscal tear (baseline n = 63; 6-month n = 56)a | ||
| Yes meniscal tear | 40 (63%) | 35 (63%) |
| Repair | 18 (45%) | 16 (46%) |
| Excision | 12 (30%) | 8 (23%) |
| Repair + excision | 4 (10%) | 5 (14%) |
| Other/None | 6 (15%) | 6 (17%) |
| KOOS painb | 65.0 ± 15.9 | 85.8 ± 10.9 |
| KOOS symptomb | 59.8 ± 16.2 | 81.5 ± 12.9 |
| KOOS activity of daily lifeb | 69.4 ± 20.2 | 95.6 ± 8.2 |
| KOOS sportb | 31.5 ± 32.4 | 64.4 ± 25.2 |
| KOOS quality of lifeb | 29.3 ± 16.2 | 56.4 ± 14.9 |
Data expressed as count (percentage %).
Data expressed as mean ± standard deviation.
Patient-Reported Outcome Measure (PROM) Questionnaires
Prior to scanning, all patients completed the KOOS questionnaire at baseline and 6 months after ACLR (Table 1). The KOOS survey is subdivided into five categories: pain, symptoms, activities of daily living (ADL), sport function, and knee-related quality of life (QOL). Scores on a 0–100 scale (0 as the worst, 100 as best) allow for quantification these categories.23
MRI Protocol
All subjects sat for a standard rest period of 45 min prior to MRI acquisition to unload the cartilage. Images were acquired on a 3T MR (General Electric Healthcare, Milwaukee, WI) using an eight-channel phased array knee coil (Invivo, Inc., Gainesville, FL) at two time points, the time of injury (baseline; Table 1) and 6-month follow-up, on both the injured and uninjured knees; the uninjured knee was scanned first. MRI sequence protocol included the following: (i) sagittal intermediate-weighted, fluid sensitive, fat-saturated three-dimensional (3D) fast spin-echo (CUBE) images (TR/TE = 1,500/25 ms, FOV = 16 cm, 384 × 384 matrix, slice thickness = 1 mm, echo train length = 50, BW = 50 kHz, NEX = 0.5) and (ii) sagittal combined 3D T1ρ/T2 (T1ρ TSL = 0/10/40/80 ms, FSL = 500 Hz, FOV = 14 cm, 256 × 128 matrix, slice thickness = 4 mm, T2 preparation TE = 0/12.87/25.69/51.39 ms).25 All images underwent an automatic quality control procedure designed to check the stability of the MRI protocol settings. Duplicate agarose phantoms were scanned monthly at each of the three sites to ensure longitudinal cross-calibration, showing CVs of 1.3–2.6% for T1ρ and 1.2–2.7% for T2.24
Image Processing
All image post-processing was performed at a single site with in-house programs written in MatLab (MathWorks, Natick, MA), integrated with the elastix toolbox for non-rigid image registration.22,26,27 The minimum deformation template reference was established by analyzing the Jacobian determinant (J). Reference sagittal high-resolution CUBE images were rigidly registered using the VTK CISG registration toolkit with the first TSL = 0, T1ρ-weighted image, and then used for segmentation. Six cartilage compartments were defined, the medial femoral condyle (MF), medial tibia (MT), lateral femoral condyle (LF), lateral tibia (LT), femoral trochlea (TrF), and patella (P), and semi-automatically segmented using a Bezier spline and edge detection-based method.28 The non-rigid registration technique was applied between the reference and each first TSL = 0, T1ρ-weighted image in the dataset. The transformation field was applied to all later TSL images.
T1ρ and T2 maps were acquired by fitting the morphed T1ρ-weighted/T2-weighted images from different TSL/TEs, employing a Levenberg–Marquardt mono-exponential:
| (1) |
| (2) |
applied to each voxel.29 Thresholds for individual relaxation times of each voxel were set (T1ρ: minimum >0ms, maximum = 130 ms; T2: minimum >0ms, maximum = 100 ms). The inverse of the thresholded T1ρ and T2 were taken to compute the corresponding R1ρ and R2 values. Finally, the reference-ROIs were applied to the morphed maps, establishing a fully automatic atlas-based segmentation procedure.
In prior studies, elevations in T1ρ and T2 have been associated with cartilage degeneration; additionally, a correlation between T1ρ and T2 has also been associated with cartilage degeneration in osteoarthritic patients.7 In our analysis, strong correlations between R1ρ and R2 can also be seen throughout the cartilage (Fig. 1); however, these correlations are not always homogeneous, even within compartments, thus further driving our notion for a single, combined metric that incorporates both T1ρ and T2. Parametric maps reflecting R2 – R1ρ and correlations were computed.
Figure 1.

Average cross-sectional R1ρ and R2 correlation SPMs of all patients overlaid onto registered image at baseline. Higher correlations indicate more similar R1ρ and R2 values. Correlation between R1ρ and R2, despite being high throughout the cartilage, clearly shows regions of higher and lower correlation heterogeneously throughout compartments.
Statistical Analyses
Statistical Parametric Mapping (SPM) was conducted to study the cross-sectional localized R2 – R1ρ differences and KOOS correlations of the injured and uninjured knees. Voxel-based summary statistics, such as percentages of the voxels showing significance (PSV), average percentage differences (APD), and average p-values (p) in the overall compartment were computed for each compartment in the injured and uninjured knees. A random field correction was used to take into account possible false positive results due to multiple comparisons.30 The APD and p-values for compartments with PSV less than 1% of voxels were not considered. Values from individual patients that fall outside of the set thresholds were not included in the calculations or correlations. Average percent differences (APD) were analyzed in the areas of the SPMs that only showed significance (p < 0.05). The same procedure was adopted to analyze R2 – R1ρ longitudinal changes, also summarized by SPMs. Longitudinal statistical analyses were conducted only with patients with data from both time points. Lastly, the Pearson partial correlations between baseline R2 – R1ρ values and the change in KOOS sub-scores over 6 months were calculated and also assessed by SPMs, adjusting for age, gender, and BMI.
RESULTS
R2 – R1ρ Difference Analyses: Cross-Sectional Analysis
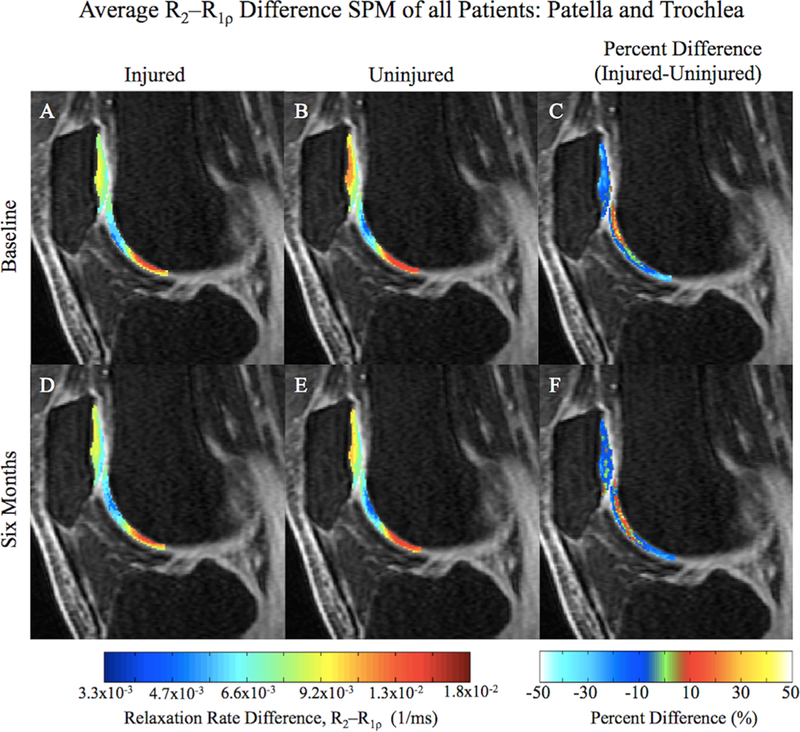
A summary of statistical values (PSV, APD, and p) for all cross-sectional and longitudinal results can be seen in Table 2. In the cross-sectional analysis, R1ρ and R2 were determined from the inverse of T1ρ and T2, and the R2 – R1ρ values were computed with an in-house program. Comparing injured and uninjured knees at baseline, the patella indicated the largest Δ(R2 – R1ρ) difference between sides (Fig. 2A–C); the uninjured patella displayed larger R2 – R1ρ values than the injured patella (PSV = 64%, APD = 21%, p = 0.01). The LT similarly displayed significantly larger average R2 – R1ρ values in the uninjured side when compared to the injured at baseline, seen in Figure 3A–C (PSV = 35%, APD = 25%, p = 0.01). Particularly different was the most posterior aspect of the posterior LT (pLT). The trochlea also had larger R2 – R1ρ values in the uninjured knee when compared to the injured knee at baseline (PSV = 24%, APD = 25%, p = 0.02). As with these other compartments, the MT and MF both displayed larger average R2 – R1ρ values in the uninjured knee (MT: PSV = 12%, APD = 25%, p = 0.02; MF: PSV = 24%, APD = 24%, p = 0.01). The LF indicated a smaller difference between the sides, also with larger uninjured average R2 – R1ρ values (PSV = 11%, APD = 25%, p = 0.02).
Table 2.
R2 – R1ρ Difference Resultsa
| Baseline |
6 Months |
|||||
|---|---|---|---|---|---|---|
| PSV (%) | APD (%) | p | PSV (%) | APD (%) | p | |
| Cross-sectional | ||||||
| Injured > uninjured | ||||||
| MF | 2 | 25 | 0.02 | 4 | 34 | 0.03 |
| MT | 0 | – | – | 0 | 35 | 0.03 |
| LF | <1 | – | – | 9 | 50 | 0.02 |
| LT | 0 | – | – | 1 | 42 | 0.02 |
| TrF | 2 | 27 | 0.03 | 0 | 36 | 0.03 |
| P | 0 | – | – | 0 | – | – |
| Injured < uninjured | ||||||
| MF | 24 | 24 | 0.01 | 22 | 27 | 0.01 |
| MT | 12 | 25 | 0.02 | 33 | 28 | 0.02 |
| LF | 11 | 25 | 0.02 | 3 | 29 | 0.02 |
| LT | 35 | 25 | 0.01 | 34 | 24 | 0.01 |
| TrF | 24 | 25 | 0.02 | 22 | 24 | 0.02 |
| P | 64 | 21 | 0.01 | 18 | 18 | 0.02 |
| Injured |
Uninjured |
|||||
| PSV (%) | APD (%) | p | PSV (%) | APD (%) | p | |
| Longitudinal | ||||||
| Baseline <6 months | ||||||
| MF | 1 | 34 | 0.02 | 1 | 27 | 0.03 |
| MT | <1 | – | – | 0 | – | – |
| LF | 4 | 42 | 0.03 | <1 | – | – |
| LT | 3 | 48 | <0.01 | 0 | – | – |
| TrF | 2 | 44 | 0.03 | <1 | – | – |
| P | <1 | – | – | 0 | – | – |
| Baseline >6 months | ||||||
| MF | 4 | 21 | 0.02 | 4 | 21 | 0.03 |
| MT | 8 | 25 | 0.03 | <1 | – | – |
| LF | 0 | – | – | 3 | 26 | 0.03 |
| LT | 20 | 25 | 0.02 | 12 | 18 | 0.02 |
| TrF | 13 | 21 | 0.02 | <1 | – | – |
| P | 5 | 19 | 0.02 | 27 | 17 | 0.02 |
Compartments with <1% of PSV do not have APD and p values displayed. MF, medial femoral condyle; MT, medial tibia; LF, lateral femoral condyle; LT, lateral tibia; TrF, trochlea; P, patella.
Figure 2.
Average cross-sectional R2 – R1ρ SPMs of all patients overlaid onto registered image (A, B, D, and E) with the corresponding average percent difference maps (C and F) in the patella and trochlea. Lower relaxation rate differences indicate more similar R1ρ and R2 values.
Figure 3.

Average cross-sectional R2 – R1ρ SPMs of all patients overlaid onto registered image (A, B, D, and E) with the corresponding average percent difference maps (C and F) in the lateral part of the knee. Lower relaxation rate differences indicate more similar R1ρ and R2 values.
When assessing the injured and uninjured sides at 6 months, the previous trend of greater R2 – R1ρ values in the uninjured knee from baseline was still observed (Table 2). However, in the patella, seen in Figure 2D–F, the quantity of significantly changing voxels (PSV) as well as the degree of change (APD) were lower, particularly within the deep layer (PSV = 18%, APD = 18%, p = 0.02). The LT displayed a similar quantity of significantly changing voxels to baseline, also to a similar degree of change (PSV = 34%, APD = 24%, p = 0.01), with only 1% of voxels indicating greater R2 – R1ρ values in the injured compared to the uninjured knee (Fig. 3D–F). The trochlea also displayed a similar quantity of voxel change at 6 months to baseline, with a similar degree of change (PSV = 22%, APD = 24%, p = 0.02). In the medial side of the knee, the MT and MF also continued this trend of greater R2 – R1ρ values in the uninjured knee compared to the injured knee (MT: PSV = 33%, APD = 28%, p = 0.02; MF: PSV = 22%, APD = 27%, p = 0.01). The LF did not adhere to this trend, as seen in Figure 3D–F, displaying some voxels with larger values in the injured knee than uninjured (PSV = 9%, APD = 50%, p = 0.02).
R2 – R1ρ Difference Analyses: Longitudinal Analysis
Longitudinal analyses of R2 – R1ρ were conducted to accurately quantify cartilage changes over the 6-month period (Table 2). In the injured knee, the LT (Fig. 4A–C) and trochlea (Fig. 5A–C) showed the most relaxation rate difference changes (Δ(R2 – R1ρ)) over 6 months. Both compartments overall demonstrated greater baseline R2 – R1ρ values than 6-month differences (LT: PSV = 20%, APD = 25%, p = 0.02; TrF: PSV = 13%, APD = 21%, p = 0.02). The LT did display a small intense region centered on the most posterior aspect of the pLT where the 6-month average R2 – R1ρ values were higher than baseline (PSV = 3%, APD = 48%, p < 0.01). The LF also showed a small intense region with higher 6-month R2 – R1ρ values (PSV = 4%, APD = 42%, p = 0.03), and had almost no significant voxels that indicated higher baseline R2 – R1ρ values (PSV < 1%). The patella (Fig. 5A–C) and the medial compartments of the injured knee had regions of slightly higher baseline R2 – R1ρ values than 6-month values (P: PSV = 5%, APD = 19%, p = 0.02; MT: PSV = 8%, APD = 25%, p = 0.03; MF: PSV = 4%, APD = 21%, p = 0.02).
Figure 4.

Average longitudinal R2 – R1ρ SPMs of patients with data from both times overlaid onto registered image (A, B, D, and E) with the corresponding average percent difference maps (C and F) in the lateral part of the knee. Lower relaxation rate differences indicate more similar R1ρ and R2 values. While the majority of the injured LT shows larger differences at baseline, the most posterior aspect of the pLT shows the opposite.
Figure 5.

Average longitudinal R2 – R1ρ SPMs of patients with data from both times overlaid onto registered image (A, B, D, and E) with the corresponding average percent difference maps (C and F) in the patella and trochlea. Lower relaxation rate differences indicate more similar R1ρ and R2 values. The uninjured patella indicates lower differences at six months when compared to baseline.
In the uninjured knee, a large Δ(R2 – R1ρ) was observed in the patella (Fig. 5D–F), indicating higher R2-R1ρ at baseline, particularly noticeable in the deeper layers (PSV = 27%, APD = 17%, p = 0.02). A similar change was detected in the LT after 6 months, seen in Figure 4D–F (PSV = 12%, APD = 18%, p = 0.02). Almost no longitudinal change was observed in the LF (PSV = 3%, APD = 26%, p = 0.03). The trochlea (Fig. 5D–F) and medial compartments did not show much relaxation rate change in the uninjured knee after 6 months (TrF: PSV <1%; MT: PSV <1%; MF: PSV = 4%, APD = 21%, p = 0.03).
KOOS and R2 – R1ρ Correlation Analyses
Average KOOS for all patients divided by sub-score can be seen in Table 1; each sub-score is significantly increasing (p < 0.001) from baseline to 6 months, as assessed by paired Student t-tests, despite the large standard deviations. Correlating the change in KOOS sub-scores over 6 months with baseline R2 – R1ρ values in the injured knee, there is a significant correlation with the change in KOOS pain over 6 months in the deep layer of the patella (PSV = 4.1%, R = 0.359, p = 0.03) and the weight-bearing LT (PSV = 6.1%, R = 0.356, p = 0.03) (Fig. 6A and C), as well as with the change in KOOS sport over 6 months in the entire injured trochlea (PSV = 29.9%, R = 0.366, p = 0.02) (Fig. 6B and D). Change in KOOS ADL also demonstrated a significant correlation with the R2 – R1ρ values in the injured trochlea (PSV = 18.1%, R = 0.339, p = 0.02), deep layer of the patella (PSV = 7.8%, R = 0.347, p = 0.02), and the weight-bearing LT (PSV = 7.9%, R = 0.349, p = 0.03).
Figure 6.

Average correlation between ΔKOOS sub-scores and the R2 – R1ρ differences overlaid onto registered image (A and B) with corresponding significance (p-value) SPM (C and D). The deep layer of the patella and the weight-bearing LT show high correlation with ΔKOOS Pain, where the entire trochlea shows a strong correlation with ΔKOOS Sport.
DISCUSSION AND CONCLUSIONS
In this study, we analyzed the cartilage of patients at baseline and 6 months after ACLR using R2 — R1ρ differences to better assess the macromolecular interactions in cartilage ECM following ACL injury. Combining cartilage T1ρ and T2 in a single metric has been previously proposed; in a recent study by Keenan et al., the ratio T1ρ/T2 is used to assess local environment complexity.20 With the proposed relaxation rate difference that we have used, lower values indicate more similar R1ρ and R2. A convergence of relaxation rates is attributed to increasing T1ρ and T2 relaxation times, just as the T1ρ/T2 ratio in an unstructured liquid environment, such as degenerating cartilage, will approach 1.20 As many prior studies have noted, T1ρ values are greater than T2 throughout healthy cartilage tissue, and together offer complementary information on cartilage degeneration.12,14
In the cross-sectional R1ρ and R2 relaxation rate difference analysis, a general trend of higher average differences in the uninjured knee compared to the injured was observed. Lower differences in the injured patella, LT, and weight-bearing regions of the tibia and femur (Figures 2 and 3), suggest that these injured compartments experience more degeneration than the uninjured knee compartments, a phenomenon previously elucidated.31,32 At 6 months, the LT, MT, and patella still demonstrated lower differences in the injured knee, suggesting more degeneration in the injured knee than uninjured. Previous research has indicated that the most severe chondral injuries at the time of the ACL injury have been observed in the lateral compartments (LT and LF), especially the pLT, precisely where the pivot shift and transchondral contusion transpires.3,13 A subsequent elevation in T1ρ has been reported in the non-weight-bearing lateral compartments.10,31 Together, these previous findings support our observations of lower R2 – R1ρ differences in the injured knees at both time points (Figures 2 and 3). Some research has detailed the lack of distinctive T1ρ characteristics between injured and uninjured knees in the lateral side.9,31 However, VBR analysis was designed to detect extremely localized cartilage changes, and thus may detect what global analyses might not.
Previous research has also often cited the MT and MF compartments of the injured knee as frequent sites for early degeneration.10,31,32 Li et al. explained that the medial weight-bearing regions of the MF and MT are regions where the earliest signs of cartilage degeneration can be observed.13 Frobell et al. have noted that ACLR was directly related to bone marrow lesions and increased joint fluid volume in the MF at six months after ACLR, two accepted features of early OA.33 Indeed, at baseline and 6 months, our data clearly shows higher R2 – R1ρ differences in the medial compartments of the uninjured knee compared to the injured, especially in the deep layer of the weight-bearing regions. Comparing the injured and uninjured patella at both times also yielded interesting results, with significant disparities at baseline (PSV = 64%; Fig. 2A–C). Much of the dissimilarity can be seen in the deep layer of the patella, adjacent to the subchondral bone surface (Fig. 2C), an observation also noted by Li et al.9
Longitudinally, one of the most significant findings was observed in the LT of the injured knee. An average longitudinal decrease of R2 – R1ρ differences in the 6-month LT of the injured knee was observed, when compared to baseline, except for the most posterior aspect of the pLT (Fig. 4C). This region, encompassing the 3% of voxels (PSV) that indicated a 48% difference change (APD) from baseline to 6 months, shows that the R2 – R1ρ differences at baseline are lower than the 6-month differences. Such a finding echoes the results from a previous subcompartmental analysis conducted by Li et al., which noted that the T1ρ and T2 values in this region of the LT superficial layer decreased one year after ACLR, and were comparable to the values observed in the uninjured knee.13 Another significant finding from the longitudinal analysis was the significant decrease in R2 – R1ρ differences over 6 months in the uninjured patella (Fig. 5D–F). A slight decrease was also observed in the injured patella (PSV= 5%), possibly caused by the longitudinal degeneration of patella cartilage following injury, as described by Potter et al.3
The drastic change observed in the uninjured patella may be due to altered ambulatory kinematics following ACLR.32 This dynamic, longitudinal change (PSV = 27%, APD = 17%, p = 0.02) could be a response to the delayed structural restitution of the ACL in the injured knee.33 Gait change following ACLR has been well studied and even targeted as a potential cause for post-traumatic cartilage degeneration.34–36 In one study, the internal–external rotation of the reconstructed knee during the stance phase of walking was found to be significantly different than the uninjured contralateral knee, with the reconstructed knee showing consistent external rotation offset across majority of subjects; such an offset was hypothesized to place loads on cartilage with differing ability to withstand loads, thus leading to degeneration.37 Moreover, surgical reconstruction of the ACL may not completely restore the injury-induced anterior tibial translation, providing more evidence for a shift in kinematic gait following reconstruction; such an anterior shift may place more load on the patellar cartilage.38 In the injured knee, reevaluations of surgical procedures have been made in response to this evidence of insufficient restoration of joint kinematics.39
To further assess the relationship of R2 – R1ρ with the cartilage after ACL-injury and reconstruction, we correlated PROMs using KOOS sub-scores with the R2 – R1ρ differences in the injured knee. KOOS is a frequently used PROM that has been shown to accurately monitor disease course and outcomes.23 Furthermore, KOOS has been previously correlated with T1ρ and T2 in a different ACL-injured cohort, and thus stands as an appropriate measure to compare this proposed R2 – R1ρ metric.40 Fortunately, all KOOS sub-scores increased significantly following ACLR, indicating a trend toward recovery of function and lower pain for the majority of individuals (Table 1). However, the high standard deviations indicate that not all patients demonstrated this upwards trend; in fact, nine of the 54 patients at 6 months (16%) had lower KOOS sub-scores in every category. Thus, we sought to correlate the change in KOOS sub-scores between the scan times with the R2 – R1ρ differences on a voxel-by-voxel basis in the injured knee. As seen in Figure 6, a strong correlation with ΔKOOS Pain in the deep layer of the patella and LT can be seen, as well as a strong correlation with ΔKOOS Sport in the trochlea; other subcategories, such as ΔKOOS ADL, showed similar trends. Interestingly, when KOOS sub-scores were correlated individually with the T1ρ and T2 on a voxel-by-voxel basis in the injured knee, these regions previously demonstrating a strong correlation with R2 – R1ρ, showed a similar trend, though not as significant as with R2 – R1ρ (see Supporting Information Figures).
This study is the first to employ VBR to relaxation rate analysis, yet is not the first endeavor to use estimated relaxation rates computed from acquired T1ρ and T2 values.14 In this study, the R2 – R1ρ difference offers a possible new gauge of cartilage degeneration, incorporating previous understandings of T1ρ and T2 to better understand larger macromolecular changes into a single parameter. The high sensitivity of VBR further accentuates the early stages of degeneration, which sometimes goes undetected in global ROI-based methods.7,22
It is important to note that the Magic Angle effect may play a role in the R2 – R1ρ difference results, as T1ρ and T2 are not equally influenced.41 However, considering the strict positioning of the knee during scanning, employing VBR and using an atlas-model, the effect from the Magic Angle would be in the same anatomical region in the injured and uninjured knees, as well as at both time points. Thus, when assessing cross-sectional or longitudinal changes, the Magic Angle effect should be minimized. An aspect not explicitly assessed in this study was the confounding factor of meniscal tears. As Potter et al. specified, meniscal tears sustained during the ACL injury have an increased risk of post-traumatic cartilage degeneration, muddling the evaluation of isolated ACL injuries and post-reconstruction effects.3 A larger sample size and extended longitudinal analysis would also further augment and validate the findings of this study.
Another possible advantage of developing a composite metric based on R2 – R1ρ is if the images were obtained in this combined sequence for identical values of TE and TSL, then combining Equations (1 and 2), and taking the negative logarithm of the signals R2 – R1ρ could be computed:
| (3) |
This would obviate the need for acquiring multiple images with TE and TSL values as well as computing each of the parameters, thus making imaging faster. Clearly, further research on the propagation of errors, reproducibility of the measure, and susceptibility to artifacts will need to be assessed. However, the notion of reducing imaging time coupled with our fully automatic post-processing pipeline would have tremendous impact on the translation of these techniques to routine clinical applications. In conclusion, we have acquired multi-site quantitative MR imaging data, proposed a new metric for characterizing the cartilage ECM, and using VBR in subjects with ACL injury, shown differences in injured and uninjured knees at baseline and 6 months following reconstructive surgery, as well as correlated this composite metric with a well-validated PROM. These results suggest the possible use of the compositional R2 – R1ρ parameter as an imaging biomarker to stratify patients after ACL injury.
Supplementary Material
ACKNOWLEDGMENTS
This study was possible thanks to the combined efforts of the AF-ACL Consortium, and was funded by the Arthritis Foundation (AF) and the National Institute of Arthritis and Musculoskeletal and Skin Diseases, a subset of the National Institutes of Health, under Award Number P50 AR-060752. HSS and UCSF received funding from AF and General Electric Healthcare. Mayo received funding from AF. The content is solely the responsibility of the authors and does not necessarily represent the official views of the National Institutes of Health.
Grant sponsor: Arthritis Foundation; Grant number: A121754;
Grant sponsor: National Institute of Arthritis and Musculoskeletal and Skin Diseases; Grant number: P50AR060752.
Footnotes
Conflicts of interest: The authors involved in this study have research grant funding, which is listed in the Section Acknowledgements. The Arthritis Foundation funded this study at three sites (University of California, San Francisco, Hospital for Special Surgery, Mayo Clinic), and UCSF and HSS Received funding from General Electric Healthcare. Dr. Sharmila Majumdar is an advisor to Samumed.
AF-ACL Consortium (see the Section Acknowledgments).
SUPPORTING INFORMATION
Additional supporting information may be found in the online version of this article at the publisher’s web-site.
THE ARTHRITIS FOUNDATION-ACL CONSORTIUM
The HSS (New York City, NY) team for the AF-ACL Consortium is: Matthew F. Koff, PhD; Steven R. Goldring, MD; Mary Goldring, PhD; Jo A. Hannafin, MD, PhD; Robert G. Marx, MD, MSc, FRCSC; Danyal H. Nawabi, MD, FRCS; Miguel Otero, PhD; Hollis Potter, MD; Scott A. Rodeo, MD; Parina Shah, MSc; Russell F. Warren, MD. The Mayo Clinic (Rochester, MN) team for the AF-ACL Consortium is: Kimberly K. Amrami, MD; Joel P. Felmlee, PhD; Matthew A. Frick, MD; Aaron J. Krych, MD; Michael J. Stuart, MD; Steven L. Williams. The UCSF (San Francisco, CA) team for the AF-ACL Consortium is: Keiko Amano, MD; Maxwell Cheong; Martin Kretzschmar, MD; Drew A. Lansdown, MD; Alan Li; Xiaojuan Li, PhD; Thomas M. Link, MD; C. Benjamin Ma, MD; Sharmila Majumdar, PhD; Narihiro Okazaki, MD; Valentina Pedoia, PhD; Colin Russell, BA; Dragana Savic, MSc; Benedikt Schwaiger, MD; Favian Su, BS; Cory Wyatt, PhD. The Albert Einstein (Bronx, NY) team for the Arthritis Foundation Consortium is: John A. Hardin, MD.
REFERENCES
- 1.Barenius B, Ponzer S, Shalabi A, et al. 2014. Increased risk of osteoarthritis after anterior cruciate ligament reconstruction: a 14-Year follow-up study of a randomized controlled trial. Am J Sports Med 42:1049–1057. [DOI] [PubMed] [Google Scholar]
- 2.Su F, Hilton JH, Nardo L, et al. 2013. Cartilage morphology and T1p and T2 quantification in ACL-reconstructed knees: a 2-year follow-up. Osteoarthritis Cartilage 21:1058–1067. [DOI] [PMC free article] [PubMed] [Google Scholar]
- 3.Potter HG, Jain SK, Ma Y, et al. 2012. Cartilage injury after accute, isolated anterior cruciate ligament tear: immediate and longitudinal effect with clinical/MRI follow-up. Am J Sports Med 40:276–285. [DOI] [PubMed] [Google Scholar]
- 4.Braun HJ, Gold GE. 2011. Advanced MRI of articular cartilage. J Med Imaging 3:541–555. [DOI] [PMC free article] [PubMed] [Google Scholar]
- 5.Wei W, Jia G, Flanigan D, et al. 2014. Chemical exchange saturation transfer MR imaging of articular cartilage glyco-saminoglycans at 3 T: accuracy of B0 field inhomogeneity corrections with gradient echo method. J Magn Reson Imaging 31:41–47. [DOI] [PMC free article] [PubMed] [Google Scholar]
- 6.Borthakur A, Reddy R. 2010. Imaging cartilage physiology. Top Magn Reson Imaging 21:291–296. [DOI] [PMC free article] [PubMed] [Google Scholar]
- 7.Li X, Han ET, Ma CB, et al. 2005. In vivo 3T spiral imaging based multi-Slice T1rho mapping of knee cartilage in osteoarthritis. Magn Reson Med 54:929–936. [DOI] [PubMed] [Google Scholar]
- 8.Duvvuri U, Goldberg AD, Kranz JK, et al. 2001. Water magnetic relaxation dispersion in biological systems: the contribution of proton exchange and implications for the noninvasive detection of cartilage degeneration. Proc Natl Acad Sci 98:12479–12484. [DOI] [PMC free article] [PubMed] [Google Scholar]
- 9.Li X, Pai A, Blumenkrantz G, et al. 2009. Spatial distribution and relationship of T1rho and T2 relaxation times in knee cartilage with osteoarthritis. Magn Reson Med 61:1310–1318. [DOI] [PMC free article] [PubMed] [Google Scholar]
- 10.Stahl R, Luke A, Li X, et al. 2009. T1rho, T2 and focal knee cartilage abnormalities in physically active and sedentary healthy subjects versus early OA patients—a 3.0-Tesla MRI study. Eur Radiol 19:132–143. [DOI] [PubMed] [Google Scholar]
- 11.Borthakur A, Mellon E, Niyogi S, et al. 2006. Sodium and T1rho MRI for molecular and diagnostic imaging of articular cartilage. NMR Biomed 19:781–821. [DOI] [PMC free article] [PubMed] [Google Scholar]
- 12.Akella SVS, Regatte RR, Wheaton AJ, et al. 2004. Reduction of residual dipolar interaction in cartilage by spin-lock technique. Magn Reson Med 52:1103–1109. [DOI] [PubMed] [Google Scholar]
- 13.Li X, Kuo D, Theologis A, et al. 2011. Cartilage in anterior cruciate ligament-reconstructed knees: MR imaging T1{rho} and T2-initial experience with 1-year follow-up. Radiology 258:505–514. [DOI] [PMC free article] [PubMed] [Google Scholar]
- 14.Wang P, Block J, Gore JC. 2015. Chemical exchange in knee cartilage assesed by R1rho (1/T1rho) dispersion at 3T. J Magn Reson Imaging 33:38–42. [DOI] [PMC free article] [PubMed] [Google Scholar]
- 15.Cobb JG, Xie J, Gore JC. 2013. Contributions of chemical and diffusive exchange to T1rho dispersion. Magn Reson Med 69:1357–1366. [DOI] [PMC free article] [PubMed] [Google Scholar]
- 16.Cobb JG, Xie J, Gore JC. 2011. Contributions of chemical exchange to T1rho dispersion in a tissue model. Magn Reson Med 66:1563–1571. [DOI] [PMC free article] [PubMed] [Google Scholar]
- 17.Cobb JG, Li K, Xie J, et al. 2014. Exchange-mediated contrast in CEST and spin-lock imaging. J Magn Reson Imaging 32:28–40. [DOI] [PMC free article] [PubMed] [Google Scholar]
- 18.Duvvuri U, Reddy R, Patel SD, et al. 1997. T1rho-relaxation in articular cartilage: effects of enzymatic degradation. Magn Reson Med 38:863–867. [DOI] [PubMed] [Google Scholar]
- 19.Spear JT, Gore J. 2016. New insights into rotating frame relaxation at high field. NMR Biomed 29:1258–1273. [DOI] [PMC free article] [PubMed] [Google Scholar]
- 20.Keenan KE, Besier TF, Pauly JM, et al. 2015. T1rho dispersion in articular cartilage relationship to material properties and macromolecular content. Cartilage 6:113–122. [DOI] [PMC free article] [PubMed] [Google Scholar]
- 21.Xia Y 1998. Relaxation anisotropy in cartilage by NMR microscopy (muMRI) at 14-microm resolution. Magn Reson Med 39:941–949. [DOI] [PubMed] [Google Scholar]
- 22.Pedoia V, Li X, Su F, et al. 2016. Fully automatic analysis of the knee articular cartilage T1p relaxation time using voxel-based relaxometry. J Magn Reson Imaging 43:970–980. [DOI] [PMC free article] [PubMed] [Google Scholar]
- 23.Collins NJ, Prinsen C, Christensen R, et al. 2016. Knee Injury and Osteoarthritis Outcome Score (KOOS): systematic review and meta-analysis of measurement properties. Osteoarthritis Cartilage 24:1317–1329. [DOI] [PubMed] [Google Scholar]
- 24.Li X, Pedoia V, Kumar D, et al. 2015. Cartilage T1ρ and T2 relaxation times: longitudinal reproducibility and variations using different coils, MR systems and sites. Osteoarthritis Cartilage 23:2214–2223. [DOI] [PMC free article] [PubMed] [Google Scholar]
- 25.Li X, Wyatt C, Rivoire J, et al. 2014. Simultaneous acquisition of T1rho and T2 quantification in knee cartilage—reproducibility and diurnal variation. JMRI 39:1287–1293. [DOI] [PMC free article] [PubMed] [Google Scholar]
- 26.Shamonin DP, Bron EE, Lelieveldt BPF, et al. 2014. Fast parallel image registration on CPU and GPU for diagnostic classification of Alzheimer’s disease. Front Neuroinform 7:50. [DOI] [PMC free article] [PubMed] [Google Scholar]
- 27.Klein S, Staring M, Murphy K, et al. 2010. Elastix: a toolbox for intensity-based medical image registration. IEEE Trans Med Imaging 29:196–205. [DOI] [PubMed] [Google Scholar]
- 28.Carballido-Gamio J, Bauer JS, Stahl R, et al. 2008. Inter-subject comparison of MRI knee cartilage thickness. Med Image Anal 12:120–135. [DOI] [PMC free article] [PubMed] [Google Scholar]
- 29.Marquardt DW. 1963. An algorithm for least-squares estimation of nonlinear parameters. SIAM J Appl Math 11: 431–441. [Google Scholar]
- 30.Marchini J, Presanis A. 2004. Comparing methods of analyzing fMRI statistical parametric maps. NeuroImage 22:1203–1213. [DOI] [PubMed] [Google Scholar]
- 31.Theologis AA, Haughom B, Liang F, et al. 2014. Comparison of T1rho relaxation times between ACL-reconstructed knees and contralateral uninjured knees. Knee surgery, sports traumatology. Arthroscopy 22:298–307. [DOI] [PMC free article] [PubMed] [Google Scholar]
- 32.Haughom B, Schairer W, Souza RB, et al. 2012. Abnormal tibiofemoral kinematics following ACL reconstruction are associated with early cartilage matrix degeneration measured by MRI T1rho. Knee 19:482–487. [DOI] [PMC free article] [PubMed] [Google Scholar]
- 33.Frobell RB, Le Graverand MP, Buck R, et al. 2009. The acutely ACL injured knee assessed by MRI: changes in joint fluid, bone marrow lesions, and cartilage during the first year. Osteoarthritis Cartilage 17:161–167. [DOI] [PubMed] [Google Scholar]
- 34.Carpenter RD, Majumdar S, Ma CB. 2009. Magnetic resonance imaging of 3-Dimensional In vivo tibiofemoral kinematics in anterior cruciate ligament-reconstructed knees. Arthroscopy 25:760–766. [DOI] [PubMed] [Google Scholar]
- 35.Chaudhari AM, Briant PL, Bevill SL, et al. 2008. Knee kinematics, cartilage morphology, and osteoarthritis after ACL injury. Med Sci Sports Exerc 40:215–222. [DOI] [PubMed] [Google Scholar]
- 36.Zaid M, Landsdown D, Su F, et al. 2015. Abnormal tibial position is correlated to early degenerative changes one year following ACL reconstruction. J Ortho Res 33:1079–1086. [DOI] [PMC free article] [PubMed] [Google Scholar]
- 37.Scanlan SF, Chaudhari A, Dyrby CO, et al. 2010. Differences in tibial rotation during walking in ACL reconstructed and healthy contralateral knees. J Biomech 43: 1817–1822. [DOI] [PMC free article] [PubMed] [Google Scholar]
- 38.Amano K, Pedoia V, Su F, et al. 2016. Persistent biomechanical alterations after ACL reconstruction are associated with early cartilage matrix changes detected by quantitative MR. Orthop J Sports Med 4:2325967116644421. [DOI] [PMC free article] [PubMed] [Google Scholar]
- 39.Tashman S, Araki D. 2013. Effects of anterior cruciate ligament reconstruction on in vivo, dynamic knee function. Clin Sports Med 32:47–59. [DOI] [PMC free article] [PubMed] [Google Scholar]
- 40.Su F, Pedoia V, Tent HL, et al. 2016. The association between MR T1rho and T2 of cartilage and patient-reported outcomes after ACL injury and reconstruction. Osteoarthritis Cartilage 24:1180–1189. [DOI] [PMC free article] [PubMed] [Google Scholar]
- 41.Wang L, Regatte R. 2015. Investigation of regional influence of magic-angle effect on T2 in human articular cartilage with osteoarthritis at 3T. Acad Radiol 22:87–92. [DOI] [PMC free article] [PubMed] [Google Scholar]
Associated Data
This section collects any data citations, data availability statements, or supplementary materials included in this article.