Abstract
Objective
Autologous bone marrow stem cell (ABMSC) transplantation has been considered a promising option for hepatitis B virus-related cirrhosis (HBV-C). Although an analysis of the published literature has been performed, the exact effects and safety have yet to be systematically investigated.
Methods
We conducted a wide-ranging online search of electronic databases (Web of Science, PubMed, Cochrane Library, Embase, CNKI, VIP, and Wanfang database) to reach systematic conclusions. Outcome measurements, including therapeutic efficacy, clinical symptoms, and adverse events, were extracted and analyzed statistically.
Results
Ultimately, a total of 10 articles including 662 HBV-C patients were included in this analysis, which indicated that ABMSC therapy could significantly improve liver function in patients with HBV-C in terms of the MELD and Child-Pugh scores, total bilirubin, serum albumin, alanine aminotransferase, aspartate aminotransferase, and coagulation function. Compared with patients receiving routine therapy (RT), those treated with ABMSC and RT combined therapy showed improved clinical symptoms, as represented by increased appetite and reduced fatigue and ascitic fluid and abdominal distension. Moreover, the fibrosis indexes indicated a reduction in liver fibrosis in patients treated with combined therapy according to the improved levels of hyaluronic acid (MD = − 70.47, CI = − 103.72–37.21, P < 0.0001), laminin (MD = − 25.11, CI = − 37.73–12.49, P < 0.0001), type III procollagen (MD = − 22.42, CI = − 34.49–10.34, P = 0.0003), and type IV collagen (MD = − 22.50, CI = − 39.92–5.08, P = 0.01). No obvious adverse events occurred during ABMSC treatment.
Conclusion
ABMSC transplantation via the hepatic artery was safe and effective in treating HBV-C without causing severe adverse events.
Keywords: Autologous bone marrow stem cell, Routine therapy, Hepatic artery, Hepatitis B virus-related cirrhosis, Meta-analysis
Introduction
There are currently over 350 million people with chronic hepatitis B (CHB) worldwide, and hepatitis B virus (HBV) infection is one of the main causes of liver cirrhosis (LC) [1, 2]. HBV is the tenth leading cause of death. More than one million HBV carriers die of LC and liver cancer every year [1]. As reported by the World Health Organization, 45% of the population lives in high-prevalence CHB areas [3]. CHB is particularly prevalent in China, where 7.18% of the population aged 1 to 59 years is a chronic HBV surface antigen carrier [4–6]. Among untreated CHB patients, 6–20% develop to cirrhosis in 5 years [4, 7]. Untreated decompensated cirrhosis patients show a poor prognosis, with a 5-year-survival rate ranging from 14 to 35% [4, 7].
Currently, clinical treatments for CHB include interferon-α (IFN-α) injection and orally administered nucleotide analogs (NAs), such as adefovir dipivoxil, entecavir, lamivudine, tenofovir, and telbivudine [8]. As NAs suppress HBV replication only at the point of DNA synthesis progression, most patients require long-term treatment, which is unfortunately limited by drug resistance [9]. Although IFN-α has both antiviral and immunomodulatory properties against HBV, it performs poorly in suppressing HBV DNA replication [8]. In addition, its clinical application is very limited by contraindications, such as hematological and neurological diseases. It is also not applicable for decompensated hepatitis B virus-related cirrhosis (HBV-C), as it may lead to liver failure [8, 10]. Therefore, the development of an effective therapeutic method is needed.
The rapid development of stem cell research has been gaining attention for cirrhosis therapy, as transplanted stem cells have been reported to be beneficial for cirrhosis [11–15]. Autologous bone marrow stem cell (ABMSC) contains several types of stem cells, including mesenchymal stem cells, hepatic progenitor cells, and hematopoietic stem cells [16]. These multipotent stem cells can migrate to lesion sites, differentiate into hepatocytes, and secrete various cytokines and growth factors [17, 18]. This mechanism suggests that ABMSC transplantation may be a potential treatment strategy for cirrhosis.
Several clinical trials have reported that ABMSC transfusion alleviates liver fibrosis and improves liver functions without causing severe side effects [2, 19, 20]. Preclinical studies of ABMSC transplantation, particularly for HBV-C, have also been conducted, but they have utilized various individual therapeutic regimens. In this study, we focused on ABMSC transplantation performed specifically via the hepatic artery when conducting a meta-analysis of published clinical trials to provide a scientific reference for upcoming clinical research and future applications.
Material and methods
This meta-analysis was performed in accordance with the Preferred Reporting Items for Systematic Reviews and Meta-Analyses (PRISMA) guidelines. Ethical approval was not necessary because this study was a meta-analysis.
Data sources and selection criteria
The analyzed literature was searched across the Web of Science, PubMed, Cochrane Library, Embase, China National Knowledge Infrastructure (CNKI), Chinese Scientific Journal Database (VIP), and Wanfang database by May 2018. The search was performed with the following key terms: “stem cells” or “bone marrow stem cells” or “mesenchymal stem cells” or “bone marrow mesenchymal stem cells” AND “cirrhosis” or “liver cirrhosis” or “viral cirrhosis” or “hepatitis B virus-related cirrhosis”.
The retrieved literature was reviewed, and those meeting the following inclusion criteria were involved in this study: (1) case-controlled clinical trials, (2) patients with HBV-C, (3) patients who had no hepatocellular carcinoma or other malignant tumor and who were without pregnancy or lactation, (4) patients in the experimental group who received ABMSC transplantation and routine therapy (RT) combined therapy and patients in the control group who were treated with RT alone, and (5) patients treated with ABMSC transfusion who received treatment via the hepatic artery.
Data extraction and quality assessment
Literature screening and data extraction were carried out by two independent authors (Ani Sun and Wenni Gao) and verified by a third reviewer (Ting Xiao). All included studies were summarized as follows: first authors’ names, year of publication, HBV-C stages, sample sizes, therapeutic regimens, administration route, dosages of ABMSC, enrollment period, follow-up duration, and evaluation parameters. The methodological quality of the included studies was assessed according to the Cochrane Handbook [21].
Outcome definition
The outcomes of greatest interest included treatment efficacy, clinical symptoms, and adverse events. Treatment efficacy was assessed in terms of total bilirubin (TBIL), serum albumin (ALB), alanine aminotransferase (ALT), and aspartate aminotransferase (AST) levels, prothrombin time (PT), prothrombin activity (PTA), model for end-stage liver disease (MELD), and Child-Pugh score, and liver fibrosis indexes included hyaluronic acid (HA), laminin (LN), type III procollagen (PC III), and type IV collagen (CIV) levels. Clinical symptoms of patients were also evaluated based on fatigue, appetite, ascetics, and abdominal distension. Adverse events that occurred during therapy were also considered in the assessment.
Statistical analysis
We performed a comparative analysis between patients treated with RT alone and those treated with ABMSC transfusion and RT combined therapy with Review Manager 5.3 (Cochrane Collaboration) and Stata 13.0 (Stata Corporation). P < 0.05 indicated a statistically significant difference. Cochran’s Q test was conducted to assess the heterogeneity cross the involved studies, and I2 < 50% or P > 0.1 indicated the studies were homogenous [22]. A fixed effects model was used to pool the estimates when heterogeneity was absent. Otherwise, a random effects model was selected. Dichotomous data were represented by the odds ratio (OR) with the respective 95% confidence interval (CI), whereas continuous variables were expressed as mean difference (MD) with 95% CI. Publication bias was evaluated based on the funnel plot and Begg’s and Egger’s tests. Sensitivity analyses were also performed to assess the impact of cell dosages and the sample sizes of the involved studies.
Results
Search results
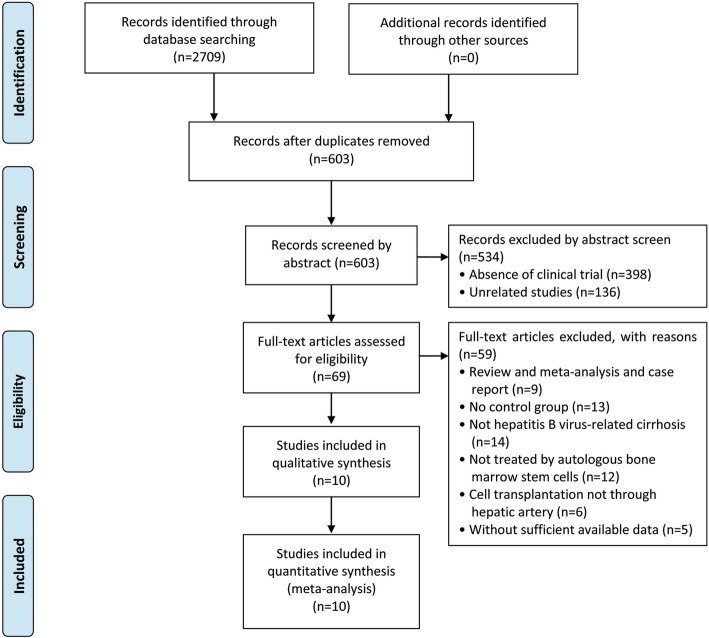
Of 2709 articles that were preliminarily screened for the initial review, 2106 were excluded due to duplication. After the title and abstract review, 534 articles were further excluded due to the lack of clinical trials (n = 398) and unrelated studies (n = 136), resulting in 69 potentially relevant studies. After a detailed assessment of the full texts, articles designated as reviews and meta-analyses and case reports (n = 9), studies without a control group (n = 13), trials unrelated to HBV-C (n = 14) and ABMSC therapy (n = 12), ABMSC transplantation not via hepatic artery infusion (n = 6), and papers with insufficient data (n = 5) were excluded. Finally, 10 studies [2, 19, 20, 23–29] including 622 HBV-C patients met the inclusion criteria for our meta-analysis (Fig. 1).
Fig. 1.
Flow diagram of the selection process
Patient characteristics
All included trials that met the inclusion criteria were conducted in China and included 286 HBV-C patients treated with hepatic artery-administered ABMSC and RT combined therapy and 336 patients treated with RT alone. Among all the included studies, 9 studies [2, 19, 23–29] included patients with decompensated cirrhosis, and the remaining study [20] lacked a clear description of the stages of HBV-C. Detailed information regarding the involved studies and participants is shown in Table 1.
Table 1.
Information of ABMSC therapy
| Included studies | Stage (Child-Pugh) | Patients (Con/Exp) | Therapeutic regimen (administration route) | Cell dose | Enrollment period | Follow-up (week) | Parameter types |
|---|---|---|---|---|---|---|---|
| Chen et al. [23] | B–C | 34/33 | RT+ABMSC (HA) | 3.0–5.0 × 10⁶ | November 2008–April 2012 | 24 | TBIL, ALB, ALT, PT, PTA, MELD, Child-Pugh |
| Cui [24] | B–C | 22/18 | RT+ABMSC (HA) | 5.6 × 10⁸–1.8 × 10¹¹ | October 2011–December 2013 | 12 | TBIL, ALB, ALT, PTA, CS, LFI, MELD, Child-Pugh |
| Hou et al. [25] | ND | 25/25 | RT+ABMSC (HA) | ND | November 2009–February 2011 | 16 | TBIL, ALB, ALT, PT, MELD |
| Jiang [26] | B–C | 13/12 | RT+ABMSC (HA) | 2.1–6.8 × 10¹⁰ | July 2009–June 2011 | 24 | TBIL, ALB, ALT, AST, PT, CS |
| Jin et al. [27] | B–C | 20/20 | RT+ABMSC (HA) | 4.0 × 10⁷–3.0 × 10⁸ | April 2009–April 2010 | 12 | TBIL, ALB, PTA |
| Liu et al. [19] | B–C | 37/40 | RT+ABMSC (HA) | 3.2 × 10¹⁰–1.6 × 10¹¹ | April 2009–October 2010 | 4 | TBIL, ALB, ALT, AST, PT |
| Mao et al. [28] | A–C | 32/32 | RT+ABMSC (HA) | > 109 | January 2009–January 2012 | 4 | TBIL, ALB, ALT, PT |
| Peng et al. [2] | ND | 77/39 | RT+ABMSC (HA) | 3.4 ± 3.8 × 10⁸ | May 2005–June 2009 | 4 | TBIL, ALB, ALT, PT, MELD |
| Wu et al. [29] | B–C | 25/27 | RT+ABMSC (HA) | 1.0 × 10⁸–9 | January 2013–January 2015 | 24 | TBIL, ALT, AST, CS, LFI, MELD, Child-Pugh |
| Xu et al. [20] | ND | 29/27 | RT+ABMSCs (HA) | 8.5 ± 3.3 × 10⁸ | March 2012–December 2012 | 24 | ALB, ALT, MELD |
Abbreviations: Con control group (RT alone group), Exp experimental group (RT plus ABMSC therapy), RT routing therapy, ABMSC autologous bone marrow stem cell, ND non-determined, HA hepatic artery
Quality assessment
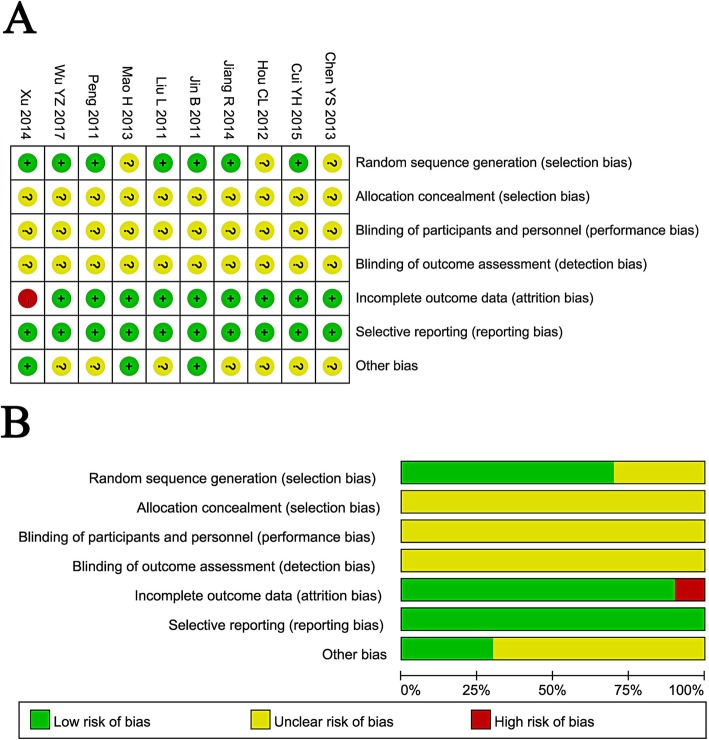
The assessment of bias risk is shown in Fig. 2. Seven of the 10 involved trials were determined as having a low risk of bias, while the other 3 trials did not provide a clear description of the randomization process. All trials provided a clear description of the selection, performance, and detection and hence were designated as having an unclear risk of bias. One study missing follow-up study was regarded as having a high risk of attrition bias. All 10 studies were free of reporting risks.
Fig. 2.
Risk of bias summary: review of authors’ judgments about each risk of bias item for included studies (a). Risk of bias graph: review of authors’ judgments about each risk of bias item presented as percentages across all included studies (b). Note: Each color represents a different level of bias: red for high-risk, green for low-risk, and yellow for unclear risk of bias
Therapeutic efficacy assessments
Evaluation of biochemical indexes (TBIL, ALB, ALT, and AST)
HBV-C patient status can be reflected by multiple markers, such as TBIL, ALB, ALT, AST, PT, and PTA. Before treatment, no obvious differences were observed in these indicators between the experimental and control groups (Supplementary Figure 1).
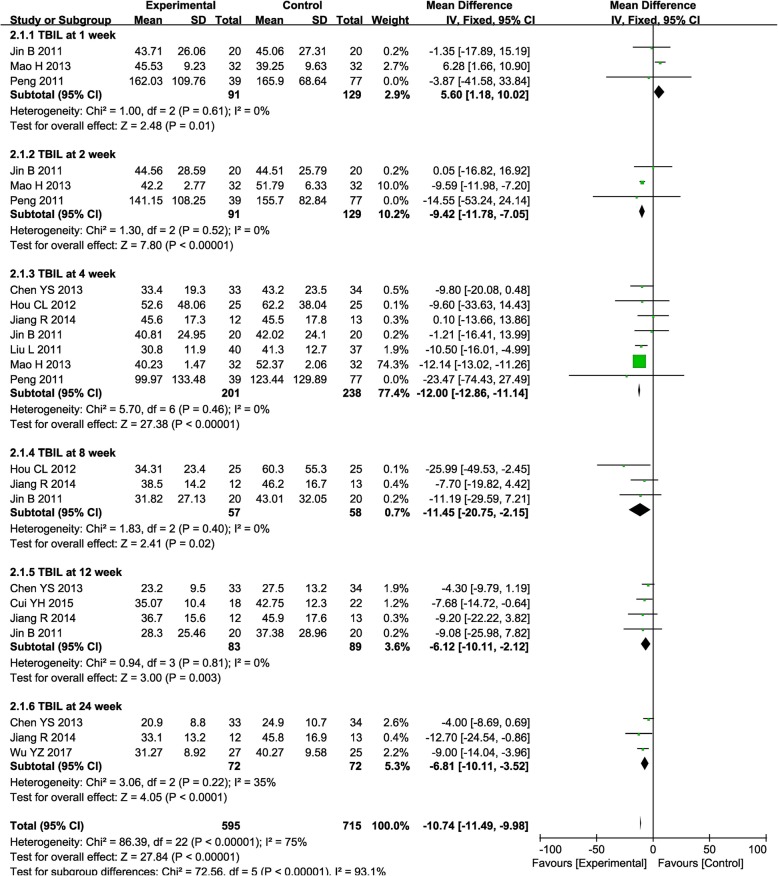
After treatment, the TBIL level was significantly lower in the combined group at weeks 2, 4, 8, 12, and 24 compared with RT alone (Fig. 3, 2nd: MD = − 9.42, CI = − 11.78–7.05, P < 0.00001; 4th: MD = − 12.00, CI = − 12.86–11.14, P < 0.00001; 8th: MD = − 11.45, CI = − 20.75–2.15, P = 0.02; 12th: MD = − 6.12, CI = − 10.11–2.12, P = 0.003; 24th: MD = − 6.81, CI = − 10.11–3.52, P < 0.0001). Most studies reported a decreased TBIL level after combined therapy, except the study by Mao et al. showing an increased TBIL level at week 1 after ABMSC therapy, which may require further discussion.
Fig. 3.
Forest plot of the comparison of total bilirubin (TBIL) between the experimental and control group. Control group, RT alone group; experimental group, RT plus ABMSC therapy; ABMSC, autologous bone marrow stem cell; RT, routing therapy. The fixed-effects meta-analysis model (inverse variance method) was used
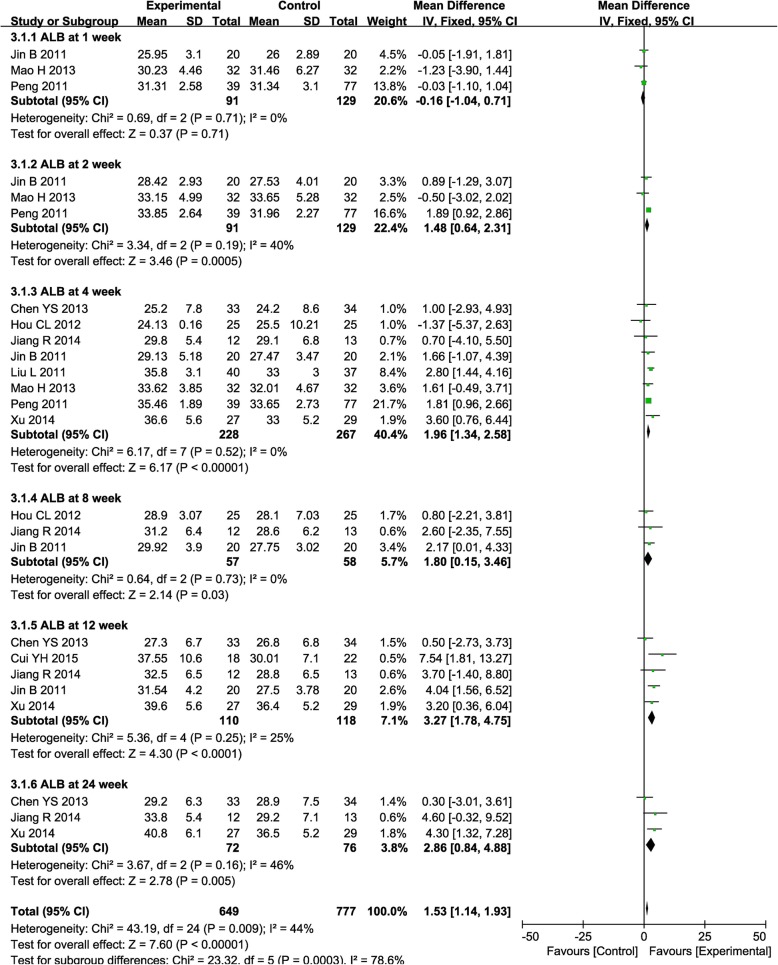
The ALB level was significantly higher in the combined therapy group than the control group at weeks 2, 4, 8, 12, and 24 after therapy (Fig. 4, 2nd: MD = 1.48, CI = 0.64–2.31, P = 0.0005; 4th: MD = 1.96, CI = 1.34–2.58, P < 0.00001; 8th: MD = 1.80, CI = 0.15–3.46, P = 0.03; 12th: MD = 3.27, CI = 1.78–4.75, P < 0.0001; 24th: MD = 2.86, CI = 0.84–4.88, P = 0.005).
Fig. 4.
Forest plot of the comparison of albumin (ALB) between the experimental and control group. Control group, RT alone group; experimental group, RT plus ABMSC therapy; ABMSC, autologous bone marrow stem cell; RT, routing therapy. The fixed-effects meta-analysis model (inverse variance method) was used
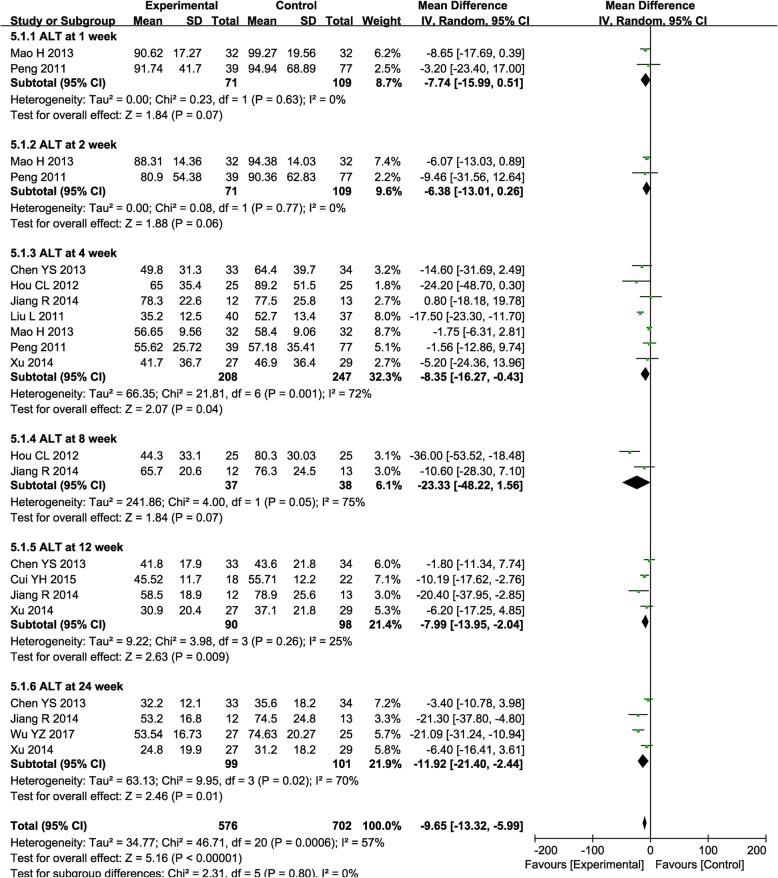
The ALT level was significantly decreased after combined treatment, especially at weeks 4, 12, and 24 (Fig. 5, 4th: MD = − 8.35, CI = − 16.27–0.43, P = 0.04; 12th: MD = − 7.99, CI = − 13.95–2.04, P = 0.009; 24th: MD = − 11.92, CI = − 21.40–2.44, P = 0.01), while it was insignificantly reduced at weeks 1, 2, and 8 (Fig. 5, 1st: MD = − 7.74, CI = − 15.99–0.51, P = 0.07; 2nd: MD = − 6.38, CI = − 13.01–0.26, P = 0.06; 8th: MD = − 23.33, CI = − 48.22–1.56, P = 0.07).
Fig. 5.
Forest plot of the comparison of alanine aminotransferase (ALT) between the experimental and control group. Control group, RT alone group; experimental group, RT plus ABMSC therapy; ABMSC, autologous bone marrow stem cell; RT, routing therapy. The random effects meta-analysis model (inverse variance method) was used
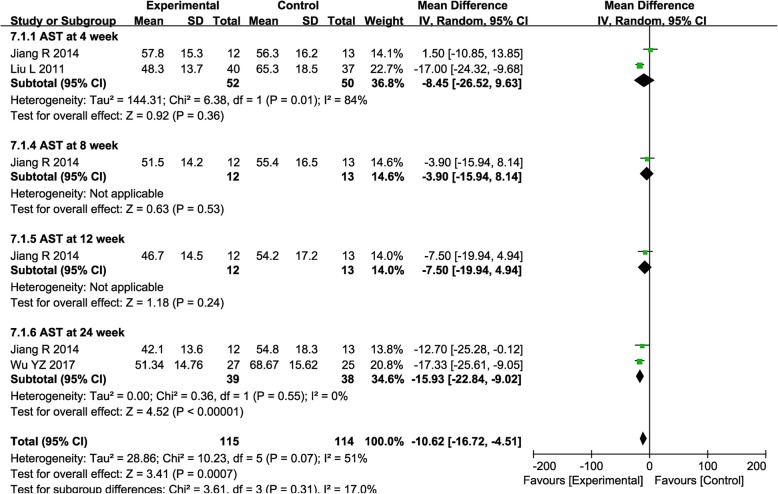
The AST level was significantly decreased after combined treatment only at week 24 (Fig. 6, 4th: MD = − 8.45, CI = − 26.52-9.63, P = 0.36; 8th: MD = − 3.90, CI = − 15.94–8.14, P = 0.53; 12th: MD = − 7.50, CI = − 19.94–4.94, P = 0.24; 24th: MD = − 15.93, CI = − 22.84–9.02, P < 0.00001).
Fig. 6.
Forest plot of the comparison of aspartate aminotransferase (AST) between the experimental and control group. Control group, RT alone group; experimental group, RT plus ABMSC therapy; ABMSC, autologous bone marrow stem cell; RT, routing therapy. The random effects meta-analysis model (inverse variance method) was used
Evaluation of coagulation function
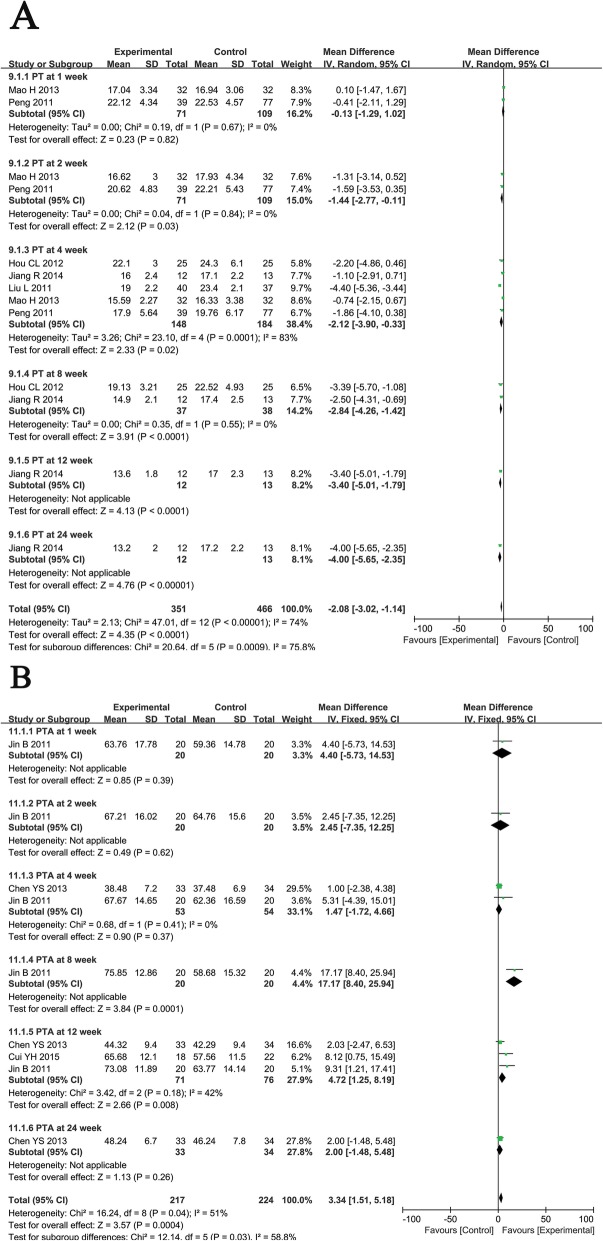
PT and PTA are important indicators of coagulation function in patients. Patients who received the combination therapy had significantly greater reductions in PT than those treated with RT at weeks 2, 4, 8, 12, and 24 (Fig. 7a, 2nd: MD = − 1.44, CI = − 2.77–0.11, P = 0.03; 4th: MD = − 2.12, CI = − 3.90–0.33, P = 0.02; 8th: MD = − 2.84, CI = − 4.26–1.42, P < 0.0001; 12th: MD = − 3.40, CI = − 5.10–1.79, P < 0.0001; 24th: MD = − 4.00, CI = − 5.65–2.35, P < 0.00001). Moreover, the combined treatment group experienced a significantly greater increase in PTA than the control group at weeks 8 and 12 (Fig. 7b, 8th: MD = 17.17, CI = 8.40–25.94, P = 0.0001; 12th: MD = 4.72, CI = 1.25–8.19, P = 0.008).
Fig. 7.
Forest plot of the comparison of coagulation function including prothrombin time (PT, a) and prothrombin activity (PTA, b) between the experimental and control group. Control group, RT alone group; experimental group, RT plus ABMSC therapy; ABMSC, autologous bone marrow stem cell; RT, routing therapy
Evaluation of hepatic fibrosis indicators
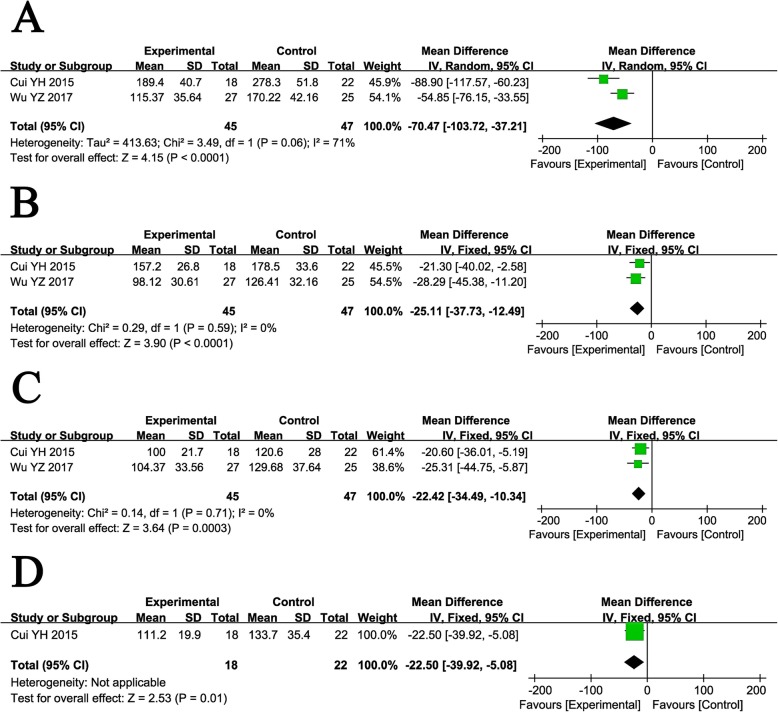
Serum fibrosis indicators were analyzed, including HA, LN, PC III, and CIV. Before treatment, these fibrosis markers did not show differences between the two groups (Supplementary Figure 2). After treatment, the levels of HA, LN, PC III, and CIV in patients who received combined therapy were all significantly improved compared with those treated with RT alone (Fig. 8, HA: MD = − 70.47, CI = − 103.72–37.21, P < 0.0001; LN: MD = − 25.11, CI = − 37.73–12.49, P < 0.0001; PC III: MD = − 22.42, CI = − 34.49–10.34, P = 0.0003; CIV: MD = − 22.50, CI = − 39.92–5.08, P = 0.01).
Fig. 8.
Forest plot of the comparison of serum liver fibrosis markers including hyaluronic acid (HA, a), laminin (LN, b), type III procollagen (PC III, c), and type IV collagen (CIV, d) between the experimental and control group. Control group, RT alone group; experimental group, RT plus ABMSC therapy; ABMSC, autologous bone marrow stem cell, RT, routing therapy
MELD and Child-Pugh scores
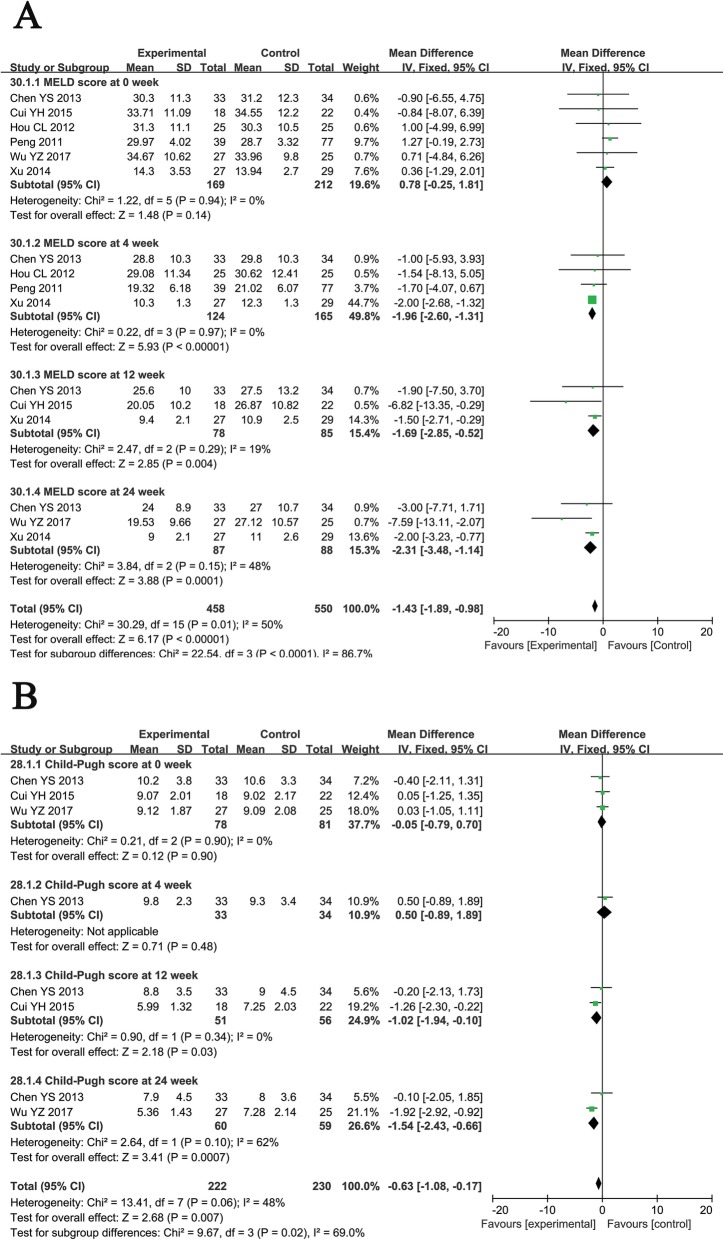
Before treatment, no differences were observed in the MELD and Child-Pugh scores between the two groups. Compared with patients treated with RT alone, ABMSC therapy was associated with a significantly lower MELD score at weeks 4, 12, and 24 (Fig. 9a, 4th: MD = − 1.96, CI = − 2.60–1.31, P < 0.00001; 12th: MD = − 1.69, CI = − 2.85–0.52, P = 0.004; 24th: MD = − 2.31, CI = − 3.48–1.14, P = 0.0001), and Child-Pugh score at weeks 12 and 24 (Fig. 9b, 12th: MD = − 1.02, CI = − 1.94–0.10, P = 0.03; 24th: MD = − 1.54, CI = − 2.43–0.66, P = 0.0007), indicating a more favorable prognosis.
Fig. 9.
Forest plot of the comparison of model for end-stage liver disease (MELD, a) and Child-Pugh score (b) between the experimental and control group. Control group, RT alone group; experimental group, RT plus ABMSC therapy; ABMSC, autologous bone marrow stem cell; RT, routing therapy. The fixed-effects meta-analysis model (inverse variance method) was used
Clinical symptom assessment
The clinical symptoms of patients who received combined therapy were significantly improved compared with those of patients treated with RT alone (Fig. 10), as indicated by improved fatigue at week 12 (OR = 17.36, CI = 2.54–118.54, P = 0.004) and improved appetite (4th: OR = 3.13, CI = 1.63–6.02, P = 0.0006; 12th: OR = − 23.92, CI = 4.44–128.76, P = 0.0002; 24th: OR = 24.09, CI = 4.51–128.56, P = 0.0002), reduced ascitic fluid (4th: OR = 4.15, CI = 1.56–11.02, P = 0.004; 12th: OR = 13.78, CI = 3.07–61.94, P = 0.0006; 24th: OR = 26.60, CI = 4.97–142.34, P = 0.0001), and abdominal distension (4th: OR = 2.83, CI = 1.45–5.49, P = 0.002; 12th: OR = 21.40, CI = 3.99–114.77, P = 0.0004; 24th: OR = 38.00, CI = 6.43–224.48, P < 0.0001) at weeks 4, 12, and 24.
Fig. 10.
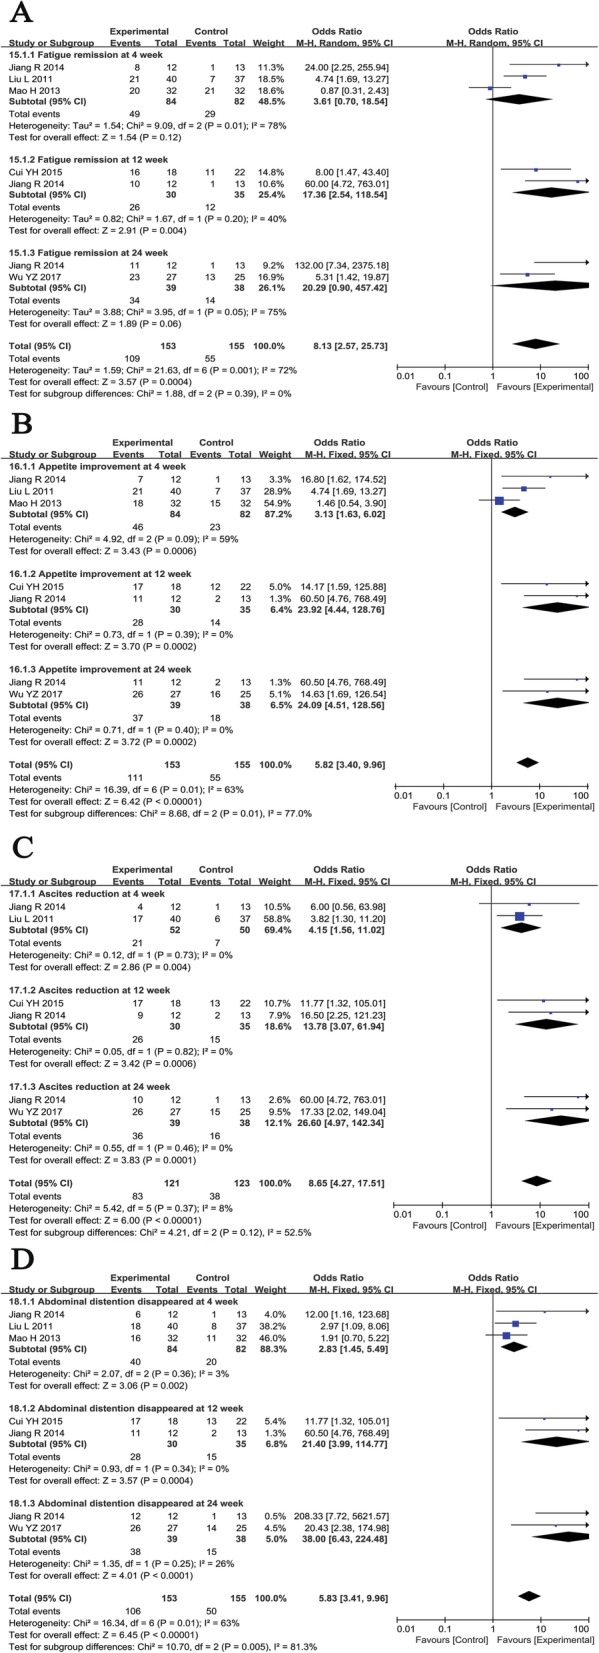
Forest plot of the comparison of clinical symptoms of patients including fatigue (a), appetite (b), abdominal distension (c), and ascetics (d) between the experimental and control group. Control group, RT alone group; experimental group, RT plus ABMSC therapy; ABMSC, autologous bone marrow stem cell; RT, routing therapy
Adverse event assessment
Safety was evaluated upon assessing the adverse effects that occurred during and after treatment. The most common side effects during treatment were fever, nausea, and vomiting, and they usually subsided within 24 h without treatment. However, none of the trials compared the incidence of side effects between the experimental and control groups (Table 2).
Table 2.
Information of adverse effects during the ABMSC therapy
| Included studies | Adverse events (number) |
|---|---|
| Chen et al. [23] | Fever (2), nausea (8), ecchymosis (16) |
| Cui [24] | Nausea and vomiting (5), fever (3) |
| Hou et al. [25] | Low-grade fever (2), digestive tract hemorrhage (1) |
| Jiang [26] | Low-grade fever (1), pain (1), blood oozing from the wound (1) |
| Jin et al. [27] | No obvious adverse reactions |
| Liu et al. [19] | Low-grade fever (1), nausea (2), blood oozing from the wound (1) |
| Mao et al. [28] | No obvious adverse reactions |
| Peng et al. [2] | No obvious adverse reactions |
| Wu et al. [29] | Nausea and vomiting (4), fever (2), diarrhea (1) |
| Xu et al. [20] | Low-grade fever (1) |
Abbreviations: ABMSC autologous bone marrow stem cell, ND non-determined
Publication bias
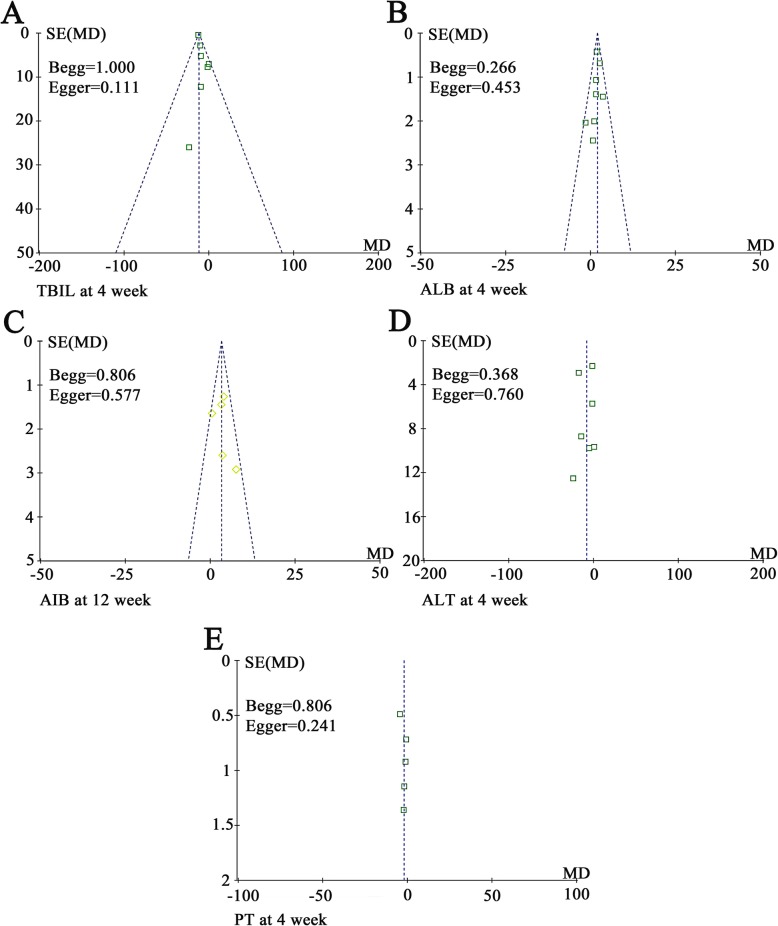
Funnel plots drawn for the studies on primary outcomes (TBIL, ALB, ALT, and PT) were approximately symmetrical, indicating the adequate control of publication bias and the reliability of our primary conclusions (Fig. 11). We further assessed publication bias by Begg’s and Egger’s regression tests, and the results were consistent with funnel plots.
Fig. 11.
Funnel plot of percentage of total bilirubin (TBIL, a), albumin (ALB, b and c), alanine aminotransferase (ALT, d), and prothrombin time (PT, e). Notes: Parameters discussed in over 5 papers were conducted bias analyses
Sensitivity analysis
A sensitivity analysis was conducted, and one trial [20] was excluded because it lacked a clear description of the stages of HBV-C (compensatory or decompensatory stage). The results of this analysis were similar to those obtained from the overall analysis of the pooled trials (Supplementary Figures 3, 4, and 5).
Moreover, we conducted a subgroup analysis to explore the source of heterogeneity in TBIL, ALB, ALT, and PT with respect to the dosage of injected cells and sample size of the study {According to the estimation formula of sample size [n = (Uα + Uβ)2 2P(1 − P)/(P1 − P0)2; α = 0.05, β = 0.10] [30], a sample size greater than 50 is appropriate to evaluate the efficacy of ABMSC for HBV-C. Therefore, we conducted a subgroup analysis according to the different sample size (study sample size > 50 or ≤ 50) in our study. In other words, the results of clinical trials with a sample size greater than 50 are more reliable than small-scale clinical trials (study sample size ≤ 50)}. As shown in Table 3, our results showed that stem cell therapy was more effective with a higher cell dose (cell number > 1 × 10¹⁰) and large sample size (study sample size > 50), as indicated by decreased TBIL and increased ALB.
Table 3.
Subgroup analyses of TBIL, ALB, ALT, and PT between the experimental and control group at the 4th week after therapy
| Parameter | Factors at study level | Exp group | Con group | Analysis method | Heterogeneity | Mean difference (MD) | 95% CI | P value | |
|---|---|---|---|---|---|---|---|---|---|
| No. patients (n) | No. patients (n) | I2 (%) | P value | ||||||
| TBIL | Cell number | ||||||||
| > 1 × 10¹⁰ | 52 | 50 | Fixed | 49 | 0.16 | − 9.04 | − 14.15 to − 3.92 | 0.0005 | |
| < 1 × 10¹⁰ | 59 | 97 | Fixed | 0 | 0.41 | − 3.03 | − 17.60 to 11.54 | 0.68 | |
| Study sample size | |||||||||
| > 50 | 144 | 180 | Fixed | 0 | 0.87 | − 12.09 | − 12.95 to − 11.12 | < 0.00001 | |
| ≤ 50 | 57 | 58 | Fixed | 0 | 0.79 | − 1.88 | − 11.27 to 7.51 | 0.69 | |
| ALB | Cell number | ||||||||
| > 1 × 10¹⁰ | 52 | 50 | Fixed | 0 | 0.41 | 2.64 | 1.33 to 3.95 | < 0.0001 | |
| < 1 × 10¹⁰ | 119 | 160 | Fixed | 0 | 0.65 | 1.90 | 1.13 to 2.66 | < 0.00001 | |
| Study sample size | |||||||||
| > 50 | 171 | 209 | Fixed | 0 | 0.55 | 2.09 | 1.44 to 2.75 | < 0.00001 | |
| ≤ 50 | 57 | 58 | Fixed | 0 | 0.47 | 0.70 | − 1.34 to 2.74 | 0.50 | |
| ALT | Cell number | ||||||||
| > 1 × 10¹⁰ | 52 | 50 | Random | 69 | 0.07 | − 10.67 | − 28.02 to 6.67 | 0.23 | |
| < 1 × 10¹⁰ | 99 | 140 | Random | 0 | 0.46 | − 5.46 | − 13.92 to 3.00 | 0.21 | |
| Study sample size | |||||||||
| > 50 | 171 | 209 | Random | 79 | 0.0007 | − 8.08 | − 17.02 to 0.87 | 0.08 | |
| ≤ 50 | 37 | 38 | Random | 60 | 0.11 | − 10.45 | − 34.83 to 13.93 | 0.40 | |
| PT | Cell number | ||||||||
| > 1 × 10¹⁰ | 52 | 50 | Random | 90 | 0.002 | − 2.84 | − 6.07 to 0.39 | 0.08 | |
| < 1 × 10¹⁰ | 39 | 77 | Random | − 1.86 | − 4.10 to 0.38 | 0.10 | |||
| Study sample size | |||||||||
| > 50 | 37 | 38 | Random | 0 | 0.50 | − 1.45 | − 2.94 to 0.05 | 0.06 | |
| ≤ 50 | 111 | 146 | Random | 89 | < 0.0001 | − 2.40 | − 4.98 to 0.19 | 0.07 | |
Abbreviations: Con group control group (RT alone group), Exp group experimental group (RT plus ABMSC therapy), RT routing therapy, TBIL total bilirubin, ALB albumin, ALT alanine aminotransferase, PT prothrombin time, RT routing therapy, ABMSC autologous bone marrow stem cell
Discussion
In recent years, ABMSC transplantation has been applied in several preclinical HBV-C studies [2, 19, 20]. ABMSC may act by promoting the survival and regeneration of functional hepatocytes and reducing collagen deposition to decelerate or halt cirrhosis progression [31–33]. Protocols in different trials show great diversity, which may be associated with different therapeutic effects, and no standardized protocol has been published to date. In this research, we performed a meta-analysis of a host of HBV-C clinical trials to systematically assess the effectiveness and safety of ABMSC transfusion administered via the hepatic artery.
In this meta-analysis, in comparison to HBV-C patients who received RT alone, those treated with ABMSC and RT combined therapy exhibited more favorable effects, including increased ALB and PTA levels, decreased TBIL, ALT, and AST levels, and a shortened PT. Liver fibrosis is one of the most important characteristics of cirrhosis [34]; its serological markers, including HA, LN, PC III, and CIV, indicated more significant relief of liver fibrosis after combined therapy. Moreover, both MELD and Child-Pugh scores were significantly lower in the combined therapy group than the RT alone group. Clinical symptoms of patients were markedly improved after ABMSC therapy, as demonstrated by improved appetite and relieved fatigue, abdominal distension, and ascitic fluid. These results indicated that the combination of ABMSC transplantation and RT had more satisfactory therapeutic effects for HBV-C patients than RT alone.
Safety is the top priority of a therapeutic strategy and a key factor for clinical application and further development. This analysis confirmed the safety of ABMSC transfusion in HBV-C treatment. The most common side effects during ABMSC therapy included fever, nausea, and vomiting, and no serious adverse events or death occurred during treatment.
Some factors may influence the therapeutic effects of ABMSC therapy and its evaluation. Our subgroup analysis indicated that the treatment effects might be associated with the dosage of injected cells, as well as by the sample size of the included trials. However, currently published studies probing the impact of these factors on the curative effects of ABMSC therapy have been insufficient, prompting further research and exploration.
There are some limitations of this analysis. First, the numbers of involved studies and patients were small, and the follow-up period was short. Second, the 10 included trials were all conducted in the Chinese population. ABMSC transfusion therapy has been used in many countries for liver diseases such as liver fibrosis, cirrhosis, and liver failure [18, 35–38]. Many trials conducted in other countries were excluded because of insufficient data, they were unrelated to HBV-C, or they involved the administration of ABMSC via a route other than the hepatic artery. Third, different trials evaluated treatment efficacy with different outcomes, so it was difficult to summarize the results using the same scale, leading to reduced statistical sample sizes. In addition, multiple factors, such as patient age and LC stage, might affect the therapeutic effect of ABMSC for HBV-C. However, based on the currently available literature, data are insufficient to perform a statistical analysis to evaluate such a correlation. We will continue to follow upcoming clinical trials to obtain relevant data when available. Finally, we noticed that there was a meta-analysis has been published during the process of submission [39], which may limit the novelty of this study to some extent. After a careful reading, we find that the focus between the two articles is different. (I) Some factors may have influence on the therapeutic effects of ABMSC therapy, such as ABMSC infusion methods (intravenous or hepatic artery infusion) and liver cirrhosis types (HBV- or HCV- or alcoholic-related or other types of cirrhosis). Our study predominantly focused on HBV-C patients treated by ABMSC transplantation via the hepatic artery, which can further eliminate the interference of other variable factors on ABMSC treatment. (II) Dynamic analysis of the treatment efficacy of ABMSC for HBV-C is necessary. In our analysis, biochemical (TBIL, ALB, ALT, and AST) and coagulation indicators (PT and PTA), MELD, and Child-Pugh scores were all evaluated between the two groups at baseline and weeks 2, 4, 8, 12, and 24 after therapy. (III) Many objective variables, such as hepatic fibrosis indicators and clinical symptoms, which related to therapeutic effect, were also evaluated in our study. In summary, we expect that our study will be valuable for the design of more comprehensive and controlled clinical trials.
Conclusion
In summary, this meta-analysis illustrated that ABMSC transplantation via the hepatic artery combined with RT was safe and effective for the treatment of HBV-C. ABMSC transplantation showed outstanding benefits for HBV-C patients by improving their liver function and clinical symptoms. Therefore, ABMSC therapy is a promising treatment option for HBV-C patients.
Supplementary information
Additional file 1: Supplementary Figure 1. Forest plot of the comparison of percentage of total bilirubin (TBIL, A), albumin (ALB, B), alanine aminotransferase (ALT, C), aspartate aminotransferase (AST, D) and prothrombin time (PT, E) between the experimental and control group before therapy. Control group, RT alone group; Experimental group, RT plus ABMSC therapy; ABMSC, autologous bone marrow stem cell; RT, routing therapy. The fixed-effects meta-analysis model (Inverse Variance method) was used.
Additional file 2: Supplementary Figure 2. Forest plot of the comparison of serum liver fibrosis markers including hyaluronic acid (HA, A), laminin (LN, B), type III procollagen (PC III, C) and type IV collagen (CIV, D) between the experimental and control group before therapy. Control group, RT alone group; Experimental group, RT plus ABMSC therapy; ABMSC, autologous bone marrow stem cell; RT, routing therapy. The fixed-effects meta-analysis model (Inverse Variance method) was used.
Additional file 3: Supplementary Figure 3. Forest plot of the comparison of albumin (excluding the study [20]) between the experimental and control group. Control group, RT alone group; Experimental group, RT plus ABMSC therapy; ABMSC, autologous bone marrow stem cell; RT, routing therapy. The fixed-effects meta-analysis model (Inverse Variance method) was used.
Additional file 4: Supplementary Figure 4. Forest plot of the comparison of alanine aminotransferase (excluding the study [20]) between the experimental and control group. Control group, RT alone group; Experimental group, RT plus ABMSC therapy; ABMSC, autologous bone marrow stem cell; RT, routing therapy. The random effects meta-analysis model (Inverse Variance method) was used.
Additional file 5: Supplementary Figure 5. Forest plot of the comparison of model for end-stage liver disease (excluding the study [20]) between the experimental and control group. Control group, RT alone group; Experimental group, RT plus ABMSC therapy; ABMSC, autologous bone marrow stem cell; RT, routing therapy. The fixed-effects meta-analysis model (Inverse Variance method) was used.
Abbreviations
- ABMSCs
Autologous bone marrow stem cells
- ALB
Serum albumin
- ALT
Alanine aminotransferase
- AST
Aspartate aminotransferase
- CHB
Chronic hepatitis B
- CI
Confidence interval
- CIV
Type IV collagen
- CNKI
National Knowledge Infrastructure
- HA
Hyaluronic acid
- HBV
Hepatitis B virus
- HBV-C
Hepatitis B virus-related cirrhosis
- IFN-α
Interferon-α
- LC
Liver cirrhosis
- LN
Laminin
- MD
Mean difference
- MELD
Model for end-stage liver disease
- NAs
Nucleotide analogs
- OR
Odds ratio
- PC III
Type III procollagen
- PRISMA
Preferred Reporting Items for Systematic Reviews and Meta-Analyses
- PT
Prothrombin time
- PTA
Prothrombin activity
- RT
Routine therapy
- TBIL
Total bilirubin
- VIP
Chinese Scientific Journal Database
Authors’ contributions
TX and AS contributed in the conception, design, statistical analysis, and drafting of the manuscript. AS and WG contributed in the data collection and manuscript drafting. TX supervised the study. All authors approved the final version for submission.
Funding
No funding was received for this study.
Availability of data and materials
Availability of data and materials can be assessed both in the “Material and methods” section and the “Results” section.
Ethics approval and consent to participate
Ethical approval and consent to participate were not necessary because this study was a meta-analysis.
Consent for publication
Not applicable.
Competing interests
The authors declare that they have no competing interests.
Footnotes
Publisher’s Note
Springer Nature remains neutral with regard to jurisdictional claims in published maps and institutional affiliations.
Supplementary information
Supplementary information accompanies this paper at 10.1186/s13287-020-01627-5.
References
- 1.Lun-Gen L. Antiviral therapy of liver cirrhosis related to hepatitis B virus infection. J Clin Transl Hepatol. 2014;2(3):197–201. doi: 10.14218/JCTH.2014.00022. [DOI] [PMC free article] [PubMed] [Google Scholar]
- 2.Peng L, Xie DY, Lin BL, et al. Autologous bone marrow mesenchymal stem cell transplantation in liver failure patients caused by hepatitis B: short-term and long-term outcomes. Hepatology. 2011;54(3):820–828. doi: 10.1002/hep.24434. [DOI] [PubMed] [Google Scholar]
- 3.Lavanchy D. Hepatitis B virus epidemiology, disease burden, treatment, and current and emerging prevention and control measures. J Viral Hepat. 2004;11(2):97–107. doi: 10.1046/j.1365-2893.2003.00487.x. [DOI] [PubMed] [Google Scholar]
- 4.Wang FY, Li B, Li Y, et al. Entecavir for patients with hepatitis B decompensated cirrhosis in China: a meta-analysis. Sci Rep. 2016;6:32722. doi: 10.1038/srep32722. [DOI] [PMC free article] [PubMed] [Google Scholar]
- 5.Hou J, Wang G, Wang F, et al. Guideline of prevention and treatment for chronic hepatitis B (2015 update) J Clin Transl Hepatol. 2017;5(4):297–318. doi: 10.14218/JCTH.2016.00019. [DOI] [PMC free article] [PubMed] [Google Scholar]
- 6.Chen GF, Wang C, Lau G. Treatment of chronic hepatitis B infection-2017. Liver Int. 2017;37(Suppl 1):59–66. doi: 10.1111/liv.13309. [DOI] [PubMed] [Google Scholar]
- 7.European Association for the Study of the Liver EASL clinical practice guidelines: management of chronic hepatitis B virus infection. J Hepatol. 2012;57(1):167–185. doi: 10.1016/j.jhep.2012.02.010. [DOI] [PubMed] [Google Scholar]
- 8.Chen EQ, Tang H. Optimization therapy for the treatment of chronic hepatitis B. World J Gastroenterol. 2014;20(19):5730–5736. doi: 10.3748/wjg.v20.i19.5730. [DOI] [PMC free article] [PubMed] [Google Scholar]
- 9.Chen EQ, Tang H. The current status of combination therapy of chronic hepatitis B. Eur Rev Med Pharmacol Sci. 2013;17(15):2023–2031. [PubMed] [Google Scholar]
- 10.Okada M, Enomoto M, Kawada N, Nguyen MH. Effects of antiviral therapy in patients with chronic hepatitis B and cirrhosis. Expert Rev Gastroenterol Hepatol. 2017;11(12):1095–1104. doi: 10.1080/17474124.2017.1361822. [DOI] [PubMed] [Google Scholar]
- 11.Kim JK, Kim SJ, Kim Y, et al. Long-term follow-up of patients after autologous bone marrow cell infusion for decompensated liver cirrhosis. Cell Transplant. 2017;26(6):1059–1066. doi: 10.3727/096368917X694778. [DOI] [PMC free article] [PubMed] [Google Scholar]
- 12.Mohamadnejad M, Vosough M, Moossavi S, et al. Intraportal infusion of bone marrow mononuclear or CD133+ cells in patients with decompensated cirrhosis: a double-blind randomized controlled trial. Stem Cells Transl Med. 2016;5(1):87–94. doi: 10.5966/sctm.2015-0004. [DOI] [PMC free article] [PubMed] [Google Scholar]
- 13.Suk KT, Yoon JH, Kim MY, et al. Transplantation with autologous bone marrow-derived mesenchymal stem cells for alcoholic cirrhosis: phase 2 trial. Hepatology. 2016;64(6):2185–2197. doi: 10.1002/hep.28693. [DOI] [PubMed] [Google Scholar]
- 14.Sharma M, Rao PN, Sasikala M, et al. Autologous mobilized peripheral blood CD34(+) cell infusion in non-viral decompensated liver cirrhosis. World J Gastroenterol. 2015;21(23):7264–7271. doi: 10.3748/wjg.v21.i23.7264. [DOI] [PMC free article] [PubMed] [Google Scholar]
- 15.Burganova GR. Effectiveness of autologous hematopoietic stem cells transplantation in patients with liver cirrhosis. Eksp Klin Gastroenterol. 2012;4:91–97. [PubMed] [Google Scholar]
- 16.Kumar A, Prasad M, Jali VP, et al. Bone marrow mononuclear cell therapy in ischaemic stroke: a systematic review. Acta Neurol Scand. 2017;135(5):496–506. doi: 10.1111/ane.12666. [DOI] [PubMed] [Google Scholar]
- 17.Saito T, Tomita K, Haga H, Okumoto K, Ueno Y. Bone marrow cell-based regenerative therapy for liver cirrhosis. World J Methodol. 2013;3(4):65–69. doi: 10.5662/wjm.v3.i4.65. [DOI] [PMC free article] [PubMed] [Google Scholar]
- 18.Margini C, Vukotic R, Brodosi L, Bernardi M, Andreone P. Bone marrow derived stem cells for the treatment of end-stage liver disease. World J Gastroenterol. 2014;20(27):9098–9105. doi: 10.3748/wjg.v20.i27.9098. [DOI] [PMC free article] [PubMed] [Google Scholar]
- 19.Liu L, Yan Y, Zhou J, et al. Curative effect of combined lamivudine, adefovir dipivoxil, and stem cell transplantation on decompensated hepatitis B cirrhosis. Genet Mol Res. 2014;13(4):9336–9342. doi: 10.4238/2014.February.21.13. [DOI] [PubMed] [Google Scholar]
- 20.Xu L, Gong Y, Wang B, et al. Randomized trial of autologous bone marrow mesenchymal stem cells transplantation for hepatitis B virus cirrhosis: regulation of Treg/Th17 cells. J Gastroenterol Hepatol. 2014;29(8):1620–1628. doi: 10.1111/jgh.12653. [DOI] [PubMed] [Google Scholar]
- 21.Zeng X, Zhang Y, Kwong JS, et al. The methodological quality assessment tools for preclinical and clinical studies, systematic review and meta-analysis, and clinical practice guideline: a systematic review. J Evid Based Med. 2015;8(1):2–10. doi: 10.1111/jebm.12141. [DOI] [PubMed] [Google Scholar]
- 22.Jackson D, White IR, Riley RD. Quantifying the impact of between-study heterogeneity in multivariate meta-analyses. Stat Med. 2012;31(29):3805–3820. doi: 10.1002/sim.5453. [DOI] [PMC free article] [PubMed] [Google Scholar]
- 23.Chen YS, Ouyang S, Cheng T, et al. Clinical efficacy of autologous bone marrow stem cell transplantation in treatment of hepatitis B patients with decompensated liver cirrhosis. J Clin Hepatol. 2013;16(2):116–118. [Google Scholar]
- 24.Cui YH. Clinical study of transplantation of autologous bone marrow stem cells combined with entecavir for hepatitis B patients with decompensated cirrhosis. Chin J Digest Med Imageol. 2015;5(3):11–15. [Google Scholar]
- 25.Hou CL, Shang JZ, Zhao LH, et al. The clinical research on autonomous bone marrow stem cells to treat decompensated cirrhosis. J Clin Hepatol. 2012;28(5):368–371. [Google Scholar]
- 26.Jiang R. Autologous bone marrow stem cell transplantation for treatment of decompensate liver cirrhosis. China J Modern Med. 2014;24(12):30–34. [Google Scholar]
- 27.Jin B, Meng FP, Feng Y, et al. Treatment with superselective hepatic artery infusion of autologous bone marrow stem cells in patients with HBV-related decompensated cirrhosis. Infect Dis Inf. 2011;24(3):143–146. [Google Scholar]
- 28.Mao H, Jin SQ, Huang CZ, Tang YL, Xie Y. Autologous bone marrow mesenchymal stem cell transplantation can improve the liver function of patients with decompensated cirrhosis caused by hepatitis B. Chin J Clinicians. 2013;7(8):3289–3293. [Google Scholar]
- 29.Wu YZ, Yang L, Zhai YF, Zhang HH, Huo LY. The application of autologous stem cell transplantation in the treatment of hepatitis B liver cirrhosis. Shandong Med J. 2017;57(2):66–69. [Google Scholar]
- 30.Liu JP. Calculation of clinical trials sample size. Chin J Integr Trad West Med. 2003;23(7):536–538. [Google Scholar]
- 31.Sang W, Lv B, Li K, Lu Y. Therapeutic efficacy and safety of umbilical cord mesenchymal stem cell transplantation for liver cirrhosis in Chinese population: a meta-analysis. Clin Res Hepatol Gastroenterol. 2017;42(3):193–204. doi: 10.1016/j.clinre.2017.11.003. [DOI] [PubMed] [Google Scholar]
- 32.Matsumoto T, Takami T, Sakaida I. Cell transplantation as a non-invasive strategy for treating liver fibrosis. Expert Rev Gastroenterol Hepatol. 2016;10(5):639–648. doi: 10.1586/17474124.2016.1134313. [DOI] [PubMed] [Google Scholar]
- 33.Eom YW, Kim G, Baik SK. Mesenchymal stem cell therapy for cirrhosis: present and future perspectives. World J Gastroenterol. 2015;21(36):10253–10261. doi: 10.3748/wjg.v21.i36.10253. [DOI] [PMC free article] [PubMed] [Google Scholar]
- 34.Wang T, Wang B, Liu X. Correlation of serum markers with fibrosis staging in chronic viral hepatitis. Chin J pathology. 1998;27(3):185–190. [PubMed] [Google Scholar]
- 35.Mohamadnejad M, Alimoghaddam K, Mohyeddin-Bonab M, et al. Phase I trial of autologous bone marrow mesenchymal stem cell transplantation in patients with decompensated liver cirrhosis. Arch Iran Med. 2007;10(4):459–466. [PubMed] [Google Scholar]
- 36.Terai S, Ishikawa T, Omori K, et al. Improved liver function in patients with liver cirrhosis after autologous bone marrow cell infusion therapy. Stem Cells. 2006;24(10):2292–2298. doi: 10.1634/stemcells.2005-0542. [DOI] [PubMed] [Google Scholar]
- 37.Kharaziha P, Hellstrom PM, Noorinayer B, et al. Improvement of liver function in liver cirrhosis patients after autologous mesenchymal stem cell injection: a phase I-II clinical trial. Eur J Gastroenterol Hepatol. 2009;21(10):1199–1205. doi: 10.1097/MEG.0b013e32832a1f6c. [DOI] [PubMed] [Google Scholar]
- 38.Saito T, Okumoto K, Haga H, et al. Potential therapeutic application of intravenous autologous bone marrow infusion in patients with alcoholic liver cirrhosis. Stem Cells Dev. 2011;20(9):1503–1510. doi: 10.1089/scd.2011.0074. [DOI] [PubMed] [Google Scholar]
- 39.Wu CX, Wang D, Cai Y, Luo AR, Sun H. Effect of autologous bone marrow stem cell therapy in patients with liver cirrhosis: a meta-analysis. J Clin Transl Hepatol. 2019;7(3):238–248. doi: 10.14218/JCTH.2019.00008. [DOI] [PMC free article] [PubMed] [Google Scholar]
Associated Data
This section collects any data citations, data availability statements, or supplementary materials included in this article.
Supplementary Materials
Additional file 1: Supplementary Figure 1. Forest plot of the comparison of percentage of total bilirubin (TBIL, A), albumin (ALB, B), alanine aminotransferase (ALT, C), aspartate aminotransferase (AST, D) and prothrombin time (PT, E) between the experimental and control group before therapy. Control group, RT alone group; Experimental group, RT plus ABMSC therapy; ABMSC, autologous bone marrow stem cell; RT, routing therapy. The fixed-effects meta-analysis model (Inverse Variance method) was used.
Additional file 2: Supplementary Figure 2. Forest plot of the comparison of serum liver fibrosis markers including hyaluronic acid (HA, A), laminin (LN, B), type III procollagen (PC III, C) and type IV collagen (CIV, D) between the experimental and control group before therapy. Control group, RT alone group; Experimental group, RT plus ABMSC therapy; ABMSC, autologous bone marrow stem cell; RT, routing therapy. The fixed-effects meta-analysis model (Inverse Variance method) was used.
Additional file 3: Supplementary Figure 3. Forest plot of the comparison of albumin (excluding the study [20]) between the experimental and control group. Control group, RT alone group; Experimental group, RT plus ABMSC therapy; ABMSC, autologous bone marrow stem cell; RT, routing therapy. The fixed-effects meta-analysis model (Inverse Variance method) was used.
Additional file 4: Supplementary Figure 4. Forest plot of the comparison of alanine aminotransferase (excluding the study [20]) between the experimental and control group. Control group, RT alone group; Experimental group, RT plus ABMSC therapy; ABMSC, autologous bone marrow stem cell; RT, routing therapy. The random effects meta-analysis model (Inverse Variance method) was used.
Additional file 5: Supplementary Figure 5. Forest plot of the comparison of model for end-stage liver disease (excluding the study [20]) between the experimental and control group. Control group, RT alone group; Experimental group, RT plus ABMSC therapy; ABMSC, autologous bone marrow stem cell; RT, routing therapy. The fixed-effects meta-analysis model (Inverse Variance method) was used.
Data Availability Statement
Availability of data and materials can be assessed both in the “Material and methods” section and the “Results” section.


