Abstract
Nasopharyngeal carcinoma (NPC) is a common cancer found in the nasopharynx with high metastatic and invasive nature. Increasing evidences have identified the critical role of gene therapy in NPC treatment. Hence, this study was designed to identify specific gene markers that affected NPC progression through gene expression profile analysis. NPC‐related gene expression data set gene set enrichment (GSE)53819 were retrieved and analyzed to screen out differentially expressed genes (DEGs), followed by determination of their expression in noncancerous tissues and NPC specimens. Next, weighted gene co‐expression network analysis (WGCNA) was conducted on DEGs to obtain tumor‐associated gene modules. Genes in those modules were intersected with DEGs for gene ontology and Kyoto Encyclopedia of Genes and Genomes functional enrichment analysis. Then protein‐protein interaction network of tumor‐associated genes was constructed to select genes most closely linked to NPC. Afterward, expression of chromosome 9 open reading frame 24 (c9orf24), primary ciliary dyskinesia protein 1 (PCDP1), and leucine‐rich repeat‐containing protein 46 (LRRC46) was detected in GSE53819 and further verified in GSE12452 and GSE64634. Differential analysis on GSE53819 found that 2,173 genes were aberrantly expressed in NPC, among which 917 genes are upregulated and 1,256 genes are downregulated. WGCNA showed that genes were enriched in 17 modules and 727 genes exhibited ectopic expression in NPC and enriched in cytokine‐cytokine receptor interaction, cytochrome P450, and chemical carcinogenesis signaling pathways, among which c9orf24, PCDP1, and LRRC46 were poorly expressed in NPC. Therefore, c9orf24, PCDP1, and LRRC46 might serve as prominent diagnostic markers for NPC, which presents new insights for NPC therapy.
Study Highlights.
WHAT IS THE CURRENT KNOWLEDGE ON THE TOPIC?
☑ Nasopharyngeal carcinoma (NPC) is a common cancer found in the nasopharynx with high metastatic and invasive nature. However, there are limited data regarding related genetic regulatory mechanisms in NPC.
WHAT QUESTION DID THIS STUDY ADDRESS?
☑ This study identified specific gene markers that affected NPC progression through gene expression profile analysis.
WHAT DOES THIS STUDY ADD TO OUR KNOWLEDGE?
☑ The use of chromosome 9 open reading frame 24 (c9orf24), primary ciliary dyskinesia protein 1 (PCDP1), and leucine‐rich repeat‐containing protein 46 (LRRC46) might serve as prominent diagnostic markers for NPC, which presents new insights for NPC therapy.
HOW MIGHT THIS CHANGE CLINICAL PHARMACOLOGY OR TRANSLATIONAL SCIENCE?
☑ This study provided theoretical basis for future clinical application of c9orf24, PCDP1, and LRRC46 in NPC treatment.
Nasopharyngeal carcinoma (NPC) is known as a unique kind of head and neck malignant tumor owing to its distinct clinical and pathological features, and geographic and ethnic distributions.1 NPC pathogenesis include many etiological factors, such as environmental factors, infection with Epstein Barr virus (EBV), as well as genetic susceptibility; the anatomic NPC position also serves as a microenvironmental factor in the pathogenesis of NPC.2, 3 NPC is epidemiologically characterized by different mortality and incidence rates caused by various factors, including sex, age, and geography.4 As a disease arising from epithelial cells on the nasopharynx surface, NPC is classified by the World Health Organization into keratinizing squamous cell carcinoma, nonkeratinizing differentiated carcinoma, as well as nonkeratinizing undifferentiated carcinoma.5 Besides, NPC is etiologically linked to the EBV and is frequently found in Asia and Southern China, accompanied by delayed diagnosis or consequent distant failure after concurrent chemoradiation in patients with this disease.6 Distant metastasis is also one of the reasons for a huge number of failed treatment in patients with NPC, particularly in those with advanced nodal disease at the very beginning.7 Moreover, the chemosensitive and radiosensitive natures of NPC add difficulty for the wide application of radiotherapy and multiple chemoradiotherapy methods in clinical practice.8, 9 Recently, as a novel therapy, gene therapy prevents or treats a disease by deliberately delivering genetic materials into cells of patients, which jointly works with traditional regimes to be applied in treatment of patients with metastatic, residual, and recurrent disease, including NPC.10 Yet, there are limited data regarding related genetic regulatory mechanisms in NPC. Therefore, a comprehensive analysis of genes as novel markers in NPC development is of great value.
Phosphoserine aminotransferase 1, an enzyme that is involved in serine biosynthesis, has been noted to be a potential prognostic biomarker and its higher expression is associated with a poor prognosis in NPC.11 Fibulin‐2, located on chromosome 3p25.1 and associated with tumor development through its interaction with the extracellular matrix proteins, has been identified as a candidate tumor‐suppressor gene in NPC.12 In addition, CDH4 was found to be a potential novel putative tumor‐suppressor gene that can be frequently and tumor‐specifically inactivated by its promoter methylation in NPC.13 WWOX gene alteration is an early genetic alteration and may contribute to tumorigenesis of NPC, thus WWOX is possibly an important prognostic marker in NPC.14 Existing data revealed the involvement of aberrant MTA1 and RECK expression in the invasion and metastasis of NPC, suggesting they may be good biomarkers for evaluating the cervical lymph node metastasis, recurrence, and prognosis of NPC.15 Given the former analyses, this study was expected to make contributions to identify more novel gene markers for NPC therapy with the aim to describe the disease processes and to diagnose the disease at an early stage in a reliable manner. Hence, the present study initially retrieved NPC‐related gene expression data sets using microarray‐based analysis and then conducted weighted gene co‐expression network analysis (WGCNA) analysis, Gene Ontology (GO), and Kyoto Encyclopedia of Genes and Genomes (KEGG) functional enrichment analysis, protein‐protein interaction (PPI) network analysis along with receiver operating characteristic (ROC) analysis to recognize the potential diagnostic markers for NPC.
Materials and Methods
NPC gene expression data set collection
Gene Expression Omnibus (GEO; https://www.ncbi.nlm.nih.gov/geo/), a public functional genomics data repository, supports Minimum Information About a Microarray Experiment‐compliant data submissions. After retrieval of array‐based and sequence‐based data, experiments and curated gene expression profiles were queried and downloaded with the help of tools. With “nasopharyngeal carcinoma” and “non‐cancerous” as key words, NPC‐related gene expression data set gene set enrichment (GSE)53819 was retrieved from this database, which included 18 NPC tissue specimens and 18 noncancerous tissue specimens. Among them, about one third were women. All specimens were obtained before subjected to anticancer treatment. The sequencing platform used was Agilent‐014850 Whole Human Genome Microarray 4 × 44K G4112F (Probe Name version Agilent Technologies, Santa Clara, CA).
Differential analysis of gene expression data set GSE53819
Based on the description of GSE53819, it was assigned into the NPC group and the control group. Next, “limma” and “impute” packages of R language were applied for differential analysis, with |logFC| > 2 and P value < 0.05 as the screening threshold. Then the “pheatmap” package was used to construct the expression heatmap of acquired differentially expressed genes (DEGs).
Construction of weighted gene co‐expression networks
WGCNA is a free and open R package for construction of gene co‐expression network.16 WGCNA could identify attractive gene modules from thousands of genes and retrieve NPC‐related key genes based on the correlation between gene expression profile and sample character through intramolecular connectivity and gene prominence. The above obtained gene expression data sets from GEO were used to establish this network. Three different ways could be utilized to construct network and identify modules according to various demands. In the present study, the one‐step method was used to achieve this purpose.
Interaction analysis of co‐expression modules
In order to evaluate the co‐expression similarity among different modules, characteristic adjacency degrees of correlation among each module were calculated. Interaction of different co‐expression modules was assessed by flashClust function,17 and the heatmap was constructed.
Functional enrichment analysis of NPC‐related genes
NPC‐related genes obtained from the WGCNA network and DEGs in NPC were intersected. The website (http://bioinformatics.psb.ugent.be/webtools/Venn/) constructed by Venn map was used for intersecting the obtained data. Afterward, functional enrichment analysis was conducted on intersected genes. Then the “clusterProfiler” package of R language was applied for KEGG enrichment analysis.18
PPI network construction
Genes ranking on the top list of each module were considered as central genes. Genes with a weight value > 0.45 in blue module were selected for PPI interaction analysis. Tools in Cytoscape software were used to calculate core degree value of each gene. In the whole network, the thickness of ligatures among genes represented weight value, and the color of genes referred to core degree value.
Gene expression verification
Another two independent NPC expression data sets, GSE12452 and GSE64634, were retrieved from the GEO database. The same methods were carried out for differential analysis on NPC specimens and noncancerous tissue specimens from those two expression data sets. A box plot was drawn based on expression of chromosome 9 open reading frame 24 (c9orf24), primary ciliary dyskinesia protein 1 (PCDP1), and leucine‐rich repeat‐containing protein 46 (LRRC46).
ROC analysis
Based on the expression of c9orf24, PCDP1, and LRRC46 in the expression data sets GSE53819, GSE12452, and GSE64634, the ROC curve was drawn using the “pROC” package (https://cran.r-project.org/web/packages/pROC/index.html) in R language in order to evaluate the accuracy of distinguishing disease state through gene expression.
Results
DEG analysis in NPC
The GEO database was utilized to obtain the NPC‐related expression data set GSE53819 that included 18 NPC specimens and 18 noncancerous tissue specimens. Next, with |logFC| > 1 and P value < 0.05 as the screening threshold, R language was used to analyze DEGs in those specimens, which acquired 2,173 DEGs (Figure 1 a). Among those DEGs, 917 genes were upregulated and 1,256 genes were downregulated in NPC specimens (Figure 1 b).
Figure 1.
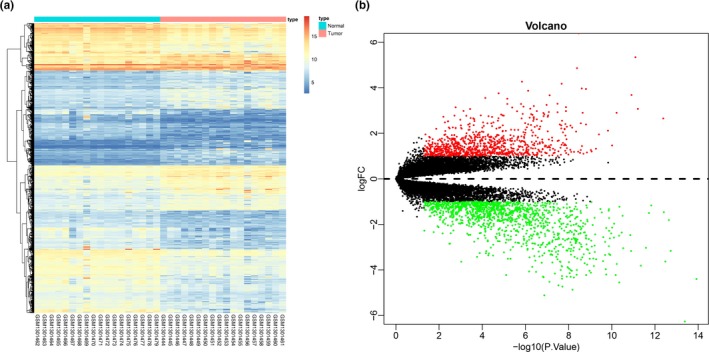
Analysis of DEGs in data set GSE53819. (a) The expression heatmap of DEGs in NPC. The abscissa represents the sample number, whereas the dendrogram in the left side represents gene expression cluster and the upper right histogram refers to color gradation. (b) The volcano map of DEGs. The abscissa indicates multiple of gene expression, and the ordinate indicates P value. Red dots represent up‐regulated genes in NPC, and green dots represent downregulated genes in NPC. DEG, differentially expressed gene; NPC, nasopharyngeal carcinoma.
Gene modules are obtained from WGCNA
Next, WGCNA analysis was conducted on gene expression data set GSE53819. The soft threshold power 6 was chosen to define the adjacency matrix based on the criterion of approximate scale‐free topology (Figure 2 a,b). the one‐step method was used to construct the network module, among which minModules size was set as 30, whereas deepSplit was set as default 2, and cut height was set as 0.25. Finally, all genes in GSE53819 were segmented into 17 different modules (Figure 2 c). Each module was given different colors. Turquoise included the most genes (980 genes), whereas light cyan contained the least genes (only 45 genes).
Figure 2.
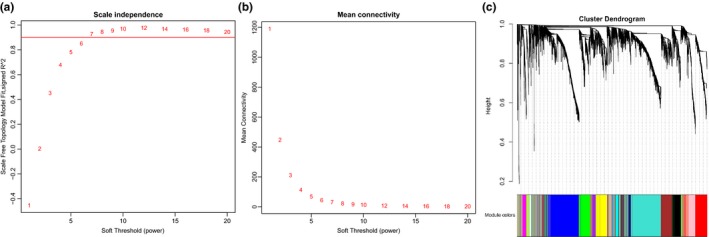
Weighted gene co‐expression network analysis analysis of gene expression data set GSE53819. (a,b) Network topology for different soft‐thresholding powers. Numbers in the plots represents the corresponding soft thresholding powers, and the approximate scale‐free topology can be acquired at the soft‐thresholding power of 6. (c) Gene dendrogram attained by clustering the difference on the basis of same topological overlap with the corresponding color row‐indicated module colors. Each color row indicates a color‐coded module including a group of highly connected genes. A total of 17 modules are identified.
NPC‐related modules are obtained
Interaction relationships of previously obtained 17 modules were analyzed, and the network heatmap was plotted (Figure 3 a). According to the results, the modules were highly independent from each other, and this high independence was also found in relative gene expression independence in each module. In addition, for the purpose of assessing similarity of high expression in each module, eigengene values of all modules was calculated, and cluster was carried out based on their correlation (Figure 3 b). It was found that those modules were mainly divided into three independent clusters. Similar results were also shown in module correlation heatmap (Figure 3 c). Additionally, the correlation between each module and clinical information of patients with NPC (tumor, sex, and age) was analyzed to further explore their relationship (Figure 3 d). The relationship between the tumor and each module drew our great attention. Among those 17 modules, obvious positive correlation was observed in two modules (blue and turquoise) and the tumor, whereas prominent negative correlation was shown in another two modules (pink and brown) and the tumor. Moreover, among those four modules associated with the tumor, the blue module displayed the most conspicuous correlation with the tumor, suggesting its critical role in tumor initiation.
Figure 3.
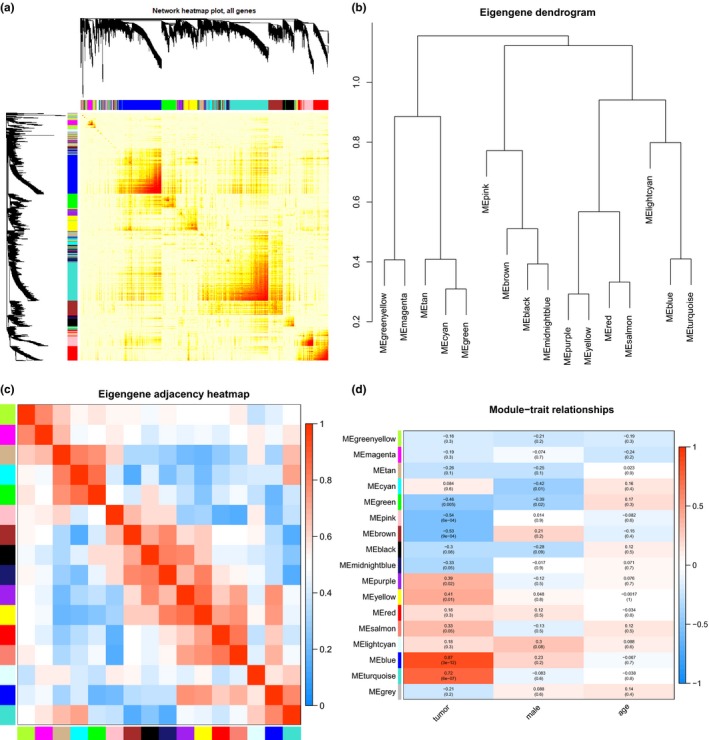
Correlation analysis of modules. (a) Interaction relationship analysis of co‐expression genes. Different colors of abscissa and ordinate refer to different modules. The brightness of yellow in the middle refers to the degree of connectivity of different modules. No significant difference is found regarding interactions among different modules, which suggests a high level of independence among those modules. (b) Cluster analysis in each module. (c) Correlation analysis in each module. Different colors of the abscissa and the ordinate represent different modules. Each rectangle represents the module correlation value, and the histogram in the right side represents color gradation. (d) The correlation between each module and clinical information. The abscissa refers to clinical information (tumor, sex, and age), and the ordinate refers to different modules. Each rectangle and value point to the correlation value between one module and one clinical information, and histogram in the right side represents color gradation.
NPC‐related DEGs are found in blue modules from WGCNA
In order to further acquire gene expression in tumor‐associated modules from MGCNA, 908 genes were extracted from the blue module, which were intersected with previously acquired DEGs in NPC (Figure 4). The results showed that among those genes, most genes (727 genes) were differentially expressed in NPC, suggesting higher reliability of tumor‐associated modules from MGCNA.
Figure 4.
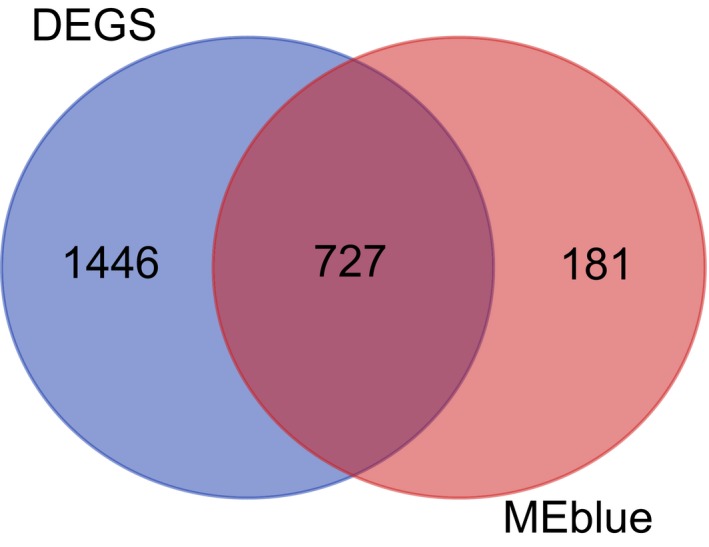
The intersection of nasopharyngeal carcinoma‐related DEGs and genes from the blue module. The circles in the left side represent DEGs, whereas those in the right side indicate genes from the blue module and the middle part points to their intersection. DEG, differentially expressed gene.
Functional enrichment analysis of tumor‐associated DEGs
Subsequently, functional enrichment analysis was conducted on the above‐mentioned 727 tumor‐associated DEGs for further analysis. GO could be assigned into biological process, cellular component, and molecular function. The results of GO functional enrichment analysis on those DEGs found that those genes were mainly enriched in items such as “cilium organization,” “ciliary part,” and “receptor ligand activity” (Figure 5 a–c). Meanwhile, KEGG enrichment analysis was performed on signaling pathways associated with those DEGs. The results displayed that those genes were mainly enriched in signal pathways, including “cytokine‐cytokine receptor interaction,” cytochrome P450 (“CYP450”), and “chemical carcinogenesis” (Figure 6). Therefore, the aforementioned GO items and signaling pathways might closely associate with the occurrence and progression of NPC.
Figure 5.
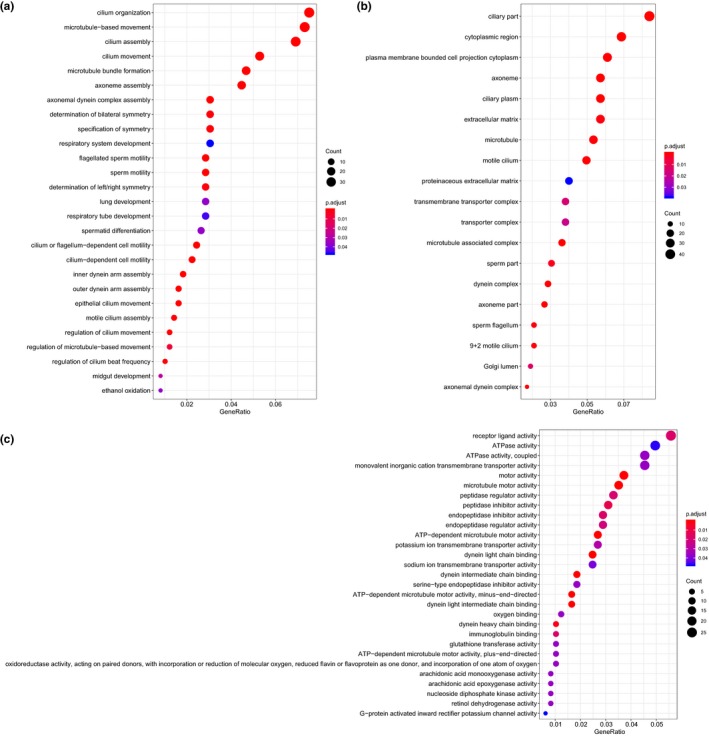
GO functional enrichment analysis of DEGs in nasopharyngeal carcinoma. (a–c) The enrichment results of biological process, cellular component, and molecular function by GO functional enrichment analysis. The abscissa represents GeneRatio, and the ordinate represents the item name. The histogram in the right side indicates color gradation. GO, gene ontology.
Figure 6.
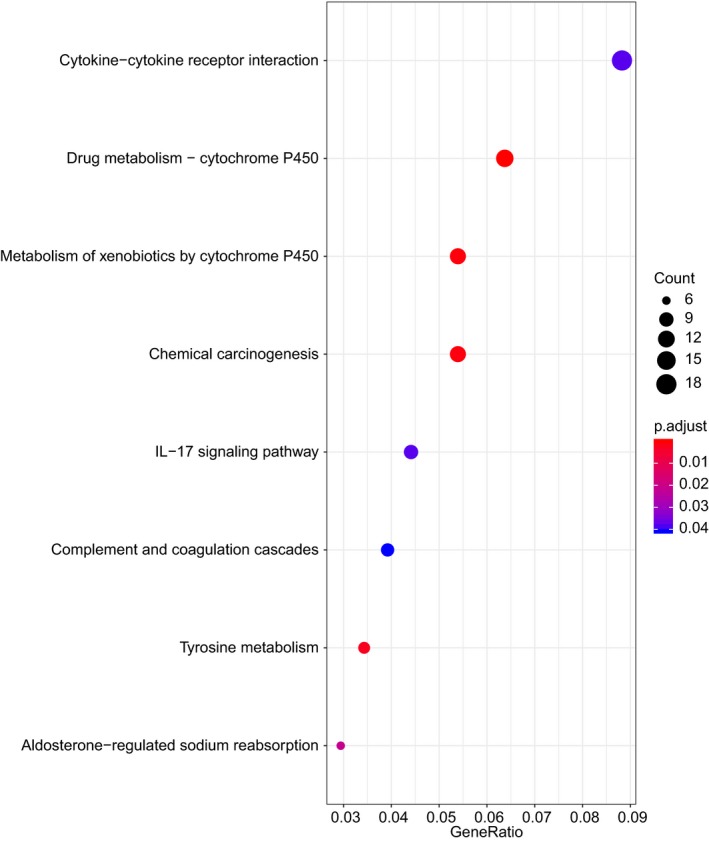
Kyoto Encyclopedia of Genes and Genomes enrichment analysis of signaling pathway associated with differentially expressed genes in nasopharyngeal carcinoma. The abscissa represents GeneRatio, and the ordinate represents the item name. The histogram in the right side indicates color gradation.
c9orf24, PCDP1, and LRRC46 might associate with the progression NPC
To figure out the pivotal genes in NPC, the weight values of all co‐expression genes were obtained from the blue module through WGCNA analysis. Next, to acquire most centrally located genes, all genes with a weight value > 0.45 were chosen to construct a PPI network and calculate the core degree of each gene in this network (Figure 7). The results showed that c9orf24, PCDP1, and LRRC46 were localized in the very center of the network, suggesting their co‐expression relationship with the rest of most genes in the blue module. Therefore, these findings demonstrated that c9orf24, PCDP1, and LRRC46 might play a vital role in NPC.
Figure 7.
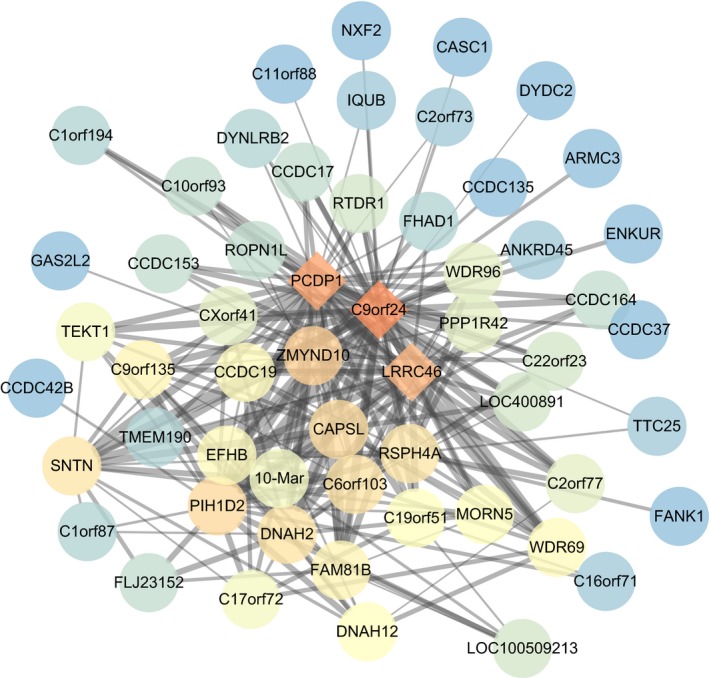
The PPI network of genes with a weight value > 0.45 in the blue module. Each circle represents a gene. Different colors indicate the core degree of genes in the PPI network, whereas darker color refers to higher core degree. The lines among genes represent the weight value between two gene, whereas bolder lines indicate higher weight value. PPI, protein‐protein interaction.
c9orf24, PCDP1, and LRRC46 might be the diagnostic markers for NPC therapy
At last, the expression of c9orf24, PCDP1, and LRRC46 was determined for further exploration of their effects on NPC. The detection in GSE53819 found that c9orf24, PCDP1, and LRRC46 were all poorly expressed in NPC specimens (P < 0.001; Figure S1A ). Next, to further verify this finding, another two independent NPC gene expression data sets GSE12452 (10 noncancerous tissue specimens and 31 NPC specimens) and GSE64634 (four noncancerous tissue specimens and 12 NPC specimens) were retrieved from the GEO database for determining the expression of c9orf24, PCDP1, and LRRC46. The results displayed that the expression of these three genes were downregulated in NPC specimens (P < 0.001; Figure S1B,C ). The aforementioned findings identified the critical roles of c9orf24, PCDP1, and LRRC46 as potential diagnostic markers in NPC.
c9orf24, PCDP1, and LRRC46 are diagnostic markers of NPC
In order to further verify the potentials of c9orf24, PCDP1, and LRRC46 as diagnostic markers of NPC, we conducted ROC analysis of these genes in the expression data set GSE53819 and drew the ROC curve (Figure S2A ). Results of ROC analysis revealed that the area under curve (AUC) values of c9orf24, PCDP1, and LRRC46 in the expression data set GSE53819 reached 0.956, 0.958, and 0.966, respectively, suggesting that these three genes had the potentials to serve as diagnostic markers of NPC. The AUC value of these genes, as combined diagnostic markers, was 0.963 (Figure S2B ), indicating that these three genes could jointly act as the marker for NPC diagnosis. Moreover, ROC analysis of these three genes in the expression data sets GSE12452 and GSE64634 showed that the AUC value of LRRC46 in GSE12452 was 0.85 and the AUC values of c9orf24 and PCDP1 were > 0.9 (Figure S2C,D ). These findings demonstrate that c9orf24, PCDP1, and LRRC46 could function as diagnostic markers of NPC.
Discussion
NPC is characterized as a type of EBV‐associated cancer and is also featured by distinctive population and geographic differences regarding incidence rates.19 Although local control has achieved remarkable progresses in this disease, successful treatment outcome of metastatic NPC is impeded by distant failure and satisfactory local control with least late toxicity, particularly for cancers with intracranial invasion.20 Recently, target therapy, less toxic, and more effective chemotherapy modality and new technology present promising insights for NPC therapy.21 Among them, gene therapy has received great attention for its increasing potential as a novel treatment method for the management of NPC.10 Therefore, our study comprehensively investigated the novel gene markers in NPC. Collectively, based on differential analysis of NPC gene expression data sets and the implementation of a series of analyses on DEGs, our study provided evidences that c9orf24, PCDP1, and LRRC46 might serve as important markers for NPC.
Initially, we retrieved and analyzed NPC‐related gene expression data sets (GSE53819, GSE12452, and GSE64634) to screen out DEGs, and determined their expression in noncancerous tissues and NPC specimens. Then we constructed a PPI network of NPC‐related DEGs to select those most closely associated with NPC. According to the results of differential analysis on obtained DEGs, c9orf24, PCDP1, and LRRC46 all displayed poor expression in NPC. The c9orf24 is primarily defined as a representative gene dysregulated in cDNA libraries and secreted from normal bronchial and asthmatic biopsies, and its expression is closely linked to ciliated epithelial cells both in nasal and bronchial tissues.22 The c9orf24 also serves as a functional protein to exert its effect to work with manchette proteins.23 More recently, literature has emerged providing findings that mRNA expression of c9orf24 is prominently decreased in specimens with maturation delay at the level of primary spermatocytes and round spermatids and its protein expression is totally absent in spermatid specimens exhibiting few elongating spermatids.24 Besides, the C9orf11 gene is localized between the recently recognized markers 942F10R and 286E19A in an area continually absent in various human malignancies.25 Meanwhile, the C9orf72 gene has been found to display a decreased expression in patients with frontotemporal dementia and amyotrophic lateral sclerosis.26 The loss of the C9orf64 gene has been detected in some cases of acute myeloid leukemia.27 PCDP1, also known as the calmodulin‐binding protein FAP221, is one of the calmodulin‐interacting complexes anchored to the axoneme, which promotes generation of wild‐type ciliary motility by regulating the activity of dynein isoforms.28 The novel ciliary protein PCDP1 has been found missing in primary ciliary dyskinesia in mice, which leads to primary ciliary dyskinesia phenotypes of respiratory ciliary dysfunction, male infertility, and hydrocephalus.29 The expression of PCDP1 shows a decline in Chlamydomonas reinhardtii (C. reinhardtii), and its absence causes severe motility impairment, including changed waveforms, significantly decreased beat frequency, uncoordinated bends, and failed assembly of the C1d central pair projection.30 LRRs, a kind of motif with the length of 20−29 amino acids, are expressed in multiple cytoplasmic and membrane proteins and regulates communication among proteins.31 LRRC3B has been reported to exhibit a reduced expression in most primary gastric tumors relative to noncancerous tissues.32 Moreover, the median LRRC17 expression is obviously downregulated in subjects with any osteoporotic fracture, vertebral fractures, and nonvertebral fractures in contrast to respective nonfracture controls.33 In addition, the leucine‐rich repeat kinase 2 depletion leads to apoptotic cell death, α‐synuclein accumulation, and protein degradation pathway damage in aged mice.34 Ge et al.35 performed a systematic bioinformatics analysis to retrieve the NPC‐related DEGs from GSE12452 and found the DEGs were closely associated with many cellular processes of NPC, including cell cycle and immune response metabolic process of DNA. Moreover, the study conducted by Wang et al.36 revealed that GSE12452 from the GEO database included 31 NPC samples and 10 normal samples and highlighted MAD2L1, CCNB1, PCNA, ALDH1A1, and MUC1 as the genes that were correlated with NPC. In addition, the DEGs retrieved from the expression data sets (GSE12452 and GSE13597) and hub genes identified from PPI were reported to highly participate in biological processes of NPC and these molecular factors could improve the understanding of the underlying mechanism of NPC, thus providing novel insights into the diagnosis and treatment of NPC.37 Similarly, Jiang et al.38 used the expression data set GSE12452 to investigate the underlying mechanism of NPC and highlighted the DEGs (PTGS2, FN1, CXCL9, CXCL10, ZIC2, and OVOL1) as potential therapeutic targets for NPC.
Besides, tumor‐associated gene modules were attained after WGCNA analysis was performed on DEGs, and genes retrieved in those modules were intersected with DEGs for GO and KEGG functional enrichment analysis. The results demonstrated that 727 DEGs in the blue module were enriched in cytokine‐cytokine receptor interaction, CYP450, and chemical carcinogenesis signaling pathways, which suggested that these signaling pathways might be closely associated with occurrence and progression of NPC. The extracellular interactions of helical cytokines with their receptors exert a regulatory effect on target cell specificity, potency, and affinity, and the intracellular signaling of cytokines, such as JAK/STAT and AKT/ERK pathways, has received great attention.39 Morales et al.40 have revealed that metastasis‐related genes in a primary tumor are enriched in cytokine‐cytokine receptor interaction‐associated or immune infiltration‐associated pathways. Hepatic CYP450 can be repressed and/or induced by various N‐substituted azoles, which associates with the metabolism of exogenous and endogenous compounds that can cause metabolic activation to carcinogenic or toxic metabolites.41 CYP450 expression affects abnormal cell growth, apoptosis, and the cell cycle to interfere tumor initiation and progression through multiple signal‐transduction pathways.42 Chemical carcinogenesis is similar to genotoxicity, which leads to chromosomal dysfunction, genetic mutations, and DNA damage, and epigenetic monitoring of the signaling networks during chemical carcinogenesis is vital for early detection and regulation of tumor progression.43 All in all, these findings proved our result that cytokine‐cytokine receptor interaction, CYP450, and chemical carcinogenesis signaling pathways might be involved in the occurrence and progression of NPC.
Taken together, our study demonstrates that c9orf24, PCDP1, and LRRC46 are identified as potential gene markers for NPC through a series analyses, including microarray‐based analysis, WGCNA analysis, GO and KEGG functional enrichment analyses, and PPI network analysis along with ROC analysis. Previously, has‐miR‐615‐3p and MCM4 were identified to serve as new biomarkers for NPC via gene expression profiles GSE12452 (31 NPC and 10 normal samples) and GSE53819 (18 NPC and 18 normal samples), as well as miRNA expression profiles GSE32960 (312 NPC and 18 normal samples) and GSE36682 (62 NPC and six normal samples) obtained from the GEO database.44 Additionally, RBM24 is demonstrated to be a tumor suppressor in NPC after retrieval of the mRNA expression profiles from two data sets GSE12452 and GSE53819.45 By contrast, in our study, the differentially expressed genes c9orf24, PCDP1, and LRRC46 related to NPC were retrieved in the data set GSE53819 were only comprised of 18 NPC and 18 normal samples. Therefore, c9orf24, PCDP1, and LRRC46 are not the only key genes related to NPC, and further studies are needed to compare the efficacy of these genes above. Moreover, the clinical efficacy of c9orf24, PCDP1, and LRRC46 will need to be assessed in current and future clinical trials. Besides, further research will develop gene therapy with improved antitumor potency, with clinical efficacy as conjunctive contemporary methods of radiotherapy and chemotherapy. Longer term goals of NPC treatment personalized to the individual patient's cancer genotype remains the ultimate aim of cancer gene therapy.
Funding
This research is funded partly by the Natural Science Foundation of Jilin Province (20190201212JC), International Cooperation Project from Science and Technology Department of Jilin Province (No. 20180414054GH), Bethune Project of Jilin University (470110000669), Medical Talent Project from Finance Department of Jilin Province (2019SCZT012).
Conflict of Interest
The authors declared no competing interests for this work.
Authors' Contributions
K.X., C.S.J., and C.B.X. wrote the manuscript. K.X. and J.F.C. designed the research. Y.N.W. and X.Z. performed the research. D.Y. analyzed the data. K.X. and C.B.X. contributed new reagents/analytical tools.
Supporting information
Figure S1. c9orf24, PCDP1, and LRRC46 are poorly expressed in NPC.
Figure S2. c9orf24, PCDP1, and LRRC46 function as markers for NPC diagnosis.
Acknowledgments
The authors thank the reviewers for their helpful comments.
Contributor Information
Dan Yu, Email: yudan19792003@sina.com.
Chengbi Xu, Email: xuxuchengbi@126.com.
References
- 1. Li, X.H. et al An inflammatory biomarker‐based nomogram to predict prognosis of patients with nasopharyngeal carcinoma: an analysis of a prospective study. Cancer Med. 6, 310–319 (2017). [DOI] [PMC free article] [PubMed] [Google Scholar]
- 2. Chou, J. et al Nasopharyngeal carcinoma – review of the molecular mechanisms of tumorigenesis. Head Neck 30, 946–963 (2008). [DOI] [PMC free article] [PubMed] [Google Scholar]
- 3. Tsao, S.W. et al Etiological factors of nasopharyngeal carcinoma. Oral Oncol. 50, 330–338 (2014). [DOI] [PubMed] [Google Scholar]
- 4. Wei, K.R. et al Nasopharyngeal carcinoma incidence and mortality in China, 2013. Chin. J. Cancer 36, 90 (2017). [DOI] [PMC free article] [PubMed] [Google Scholar]
- 5. Kamran, S.C. , Riaz, N. & Lee, N. Nasopharyngeal carcinoma. Surg. Oncol. Clin. N. Am. 24, 547–561 (2015). [DOI] [PubMed] [Google Scholar]
- 6. Ma, B.B.Y. , Hui, E.P. & Chan, A.T.C. Investigational drugs for nasopharyngeal carcinoma. Expert Opin. Investig. Drugs 26, 677–685 (2017). [DOI] [PubMed] [Google Scholar]
- 7. Chee, J. et al Prognostic stratification of patients with metastatic nasopharyngeal carcinoma using a clinical and biochemical scoring system. J. Cancer Res. Clin. Oncol. 143, 2563–2570 (2017). [DOI] [PubMed] [Google Scholar]
- 8. Xu, C. et al Chemoradiotherapy versus radiotherapy alone in stage II nasopharyngeal carcinoma: a systemic review and meta‐analysis of 2138 patients. J. Cancer 8, 287–297 (2017). [DOI] [PMC free article] [PubMed] [Google Scholar]
- 9. Chan, A.T. Nasopharyngeal carcinoma. Ann. Oncol. 21(suppl. 7), vii308–vii312 (2010). [DOI] [PubMed] [Google Scholar]
- 10. Hughes, J. , Alusi, G. & Wang, Y. Gene therapy and nasopharyngeal carcinoma. Rhinology 50, 115–121 (2012). [DOI] [PubMed] [Google Scholar]
- 11. Liao, K.M. et al Overexpression of the PSAT1 gene in nasopharyngeal carcinoma is an indicator of poor prognosis. J. Cancer 7, 1088–1094 (2016). [DOI] [PMC free article] [PubMed] [Google Scholar]
- 12. Law, E.W. et al Anti‐angiogenic and tumor‐suppressive roles of candidate tumor‐suppressor gene, Fibulin‐2, in nasopharyngeal carcinoma. Oncogene 31, 728–738 (2012). [DOI] [PubMed] [Google Scholar]
- 13. Du, C. et al CDH4 as a novel putative tumor suppressor gene epigenetically silenced by promoter hypermethylation in nasopharyngeal carcinoma. Cancer Lett. 309, 54–61 (2011). [DOI] [PubMed] [Google Scholar]
- 14. Yang, Z. et al Molecular alterations of the WWOX gene in nasopharyngeal carcinoma. Neoplasma 61, 170–176 (2014). [DOI] [PubMed] [Google Scholar]
- 15. Deng, Y. , Zhou, D. & Zeng, L. [Expression and significance of MTA1 and RECK gene in nasopharyngeal carcinoma]. Lin Chung Er Bi Yan Hou Tou Jing Wai Ke Za Zhi 25, 534–538 (2011) [in Chinese]. [PubMed] [Google Scholar]
- 16. Dean, C.B. & Nielsen, J.D. Generalized linear mixed models: a review and some extensions. Lifetime Data Anal. 13, 497–512 (2007). [DOI] [PubMed] [Google Scholar]
- 17. Langfelder, P. & Horvath, S. Fast R functions for robust correlations and hierarchical clustering. J. Stat. Softw. 46, i11 (2012). [PMC free article] [PubMed] [Google Scholar]
- 18. Yu, G. et al clusterProfiler: an R package for comparing biological themes among gene clusters. OMICS 16, 284–287 (2012). [DOI] [PMC free article] [PubMed] [Google Scholar]
- 19. Yoshizaki, T. et al Current understanding and management of nasopharyngeal carcinoma. Auris Nasus Larynx 39, 137–144 (2012). [DOI] [PubMed] [Google Scholar]
- 20. Lee, A.W. et al Management of nasopharyngeal carcinoma: current practice and future perspective. J. Clin. Oncol. 33, 3356–3364 (2015). [DOI] [PubMed] [Google Scholar]
- 21. Zhang, L. et al Emerging treatment options for nasopharyngeal carcinoma. Drug Des. Devel. Ther. 7, 37–52 (2013). [DOI] [PMC free article] [PubMed] [Google Scholar]
- 22. Haitchi, H.M. et al Chronological expression of ciliated bronchial epithelium 1 during pulmonary development. Eur. Respir. J. 33, 1095–1104 (2009). [DOI] [PubMed] [Google Scholar]
- 23. Matsuoka, Y. et al Isolation and characterization of the spermatid‐specific Smrp1 gene encoding a novel manchette protein. Mol. Reprod. Dev. 75, 967–975 (2008). [DOI] [PubMed] [Google Scholar]
- 24. Pleuger, C. et al Expression of ciliated bronchial epithelium 1 during human spermatogenesis. Fertil. Steril. 108, 47–54 (2017). [DOI] [PubMed] [Google Scholar]
- 25. Ruiz, A. , Pujana, M.A. & Estivill, X. Isolation and characterisation of a novel human gene (C9orf11) on chromosome 9p21, a region frequently deleted in human cancer. Biochim. Biophys. Acta 1517, 128–134 (2000). [DOI] [PubMed] [Google Scholar]
- 26. Todd, T.W. & Petrucelli, L. Insights into the pathogenic mechanisms of chromosome 9 open reading frame 72 (C9orf72) repeat expansions. J. Neurochem. 138 (suppl. 1), 145–162 (2016). [DOI] [PubMed] [Google Scholar]
- 27. Ohi, Y. et al Incomplete DNA methylation underlies a transcriptional memory of somatic cells in human iPS cells. Nat. Cell Biol. 13, 541–549 (2011). [DOI] [PMC free article] [PubMed] [Google Scholar]
- 28. DiPetrillo, C.G. & Smith, E.F. The Pcdp1 complex coordinates the activity of dynein isoforms to produce wild‐type ciliary motility. Mol. Biol. Cell 22, 4527–4538 (2011). [DOI] [PMC free article] [PubMed] [Google Scholar]
- 29. Lee, L. et al Primary ciliary dyskinesia in mice lacking the novel ciliary protein Pcdp1. Mol. Cell. Biol. 28, 949–957 (2008). [DOI] [PMC free article] [PubMed] [Google Scholar]
- 30. DiPetrillo, C.G. & Smith, E.F. Pcdp1 is a central apparatus protein that binds Ca(2+)‐calmodulin and regulates ciliary motility. J. Cell Biol. 189, 601–612 (2010). [DOI] [PMC free article] [PubMed] [Google Scholar]
- 31. Ko, J. & Kim, E. Leucine‐rich repeat proteins of synapses. J. Neurosci. Res. 85, 2824–2832 (2007). [DOI] [PubMed] [Google Scholar]
- 32. Kim, M. et al LRRC3B, encoding a leucine‐rich repeat‐containing protein, is a putative tumor suppressor gene in gastric cancer. Cancer Res. 68, 7147–7155 (2008). [DOI] [PubMed] [Google Scholar]
- 33. Hong, N. et al Low plasma level of leucine‐rich repeat‐containing 17 (LRRc17) is an independent and additive risk factor for osteoporotic fractures in postmenopausal women. J. Bone Miner. Res. 31, 2106–2114 (2016). [DOI] [PubMed] [Google Scholar]
- 34. Tong, Y. et al Loss of leucine‐rich repeat kinase 2 causes impairment of protein degradation pathways, accumulation of alpha‐synuclein, and apoptotic cell death in aged mice. Proc. Natl. Acad. Sci. USA 107, 9879–9884 (2010). [DOI] [PMC free article] [PubMed] [Google Scholar]
- 35. Ge, Y. et al The identification of key genes in nasopharyngeal carcinoma by bioinformatics analysis of high‐throughput data. Mol. Biol. Rep. 46, 2829–2840 (2019). [DOI] [PubMed] [Google Scholar]
- 36. Wang, J. et al Identification of genes involved in Epstein‐Barr virus‐associated nasopharyngeal carcinoma. Oncol. Lett. 12, 2375–2380 (2016). [DOI] [PMC free article] [PubMed] [Google Scholar]
- 37. Chen, F. et al Identification of genes and pathways in nasopharyngeal carcinoma by bioinformatics analysis. Oncotarget 8, 63738–63749 (2017). [DOI] [PMC free article] [PubMed] [Google Scholar]
- 38. Jiang, X. et al Identification of key genes involved in nasopharyngeal carcinoma. Braz. J. Otorhinolaryngol. 83, 670–676 (2017). [DOI] [PMC free article] [PubMed] [Google Scholar]
- 39. Spangler, J.B. et al Insights into cytokine‐receptor interactions from cytokine engineering. Annu. Rev. Immunol. 33, 139–167 (2015). [DOI] [PMC free article] [PubMed] [Google Scholar]
- 40. Morales, M. et al Tumor‐stroma interactions a trademark for metastasis. Breast 20 (suppl. 3), S50–S55 (2011). [DOI] [PubMed] [Google Scholar]
- 41. Abdel Megeed, R.M. et al Modulation of Cyp450, ALS1 and COX‐2 signaling pathways induced by Candida albicans infection via novel antifungal agents. Saudi Pharm. J. 26, 349–357 (2018). [DOI] [PMC free article] [PubMed] [Google Scholar]
- 42. Nebert, D.W. & Dalton, T.P. The role of cytochrome P450 enzymes in endogenous signalling pathways and environmental carcinogenesis. Nat. Rev. Cancer 6, 947–960 (2006). [DOI] [PubMed] [Google Scholar]
- 43. Tommasi, S. et al Epigenetic targeting of the Nanog pathway and signaling networks during chemical carcinogenesis. Carcinogenesis 35, 1726–1736 (2014). [DOI] [PubMed] [Google Scholar]
- 44. Chen, J. et al Candidate pathways and genes for nasopharyngeal carcinoma based on bioinformatics study. Int. J. Clin. Exp. Pathol. 8, 2026–2032 (2015). [PMC free article] [PubMed] [Google Scholar]
- 45. Hua, W.F. et al RBM24 suppresses cancer progression by upregulating miR‐25 to target MALAT1 in nasopharyngeal carcinoma. Cell Death Dis. 7, e2352 (2016). [DOI] [PMC free article] [PubMed] [Google Scholar]
Associated Data
This section collects any data citations, data availability statements, or supplementary materials included in this article.
Supplementary Materials
Figure S1. c9orf24, PCDP1, and LRRC46 are poorly expressed in NPC.
Figure S2. c9orf24, PCDP1, and LRRC46 function as markers for NPC diagnosis.


